1. Introduction
In order to meet a variety of societal and ecological needs more trees are being retained within harvested areas in some areas of the Pacific Northwest of North America and elsewhere using the variable retention approach [
1]. The variable retention (VR) system is a recent example of a silvicultural approach where trees are left either singly or in groups using dispersed or aggregated retention [
2]. Variable retention is relatively new [
3] so there has been little systematic data collected on the impacts of the increased tree and forest edge on the growth of the regenerating trees. Franklin
et al. [
4] hypothesized that dispersed retention will reduce regeneration growth more than aggregated retention, because for a given level of retention dispersed retention leaves more forest edge than aggregated retention. The purpose of this paper is to examine the level of retention at which dispersed trees affect the growth of regenerating Douglas-fir (
Pseudotsuga menziessi (Mirb.) Franco) in coastal British Columbia, Canada. The hypothesis tested is what is the level of dispersed retention that significantly impacts the growth and survival of young, planted Douglas-fir at an operational scale?
Until recently, due to a lack of data, studies examining growth impacts have utilized historical retrospectives [
5,
6] or modeling [
7,
8]. Generally these studies showed a negative impact of leaving residual trees. At the MASS (Montane Alternative Silvicultural Systems) experiment in coastal BC, Mitchell
et al. [
9] found a significant reduction in 10-year post-planting height and stem volume growth in western hemlock (
Tsuga heterophylla (Raf.) Sarg.) and amabilis fir (
Abies amabilis Douglas ex J. Forbes) at 30% dispersed basal area retention, compared to 5% and 0% dispersed retention. Maguire
et al. [
10] synthesized six DEMO (Demonstration of Ecosystem Management Options) sites in western Oregon and Washington, USA and found that there was no difference in mortality for planted Douglas-fir after four to five years of growth when comparing 15% and 40% dispersed basal area retention (there was no clearcut); however, height growth was significantly reduced under 40% dispersed retention. Other recent studies have focused on growth within group selection openings or gaps [
11,
12] rather than dispersed or aggregated retention.
As a result of the adoption of variable retention in some areas of public land in coastal BC in the late 1990’s a series of large, operational size experiments were implemented as part of an adaptive management and monitoring (AMM) endeavor [
13,
14]. These experiments were designed to examine different approaches to stand-level retention. As part of this program, three dispersed retention experimental sites were established and planted with Douglas-fir to examine long-term growth response. Due to the lack of data as mentioned above we present early results from these three linked sites.
2. Methods
Three sites of naturally regenerated second-growth Douglas-fir growing on generally flat topography were selected for the study areas (
Table 1). Sites were broadly similar in age, tree species composition and ecosystem classification. The areas were mainly mesic sites in the Coastal Western Hemlock dry maritime (CWHdm) biogeoclimatic subzone [
15]. All three areas were chosen within 10 km of each other near Powell River, BC on public land:
(1) TM188, a 141.5 ha block partitioned into 4 approximately equal areas and randomly assigned one of four treatments: 5%, 10% and 30% dispersed retention by basal area and a clearcut.
(2) TM128, a 28.6 ha block partitioned into three approximately equal areas and assigned at random either 5% or 15% dispersed retention by basal area or a clearcut.
(3) LL55, a 10 ha block partitioned into three approximately equal areas and assigned at random either 5% or 15% dispersed retention by basal area or a clearcut. It proved difficult to duplicate the scale of TM188 so that TM128 and LL55 were established on smaller, but still operationally representative blocks.
Table 1.
Stand description prior to harvest, 2001–2002. Site index is based on Bruce [
16].
Table 1.
Stand description prior to harvest, 2001–2002. Site index is based on Bruce [16].
| | Basal area (m2 ha−1) | Site index | Age in 2001, (1.3 m, years) | Quadratic diameter (cm) | Stems ha−1 | Dom. height, (m) | Latitude | Longitude | Elev (m) |
|---|
| TM188 | 49.0 | 39 | 71 | 43.0 | 333 | 45 | 49.9111 | 124.3132 | 192 |
| TM128 | 73.0 | 39 | 130 | 76.9 | 276 | 58 | 49.8473 | 124.4042 | 271 |
| LL55 | 50.5 | 38 | 77 | 44.9 | 318 | 49 | 49.8202 | 124.2662 | 160 |
As part of the management rationale for the experimental sites, five percent dispersed tree retention was arbitrarily set as the minimum retention needed to maintain some forest structure on site [
17], while 15% dispersed retention was considered by expert opinion a minimum for the provision of sufficient habitat for maintaining some forest organisms [
14]. Fifteen percent is also the minimum retention level for the U.S. Forest Service Northwest Forest Plan [
18,
19]. Thus, the focus for the smaller sites (TM128, LL55) was at the minimum for structure (5%) and habitat (15%) while the larger site (TM188, part of a series of different Adaptive Management and Monitoring (AMM) retention experiments) considered a wider range of dispersed retention: 5%, 10% and 30%. The goal was to monitor changes in a large treatment unit representative of operational conditions rather than small research plots [
20]. All sites were inventoried prior to harvest at an intensity of one variable (prism) plot per hectare to establish pre-harvest basal area for all trees over 12 cm diameter at 1.3 m height (
Table 1). The prescription was to leave the largest wind-firm Douglas-fir trees at the targets of 5%, 10%, 15% and 30% of original basal area per hectare. In the 10%, 15% and 30% retention trees were left in dispersed small groups rather than a uniformly dispersed pattern. The dispersed small group design improved safety while meeting the working definition of dispersed retention which was to have no more than two co-dominant tree lengths between trees [
2].
The 5% dispersed retention objective was met by leaving six to eight well dispersed Douglas-fir trees per hectare with a single tree at each location. Inter-tree or tree-clump spacing was approximately constant per site and ranged from an average of 32 m at TM128 to 37 m at both TM188 and TM128 (
Table 2). At 10% retention the same tree spacing was maintained as the 5% treatment but two trees were left at each location. The progression was repeated for 15% retention (3 trees), and 30% retention (6 to 8 trees).
Figure 1 illustrates this layout at TM188.
The sites were harvested in the winter of 2001–2002 using hand-falling and hoe-forwarders in the sampled areas. TM128 and TM188 were planted in March of 2002, while LL55 was planted in March of 2003. At each site the same seed-source nursery stock (Douglas-fir, 1-year-old transplants) were planted at 1200 to 1400 stems per hectare throughout each block. All planted trees at all sites were caged with 1m tall fence-gauge wire in the spring of 2003 to prevent elk (Cervus elaphus roosevelti Merriam) browsing. The cages were moved up to a height of 1.5 m as the trees grew.
Table 2.
Retained tree statistics after harvest at planting and last measurement 1.
Table 2.
Retained tree statistics after harvest at planting and last measurement 1.
| | BA goal % | Distance between groups (m) | Trees per group | Dq cm, start | BA% start | BA% end | BA (m2 ha−1) start | BA (m2 ha−1 ) end | Stems ha−1 start | Stems ha−1 end |
|---|
| TM188 | 5 | 37 | 1 | 65 | 5 | 3 | 2.4 | 1.5 | 7.2 | 3.9 |
| 10 | 38 | 2 | 68 | 10 | 6 | 5.1 | 3.1 | 14.1 | 7.1 |
| 30 | 36 | 7 | 63 | 29 | 28 | 14.0 | 13.7 | 45.1 | 37.2 |
| TM128 | 5 | 32 | 1 | 68 | 8 | 6 | 6.0 | 4.4 | 16.7 | 10.8 |
| 15 | 32 | 3 | 66 | 16 | 13 | 11.5 | 9.5 | 33.9 | 25.9 |
| LL55 | 5 | 37 | 1 | 63 | 5 | 5 | 2.7 | 2.3 | 8.6 | 6.6 |
| 15 | 37 | 3 | 53 | 14 | 13 | 6.9 | 6.6 | 31.7 | 27.2 |
Figure 1.
Aerial photograph of TM188 showing sector plots (black triangles) by percent basal area retention treatment. The ‘dots’ on the plots show the pivot-point. The sample area at TM188 was 2.24 ha in 26 plots excluding the uncut.
Figure 1.
Aerial photograph of TM188 showing sector plots (black triangles) by percent basal area retention treatment. The ‘dots’ on the plots show the pivot-point. The sample area at TM188 was 2.24 ha in 26 plots excluding the uncut.
To monitor planted tree growth, “sector plots” were established at each site [
21]. Sector plots were designed specifically to be used at these and other AMM experimental sites [
13]. Following Iles and Smith [
21], a two-stage sampling approach was used. In the first stage each treatment area was divided on a map into approximate 1ha polygons that tessellated each treatment, utilizing roads and permanent features as part of the boundary, where possible. In the second stage a sub-set of the 1ha polygons was randomly chosen for sector plot sampling (six at TM188 in each treatment and eight in the control; three in each treatment and control at TM128 and four in each treatment and control at LL55). Sector plots were established by: (1) selecting a “pivot-point” approximately in the centre of each 1 ha polygon; (2) determining a random orientation angle for each polygon, and; (3) extending each plot to the edge of the polygon or external surround. For a given sector angle the probability of tree selection is equal to the sector angle divided by 360 degrees [
21]. The sector plot angles were 54° (a 15% tree sample) for the treatments at TM188, 27° at TM128 and 36° at LL55 while the sector plot angles were 36° in the clearcut at TM188. Generally a standard sector angle for the AMM experiments was 36° (10%); a larger angle was selected where funding permitted. Generally we tried to get approximately 100 trees in each plot. There were four plots per treatment at LL55, three at each treatment for TM128 and six in each treatment and eight in the clearcut at TM188. The ideal treatment number was six but time and resources limited the number that could be established at the other sites. Note that the “replicates” per treatment were averaged during the analysis (see
Figure 1).
The TM188 sector plots were established prior to harvest and all stems over 7.5 cm at 1.3 m height were measured for height and diameter. Site index was recorded by measuring a dominant tree in each plot. This was done before harvest at TM188 and after harvest at TM128 and LL55. All residual leave trees in the treatment area after harvest were tagged and measured for dbh and height; this comprised 1642 trees at TM188, 393 trees at TM128 and 118 trees at LL55 (
Table 2). The planted trees in the sector plots were measured for total height, basal diameter at just above ground level or basal swell (2 cm), and any damage or pathogens. Trees were measured at planting, at the end of the first year and at five years for TM128 and TM188 and at planting, after the first, and at six years for LL55. At last measurement TM188 contained 2.24 ha in 26 sector plots comprising 2196 surviving planted trees; TM128 contained 1.34 ha in 18 sector plots comprising 778 planted trees; and LL55 contained 1.1 ha in 12 sector plots comprising 1062 planted trees (
Table 2). The uncut control at TM188 was not used in these analyses.
Data on percent transmitted sunlight modeled for the growing season was made using digital fish-eye photography at TM188. A Nikon Coolpix 990 digital camera and a Nikon FC-E8 fisheye converter were placed on a tripod at 1.3m above the ground. Images were analyzed with the software, Gap Light Analyzer 2.0 (GLA) [
22] using a standard uniform overcast (UOC) sky model. Digital fisheye photographs were taken at the pivot-point and every 10m along the center-line of each sector-plot under uniformly overcast skies in the fall of 2003. In total there were 203 fisheye photographs taken at TM188 or approximately 8 fisheyes per plot. For light simulation purposes the growing season was defined as April 15 to August 31 and 50% diffuse light was assumed.
The basic null hypothesis tested in this paper was that all levels of dispersed retention treatment (5%, 10%, 15% and 30%) were insignificantly different from the clearcut in terms of planted seedling basal diameter, height and survival five-to-six years after planting. In order to undertake the analyses all three sites were combined and analyzed as an incomplete randomized block design with sites as blocks and retention amount as treatments. The design was incomplete because while two of the blocks had the same three treatments (0%, 5% and 15% at TM128 and LL55) one block (TM188) had four treatments (0%, 5%, 10% and 30%) the later two of which were not found in the other blocks. We analyzed the data as a linear mixed model using restricted maximum likelihood (REML): this approach can account for the incomplete unbalanced design [
23]. Mixed models accommodate both random and fixed effects: the classical completely randomized block design has fixed effects at both blocks and treatments. For our study the blocks were treated as random in the sense that each block was a random sample of a population of effects. The analysis was carried out as random in blocks with the fixed treatments “nested” in blocks and plots random (or averaged) in treatments. Essentially there were 10 “observations” (2 blocks with 3 treatments and one block with 4 treatments) with replicates averaged in each treatment. We used a linear mixed effects model using R [
24]. An ANOVA F-test analysis on the mixed model output was used to examine the significance of the treatments compared to the clearcut in terms of height, basal diameter and mortality proportion. If there was a significant overall treatment effect then we examined the linear mixed effects model to determine the significance of each of the treatments compared to the clearcut. We set α = 0.05 for all tests to be significant. In order for the REML to hold, normality of the data is assumed [
23]. In addition, for a valid analysis of incomplete (missing in some blocks) treatments a similar or homogenous variance among treatment groups is also assumed [
23]. These assumptions were tested in the Results section.
The planted trees at the three sites had not reached crown-closure so there was no density dependant mortality [
25]. Similarly, there was minimal brush competition as sites were planted immediately following logging and any competing hardwoods were manually removed regularly between and at each measurement. Thus height and diameter growth could be related directly to levels of retention and not to any understory brush or natural regeneration competition. One sector plot in the LL55 clearcut area was established next to a north and east facing intact forest edge. Due to both excessive shading and windthrow among the edge trees damaging the planted trees, this plot was dropped from the analyses. This left 46 plots in total. As LL55 was one year older at measurement than TM188 and TM128 (7 years from seed versus 6, respectively), height, diameter and mortality values were reduced proportionately.
3. Results
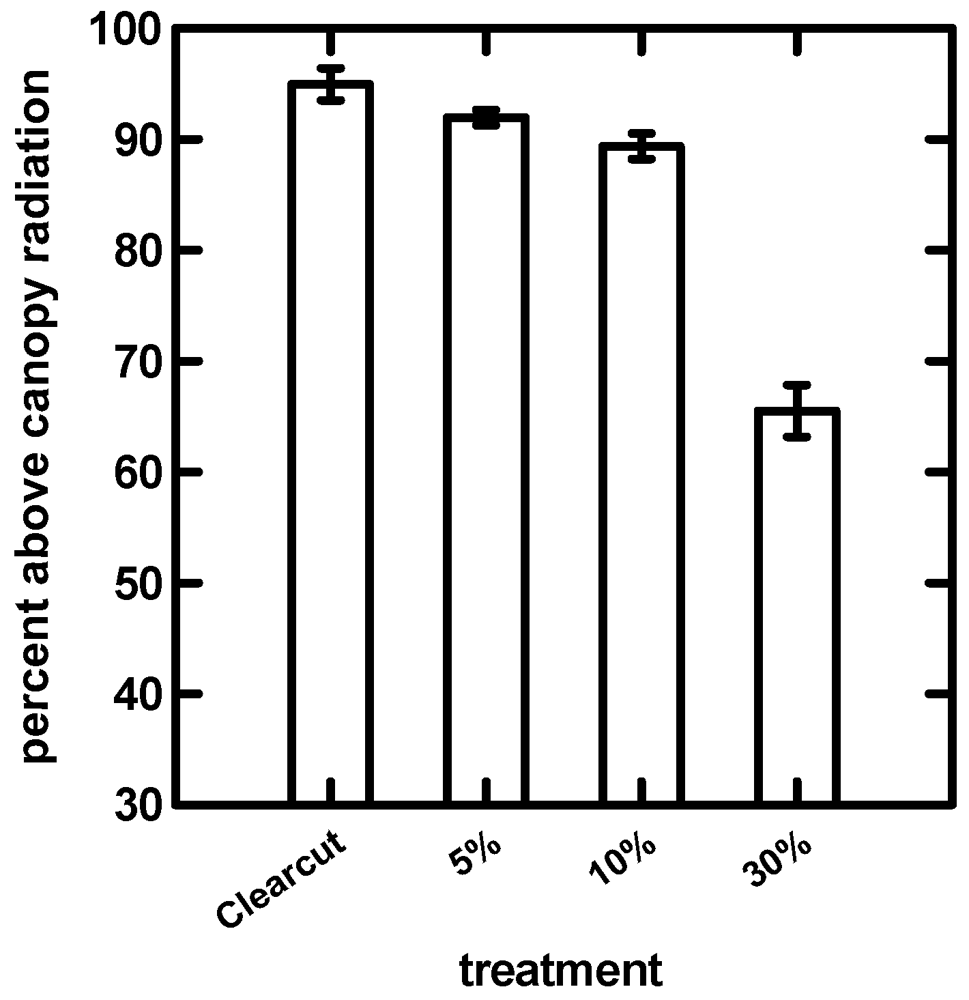
The average fisheye derived estimates of percent-above-crown-radiation (
PACR) for TM188 are compared in
Figure 2. The clearcut, 5% and 10% retention treatments received over 90% full radiation and were very similar to the clearcut. The 30% retention treatment received approximately 65%
PACR and was considerably lower than the clearcut.
Figure 2.
Digital fisheye photograph derived percent above canopy light for TM188. Error bars represent one standard error (to approximately convert to standard deviations multiply by 2.5).
Figure 2.
Digital fisheye photograph derived percent above canopy light for TM188. Error bars represent one standard error (to approximately convert to standard deviations multiply by 2.5).
The levels of basal area retention among the original or retained trees across all three sites were compared at the start and the end of the measurements (
Table 2 and
Figure 3). After 5 to 6 years and averaged for all sites, approximately 25% of trees or 15% of the basal area was lost to windthrow. The lower levels of retention were subject to relatively higher relative windthrow: a 26% overall reduction of the basal area for 5% retention, a 20% overall reduction in basal area for 10% to 15% retention and a 2% overall reduction in basal area at 30% retention.
Figure 3.
Depiction of basal area retention at start and last measurement averaged across all three sites (A complete enumeration of all trees in the population was made).
Figure 3.
Depiction of basal area retention at start and last measurement averaged across all three sites (A complete enumeration of all trees in the population was made).
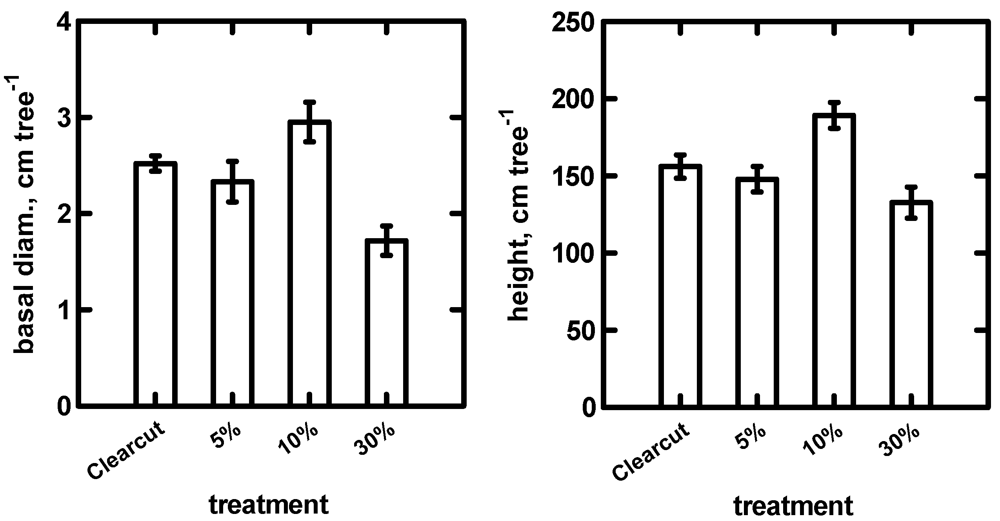
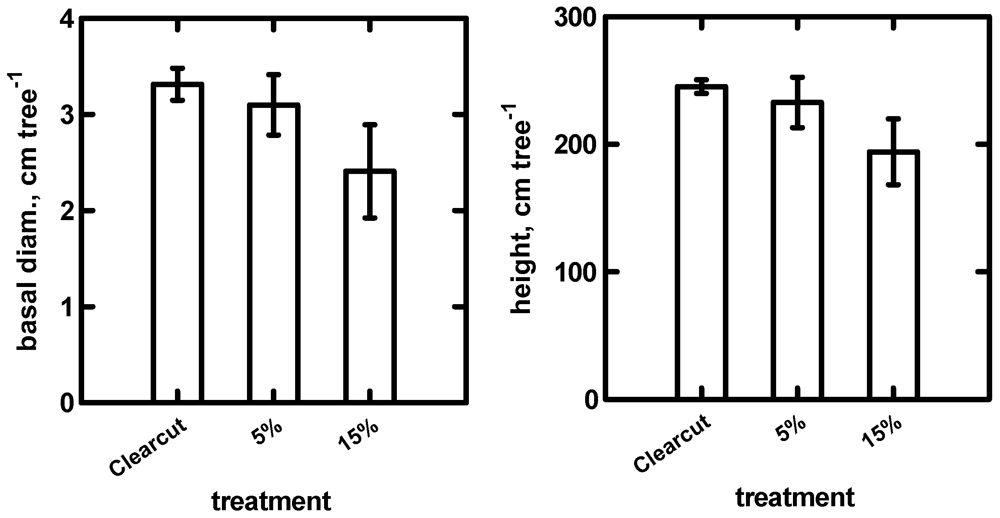
Figure 4 compares height and basal diameter five years after planting at TM188. It can be seen that the 10% treatment occurred on a slightly higher site (site index 40.2 compared to 38.7 in the other dispersed treatments). A covariance analysis was not undertaken as it was assumed that this was part of the site-to-site variability and there were insufficient degrees of freedom (df). Trees appeared to show greater basal diameter reduction than height reduction with increased dispersed basal area, consistent with the reduction in light levels seen in
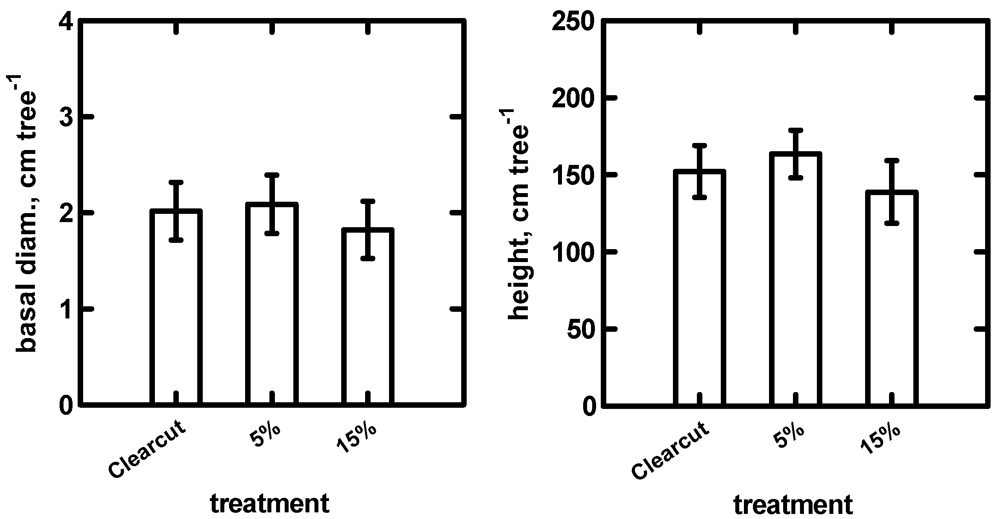
Figure 2. This observation was supported by examining height-diameter rations (HDR) which ranged from 84 at 30% retention to 67 in the clearcut. Similar reductions in height and diameter were observed at TM128 (
Figure 5) and LL55 (
Figure 6).
Figure 4.
TM188 Douglas-fir basal diameter and height five years after planting for 0%, 5%, 10% and 30% dispersed retention. Mean site index was: 38.6 (5%); 40.1 (10%); 38.7 (30%): 38.7 (Clearcut) at 50 years at 1.3 m. Error bars represent one standard error (to convert to standard deviations multiply by 2.5).
Figure 5.
TM128 Douglas-fir basal diameter and height five years after planting for 0%, 5% and 15% dispersed retention. Mean site index was 39 across all treatments. Error bars represent one standard error (to convert to standard deviations multiply by 1.7).
Figure 5.
TM128 Douglas-fir basal diameter and height five years after planting for 0%, 5% and 15% dispersed retention. Mean site index was 39 across all treatments. Error bars represent one standard error (to convert to standard deviations multiply by 1.7).
Figure 6.
LL55 Douglas-fir basal diameter and height six years after planting for 0%, 5% and 15% dispersed retention. Mean site index was 38 across all treatments. Error bars represent one standard error (to convert to standard deviations multiply by 2).
Figure 6.
LL55 Douglas-fir basal diameter and height six years after planting for 0%, 5% and 15% dispersed retention. Mean site index was 38 across all treatments. Error bars represent one standard error (to convert to standard deviations multiply by 2).
There was considerable variability in mortality within and between sites (
Figure 7). Mortality was highest at TM128 and lowest at LL55 but the amount of retention did not appear to have any noticeable bearing except for slightly higher apparent levels in the clearcut. Microsite and initial establishment differences appeared to override any impact the retained trees had on survival at this early stage in stand development prior to crown closure and inter-tree competition.
In order to satisfy the mixed model REML requirement of normality the large number of surviving planted seedlings sampled (n = 3963 across 4.6 ha of plots) or substantial numbers per plot is supportive. There were an average 86 tree per plot (71 to 101 trees per plot using 95% confidence limits). A normal probability plot for the 46 plots also showed no obvious non-normality. In addition the trees per plot (TPP) count was approximately constant across treatments (clear cut: 88 TTP; 5%: 88 TPP; 10%: 96 TPP; 15%: 74 TPP and 30%: 79 TPP) suggesting a reasonable balance between plots.
Figure 7.
Douglas-fir mortality from 2002–2006 for TM188 and TM128 and 2003–2008 for LL55. Mortality is the proportion of original planted tree dying in the period. Error bars represent one standard error (to convert to standard deviations multiply TM188 by 2.5, TM128 by 1.7 and LL55 by 2).
Figure 7.
Douglas-fir mortality from 2002–2006 for TM188 and TM128 and 2003–2008 for LL55. Mortality is the proportion of original planted tree dying in the period. Error bars represent one standard error (to convert to standard deviations multiply TM188 by 2.5, TM128 by 1.7 and LL55 by 2).
In order to examine the homogeneity of variance among treatment groups the standard deviation of height, basal diameter and mortality per plot was compared across all plots and across treatments. Across all plots the mean standard deviation (SD) and its standard deviation for height was 52+/−9; for basal diameter was 0.81+/−0.16; and for mortality was 0.36+/−0.09. Plot SD was examined graphically across plots and was essentially flat or constant for all three variables. These analyses suggest support for our assumption of homogenous variance among groups.
For the combined mixed model analysis there was no significant treatment effect of dispersed retention level on height growth (p = 0.0594) and mortality (p = 0.2015). There was however a significant treatment effect on basal diameter growth (p = 0.0422). An examination of the individual treatments for basal diameter from the linear mixed model showed that only the 30% dispersed retention treatment had a lower basal diameter growth compared to the clearcut (p = 0.0283). The other treatments were insignificantly different from the clearcut.
4. Discussion
Although there were discernible reductions in height and basal diameter at higher retention levels at all sites, and noticeable experimental variability, the differences were only significant for basal diameter at 30% retention. Under reduced light trees put energy into maintaining height growth at the expense of diameter growth. This is partly a “shade-avoidance” mechanism controlled by plant phytochrome and a reduction of red: far-red light in the shade [
26,
27]. As growth is a function of diameter and height we conclude a reduction of growth at the 30% retention level compared to the clearcut. We expected an intermediate growth impact between the clearcut and the other lower retention levels but were unable to demonstrate this due to the low power of the test. The levels of dispersed retention had no apparent effect on seedling survival which appeared to be largely determined by microsite basis differences. Maguire
et al. [
10] also found statistically significant impacts on planted Douglas-fir tree growth at levels of dispersed basal retention of 40% compared to 15%, which is consistent with our findings. Light levels at TM188 were similar in the clearcut, 5% and 10% retention with lower light levels in the 30% retention (
Figure 2). Heithecker and Halpern [
28] showed for the DEMO sites analyzed by Maguire
et al. [
10] that at 15% retention the microclimatic conditions were generally similar to clearcuts. The DEMO sites lacked a true clearcut experimental area for comparison: nearby areas in the 15% aggregated retention were used. Mitchell
et al. [
9] found that 10-years growth of western hemlock and amabilis fir was reduced at 30% retention but not 5% retention compared to a clearcut. Similarly, Mitchell
et al. [
9] did not have a replicated clearcut (a single, adjacent clearcut was harvested at the same time as the replicated treatments). Lam and Maguire [
29] examined levels of initial basal area that might affect young Douglas-fir growth under shelterwood with reserves and group selection compared to clearcut with reserves in the College of Forestry Integrated Research Project (CFIRP), Oregon. They determined that a residual overstory with less than 18 m
2 ha
−1 basal area allowed establishment, growth, and continued survival of Douglas-fir regeneration during the 13 years following harvest.
The 5% dispersed retention trees at TM188, TM128 and LL55 were uniformly distributed (
Table 2). The 10%, 15% and 30% dispersed treatments kept the same spacing as the 5% but trees were grouped at two, three and six-to-eight trees, respectively. This grouping was done for cost reduction as the treatment areas were significant and for safety reasons because the trees were large in size (up to 45 m tall). Concentrating the trees at higher retention levels may have increased total area light levels and reduced below-ground competition between planted and leave trees compared to a more uniform dispersal pattern [
30]. Thus we would expect that under a uniform dispersed treatment the impact on planted tree growth would be higher.
There was significant wind damage among the residual dispersed trees-mainly uprooting, and to a lesser extent stem break and leaning-over the first 5 to 6 years after planting. Higher relative residual tree windthrow occurred at lower retention levels (
Table 2,
Figure 3) partly due to greater shelter from the higher number of trees (e.g., [
31]). Basal area growth did not make up for basal area loss to wind damage so leave tree competitive effects on planted trees generally decreased. At TM188 for instance (
Table 2) 40% of basal area was lost over the course of the experiment in the 5% and 10% treatments but only 2% of basal area was lost at 30% retention. Significant competitive basal area still remained, however ranging from 1.5 m
2 ha
−1 to 4.4 m
2 ha
−1at 5% retention. Moore [
32] reviewed wind damage in four variable retention studies in the Pacific Northwest within a few years after harvest. The highest wind damage occurred at the MASS old-growth site [
33,
34]; 29% of stems in the 5% retention treatments and 10% of trees in the 30% retention treatments were wind damaged 6 years after harvest. Thus windthrow and wind damage soon after treatment will likely reduce residual basal area and this will reduce impacts on tree growth.
Monserud [
20] outlined issues concerned with large scale experimental plot analysis including cost (e.g., U.S. $12 million at DEMO) and difficulties in replicating blocks across sites [
10,
35]. The high cost is only likely to be borne by government or cooperatives and not private industry. It is logistically challenging to increase the number of sites or blocks simultaneously so that, for instance, a 5 year comparison of growth at two sites might entail comparing different sets of years. Also, the combined analysis will have to wait until the data from the last block to be established is measured. Similarly, large experiments are expensive to measure, which can lead to irregular measurement periods or possible delays in harvest if funding is not available. However large scale experimental studies are required to help understand new or novel manipulations of habitat required to sustain natural intact plant and animal populations and forest structure [
19].
The question of statistical power is also important especially in respect to hypothesis testing. The DEMO study in Oregon and Washington, USA has 36 replicates (6 blocks and 6 treatments per block (uncut, 15% dispersed, 40% dispersed, 15%, 40% and 70% aggregated)) although there was no dedicated clearcut control [
19]. The MASS study in BC Canada has three levels of VR treatment, an uncut and clearcut control yet the uncut control and clearcut were not truly randomized in the design [
9,
20]. The Silvicultural Options for Young-growth Douglas-fir Forests Capitol Forest Study (CFS) in Washington, USA [
35,
36,
37] has 18 treatment replicates (3 blocks and 6 treatments (shelterwood, clearcut, small patch cut, group selection, extended rotation and uncut). However comparisons are between silvicultural systems rather than levels of treatment, for instance there is only one dispersed tree level, a shelterwood. With the large scale experiments it is virtually impossible to examine more than a few options whether silvicultural or VR systems or retention levels within systems. In this study there were only 10 replicates (2 blocks with three treatments and one block with four treatments) but several levels of dispersed retention were compared to a clearcut. Thus this study does not have the statistical power of the DEMO or CFS studies. However, each block had the same planted tree species and harvesting system improving generalizations. The level of precision could have been improved by including more blocks or more treatments but because of substantial cost this was not an option. The conclusions from this study are illustrative however and potentially add to the body of literature on large scale silvicultural experiments designed to examine the growth impacts of VR on tree growth. Analyses suggested that it was only at higher levels of retention that young planted Douglas-fir growth impacts could be discerned given inherent variability and the statistical power of the tests. For practical purposes accepting a higher significance level (e.g., α = 0.2) has been suggested [
20]. The study also highlights some of the difficulties in examining the consequences of large scale VR treatments on the growth of the next crop including logistics, cost and statistical design and analysis.


