1. Introduction
Wildfires occurrences and intensity have increased dramatically over the last few decades [
1]. Major wildfires became headline news across the United States due to the devastating threats posed to human life, homes, buildings, timber, and other natural resources. Wildfire occurrence is somewhat predictable and can be influenced by many factors, such as meteorological conditions, fuel loads, topography, and vegetation dynamics [
2]. While these factors have been shown to be accurate predictors of wildfire, increasing human population densities could also be a contributing factor to wildfire occurrence [
3].
Considering its size and population, South Carolina has one of the highest rates of wildfire occurrence in the nation, averaging 3,000 fires annually that burn approximately 8,094 forested ha with fires averaging approximately three ha [
4]. From 2000 to 2010 South Carolina had a 15.3 percent increase in human population; the state’s population is approaching five million people [
5]. This population increase results in urban and suburban development becoming more common on undeveloped lands. These lands hold the greatest risk for wildfire. This population increase on recently undeveloped lands results in an equal increase in the number of homes and buildings potentially threatened by wildfire [
4].
Improvements in technology are aiding in the control and management of human impact on the environment. Developments in areas such as communications and spatial and modeling technologies have resulted in significant changes in the way wildfires are perceived and managed [
6]. These new technologies even allow for analysis of increasingly important socioeconomic factors related to increasing population that impact wildfire occurrence. Understanding how fires are produced in built-up areas near and within fire prone landscapes requires evaluating and quantifying the roles that humans play in fire regimes [
7].
Wildfires occur daily, although days with the right parameters may increase the occurrence of wildfires dramatically [
8]. The goal of this study was to determine different wildfire occurrence patterns using the National Fire Danger Rating System (NFDRS) weather data and corresponding socioeconomic factors that may be related to increased wildfire activity during certain seasons or types of days. Identification of these factors will allow state forestry commission personnel to adjust policies to better guide decisions on the allocation of wildfire fighting resources. Perhaps this planning process may identify areas where wildfire occurrence may be higher by identifying human related factors that seem to influence the occurrence of wildfires in South Carolina.
2. Literature Review
The relationship of wildfire occurrence to physical and social factors is a widely-researched topic. Usually the factors that contribute to wildfire occurrence are based on meteorological data [
8,
9,
10,
11] and physical indices from fire-danger rating systems [
12,
13,
14]. Fire-danger rating systems are the basis of costly wildfire presuppression activities, like aircraft fire detection flights and prepositioning of firefighting assets [
15]. All aspects of a wildfire are costly, including prediction, preparation, firefighting, property loss, and ecological damage. Accurate and timely forecasting of wildfire occurrence can reduce these costs [
16].
Federal and state agencies throughout the United States use the NFDRS to assess fire danger conditions. The NFDRS is based on models that represent the relationships between various factors such as fuels, weather, and topography and their impact on fire conditions. This serves as a system to process outputs for analyzing data, making predictions, sharing data between entities, and storing data for historic references [
17]. Fire danger rating systems are basically climatology based systems and indexes are most meaningful when compared with historical values. Associating historical fire activity with indexes provides information to assess the effectiveness of an index [
18].
Physical attributes of the forest are the most common nonmeteorological factors used to predict wildlife occurrence. Many are based on fires index variables like time of day fire ignited [
19], initial spread index [
14], fuel source, and vegetative type [
20], and topography [
21]. Others are based on more general forest attributes like land cover and land ownership [
22], spatial pattern of ignition [
23], vegetative pattern [
24], and cultivated area [
25]. Fire rating systems do include socio-economic and human factors, but the current fire danger rating systems tend to minimize social variables in predicting wildfire occurrence [
26].
Mapping fuel characteristics can be helpful to land managers on a large scale because they can be used to compute fire hazards, risk, and behavior. They can also be used in land management to help with decisions in order to respond more rapidly to wildfires. Because of the canopy enclosure, diverse fuel types, and the fuel bed complexity, fuel mapping can become a very difficult and complex procedure. While these maps will help managers in predicting outcomes for wildfires, technology that bypasses the forest canopy and focuses on the ground complexity is needed for more accurate fuel mapping [
27].
Using weather as a predictor for wildfire occurrence is complex. An intense thunderstorm season may be predicted, but exactly where these storms are going to hit is another question. Plus, the topography of the land plays a major role in influencing storm conditions on the ground. On complex terrains, downburst winds seem to channel causing the wind speeds and directions to enhance making wildfires spread rapidly [
28]. Using data such as weather and topography and finding these patterns that could possibly cause the rapid spread of fire could help in preventing devastating fires.
Table 1.
Wildfires by cause in South Carolina [
29].
Table 1.
Wildfires by cause in South Carolina [29].
| Wildfire Causes | Percent |
|---|
| Lighting | 2 |
| Campfires | 1 to 3 |
| Smoking | 3 to 4 |
| Debris burning | 35 to 45 |
| Woods arson | 25 to 30 |
| Equipment use | 5 |
| Railroad | 1 to 2 |
| Children activities | 3 to 5 |
| Miscellaneous | 4 to 6 |
The primary causes of wildfires in South Carolina have been documented by the state forestry commission (
Table 1) [
29]. Since approximately 98 percent of these wildfires were related to human causes, incorporating socio-economic variables into spatial models will perhaps allow for improved predictions of wildfire occurrence. Wildfire occurrence models that included social factors considered factors like human influences [
30], forest fragmentation [
31], the wildland-urban interface [
31], altering natural fire regimes [
32], and human fuel treatments [
33]. Geographic information systems (GIS) have frequently been used to analyze and predict wildfire occurrence [
33,
34,
35]. Combinations of GIS and wildfire occurrence pattern analyses that stress human and social factors are limited, but do exist [
23,
31,
33,
34,
35,
36,
37,
38]. This research builds on those analyses to better identify social and human factors that impact wildfire occurrence.
Various socioeconomic variables have been examined as possible factors used to predict wildfires. At the county level, population and poverty were found to be positively related to annual wildfire area, while unemployment was negatively related to ignitions and area. Poverty is found to be negatively related to wildfire ignitions, while the number of police is correlated with fewer ignitions [
7]. These results found in the previous studies suggest that managers and decision makers should be aware of socio-economic variables and consider them in their wildland fire management decisions.
3. Methods
Professional foresters conducting prescribed fires are a rare source of wildfire occurrences because they operate under a set of parameters that minimize the likelihood of a wildfire and protect their own safety. Two of the most important variables that affect wildfire occurrence are relative humidity and the Keech-Bryam Drought index (KBDI) [
39]. The KDBI is a measure of a hundredth of an inch of water in the subsurface of the ground horizon and is based on the assumption that soil has a maximum storage capacity of 8 inches (20.3 cm). In most cases it is found in the A horizon of the soil profile and has a range from 0 to 800 with 0 being saturated and 800 being the worst drought conditions. Above the 600 K/B level, fire suppression is a major problem. Fire personnel should expect and prepare for the previous day’s fire to escape the next day during the peak burning period [
40]. People burning outdoors with no understanding of the parameters for wildfires can be a real threat for wildfires when the conditions are right.
The South Carolina Forestry Commission (SCFC) provided detailed daily weather and wildfire occurrence location and parameter data from their records from July 1997 through June 2011. These data represented all wildfire occurrence responses by the SCFC during this period and included wildfire parameters like size, ignition source, weather, and vegetation type.
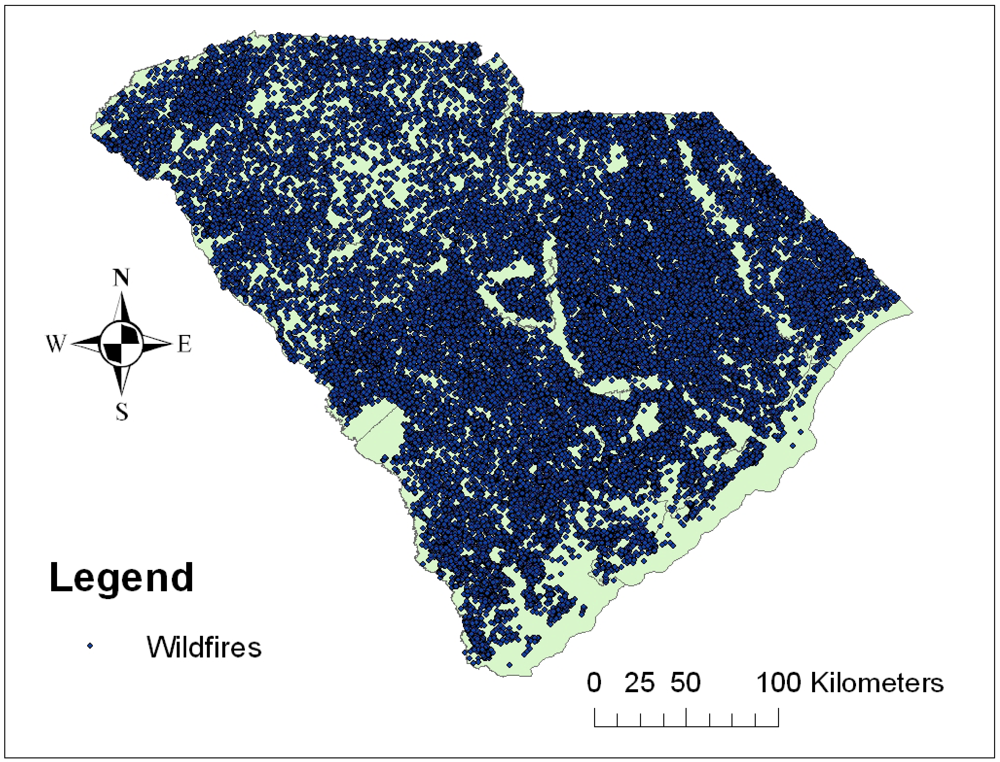
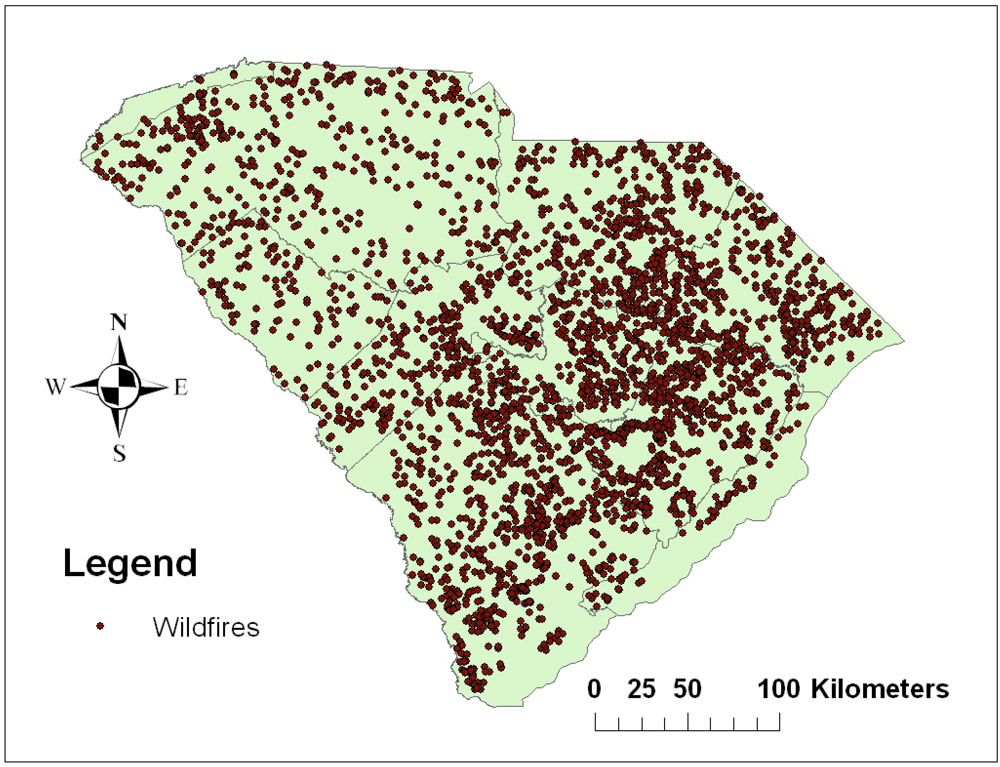
Figure 1 shows points of all the wildfires throughout this time period. To narrow the fire occurrences down further, common factors were analyzed that may have caused the spike from a normal day of around twenty wildfires to an extreme caution day of seventy or more fires. To spatially examine this, the wildfires on days that had seventy or more wildfires were selected out and converted into a shape file (
Figure 2). A shape file is a file format used for storing geographic information on GIS computer programs or databases. They can be stored in points, lines, or areas. Having these data points will allow different spatial analysis tools to be used in order to observe additional patterns that may predict future occurrences. Land cover data for use in the spatial analysis tools were acquired from the South Carolina GAP Analysis Project, a source of numerous land cover GIS data sets [
41], and reclassified into the eleven different land cover classes shown in the results.
Figure 1.
All wildfires from July 1997 until June 2011.
Figure 1.
All wildfires from July 1997 until June 2011.
Figure 2.
Wildfires for everyday having seventy or more wildfire occurrences.
Figure 2.
Wildfires for everyday having seventy or more wildfire occurrences.
In addition to the factors that are being used currently to predict wildfire occurrences, this study examined some important socio-economic factors. These data were obtained from the US Census Bureau website and placed in Microsoft Excel tables that were analyzed in ArcGIS 10 [
42]. ArcGIS 10 is a computer program that creates map and analyzes the geographical data on those maps [
43]. When examining census data, patterns can quickly be observed on the county, census tract, or census block level. Census tracts are occasionally split due to large amounts of population growth or combined because of a significant decline in population. In non-metropolitan areas where the local census committee has not defined census tracts, small statistical subdivisions of a county are defined as blocks.
After using Excel to organize the wildfire data, different layers were brought into ArcMap for the analysis procedures, whether it is weather or human related factors that were analyzed. A layer is a set of maps that will be helpful in the process of analyzing particular variables. Poverty rate is a layer in this study, for example. Each layer can be overlaid on the others so that every layer corresponds correctly with the geographic location. The bottom layer is the most important because it holds the correct position and each layer on top of it has to be registered with the same coordinate system.
Several different spatial analysis tools were used to locate patterns prior to wildfire occurrences. The primary tool was the Hot Spot analysis. The Hot Spot analysis tool calculates the Getis-Ord Gi statistic for each feature in a weighted set of features. This G-statistic determines whether features with high values or features with low values tend to cluster in a study area. This tool works by looking at each feature within the context of neighboring features. If a feature's value is high, and the values for all of its neighboring features are also high, it is a part of a hot spot. The local sum for a feature and its neighbors is compared proportionally to the sum of all features; when the local sum is much different than the expected local sum, and that difference is too large to be the result of random chance, a statistically significant Z score is the result [
44]. In this case, a hotspot analysis was then used to help understand where there were occurrences with seventy or more wildfires ignitions. To separate these wildfire hotspots out, the select by attributes tool in ArcMap was used to select data within a certain distance of the actual hotspots. A sixteen km buffer was placed around the individual hotspots that selected each wildfire in the area. The 16 km radius was chosen to attempt to keep the fire data within the same geography or land cover. A larger radius would have a large amount of variation of fires with no significance such as small brush fires. The 16 km radius shows the areas around the hotspot where the really severe amount of wildfires tend to occur. If the project was on a national basis, rather than a state-level basis, a larger radius would be appropriate.
Hot spot analysis and preliminary figures identified the lower half of the state as the main area of interest because this is the area that had more intense days of wildfire occurrences, therefore the study’s focus shifted there. Using population data from the census bureau, the population density was calculated for each county on a per ha basis. Calculations were performed in Excel and exported into GIS in order to reclassify the density into three categories ranging from 0.01 to 0.30 people per ha. Two counties, one in the area with severe wildfire and one out of the wildfire area were then randomly selected in order to compare the population density to the total ha in the counties. Population density was a variable under consideration, so higher population and low density population counties were intentionally contrasted. In addition to the population density, the population change from 2000 until 2010 was also spatially examined since it roughly corresponded temporarily to wildfire occurrences from 1997 to 2011.
The U.S. Census Bureau uses a 2010 federal poverty level of $22,314 annual family income [
45]. To examine the poverty levels of the counties in the severe wildfire area two different socio economic variables were examined spatially. The percentage of families in housing units per county that had an annual income of less than $25,000 were reclassified into three different ranges with the highest range indicating a larger percentage of families with an annual income of less than the specified value. Also, the difference in families in poverty was calculated for each county from 2000 until 2010 to get a percent change in poverty rates [
42]. A hotspot analysis was then used to see whether or not the wildfires occurred in areas with families living in poverty.
Educational level may also be a factor that impacts wildfire occurrences. To examine this spatially, the 2009 educational attainment data was obtained from the U.S. Census Bureau and brought into ArcMap [
42]. These data were calculated based on the total population of the age group that were 18 years or older. It was then reclassified into three different percentage groups with the highest percentage showing the areas where more of the population had some type of college degree, whether it was public or private schools.
Another factor examined, geographic mobility, identifies those who relocate from county to county within South Carolina. Geographic mobility is related to factors such as educational purposes, business purposes, or suburban sprawl which is the potential for development from the active transportation network. Data from the U.S. Census Bureau were spatially examined to show if severe wildfire occurrences are influenced by relocation patterns [
42]. The number of people per county that moved from county to county within South Carolina was reclassified into five categories. A map was created that shows counties where people never tend to relocate to and counties with a more diverse group of people from different counties. Finally, a measure of road density was developed by dividing the total number of roads in each county by the total number of ha in that county in order to evaluate the effect of transportation network on wildfire occurrence [
46].
4. Results
Utilizing GIS technology allows us to identify the most important areas of wildfire occurrence. Different spatial analysis techniques can be used to answer the questions of “where” and “why” these wildfires are occurring. The first ignition factor that is usually considered when dealing with wildfire is the type of land cover in the area.
Figure 3 shows that the lower portion of the state is primarily agricultural land, which in this case is where the highest clusters of wildfires seemed to occur. Features like agricultural land can lead to faulty conclusions on underlying reasons for relationships. Clearly, agricultural land has certain physical attributes, like high soil productivity and a lack of an annual plant cover. At the same time a series of human-related factors also occurs on agricultural lands. These lands are owned by a certain type of rural resident, with a profit motive tied to the land, and similar socioeconomic characteristics. Traditional crops in this region are cotton, corn, hay, oats, tobacco, soybeans, and wheat. None of these crops leave debris to be burned, so this is not an issue. If wildfire occurrence were related to agricultural land, would it result from the location and type of land used for farming, or the type of people involved in the farming industry? The wildfire occurrence points in
Figure 3 are so dense as to obscure the agricultural land base that they cover. Later figures follow the same pattern of
Figure 3 suggesting some common factors influence wildfire occurrence.
Figure 3.
Reclassified land cover map overlaid by wildfires.
Figure 3.
Reclassified land cover map overlaid by wildfires.
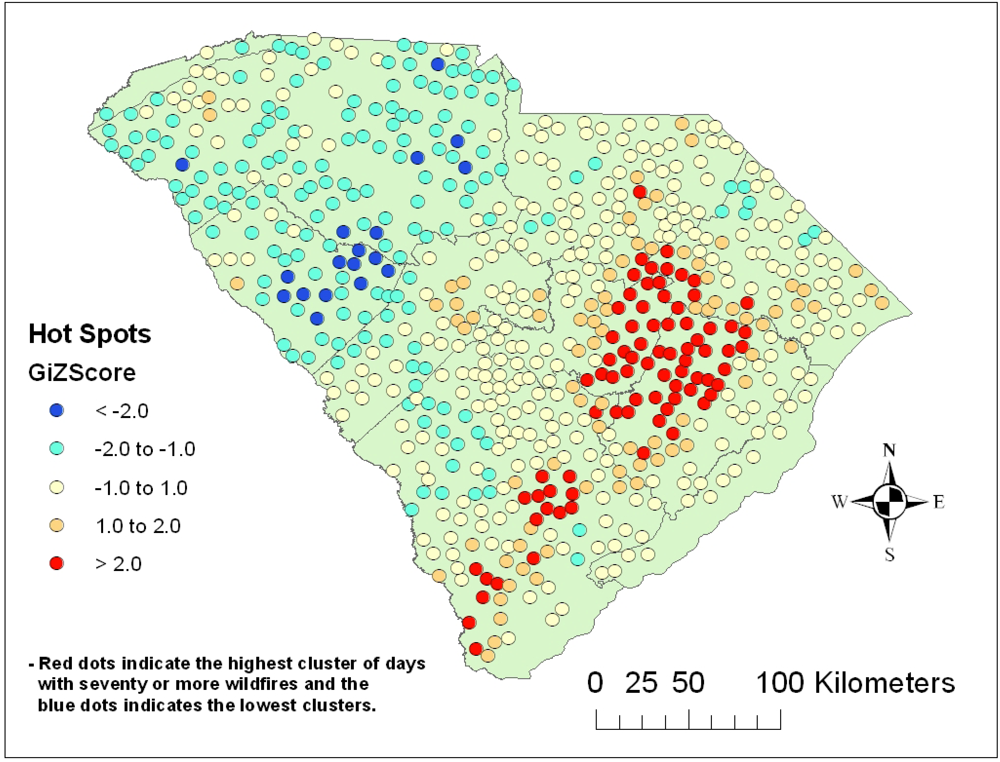
Figure 4.
Hotspot analysis of days with seventy or more wildfires.
Figure 4.
Hotspot analysis of days with seventy or more wildfires.
There is a difference in fuel types and fuel loads in the upper and lower portions of the state. The lower portion of the state contains a large amount of organic littler layer comprised of fine fuels [
47]. These fuels along with the peat soils are wildfire hazards alone. The results from the hot spot analysis are used to find out where wildfires were clustering the highest.
Figure 4 shows a strong correlation between the hot spots of the wildfires (red points) and the lower portion of the state with the agricultural land where these fine fuels are present.
Figure 3 and
Figure 4 should be contrasted to emphasize that connection.
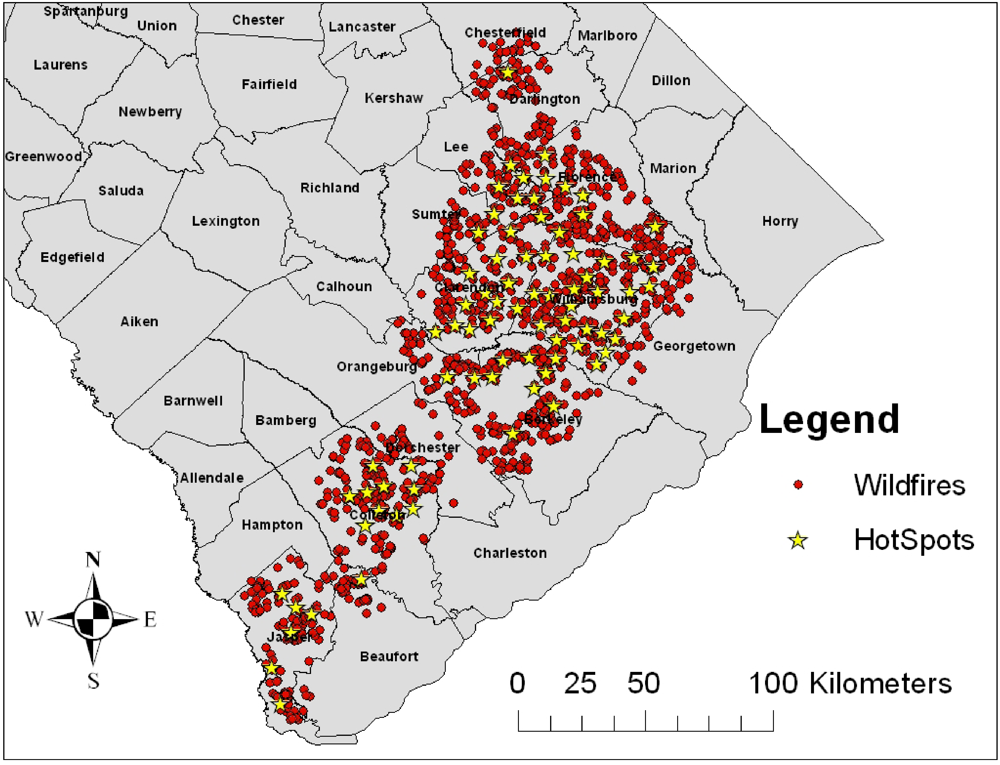
Figure 5 indicates that the highest clusters of wildfires are only occurring in 15 of South Carolina’s 46 counties. On days with seventy or more wildfires there were 3,609 wildfires across the entire state, 1,464 of which were in these fourteen counties alone. When comparing the number of days out of the total 5,110 days in the time period from July 1997 through June 2011, only 42 days had spikes of over seventy wildfires. Furthermore, 41 percent of all the wildfires were within sixteen kilometers from the tightly clustered hotspots that only cover 20 percent of South Carolina’s total area.
Figure 5.
Wildfires within a 16 km radius of hot spots.
Figure 5.
Wildfires within a 16 km radius of hot spots.
After identifying the lower portion of the state (which is mainly agricultural land) as the area where wildfires occurred most commonly, socioeconomic variables were examined to determine what factors influenced these occurrences besides the land cover alone. These variables are population, income, education, road density, and geographic mobility.
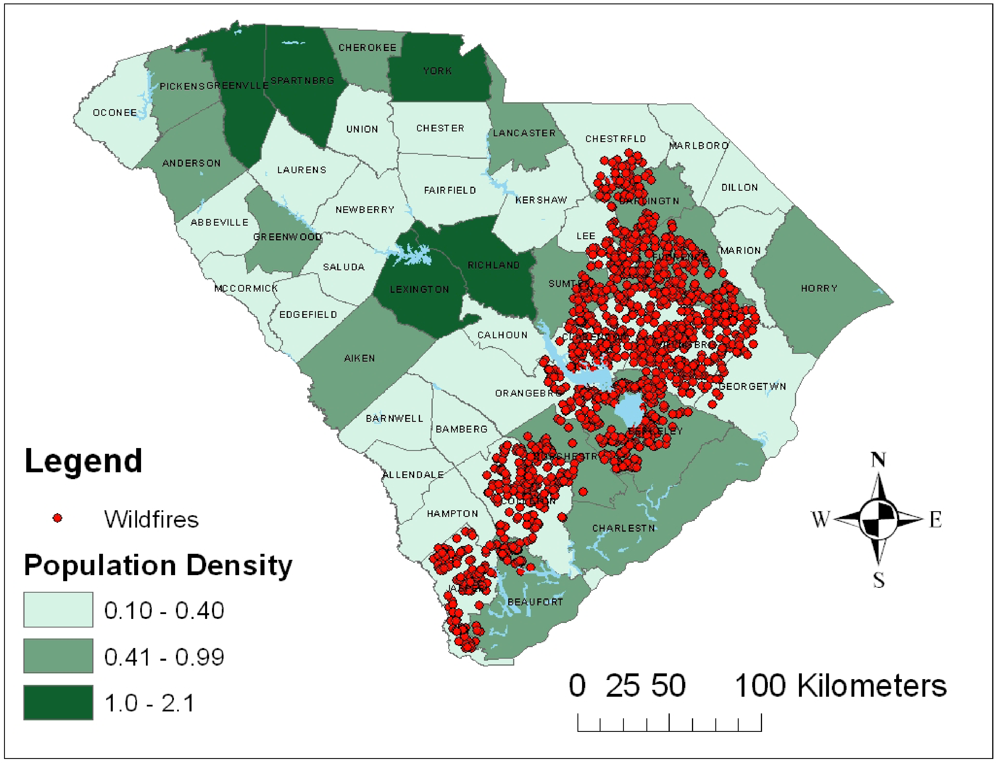
Figure 6 shows the population density per ha for each county in South Carolina. The areas of low population density (light green) tend to follow the severe wildfire area. Of the fifteen counties with areas of severe wildfire, six were in the median population density range. The other nine counties were in the low population density group making 60 percent of the counties in the severe wildfire area range from 0.10 to 0.40 people per ha by county. Colleton and McCormick counties were randomly selected to compare population density to county area. Colleton, which is in the area of severe wildfire, is 2.8 times larger in area than McCormick, which is outside of the severe wildfire area. There is a 64 percent difference in area of the two counties but only a 27 percent difference in population density, indicating that the population density in Colleton leaves more open space for wildfires to occur.
Figure 6.
Population density per ha of each county in South Carolina.
Figure 6.
Population density per ha of each county in South Carolina.
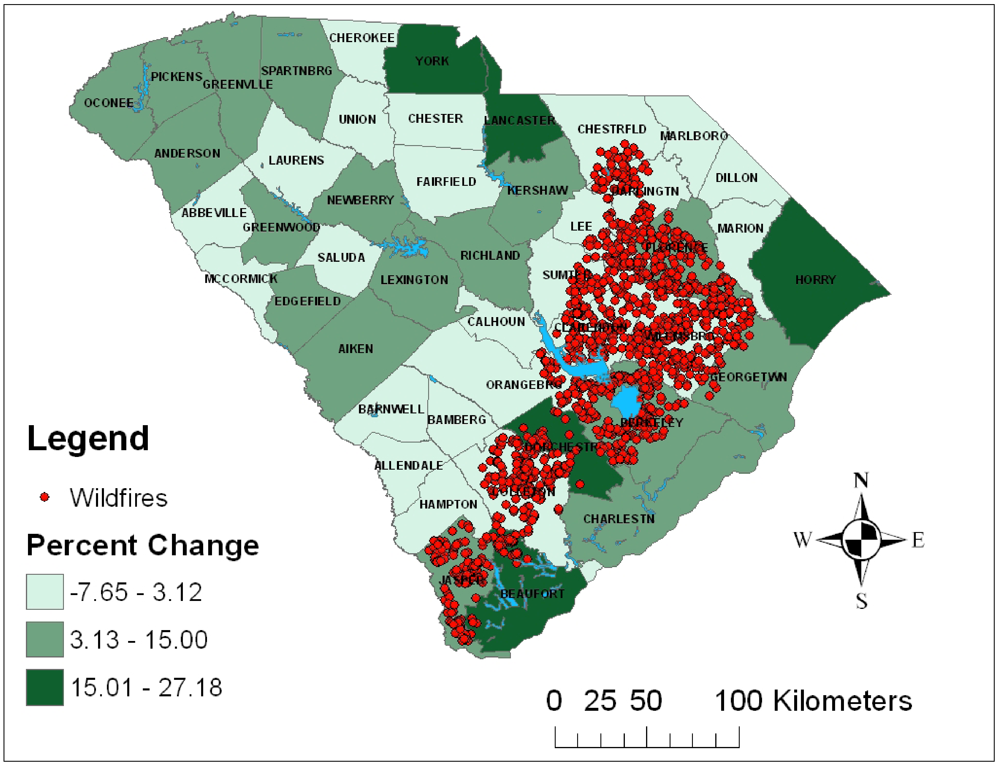
Figure 7 shows that the counties growing in population have smaller numbers of wildfires compared to the counties with a lower percentage of population growth over that past 10 years. Only two out of the fifteen counties in the hotspot area were shown to have a high amount of population growth. These two counties, Dorchester and Beaufort, had 73 of the 1,464 wildfires occur in them. Assuming this, 95 percent of the wildfires happened in the other thirteen counties whose population declined or had either low to medium population growth.
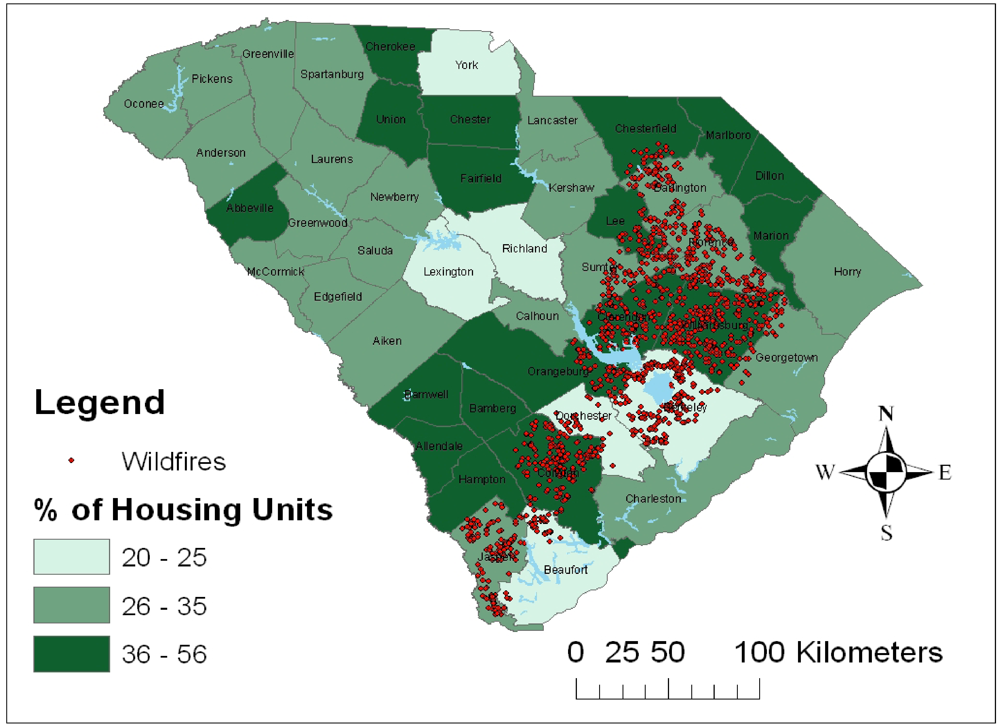
Figure 8 shows the percentage of families per housing unit in each county with an annual income less than $25,000. Only three of the fifteen counties in the study area have a low percentage of families with an income of less than $25,000. Families in the remaining twelve counties have a higher percentage of families making less than $25,000 of annual income. This indicates that wildfires are more common in areas with a higher percentage of families making less than $25,000 per year.
Figure 7.
Percentage of population change from 2000 until 2010.
Figure 7.
Percentage of population change from 2000 until 2010.
Figure 8.
Families in housing units with annual income less than $25,000.
Figure 8.
Families in housing units with annual income less than $25,000.
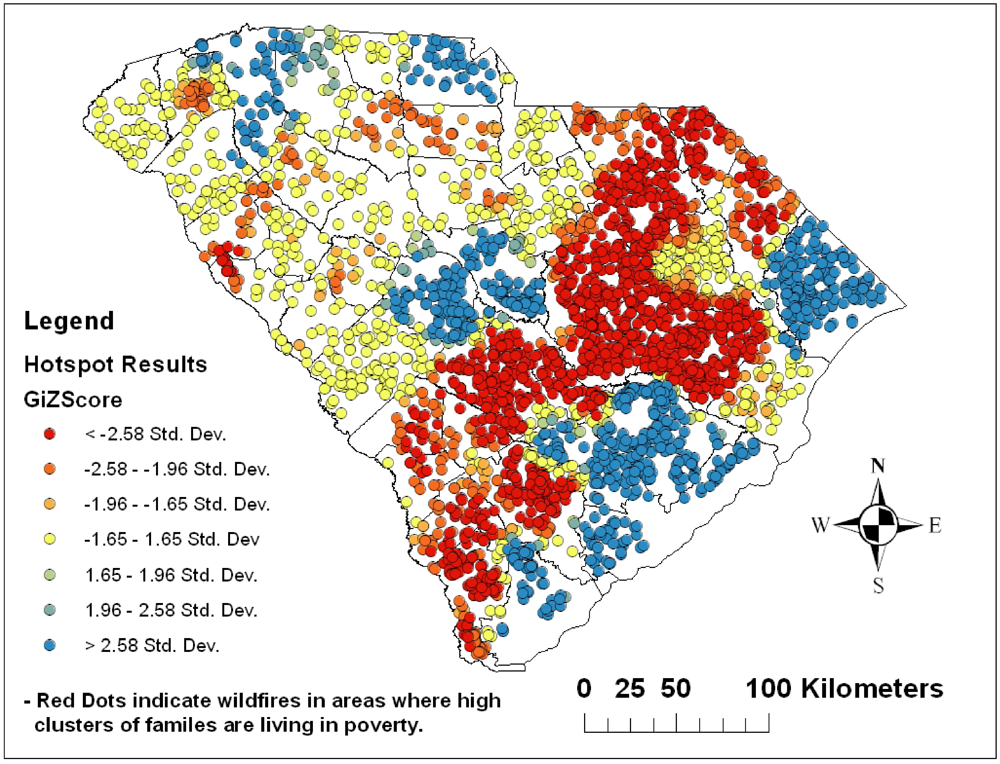
The hot spot analysis of families living in poverty (
Figure 9) shows the areas where families were not living in poverty versus the areas with families living in poverty. The results indicated that only four of the fifteen counties that had severe wildfire occurrences had lower levels of poverty. Only 294 of the 1,464 wildfires were in these four counties with low poverty levels. Approximately 80 percent of the wildfires occurred in the other 10 counties with high poverty from 2000 to 2010 according to the analysis. This shows a developed pattern in wildfire occurrences in the poorer areas.
Figure 9.
Hotspot analysis of poverty rates in South Carolina.
Figure 9.
Hotspot analysis of poverty rates in South Carolina.
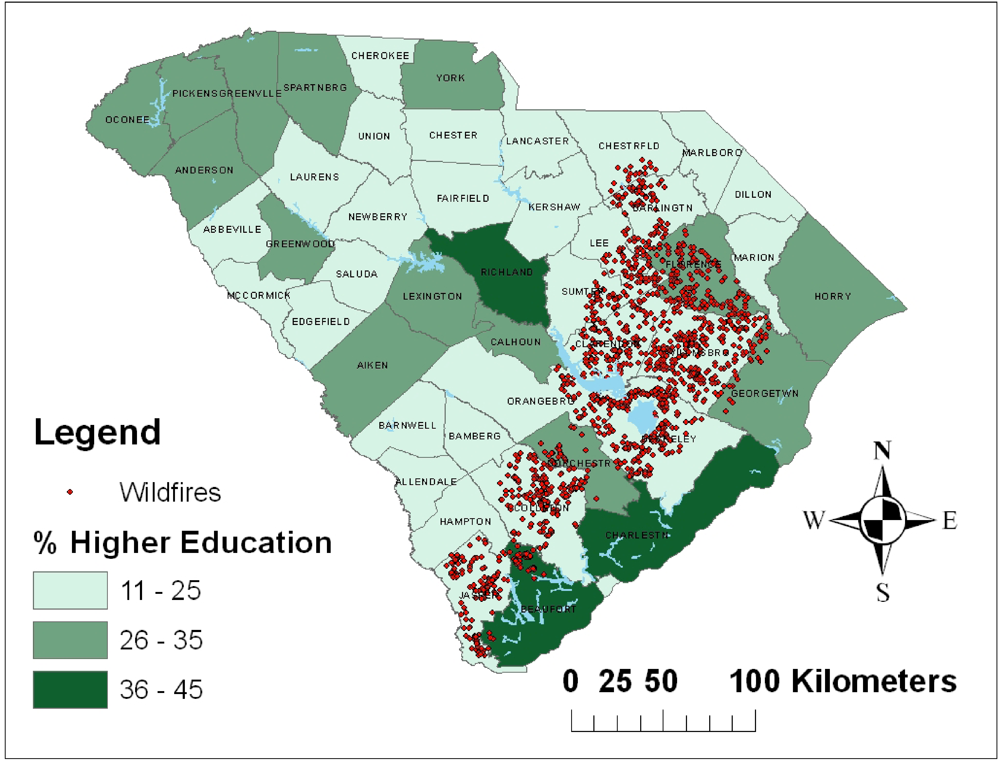
When the percent of population with some type of college degree is shown in
Figure 10, patterns of higher education with lower numbers of wildfires were observed. The levels of higher education range from 11 to 45 percent throughout every county in South Carolina. Only one of the fifteen counties that lie in the hotspot area has a high percentage (36–45 percent) of the population with some type of college degree. Out of the 1,464 wildfires in the hotspot area, only 44 wildfires or 3 percent of the total wildfires are in this county. That is, 97 percent of the wildfires occur in the areas with low to medium percentages of population with higher education.
Figure 10.
Percentage of public with a college degree based on population.
Figure 10.
Percentage of public with a college degree based on population.
Figure 11 illustrates the geographic mobility of those who relocated from county to county within South Carolina. Only three of the fifteen counties within the hotspot area have a population of 4,800 or greater of people that have relocated from a different county. These three counties are very close to or adjoin other counties located on the coast, which is probably due to suburban sprawl. In the three counties, 379 of the total 1,464 severe wildfire occurrences take place. That is, 75 percent of the wildfires occur in the other 12 counties where the majority of the population has never relocated. This illustrates that out of all the severe wildfire occurrences, the wildfires tend to cluster around the counties where people never relocate. Notice the prior figures showed some level of correlation; it is difficult to identify which variables control wildfire occurrence and how these variables interact, especially the socioeconomic variables. The figures provide a starting point to understanding some very complex relationships.
Figure 11.
Population by county of geographic mobility (those who moved from a different county within South Carolina).
Figure 11.
Population by county of geographic mobility (those who moved from a different county within South Carolina).
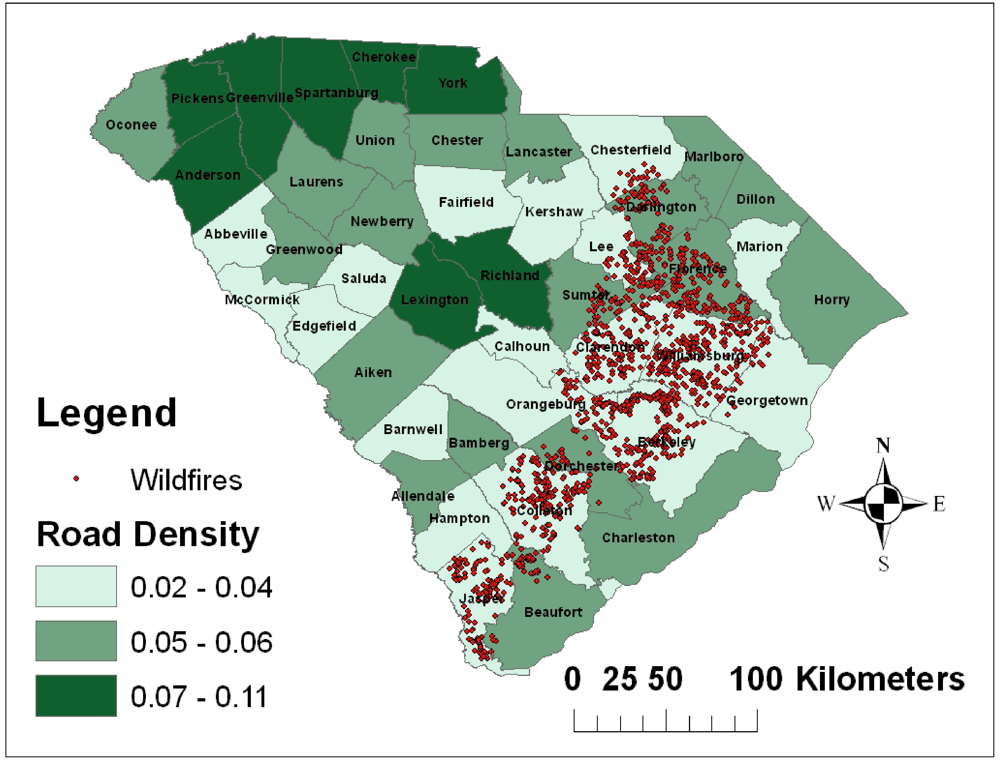
Having a fewer number of roads in a given area leaves more open space for the potential of wildfire occurrences. With fewer roads, reports of wildfires from the local residents or visitors of the area may be minimized causing the fires to spread in numbers or increase dramatically in size. Assuming that the mobility of families in South Carolina was probably influenced by the active transportation network, the road density per square kilometer in each county was examined and results are shown in
Figure 12. The density of roads for all the counties range from 0.02 to about 0.11 roads per square kilometer. This map shows that in the areas of the severe wildfire occurrences, there were no counties that had above 0.06 roads per square kilometer. Nine out of the fifteen counties had a road density of only 0.02 to 0.04 roads per square kilometer. After comparing this map to the area of severe wildfire occurrences, the results illustrate that road density is a major factor influencing the occurrence of wildfire.
Figure 12.
Road density per square km by county.
Figure 12.
Road density per square km by county.
5. Conclusions
Wildfires will always be a concern for landowners because nature exceeds our ability to control such events. Advances in technology, such as geospatial analysis, will help improve warning programs by increasing our ability to predict which day(s) and in what areas wildfires are most likely to occur.
The large area of agricultural land that covers the lower part of the state is the most likely area within South Carolina to experience severe wildfire occurrences. This is mainly due to the organic fuel litter that ignites easily in addition to the large amount of peat soils in the area that can support wildfire occurrence. This study shows socioeconomic factors likely contribute to this region’s propensity for wildfires. Specific human-related factors seem to have a large influence on wildfire occurrence.
Characteristics of the hot spot area, where the most clusters of wildfire occurrences were observed, include areas with low population densities, low changes in populations within the county, high poverty rates, lower degrees of education, and low road densities. Of the socioeconomic factors examined in this study, poverty rates and degrees of education seem to have the greatest influence on predicting wildfires.
This study has shown that the cause of wildfires is a complex problem. Physical factors that contribute to occurrence are well-known and variables related to those factors are easily obtained, even on a daily basis. Even physical causes like lightning strikes offer significant opportunities in prediction of wildfire occurrence. However, human interaction with these physical factors negates much of the forecasting prospects, as human-related factors obviously contribute, both positively and negatively, to wildfire occurrence probability. Understanding this interaction is crucial to gaining enhanced ability to forecast wildfire occurrence patterns. Socioeconomic variables that seem to have a major impact on wildfire occurrence were identified and suggestions were made on how they might interact with physical factors. Increased understanding of these correlations will lead to better wildfire forecasting systems. This is an area of future research strongly supported by this study.


