Climate-Induced Tree Growth Variations under the RCP 2.6 Scenario: A Case Study on the Southeastern Tibetan Plateau


Tree-ring Laboratory, College of Forestry, Shenyang Agricultural University, 120 Dongling Road, Shenyang 110866, China
*
Author to whom correspondence should be addressed.
Forests 2017, 8(10), 359; https://doi.org/10.3390/f8100359
Submission received: 7 July 2017
/
Revised: 15 September 2017
/
Accepted: 20 September 2017
/
Published: 23 September 2017
Abstract
:The relationship between climate and radial tree growth is traditionally used to reconstruct past climate conditions based on interannual tree-ring variations. However, few studies have used these climate-growth relationships to model the radial tree growth based on future climate projections. To detect the future forest dynamics, the climate-induced tree growth from 2006 to 2100 was projected using temperature changes under representative concentration pathway (RCP) 2.6 for the southeastern Tibetan Plateau. Radial tree growth was mainly controlled by annual mean temperature in this region. Based on the relationship between regional annual mean temperature and radial tree growth, a regression model was built that explained 62.5% of variance in the observed temperature record over the period 1911–2005. A period of unprecedented radial tree growth was found after 1998 when compared with the tree growth in the past 700 years. We found that radial tree growth would increase in the period 2006–2045 and decline after that period due to the projected temperature decrease. As forest productivity and biomass are expected to increase with the increased tree growth, these results suggest that temperature-limited systems could see future increases in productivity as growth limitations are lessened. The results of this research could be used to predict regional forest dynamics in the future.
1. Introduction
Temperature increases are expected to be greatest at most high northern latitudes and high-elevation regions [1]. The Tibetan Plateau has experienced a marked temperature increase, and has had a higher warming rate than the global average [2]. These changes have differential effects on the different ecotones throughout the world. It remains uncertain how these changes will affect high- elevation regions such as the Tibetan Plateau.
Changing climate conditions are significantly influencing forest growth and dynamics through longer growing seasons, shifts of insect species ranges, and changed frequency of forest fires [3,4,5,6,7,8]. Relationships between climate variables and radial tree growth have allowed for the robust reconstruction of past climate conditions on timescales that are not observationally possible. These relationships are assumed to be temporally stable, and future tree growth could be calculated through the use of projected climate conditions. However, few studies have used the relationships established through tree-ring reconstructions to model future forest dynamics under variable climate conditions. These projections can put into context the projected climate shifts by translating the 1–2 °C increase into landscape level impacts.
Trees have been reliably used as sensors and repositories of climate and ecological variability, integrating both internal and external influences, such as such as size-related growth trend, climate variability, and ecological disturbances into their annual rings [9,10,11]. To reconstruct past climate variability, trees are sampled at the upper (lower) tree line, as temperature (precipitation) is the most limiting factor to growth in these regions [9,10]. Additionally, standardization methods are applied to the tree-ring time series to remove the geometric, size-related growth trend, and to further remove the influence of ecological disturbances on radial growth. The resultant tree-ring chronologies primarily reflect the influence of climate variability at the site, and can be used to assess the relationships between climate variability and radial growth far into the past [9,10]. The southeastern Tibetan Plateau region is a high-elevation coniferous forest that has been shown to be limited by temperature variability [12,13,14,15,16,17]. However, few studies have combined these retrospective relationships with general circulation models to model potential forest dynamics.
In dendrochronological studies, size-related growth trend can be removed from raw tree-ring series by standardization methods [7,8]. The developed tree-ring chronologies mainly reflect the influences of climate changes on radial tree growth. As such, the relationship between climate and tree-ring chronologies can be established. Tree growth–climate relationships have been widely used to reconstruct the past climate change based on tree growth [10,11,12]. Low temperature was reported to be a major limiting climate factor on radial tree growth in the southeastern Tibetan Plateau, and many tree-ring based temperature reconstructions have been conducted in this region [12,13,14,15,16,17], suggesting a stable tree growth–climate relationship existed in this region. Thus, the climate-induced tree growth could be projected for this region.
General circulation models (GCMs) are important tools to simulate past climate variations, and project the future climate changes [18,19,20]. GCMs simulate global climate based on the conservation laws for atmospheric mass, momentum, total energy, and water vapor [18]. The outputs of GCMs can be used to simulate future climate scenarios and to analyze the ecosystem impacts [19,20]. More than forty GCMs compose the Coupled Model Intercomparison Project Phase 5 (CMIP5). CMIP5 simulates the climate changes from 1850 to 2005 to improve our understanding of the climate changes in the past, and has projected the future climate change from 2006 to 2100 under different scenarios. These scenarios, or representative concentration pathways (RCPs), describe scenarios under different radiative forcing target levels for 2100. The radiative forcing levels will lead to 2.6 W/m2 by the end of the century under RCP 2.6, which was estimated by the forcing of greenhouse gases and other forcing agents [21,22]. Many studies investigating future climate projections have used the future climate projections of RCPs [23,24,25,26].
The purpose of this study is to model future tree growth of the southeastern Tibetan Plateau by combining the climate–growth relationships observed within living trees and simulations of future temperature calculated by GCMs. To do this we will calculate a linear relationship between tree growth and temperature from 1911–2005, and will use future climate projections to 2100 to investigate whether tree growth is expected to increase or decrease for this high-elevation region.
2. Data and Methods
2.1. Study Area
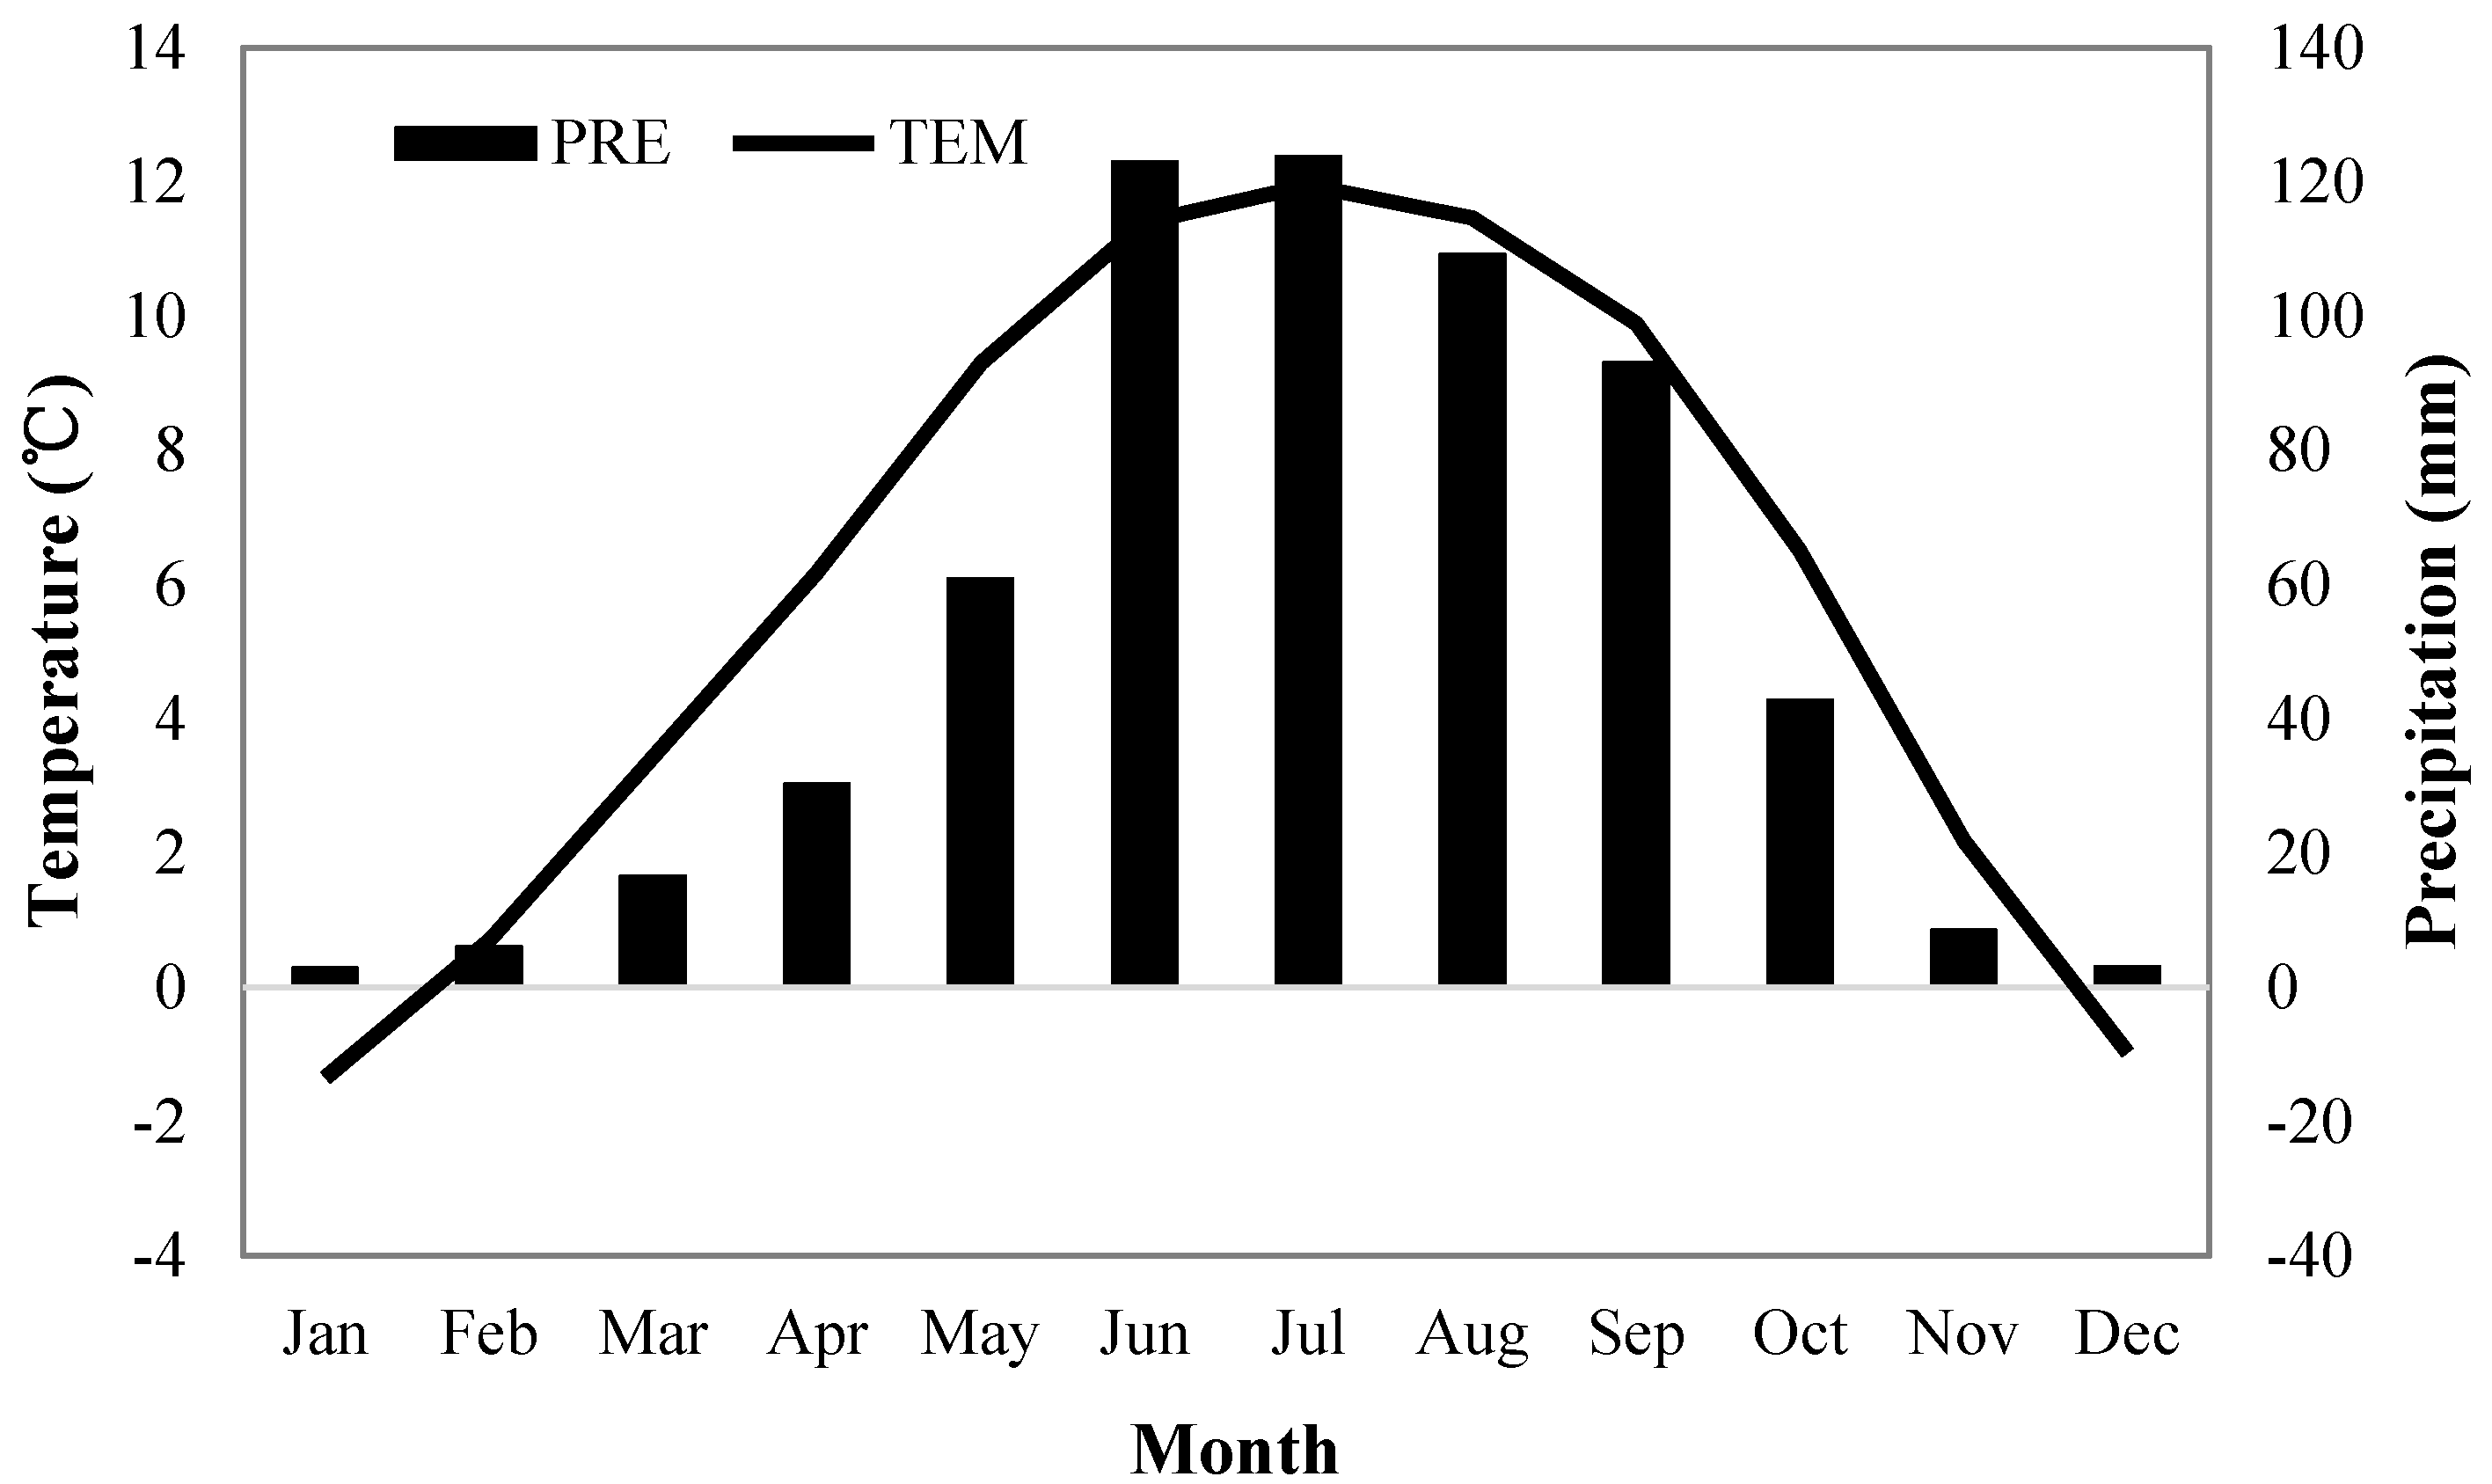
Our study area is located at the southeastern Tibetan Plateau, Southwest China (Figure 1). This region has a temperate climate with an annual mean temperature of about 6 °C [27]. The range of temperatures experienced in this region range from 0 °C in the winter to less than 15 °C in the summer (Figure 2). Precipitation is mainly concentrated in summer, which varies from 100 mm to 130 mm per month, and the mean annual total precipitation is over 600 mm. Around 90% of the annual total precipitation is received from May to October.
2.2. Climate Data
The climate data under different scenarios was obtained by the simulations of the GCMs on the CMIP5 website (http://www-pcmdi.llnl.gov/ipcc/about_ipcc.php). Across the scenarios RCP 4.5, RCP 6.0, and RCP 8.5, temperature is projected to increase by more than 2.5 °C and large uncertainty exists in how tree growth will respond as temperature increases approach and exceed 2.5 °C [1]. Thus, only the RCP 2.6 was used in this study. Monthly mean temperatures of 28 GCMs which had simulated RCP 2.6 were used, and the details of these GCMs can be found in Table 1. Multi-model mean method has been shown to produce more accurate results compared to the single model simulations [28,29]. We interpolated the simulations of GCMs to 2.5° × 2.5° to facilitate the calculation of the multi-model mean. The gridded data located at the study area (97.5° E–102.5° E, 27.5° N–32.5° N) were selected from multi-model ensemble simulations to calculate the regional mean temperature. The relationship between tree growth and temperature was analyzed in the period 1911–2005, and future projections were conducted in the period 2006–2100. Annual mean temperature (from previous October to current September [9]) was calculated and used in this study.
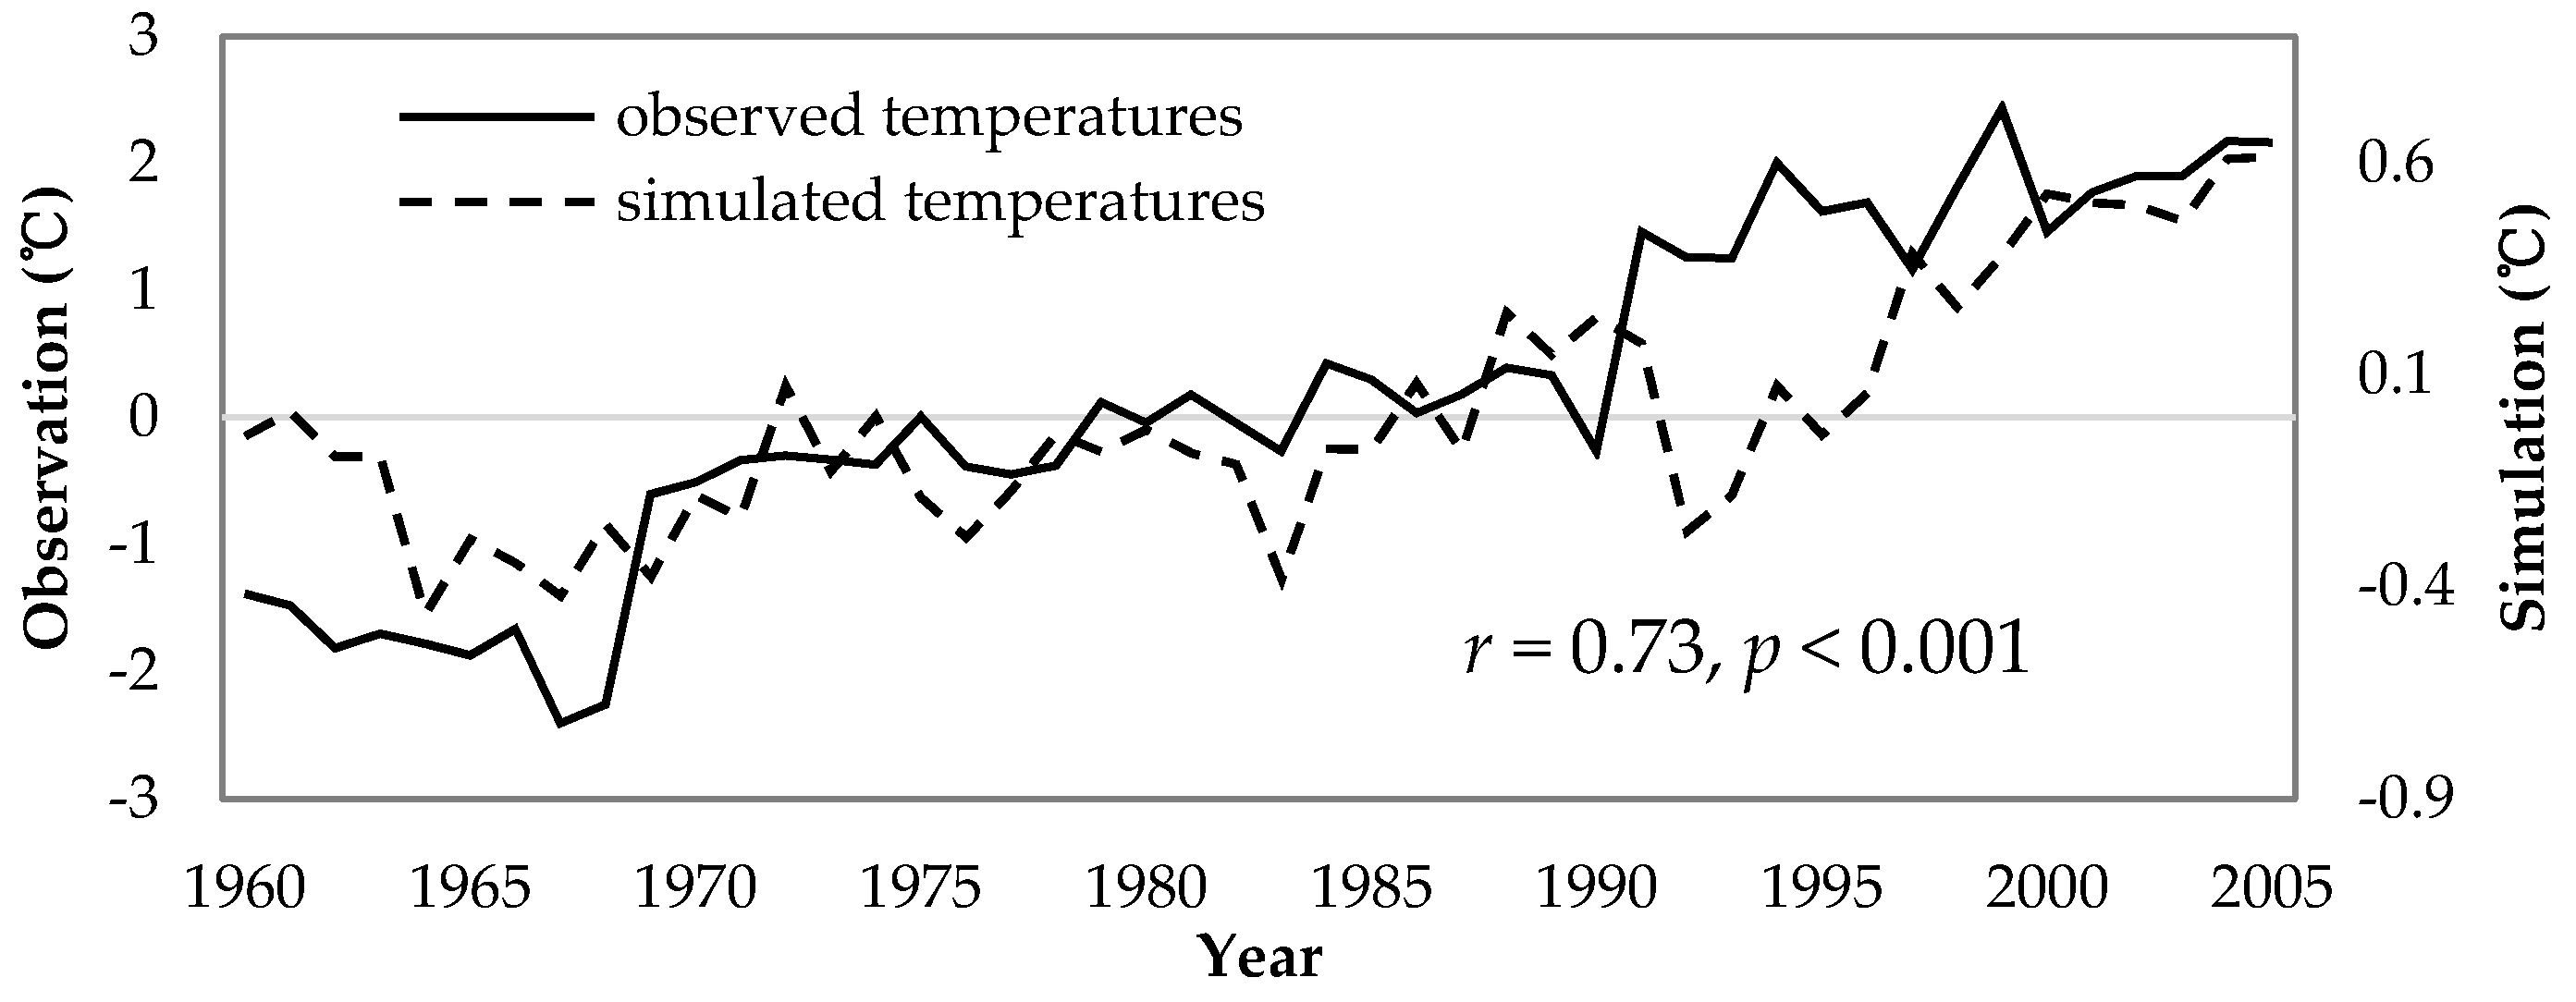
Observational monthly mean temperature and total precipitation data from ten weather stations located at the study region (Figure 1) were downloaded from the Chinese Meteorological Data Service Center (http://data.cma.cn/). The common period of the climate records from these stations lasted from 1957 to 2005. The observed regional mean temperature was calculated as the average of the monthly mean temperatures from all of the ten weather stations. These data were used as quality control for the GCM simulated data and to verify the climate-growth response recorded within the tree rings. The simulated annual mean temperature was compared with the observed annual mean temperature (Figure 3). High correlation coefficient (r = 0.73, p < 0.001) was found between the observed temperature and simulated temperature.
2.3. Tree-Ring Data
Tree-ring width data in the study area was downloaded from the International Tree Ring Data Bank (http://www.ncdc.noaa.gov/). Thirteen series of raw tree ring data around the study area were retrieved and downloaded from the aforementioned website (Table 2). All series included in the analysis passed strict quality control criteria [30].
The signal-free method was used to detrend all series. This method alleviates the distortion in external forcing signals in the developed chronologies [31]. All chronologies were developed using the version 45_v2b of the RCSigFree program, developed at the Lamont-Doherty EarthObservatory's Tree Ring Lab, Columbia University, (http://www.ldeo.columbia.edu/tree-ring-laboratory/resources/software) for every site [31]. Raw series of ring widths were firstly detrended using age-dependent splines to produce an initial chronology in the RCSigFree program. Then, the signal-free measurements were calculated by dividing the raw ring measurement by the initial chronology indices. Next, the initial chronology was updated by dividing the raw measurements by the fitted curves of signal-free measurements. The above steps were iterated until the signal-free indices showed limited differences.
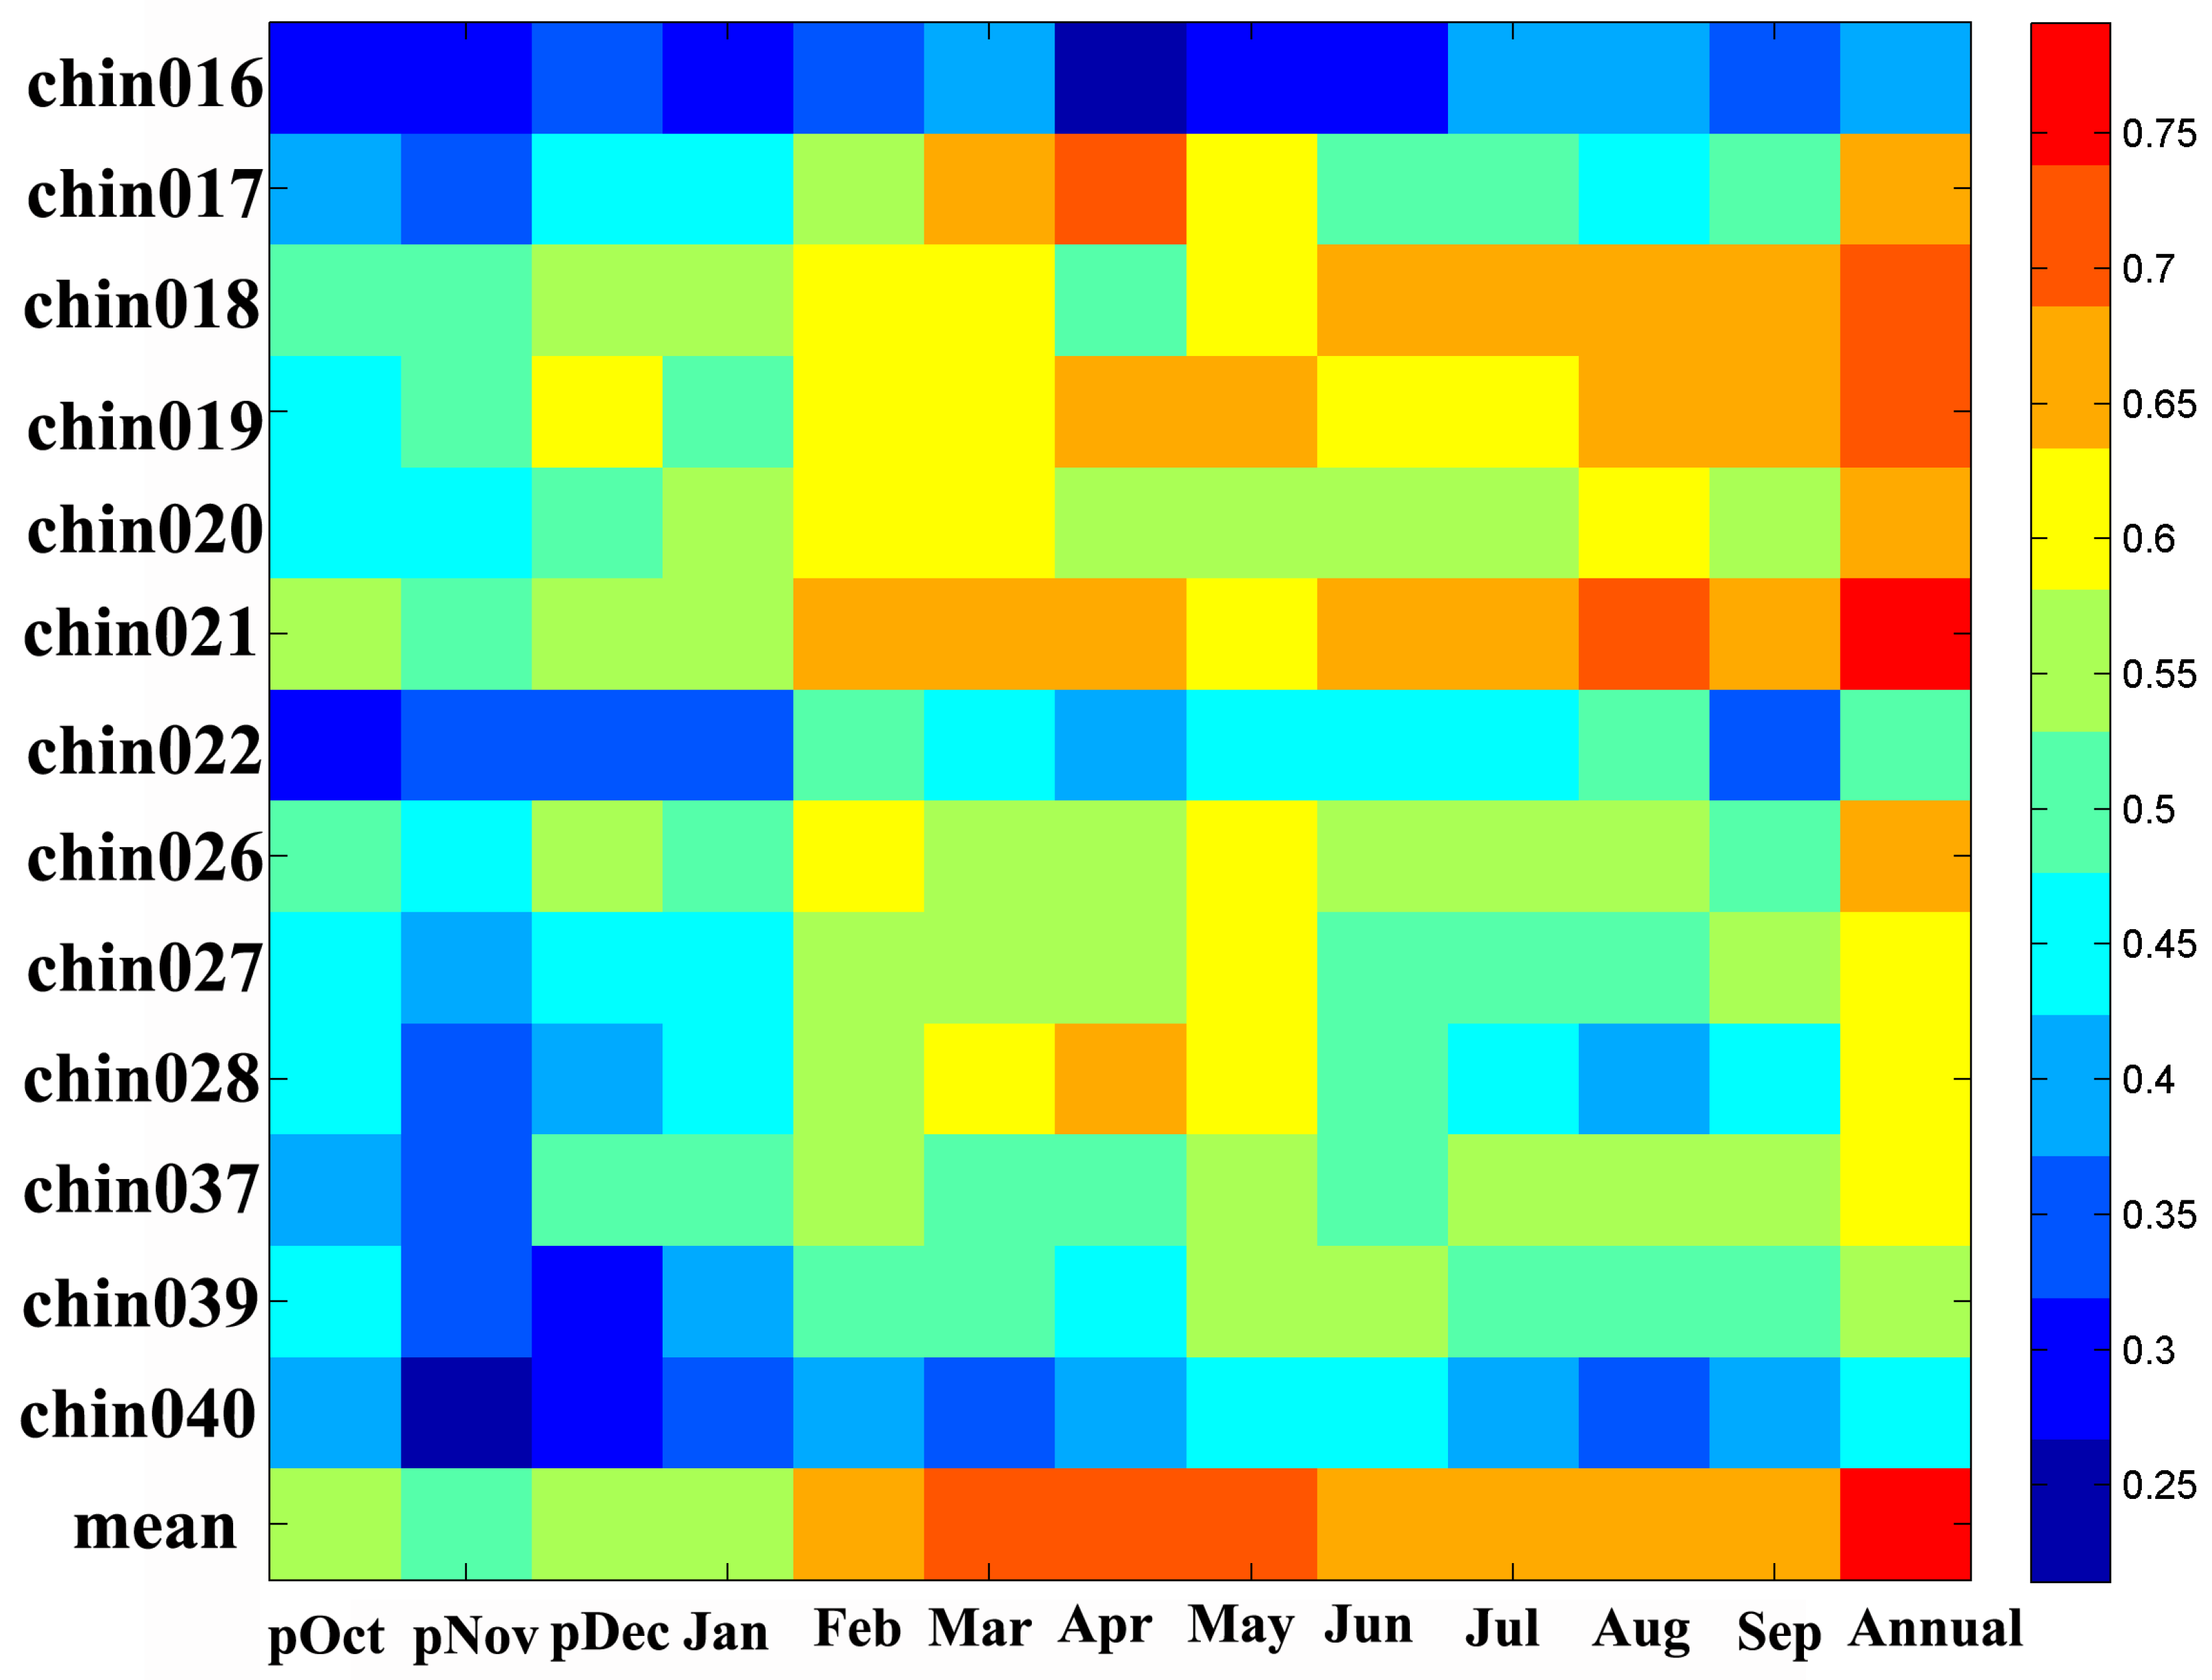
Common signals are recorded in the tree-ring chronologies for this area. The tree-ring chronologies correlated significantly with one another from 1911 to 2005, with the exception of chin016 (Figure 4). This chronology shows low correlations with chronologies chin027, chin028, chin039, and chin040, but was retained for regional growth analysis. The regional chronology was calculated as the mean of all thirteen signal-free chronologies and was used for all further analyses. This regional chronology well represents the variability present across the region, as it correlated significantly with all chronologies (Figure 4).
2.4. Analytical Methods
The relationship between climate variables and the regional tree-ring chronology was analyzed by correlating monthly climate variables simulated from the GCMs with the current year’s observed ring width. As it is common for the previous year’s climate conditions to affect the current year’s growth, we analyzed monthly variables from the previous October to the current September [9]. The variation of correlation coefficients between the simulated regional mean temperature and the regional mean chronology was assessed using evolutionary and moving interval response analysis to detect the changes in the tree growth–climate relationship throughout the study period [32]. A base length of 70 years was chosen as a fixed interval, changing the initial and final years of the analysis series. Whether or not the temporal shifts in climate–growth interactions were related to the effect of stochastic processes was verified by the Gershunov test of moving correlation significance [33].
We used a linear regression model to characterize the climate-growth relationship between simulated mean annual temperature and tree-ring width, with regional mean chronology (RMC) being the predictand and the regional mean temperature (RMT) being the predictor. The period of 1911–2005 was used to train the model, and then annual tree growth was projected for 2006–2100.
3. Results
3.1. Climate–Tree Growth Relationship
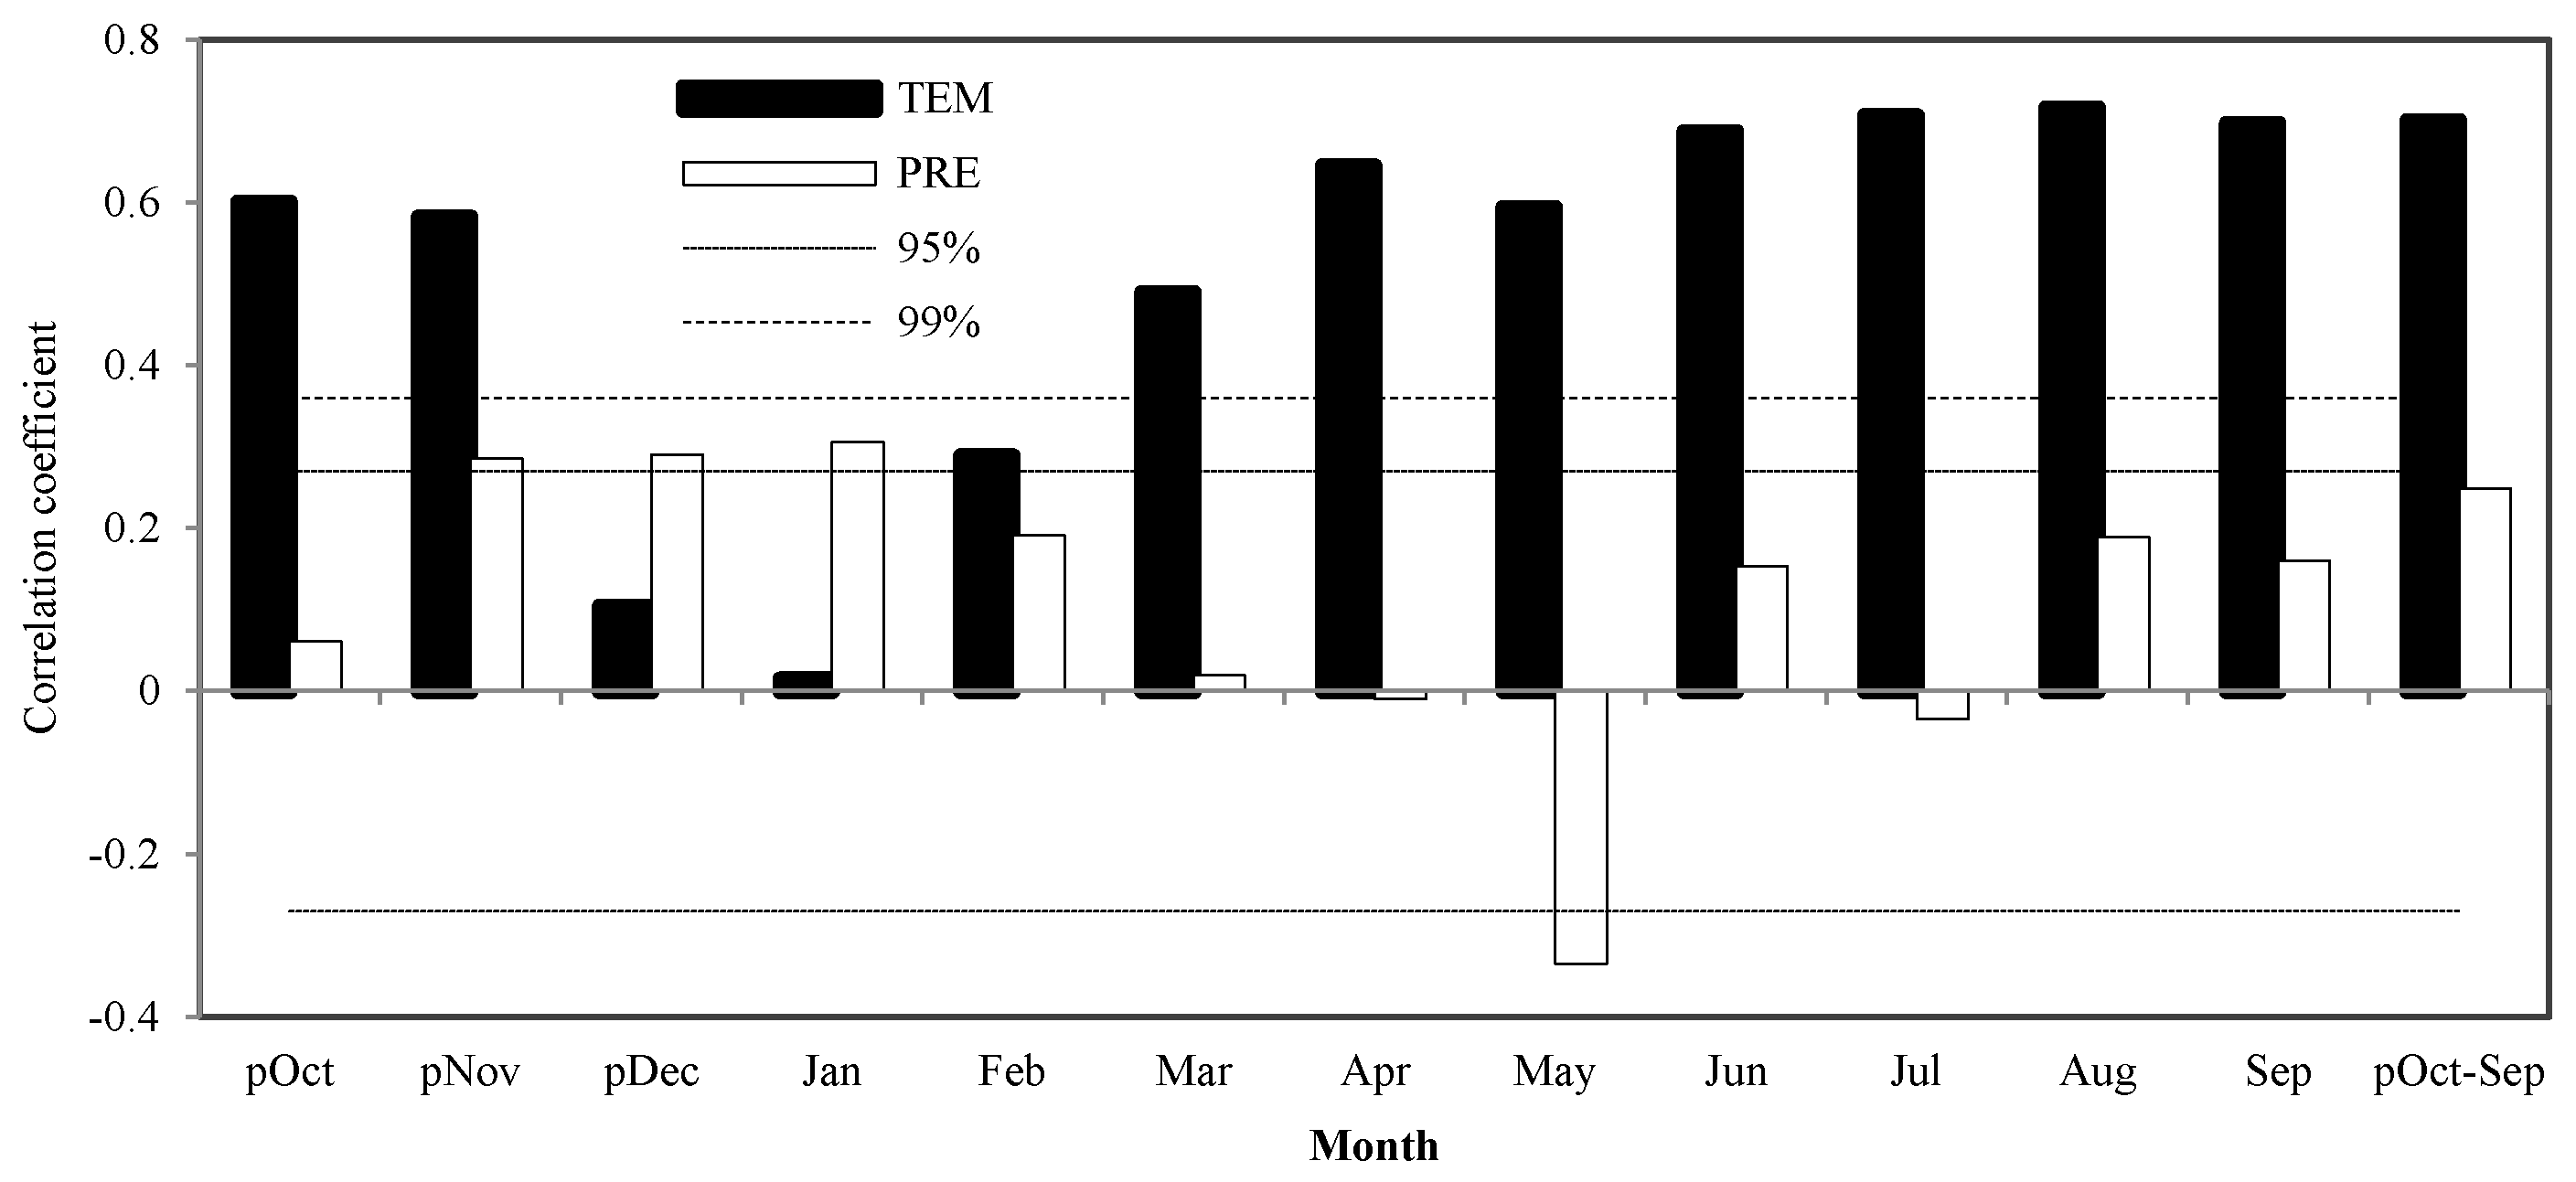
The relationship between the observed regional mean climate and the regional mean chronology was analyzed by correlation analysis for the common period 1957–2005 (Figure 5). Regional mean temperatures correlated significantly with the regional chronology at each month, except in December and January. Total regional precipitation was positively correlated with the regional mean chronology in winter (p < 0.05). May precipitation was negatively correlated with regional chronology. Annual mean temperature was significantly correlated with the regional chronology (r = 0.70, p < 0.001). First differences of the annual mean temperature and the regional chronology were significantly and positively correlated (p < 0.05). Thus, the radial tree growth was mainly controlled by temperature variations in the study area, making it consistent with other studies in this region [12,13].
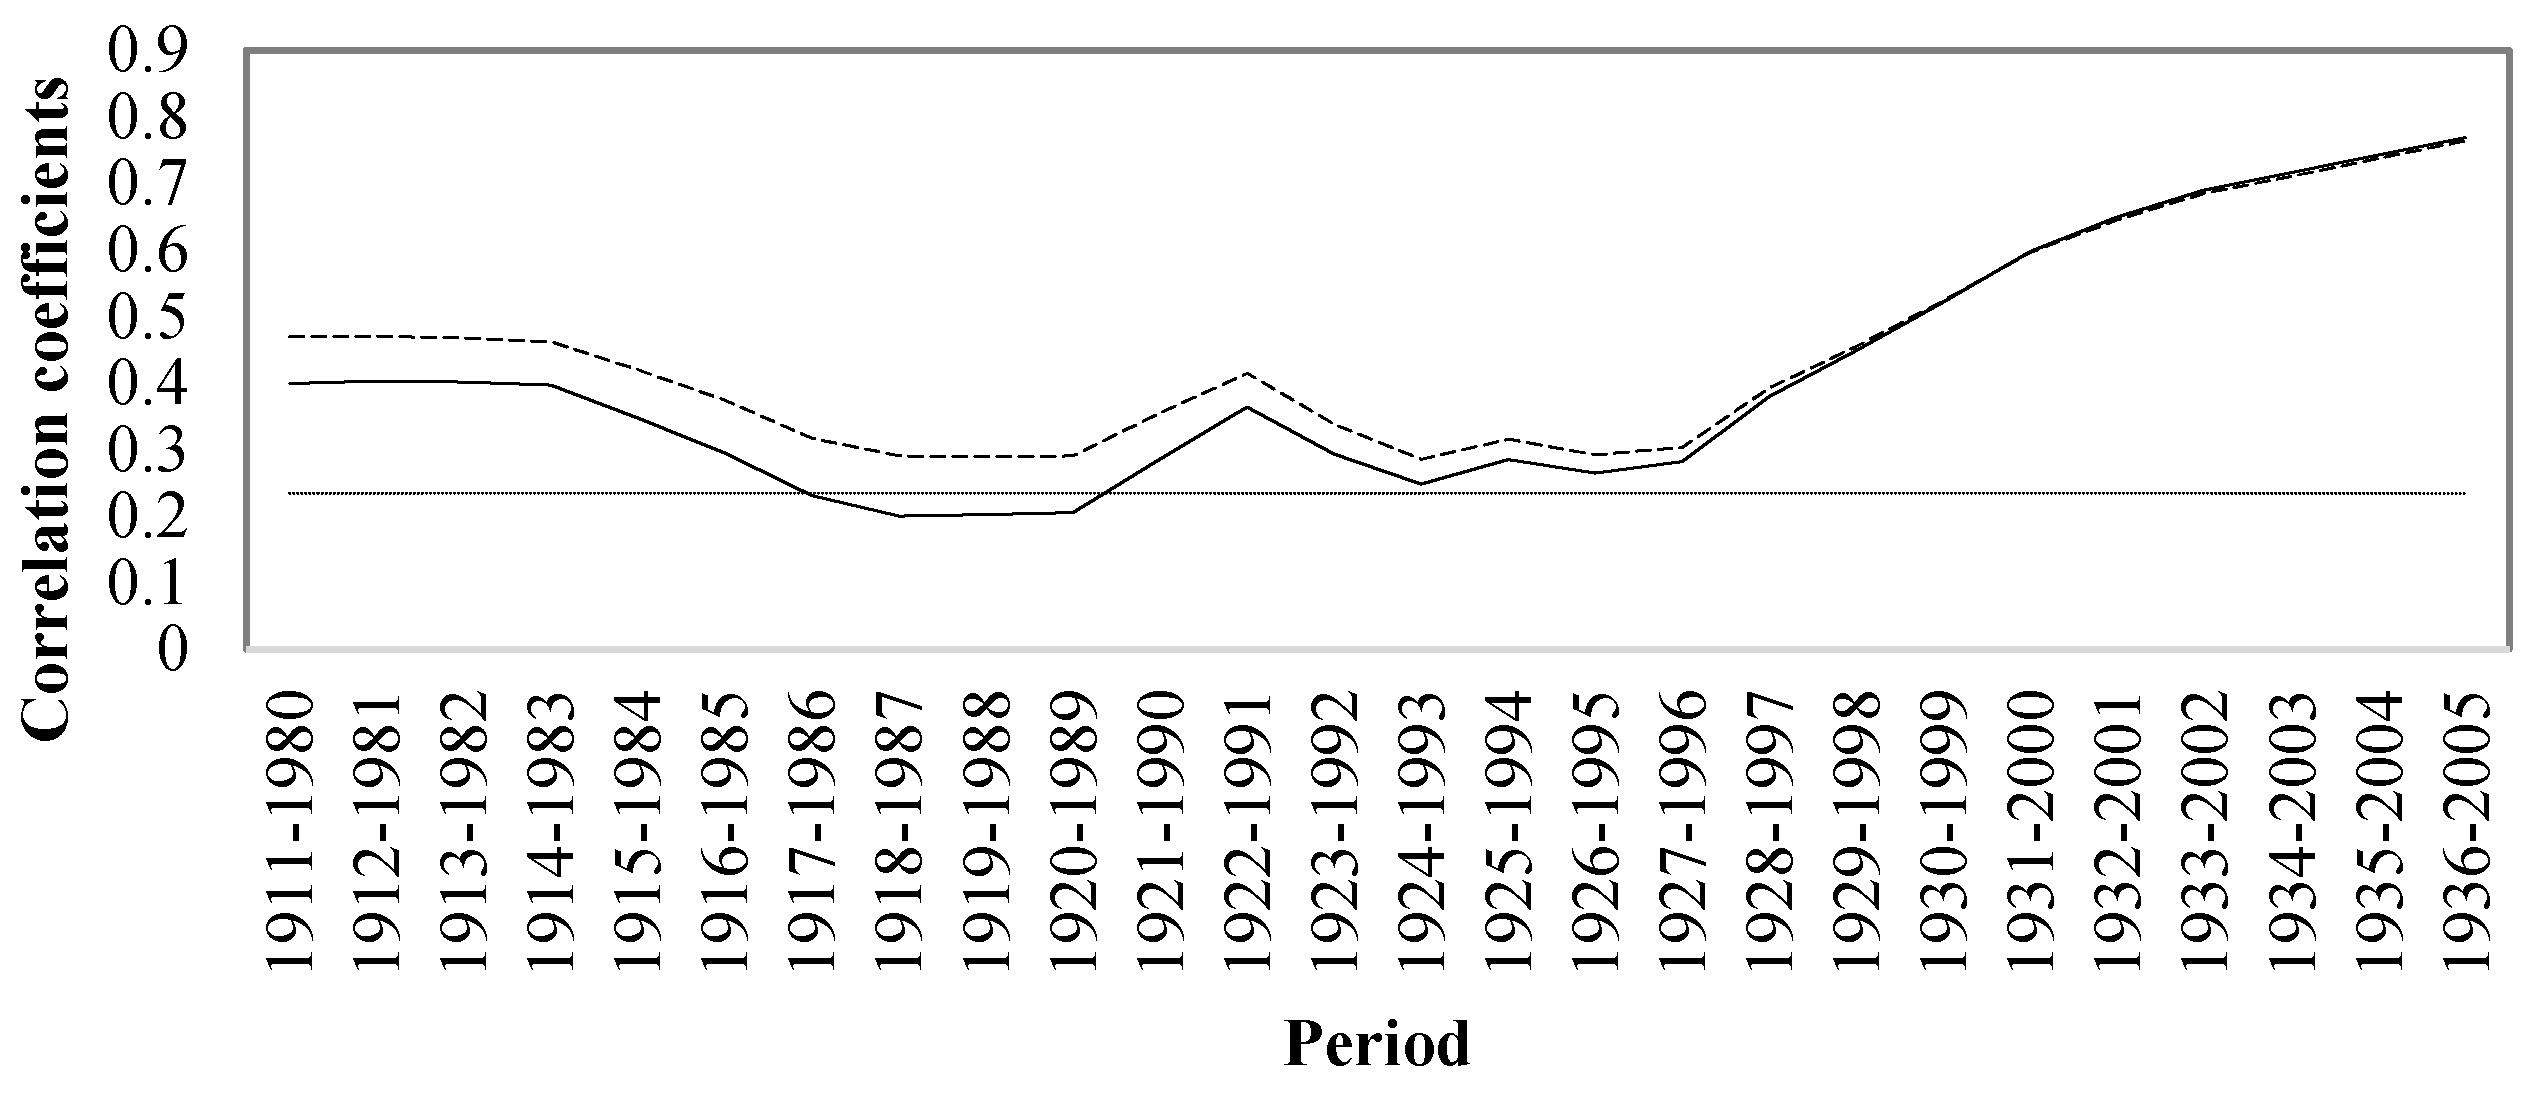
From 1911–2005, all thirteen signal-free chronologies were significantly correlated with the simulated (GCM) regional mean temperature for each month (p < 0.05, Figure 6). The regional mean chronology showed a significant correlation with the observed regional mean temperature for each month from 1911–2005 (r > 0.4, p < 0.01) as well as with annual mean temperature (r = 0.791, p < 0.001). Overall, radial tree growth was highly correlated with the simulated annual mean temperature in this region. When testing to see if this relation changed over time, it was found that this relation is stable (Figure 7). The regional chronology was significantly correlated with annual mean temperature in all the periods after adjusting for one extreme value at year 1967 (p < 0.05).
3.2. Climate-Induced Tree Growth Forecast
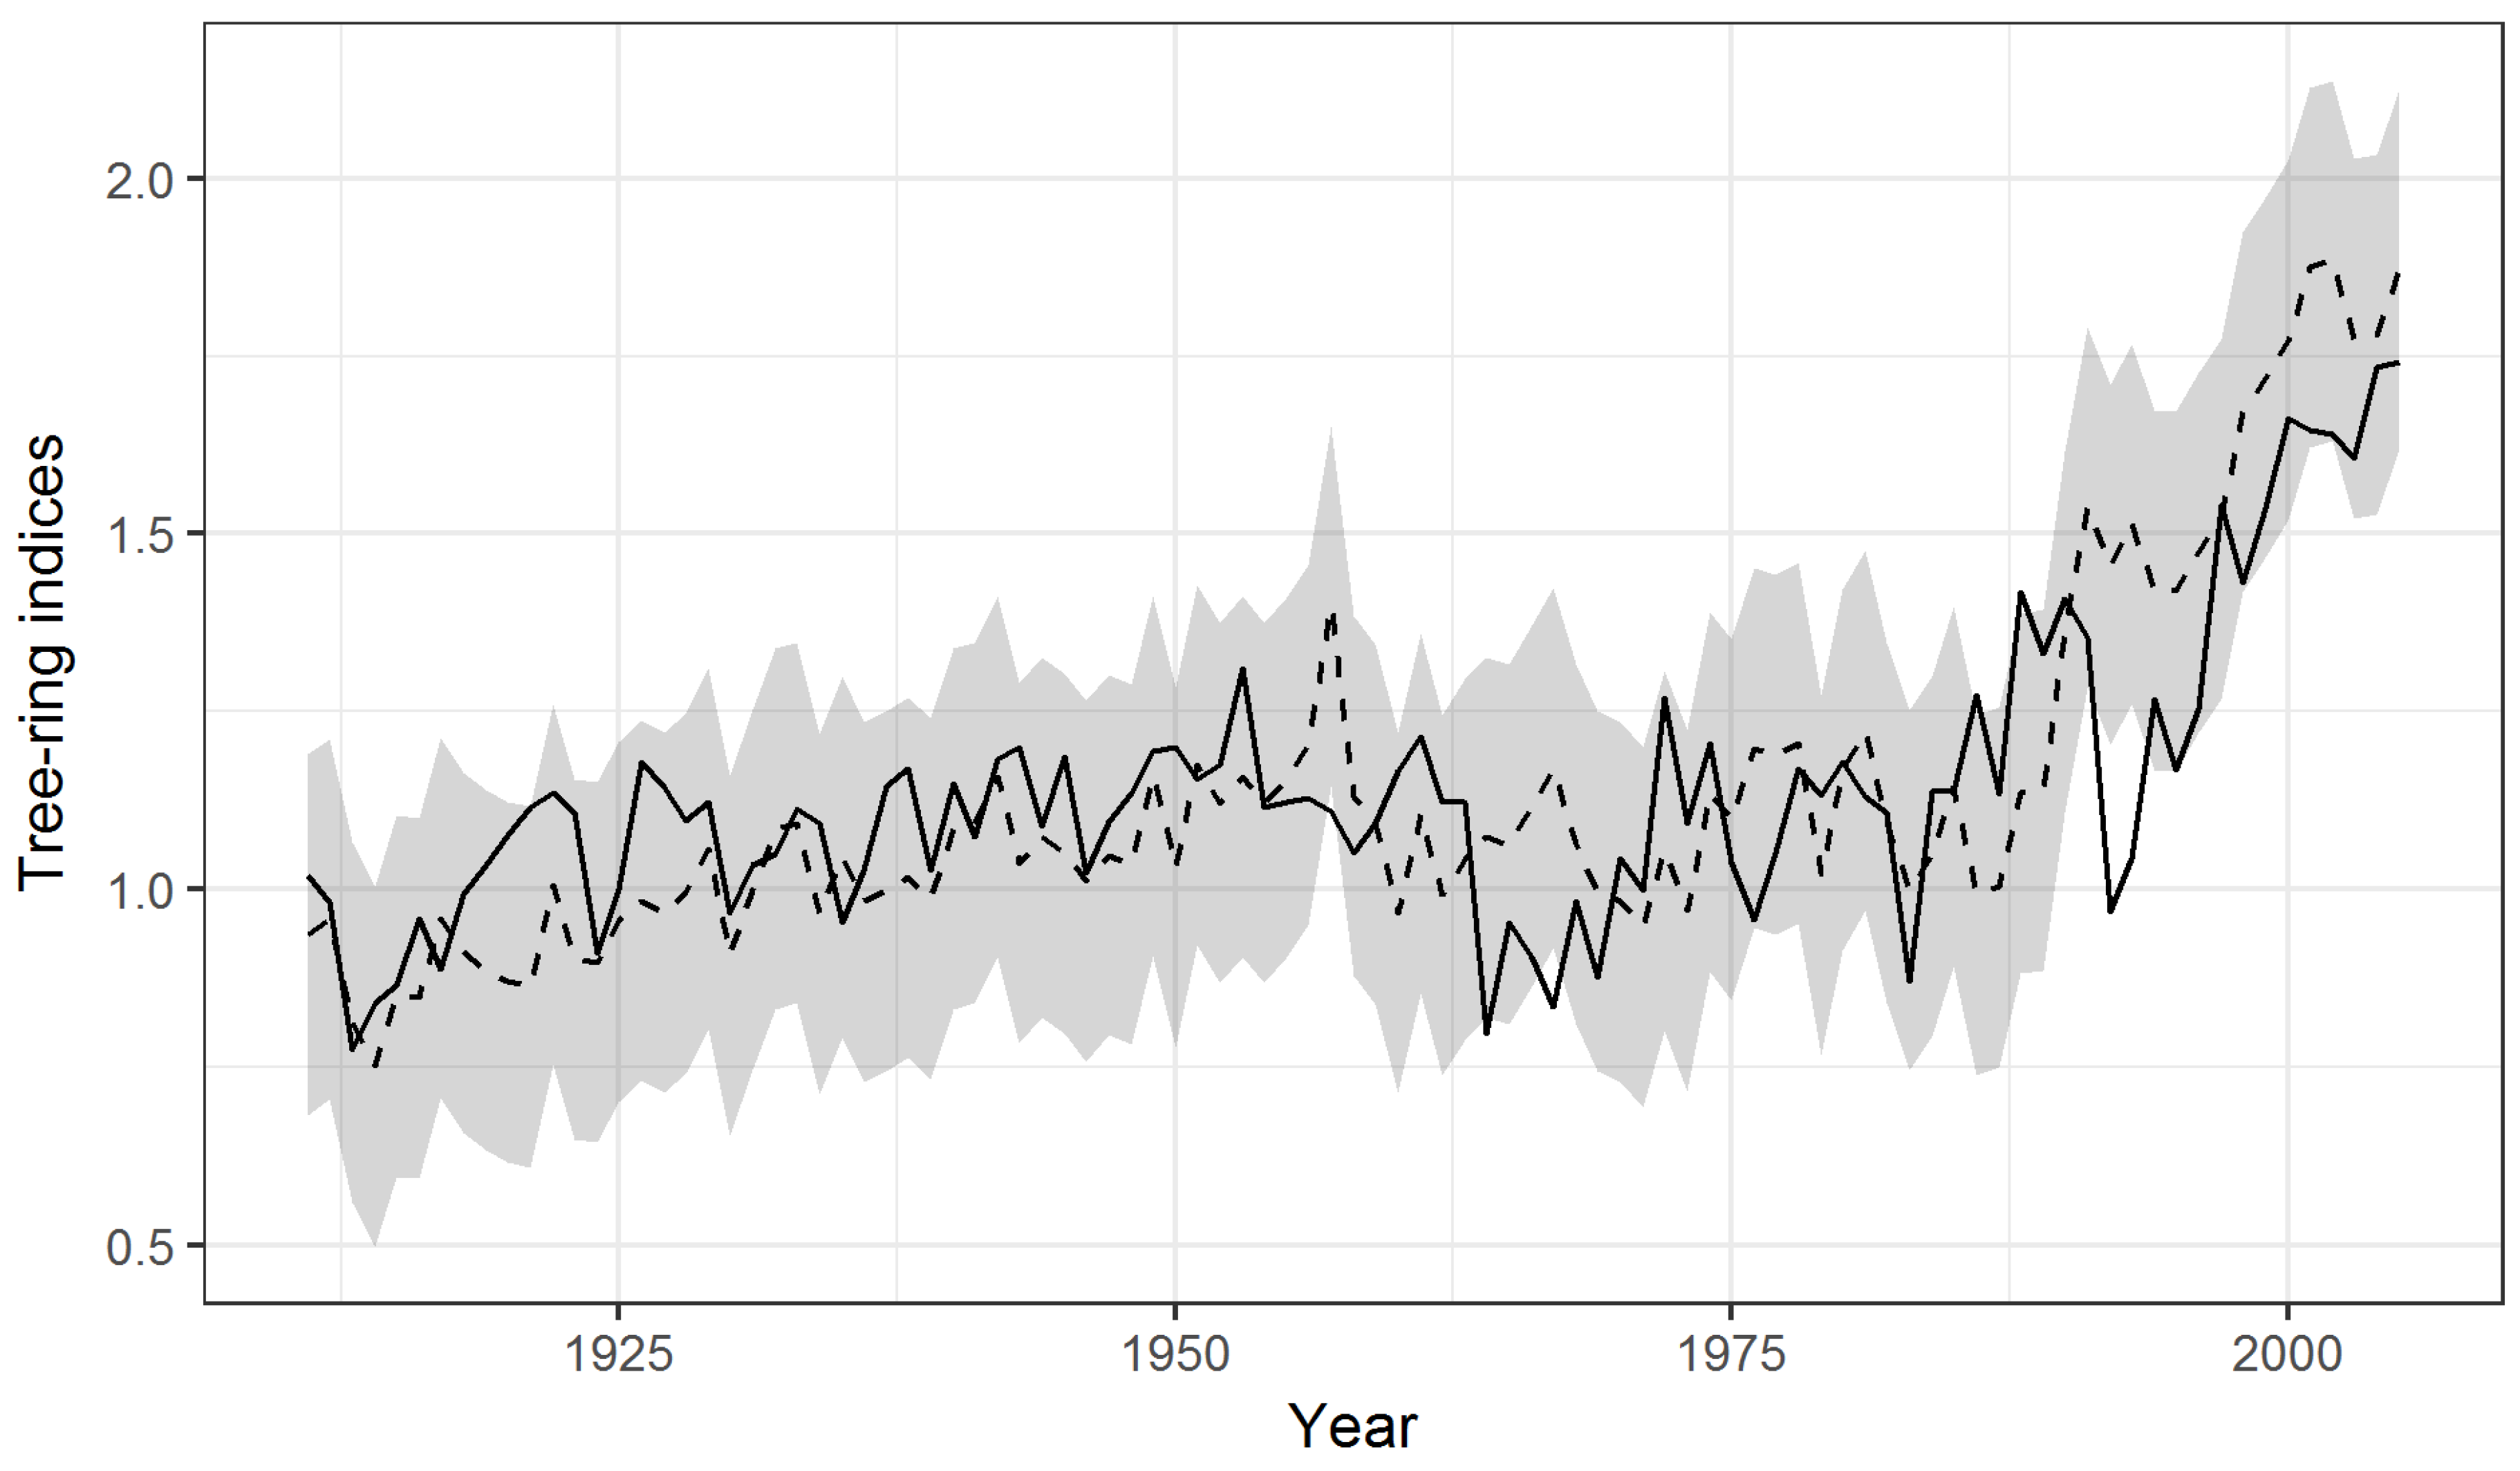
A simple regression formula (RMC = 0.468 + 0.871 RMT), where RMC is the regional mean chronology and RMT is the regional annual mean temperature, was built based on the climate–tree growth analysis. The regression model accounted for 62.5% of actual temperature variance from 1911–2005 (Figure 8). The correlation coefficients for split sample calibration-verification tests varied at the range from 0.64 to 0.79 in all the cross-validated periods (Table 3). Reduction of error (RE) and the coefficient of efficiency (CE) are common measures that can be used to evaluate the validity of this projection [13]. Both RE and CE were higher than zero, indicating the validation of the regression model.
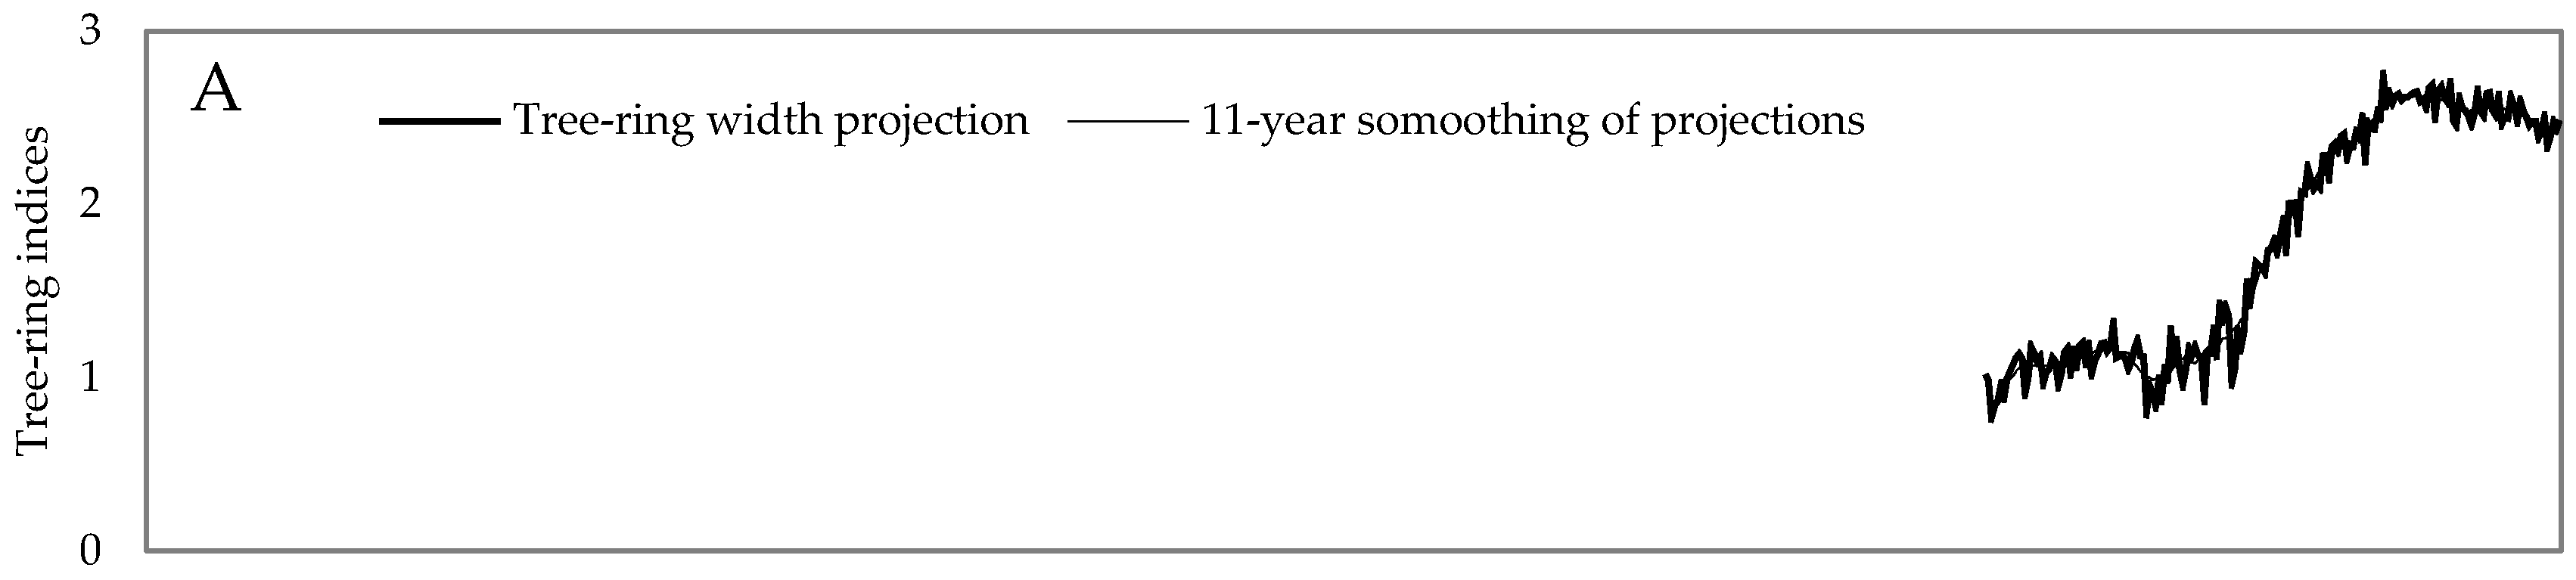
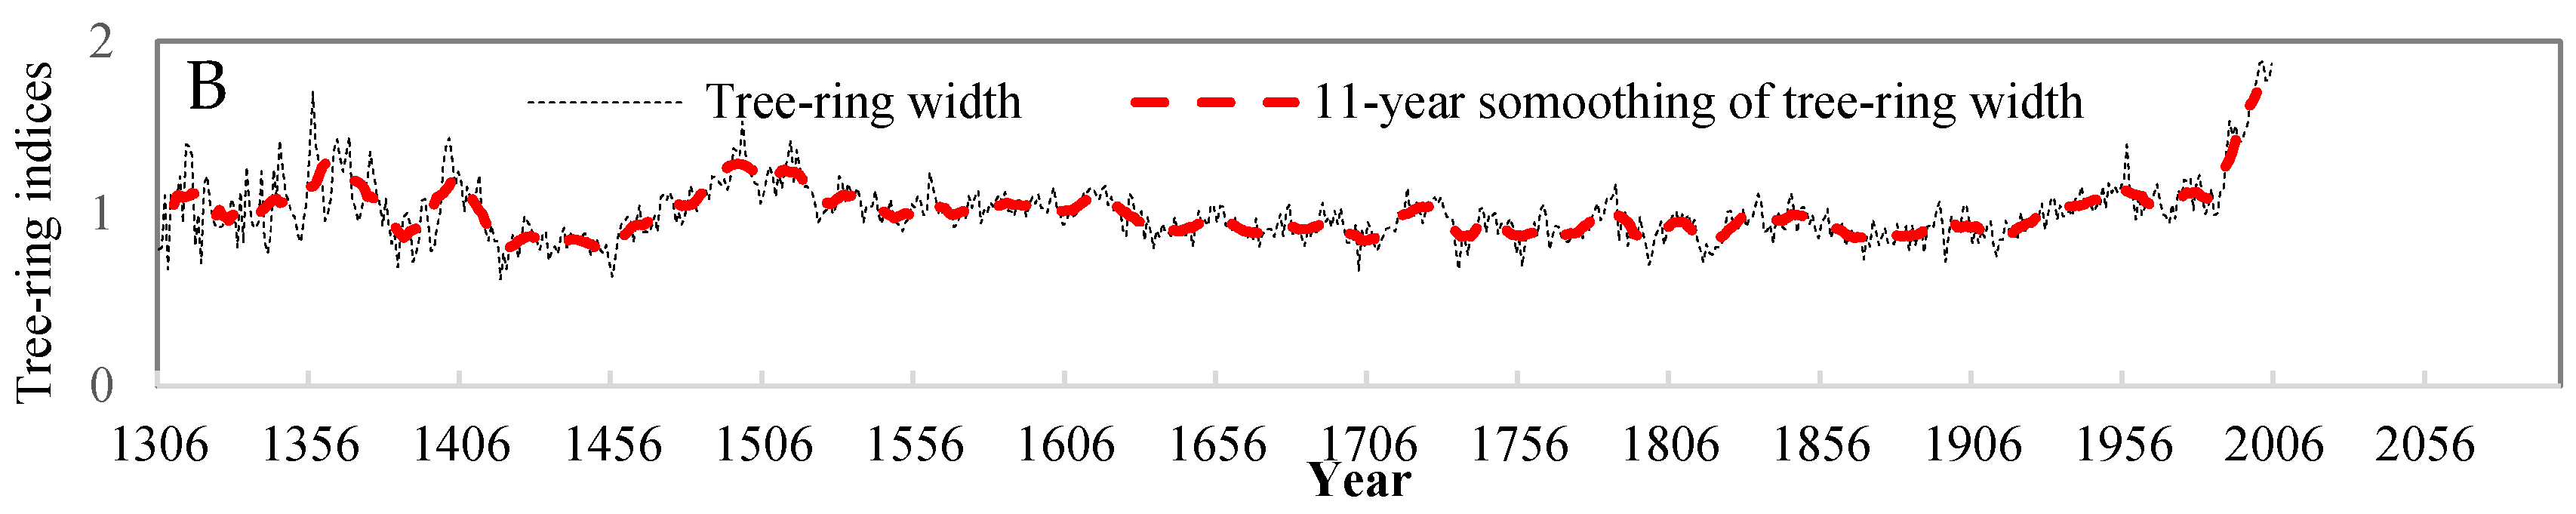
Verification of the regression model allowed for the projection of climate-induced radial tree growth for the period 2006–2100 under RCP 2.6 (Figure 9A). Radial tree growth showed a constant increasing trend from 2006 to 2045. However, a declining trend was found in radial tree growth from 2046 to 2100. Radial tree growth was unprecedented after 1998 when compared to growth over the prior 700 years (Figure 9B).
4. Discussion
We found it possible to project climate-induced radial tree growth under RCP 2.6 in this study. In the high-elevation regions, radial tree growth was generally limited by temperatures [34,35,36,37]. When tree growth is highly controlled by one climate factor, it is probable to forecast the climate-induced radial tree growth based on the relationship between them. In this study, the simulated regional mean annual temperature showed a high correlation coefficient with the regional mean chronology. The divergence problem, which is described as the reduced sensitivity of tree growth to climate changes in recent years [38,39], has been shown to affect the climate-induced radial tree growth forecast, because the relationship between climate and tree growth changes with the temporal shift. The divergence problem is mainly found in high altitude regions [40,41,42]. It should be highly noticeable when projecting the climate-induced tree growth in these regions. No divergence problem was reported on the southeastern Tibetan Plateau, as many climate reconstructions had been conducted in this region [14,15,16]. Thus, the climate-induced radial tree growth could be projected for this region.
We found that tree growth was more sensitive to temperature than precipitation was a result of tree growth being significantly correlated with temperature in ten months. Annual mean temperature was found to be the major limiting factor to tree growth in the study region. We also found that winter precipitation and May precipitation limited tree growth. The positive correlation between winter precipitation and tree growth might be explained by snow insulating soil from deep freezing during winter [9,10]. Our findings that cool temperatures limit tree growth more than precipitation is consistent with other studies in this region [12,13,14,15,16,17], underscoring the fact that the forest in our study region is a temperature-limited system.
Most trees used in this study were over 200 years old. Tree growth at an old age can be more limited by climate, as growth trend can be relatively more stable in old trees compared to younger trees [43,44,45,46]. Hence, our projections here might be biased towards old trees. In addition, despite the fact that some trees in this study might not be alive in 2100, there is a good chance that many trees would be alive because most species used in this study are long-lived species (e.g., Juniperus tibetica and Cunninghamia lanceolata). Thus, it seems less likely that tree age would have a substantial impact on the forecast of climate-induced tree growth.
Our forecast of climate-induced tree growth shows an increasing trend that generally tracks with the increment in temperature under RCP 2.6. The relationship between temperature and tree growth would not likely always be linear when experiencing drastic changes in temperature and, likely, other non-climate factors [47]. On one hand, however, temperature is expected to increase by about 2 °C in RCP 2.6. Temperatures in the past fifty years, however, have increased by more than 2 °C and no obvious change in the tree growth–climate relationship was found. On the other hand, tree growth was also influenced by other factors such as disturbances and insects [4,5]. There could be substantial error if tree growth was controlled by other factors. However, no severe disturbance and insect events were reported in the study region. It is hard to account for all of the factors impacting radial tree growth, but given that this is a temperature-limited system, limited by cool temperatures, it would seem that growth would be mainly determined by temperature under RCP 2.6 in the study region.
Restrictions of low temperature on tree growth could be alleviated with temperature increases in regions where low temperature was mainly found to be a major limited factor [40,41,42,48,49] and radial tree growth could be accelerated by increased temperatures in these regions [48,49,50]. The increases in biomass and forest productivity along with temperature increases have been detected in many forest types [48,49], and unprecedented tree growth in bristlecone pine was found in the highest elevations of western North America [48]. Forest productivity and biomass are expected to increase with the increased tree growth in these temperature-limited systems [51] and our study region might act as a climatic refugium with future warming [52]. However, our modeling effort produced declines in tree growth with temperature after ca. 2045, which might cause corresponding changes in forest productivity and biomass. Our analyses indicate that, while temperature is currently limiting, it could cross a crucial growth threshold and be a major factor in the potential decline of forest productivity. Continued work in this area, including greater sampling of representative forests rather than targeted sampling, will aid in improved forecasting and understanding of how forests on the Tibetan Plateau could change in the coming decades.
5. Conclusions
Climate-induced tree radial growth was projected based on the relationship between climate and tree growth under RCP 2.6. Tree radial growth would increase in the period 2006-2045, and decline after that period. A period of unprecedented radial tree growth was found after 1998 when compared with the tree growth in the past 700 years. It should be noted that the climate-induce tree growth could be only estimated for these trees which were sensitive to climate changes. Forest productivity and biomass are expected to change with the changed tree growth in these temperature-limited systems.
Acknowledgments
This work was funded by the National Natural Science Foundation of China (grant numbers: 41601045, 31570632, and 41571094).
Author Contributions
X.Z. and Z.C. conceived and designed the study. F.Z. contributed to data analyses. X.Z. was the principal writer of the paper, with the other authors contributing to the writing of the paper.
Conflicts of Interest
The authors declare no conflict of interest. The founding sponsors had no role in the design of the study; in the collection, analyses, or interpretation of data; in the writing of the manuscript, and in the decision to publish the results.
References
- Stocker, T.; Qin, D.; Plattner, G.; Tignor, M.; Allen, S.K.; Boschung, J.; Nauels, A.; Xia, Y.; Bex, V.; Midgley, P.M. Climate Change 2013: The Physical Science Basis; Cambridge University Press: Cambridge, UK; New York, NY, USA, 2014. [Google Scholar]
- Yan, L.; Liu, X. Has climatic warming over the Tibetan Plateau paused or continued in recent years. J. Earth Ocean Atmos. Sci. 2014, 1, 13–28. [Google Scholar]
- Linderholm, H.W. Growing season changes in the last century. Agric. For. Meteorol. 2006, 137, 1–14. [Google Scholar] [CrossRef]
- Ramsfield, T.D.; Bentz, B.J.; Faccoli, M.; Jactel, H.; Brockerhoff, E.G. Forest health in a changing world: Effects of globalization and climate change on forest insect and pathogen impacts. Forestry 2016, 89, 245–252. [Google Scholar] [CrossRef]
- Allen, C.D.; Macalady, A.K.; Chenchouni, H.; Bachelet, D.; McDowell, N.; Vennetier, M.; Kitzberger, T.; Rigling, A.; Breshears, D.D.; Hogg, E.T. A global overview of drought and heat-induced tree mortality reveals emerging climate change risks for forests. For. Ecol. Manag. 2010, 259, 660–684. [Google Scholar] [CrossRef]
- North, M.P.; Stephens, S.L.; Collins, B.M.; Agee, J.K.; Aplet, G.; Franklin, J.F.; Fulé, P.Z. Reform forest fire management. Science 2015, 349, 1280–1281. [Google Scholar] [CrossRef] [PubMed]
- Keenan, R.J. Climate change impacts and adaptation in forest management: A review. Ann. For. Sci. 2015, 72, 145–167. [Google Scholar] [CrossRef]
- Trumbore, S.; Brando, P.; Hartmann, H. Forest health and global change. Science 2015, 349, 814–818. [Google Scholar] [CrossRef] [PubMed]
- Fritts, H.C. Tree Rings and Climate; Academic Press: San Diego, CA, USA, 1976; 567p. [Google Scholar]
- Cook, E.R.; Kairiukstis, L.A. Methods of Dendrochronology: Applications in the Environmental Sciences; Springer: New York, NY, USA, 1990. [Google Scholar]
- Zhang, X.; Chen, Z. A new method to remove the tree growth trend based on ensemble empirical mode decomposition. Trees 2017, 31, 405–413. [Google Scholar] [CrossRef]
- Fan, Z.; Bräuning, A.; Cao, K. Annual temperature reconstruction in the Central Hengduan Mountains, China, as deduced from tree rings. Dendrochronologia 2008, 26, 97–107. [Google Scholar] [CrossRef]
- Zhang, X.; Yan, X.; Chen, Z. Reconstruct regional mean climate with Bayesian model averaging: A case study for temperature reconstruction in the Yunnan-Guizhou Plateau, China. J. Clim. 2016, 29, 5355–5361. [Google Scholar] [CrossRef]
- Fan, Z.; Bräuning, A.; Yang, B.; Cao, K. Tree ring density-based summer temperature reconstruction for the central Hengduan Mountains in southern China. Glob. Planet Chang. 2009, 65, 1–11. [Google Scholar] [CrossRef]
- Liang, E.Y.; Shao, X.M.; Xu, Y. Tree-ring evidence of recent abnormal warming on the southeast Tibetan Plateau. Theor. Appl. Climatol. 2009, 98, 9–18. [Google Scholar] [CrossRef]
- Yang, B.; Kang, X.C.; Bräuning, A.; Liu, J.; Qin, C.; Liu, J.J. A 622-year regional temperature history of southeast Tibet derived from tree rings. Holocene 2010, 20, 181–190. [Google Scholar] [CrossRef]
- Wang, J.; Bao, Y.; Qin, C.; Kang, S.; He, M.; Wang, Z. Tree-ring inferred annual mean temperature variations on the southeastern Tibetan Plateau during the last millennium and their relationships with the Atlantic Multidecadal Oscillation. Clim. Dynam. 2014, 43, 627–640. [Google Scholar] [CrossRef]
- Grotch, S.L.; Maccracken, M.C. The use of general circulation models to predict regional climatic change. J. Clim. 1991, 4, 286–303. [Google Scholar] [CrossRef]
- Gates, W.L. The use of general circulation models in the analysis of the ecosystem impacts of climatic change. Clim. Chang. 1985, 7, 267–284. [Google Scholar] [CrossRef]
- Robock, A.; Turco, R.P.; Harwell, M.A.; Ackerman, T.P.; Andressen, R.; Chang, H.S.; Sivakumar, M.V.K. Use of general circulation model output in the creation of climate change scenarios for impact analysis. Clim. Chang. 1993, 23, 293–335. [Google Scholar] [CrossRef]
- Vuuren, D.P.V.; Edmonds, J.; Kainuma, M.; Riahi, K.; Thomson, A.; Hibbard, K.; Hurtt, G.C.; Kram, T.; Krey, V.; Lamarque, J.F. The representative concentration pathways: An overview. Clim. Chang. 2011, 109, 5–31. [Google Scholar] [CrossRef]
- Meinshausen, M.; Smith, S.J.; Calvin, K.; Daniel, J.S.; Kainuma, M.L.T.; Lamarque, J.; Matsumoto, K.; Montzka, S.A.; Raper, S.C.B.; Riahi, K. The RCP greenhouse gas concentrations and their extensions from 1765 to 2300. Clim. Chang. 2011, 109, 213. [Google Scholar] [CrossRef]
- Zhang, X.; Yan, X.; Chen, Z. Geographic distribution of global climate zones under future scenarios. Int. J. Climatol. 2017. [Google Scholar] [CrossRef]
- Charney, N.D.; Babst, F.; Poulter, B.; Record, S.; Trouet, V.M.; Frank, D.; Enquist, B.J.; Evans, M.E.K. Observed forest sensitivity to climate implies large changes in 21st century North American forest growth. Ecol. Lett. 2016, 19, 1119–1128. [Google Scholar] [CrossRef] [PubMed]
- Dunckel, K.; Weiskittel, A.; Fiske, G. Projected future distribution of tsuga canadensis across alternative climate scenarios in Maine, US. Forests 2017, 8, 285. [Google Scholar] [CrossRef]
- Girardin, M.P.; Hogg, E.H.; Bernier, P.Y.; Kurz, W.A.; Guo, X.J.; Cyr, G. Negative impacts of high temperatures on growth of black spruce forests intensify with the anticipated climate warming. Glob. Chang. Biol. 2016, 22, 627–643. [Google Scholar] [CrossRef] [PubMed]
- Zhang, X.; Yan, X. Temporal change of climate zones in China in the context of climate warming. Theor. Appl. Climatol. 2014, 115, 167–175. [Google Scholar] [CrossRef]
- Zhang, X.; Yan, X. A novel method to improve temperature simulations of general circulation models based on ensemble empirical mode decomposition and its application to multi-model ensembles. Tellus A 2014, 66. [Google Scholar] [CrossRef] [Green Version]
- Zhang, X.; Xiong, Z.; Zhang, X.; Shi, Y.; Liu, J.; Shao, Q.; Yan, X. Using multi-model ensembles to improve the simulated effects of land use/cover change on temperature: A case study over northeast China. Clim. Dynam. 2016, 46, 765–778. [Google Scholar] [CrossRef]
- Grissinomayer, H.D.; Fritts, H.C. The international tree-ring data bank: An enhanced global database serving the global scientific community. Holocene 1997, 7, 235–238. [Google Scholar] [CrossRef]
- Melvin, T.M.; Briffa, K.R. A “signal-free” approach to dendroclimatic standardisation. Dendrochronologia 2008, 26, 71–86. [Google Scholar] [CrossRef]
- Biondi, F.; Waikul, K. DENDROCLIM2002: A C++ program for statistical calibration of climate signals in tree-ring chronologies. Comput. Geosci. 2004, 30, 303–311. [Google Scholar] [CrossRef]
- Gershunov, A.; Schneider, N.; Barnett, T. Low-frequency modulation of the Enso-Indian monsoon rainfall relationship: Signal or noise? J. Clim. 2001, 14, 2486–2492. [Google Scholar] [CrossRef]
- Frank, D.; Esper, J. Characterization and climate response patterns of a high-elevation, multi-species tree-ring network in the European Alps. Dendrochronologia 2005, 22, 107–121. [Google Scholar] [CrossRef]
- Büntgen, U.; Esper, J.; Frank, D.C.; Nicolussi, K.; Schmidhalter, M. A 1052-year tree-ring proxy for Alpine summer temperatures. Clim. Dynam. 2005, 25, 141–153. [Google Scholar] [CrossRef]
- Büntgen, U.; Frank, D.C.; Kaczka, R.J.; Verstege, A.; Zwijacz-Kozica, T.; Esper, J. Growth responses to climate in a multi-species tree-ring network in the Western Carpathian Tatra Mountains, Poland and Slovakia. Tree Physiol. 2007, 27, 689–702. [Google Scholar] [CrossRef] [PubMed]
- Salzer, M.W.; Bunn, A.G.; Graham, N.E.; Hughes, M.K. Five millennia of paleotemperature from tree-rings in the Great Basin, USA. Clim. Dynam. 2014, 42, 1517–1526. [Google Scholar] [CrossRef]
- Briffa, K.R.; Schweingruber, F.H.; Jones, P.D.; Osborn, T.J.; Shiyatov, S.G.; Vaganov, E.A. Reduced sensitivity of recent tree-growth to temperature at high northern latitudes. Nature 1998, 391, 678–682. [Google Scholar] [CrossRef]
- D’Arrigo, R.; Wilson, R.; Liepert, B.; Cherubini, P. On the ‘divergence problem’ in northern forests: A review of the tree-ring evidence and possible causes. Glob. Planet Chang. 2008, 60, 289–305. [Google Scholar] [CrossRef]
- Wilson, R.; D’Arrigo, R.; Buckley, B.; Büntgen, U.; Esper, J.; Frank, D.; Luckman, B.; Payette, S.; Vose, R.; Youngblut, D. A matter of divergence: Tracking recent warming at hemispheric scales using tree ring data. J. Geophys. Res. 2007, 112. [Google Scholar] [CrossRef]
- Büntgen, U.; Frank, D.; Wilson, R.; Carrer, M.; Urbinati, C.; Esper, J. Testing for tree-ring divergence in the European Alps. Glob. Chang. Biol. 2008, 14, 2443–2453. [Google Scholar] [CrossRef]
- Schneider, L.; Esper, J.; Timonen, M.; Büntgen, U. Detection and evaluation of an early divergence problem in northern Fennoscandian tree-ring data. Oikos 2014, 123, 559–566. [Google Scholar] [CrossRef]
- Carrer, M.; Urbinati, C. Age-dependent tree-ring growth responses to climate in Larix decidua and Pinus cembra. Ecology 2004, 85, 730–740. [Google Scholar] [CrossRef]
- Vieira, J.; Campelo, F.; Nabais, C. Age-dependent responses of tree-ring growth and intra-annual density fluctuations of Pinus pinaster to Mediterranean climate. Trees 2009, 23, 257–265. [Google Scholar] [CrossRef]
- Rozas, V.; DeSoto, L.; Olano, J.M. Sex-specific, age-dependent sensitivity of tree-ring growth to climate in the dioecious tree Juniperus thurifera. New Phytol. 2009, 182, 687–697. [Google Scholar] [CrossRef] [PubMed]
- Wang, X.; Zhang, Y.; McRae, D.J. Spatial and age-dependent tree-ring growth responses of Larix gmelinii to climate in northeastern China. Trees 2009, 23, 875–885. [Google Scholar] [CrossRef]
- Soja, A.J.; Tchebakova, N.M.; French, N.H.; Flannigan, M.D.; Shugart, H.H.; Stocks, B.J.; Sukhinin, A.I.; Parfenova, E.I.; Chapin, F.S.; Stackhouse, P.W. Climate-induced boreal forest change: Projections versus current observations. Glob. Planet Chang. 2007, 56, 274–296. [Google Scholar] [CrossRef]
- Salzer, M.W.; Hughes, M.K.; Bunn, A.G.; Kipfmueller, K.F. Recent unprecedented tree-ring growth in bristlecone pine at the highest elevations and possible causes. Proc. Natl. Acad. Sci. USA 2009, 106, 20348–20353. [Google Scholar] [CrossRef] [PubMed]
- McMahon, S.M.; Parker, G.G.; Miller, D.R. Evidence for a recent increase in forest growth. Proc. Natl. Acad. Sci. USA 2010, 107, 3611–3615. [Google Scholar] [CrossRef] [PubMed]
- Reich, P.B.; Luo, Y.; Bradford, J.B.; Poorter, H.; Perry, C.H.; Oleksyn, J. Temperature drives global patterns in forest biomass distribution in leaves, stems, and roots. Proc. Natl. Acad. Sci. USA 2014, 111, 13721–13726. [Google Scholar] [CrossRef] [PubMed]
- Rytter, L.; Ingerslev, M.; Kilpeläinen, A.; Torssonen, P.; Lazdina, D.; Löf, M.; Madsen, P.; Muiste, P.; Stener, L. Increased forest biomass production in the Nordic and Baltic countries—A review on current and future opportunities. Silva Fenn 2016, 50. [Google Scholar] [CrossRef]
- D’Orangeville, L.; Duchesne, L.; Houle, D.; Kneeshaw, D.; Côté, B.; Pederson, N. Northeastern North America as a potential refugium for boreal forests in a warming climate. Science 2016, 352, 1452–1455. [Google Scholar] [CrossRef] [PubMed]
Figure 1.
Locations of tree-ring sample sites and weather stations.
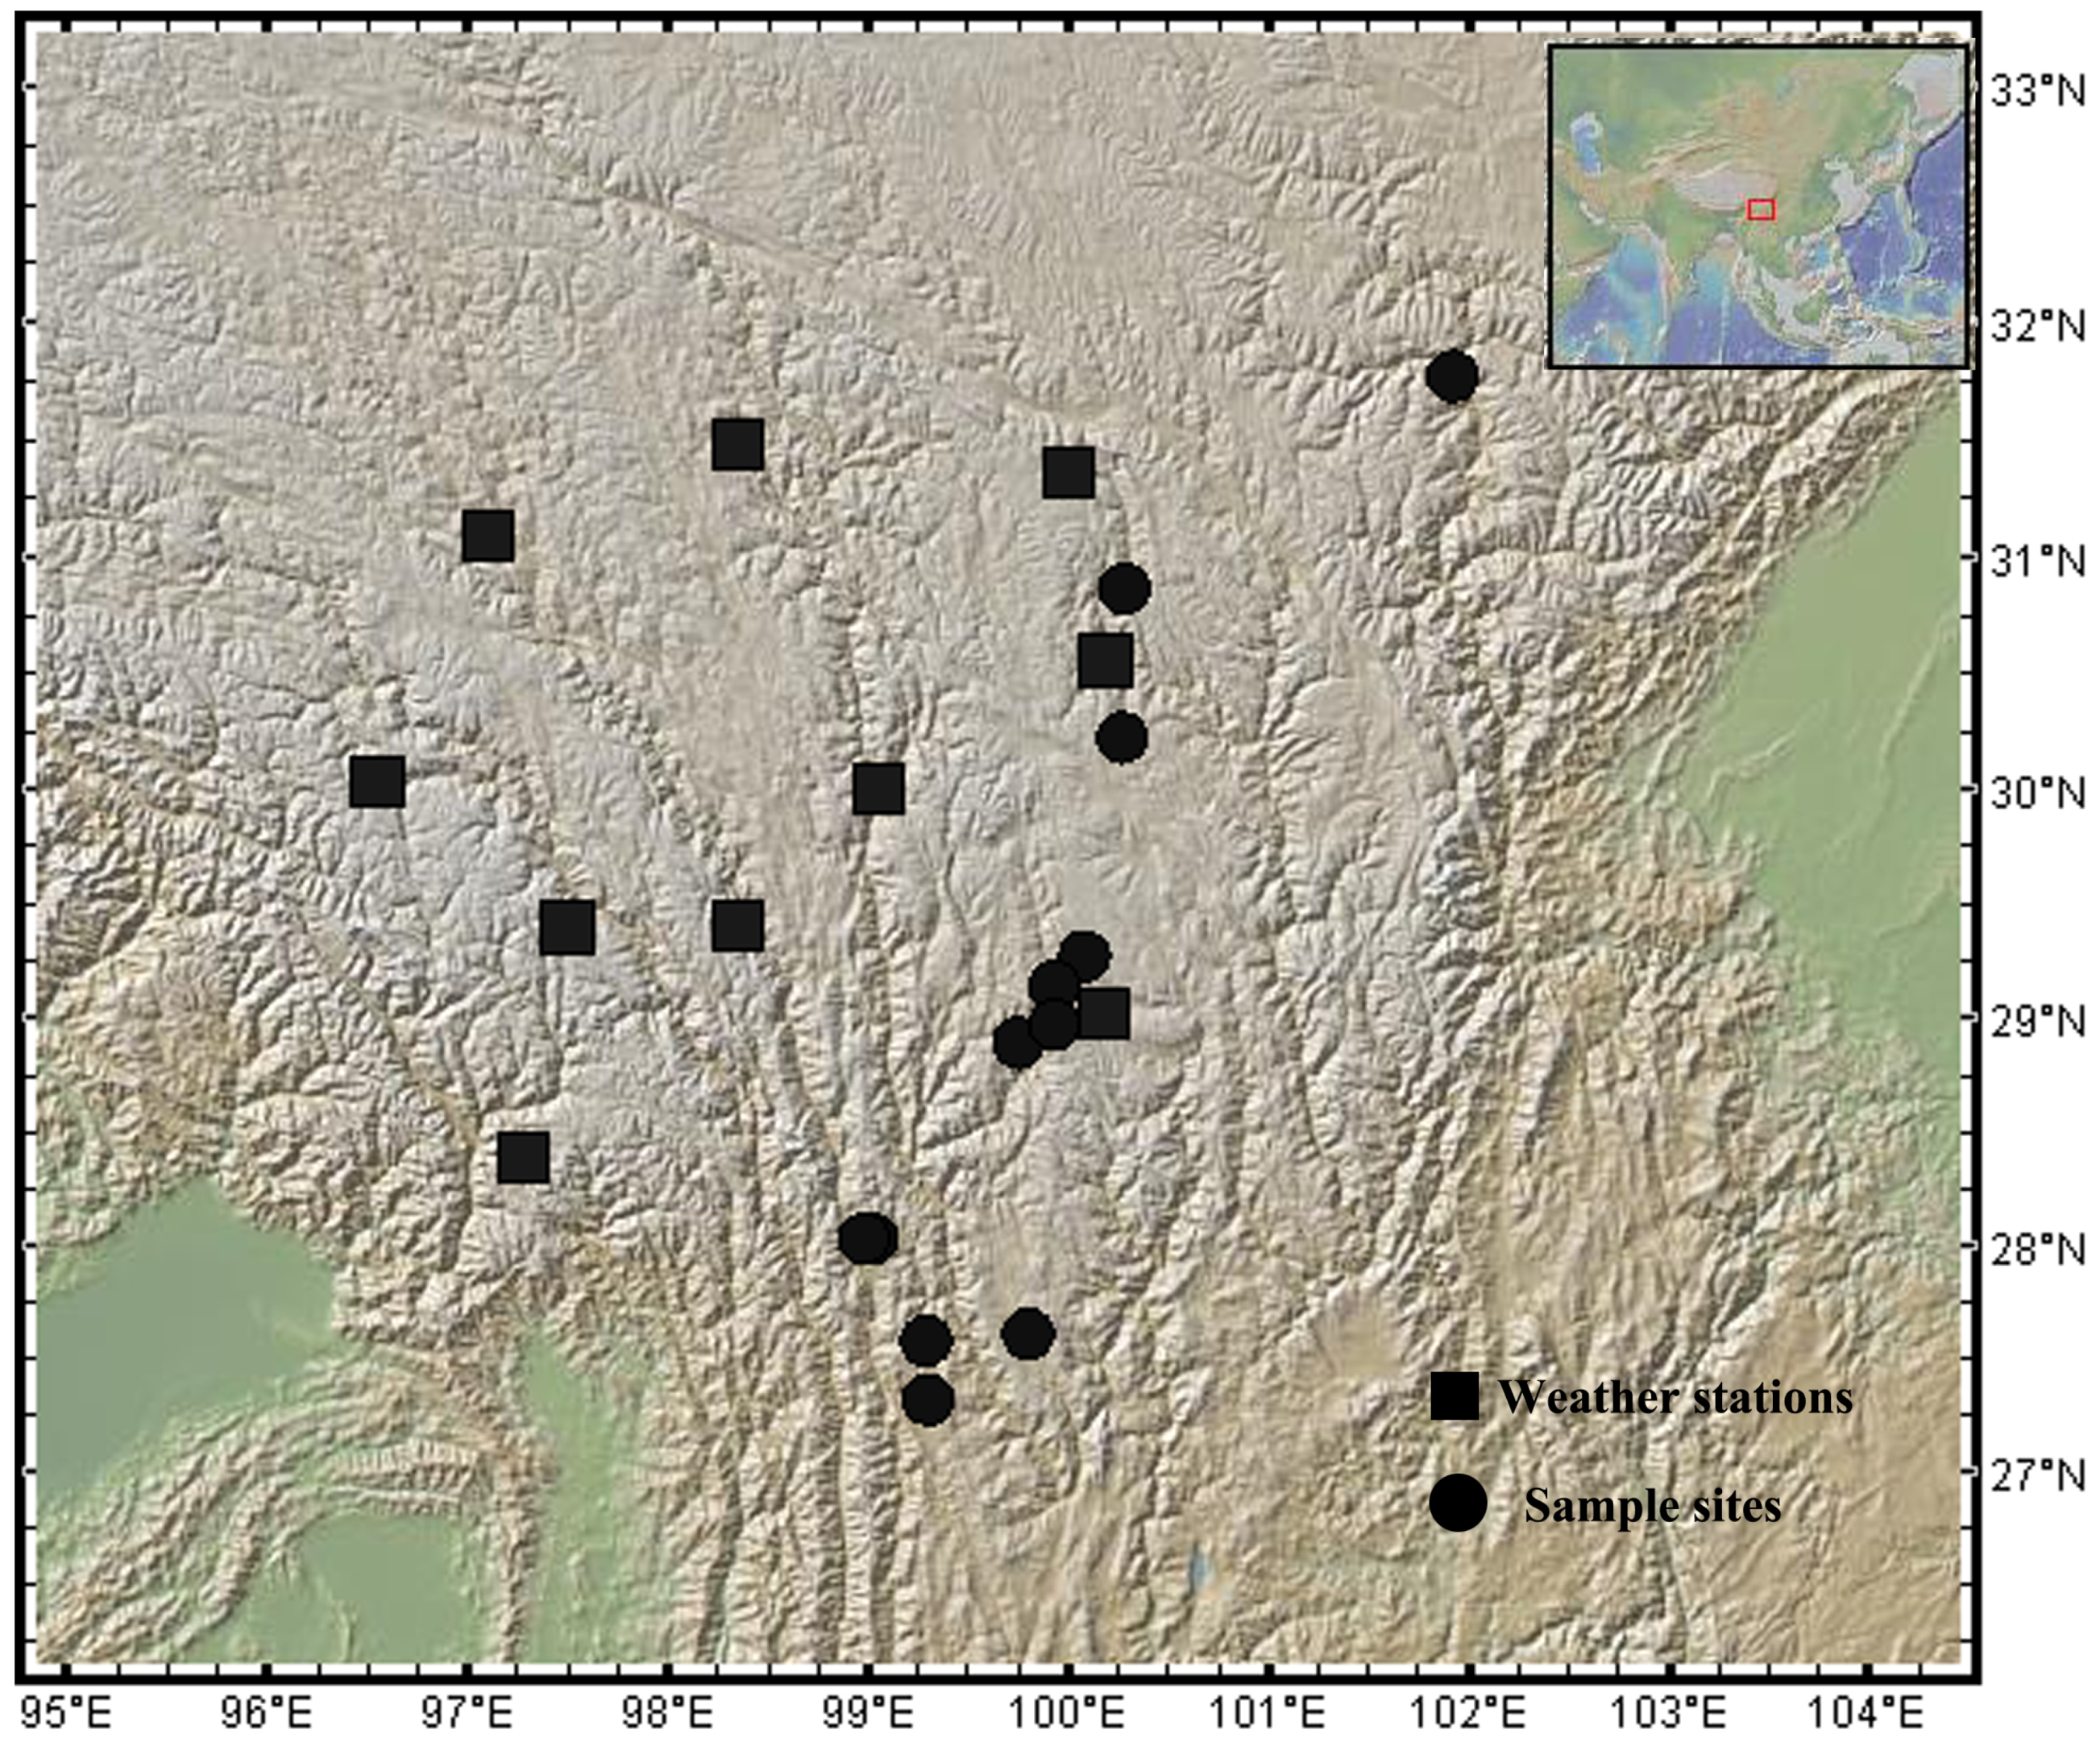
Figure 2.
Regional mean monthly temperature (TEM) and precipitation (PRE) obtained with climate data from nearby meteorological stations from 1966 to 2005.
Figure 2.
Regional mean monthly temperature (TEM) and precipitation (PRE) obtained with climate data from nearby meteorological stations from 1966 to 2005.

Figure 3.
Comparison of simulated annual mean temperature and observed annual mean temperature from 1960 to 2005.
Figure 3.
Comparison of simulated annual mean temperature and observed annual mean temperature from 1960 to 2005.

Figure 4.
Correlation coefficients between the signal-free chronologies from 1911 to 2005. The white color indicates that the Pearson’s correlation was non-significant (p > 0.05).
Figure 4.
Correlation coefficients between the signal-free chronologies from 1911 to 2005. The white color indicates that the Pearson’s correlation was non-significant (p > 0.05).
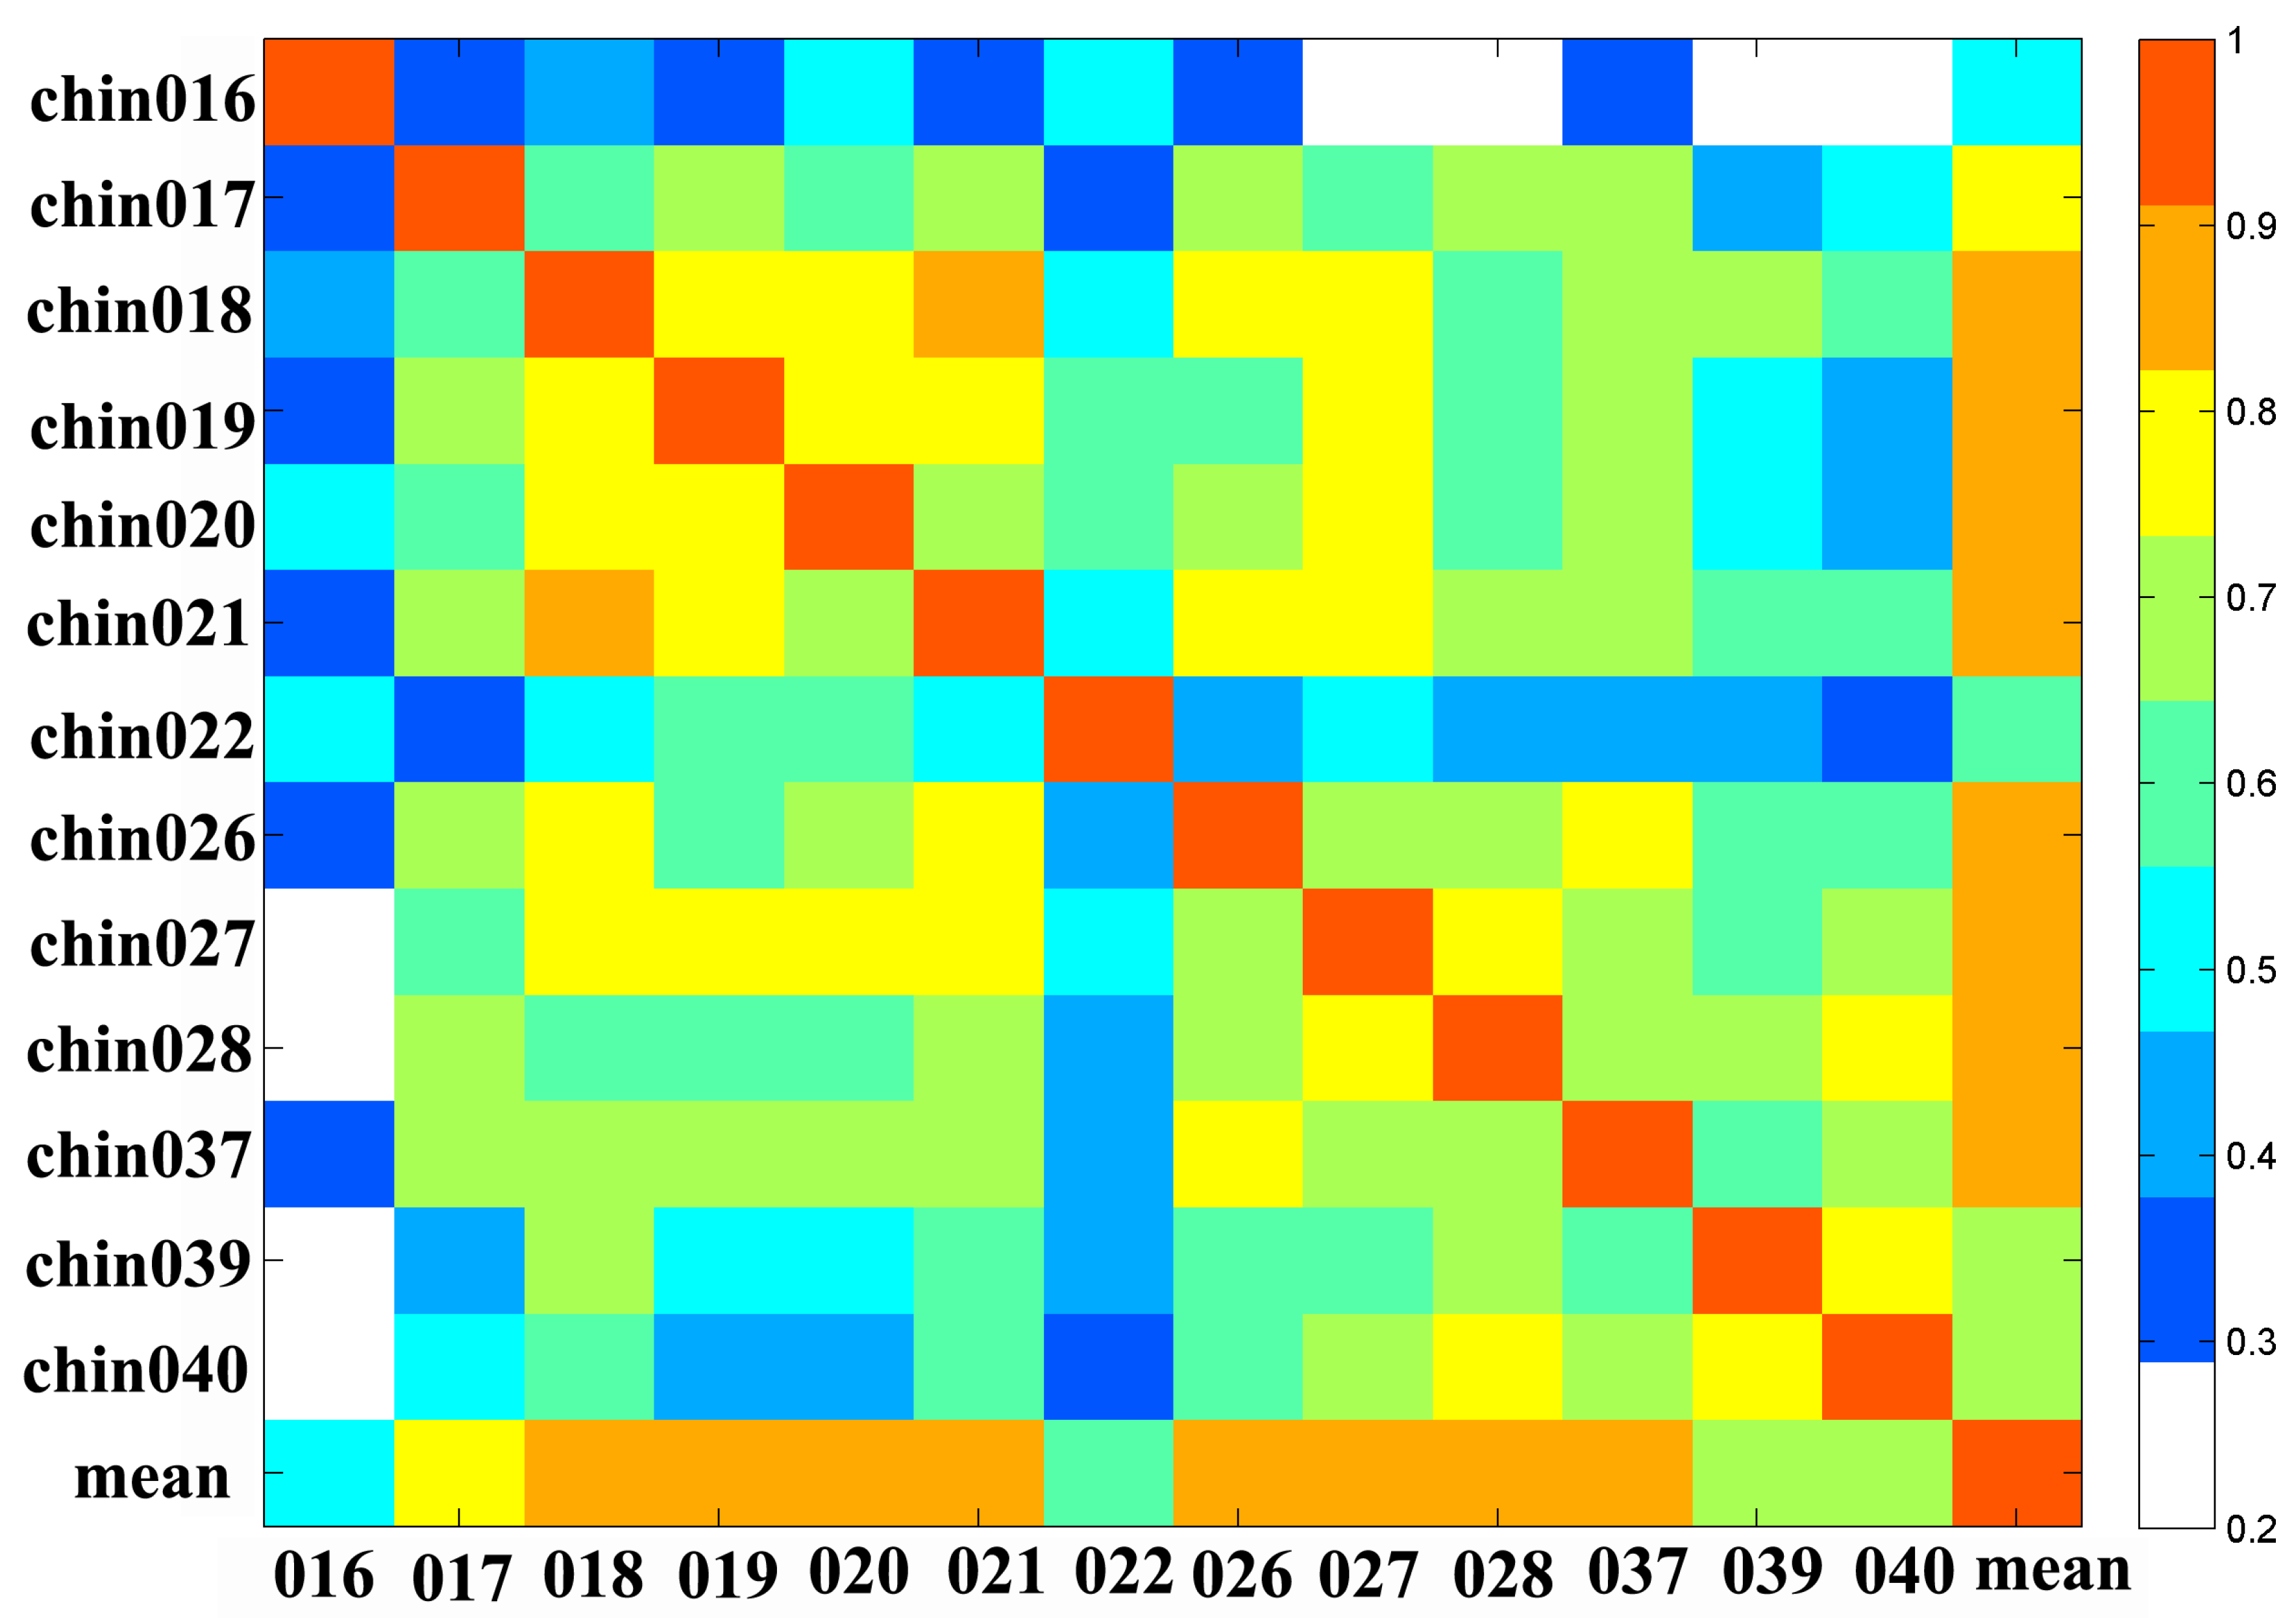
Figure 5.
Correlation coefficients between regional mean chronology and the observed regional mean temperature (TEM) and precipitation (PRE) at each month for the common period 1957–2005.
Figure 5.
Correlation coefficients between regional mean chronology and the observed regional mean temperature (TEM) and precipitation (PRE) at each month for the common period 1957–2005.

Figure 6.
Correlation coefficients between regional mean signal-free chronology and simulated regional mean temperature (GCMs) at each month for the common period 1911–2005.
Figure 6.
Correlation coefficients between regional mean signal-free chronology and simulated regional mean temperature (GCMs) at each month for the common period 1911–2005.

Figure 7.
Tree growth–temperature relationship through time when tested with 70-year intervals (solid line). The dashed line represents the tree growth–climate relationship when adjusting for the extreme value at year 1967.
Figure 7.
Tree growth–temperature relationship through time when tested with 70-year intervals (solid line). The dashed line represents the tree growth–climate relationship when adjusting for the extreme value at year 1967.

Figure 8.
Comparison of the projected (dashed line) and actual (solid line) tree-ring chronology for the common period 1911–2005. Grey area indicates the uncertainty (±1 root mean squared error) in the projected climate-induced tree growth.
Figure 8.
Comparison of the projected (dashed line) and actual (solid line) tree-ring chronology for the common period 1911–2005. Grey area indicates the uncertainty (±1 root mean squared error) in the projected climate-induced tree growth.

Figure 9.
Regional mean tree-ring chronology projection from 2006 to 2100 under RCP 2.6 (A) and regional mean tree-ring indices from 1306 to 2005 (B).
Figure 9.
Regional mean tree-ring chronology projection from 2006 to 2100 under RCP 2.6 (A) and regional mean tree-ring indices from 1306 to 2005 (B).


Table 1.
Information for the general circulation models (GCMs) used in this study.
| Model Name | Atmospheric Resolution | Country/Institute |
|---|---|---|
| BCC-CSM1-1-m | 360 × 160 | China/Beijing Climate Center |
| BCC-CSM1-1 | 128 × 64 | China/Beijing Climate Center |
| BNU-ESM | 128 × 64 | China/Beijing Normal University |
| CanESM2 | 128 × 64 | Canada/Canadian Centre for Climate Modelling and Analysis |
| CCSM4 | 288 × 192 | USA/National Center for Atmospheric Research |
| CESM1-CAM5 | 288 × 192 | USA/National Center for Atmospheric Research |
| CNRM-CM5 | 256 × 128 | France/Centre National de Recherches Meteorologiques |
| CSIRO-Mk3-6-0 | 192 × 96 | Australia/Commonwealth Scientific and Industrial Research Organisation |
| EC-EARTH | 320 × 160 | EC-EARTH consortium |
| FGOALS-g2 | 128 × 60 | China/Institute of Atmospheric Physics |
| FIO-ESM | 128 × 64 | The First Institute of Oceanography, China |
| GFDL-CM3 | 144 × 90 | USA/Geophysical Fluid Dynamics Laboratory |
| GFDL-ESM2G | 144 × 90 | USA/Geophysical Fluid Dynamics Laboratory |
| GFDL-ESM2M | 144 × 90 | USA/Geophysical Fluid Dynamics Laboratory |
| GISS-E2-H | 144 × 90 | USA/NASA Goddard Institute for Space Studies |
| GISS-E2-R | 144 × 90 | USA/NASA Goddard Institute for Space Studies |
| HadGEM2-AO | 192 × 145 | UK/Met Office Hadley Centre |
| HadGEM2-ES | 192 × 145 | UK/Met Office Hadley Centre |
| IPSL-CM5A-LR | 96 × 96 | France/Institut Pierre-Simon Laplace |
| IPSL-CM5A-MR | 96 × 96 | France/Institut Pierre-Simon Laplace |
| MIROC5 | 256 × 128 | Japan/Atmosphere and Ocean Research Institute, National Institute for Environmental Studies, and Japan Agency for Marine-Earth Science and Technology |
| MIROC-ESM | 128 × 64 | Japan/Japan Agency for Marine-Earth Science and Technology, Atmosphere and Ocean Research Institute, and National Institute for Environmental Studies |
| MIROC-ESM-CHEM | 128 × 64 | Japan/Japan Agency for Marine-Earth Science and Technology, Atmosphere and Ocean Research Institute, and National Institute for Environmental Studies |
| MPI-ESM-LR | 192 × 96 | Germany/Max Planck Institute for Meteorology |
| MPI-ESM-MR | 192 × 96 | Germany/Max Planck Institute for Meteorology |
| MRI-CGCM3 | 320 × 160 | Japan/Meteorological Research Institute |
| NORESM1-M | 144 × 96 | Norway/Norwegian Climate Centre |
| NORESM1-ME | 144 × 96 | Norway/Norwegian Climate Centre |
Table 2.
Summary of tree-ring samples.
| ID | Site Name | Latitude | Longitude | Elevation (m) | Species | Number of Series | Time Span |
|---|---|---|---|---|---|---|---|
| chin016 | Ma’Erkang | 31.78°N | 101.92 °E | 2500 | Cupressus chengiana | 40 | 1575–2007 |
| chin017 | Xiangcheng | 28.90°N | 99.75°E | 3980 | Juniperus tibetica | 43 | 1452–2007 |
| chin018 | Daocheng | 29.28°N | 100.08°E | 4150 | Cunninghamia lanceolata | 61 | 1540–2006 |
| chin019 | Xiangcheng | 29.15°N | 99.93°E | 3530 | Cunninghamia lanceolata | 56 | 1509–2006 |
| chin020 | Litang | 30.23°N | 100.27°E | 4050 | Juniperus tibetica | 44 | 1306–2007 |
| chin021 | Xiangcheng | 28.98°N | 99.93°E | 3750 | Cunninghamia lanceolata | 48 | 1380–2007 |
| chin022 | Xinlong County | 30.87°N | 100.28°E | 3300 | Picea likiangensis | 42 | 1663–2007 |
| chin026 | Shangri La | 27.62°N | 99.80°E | 3500 | Cunninghamia lanceolata | 67 | 1516–2007 |
| chin027 | Weixi County | 27.33°N | 99.3°E | 3040 | Cunninghamia lanceolata | 41 | 1348–2007 |
| chin028 | Weixi County | 27.33°N | 99.3°E | 3060 | Cunninghamia lanceolata | 43 | 1348–2007 |
| chin037 | Hengduan Mountains | 27.58°N | 99.35°E | 3240 | Picea likiangensis | 40 | 1429–2005 |
| chin039 | Hengduan Mountains | 28.04°N | 99.02°E | 3200 | Abies recurvata | 19 | 1489–2005 |
| chin040 | Hengduan Mountains | 28.04°N | 98.98°E | 3100 | Tsuga dumosa | 30 | 1393–2005 |
Table 3.
Statistic of split sample calibration-verification test. R: correlation coefficient; R2: the proportion of variance explained by the regression model; RE: reduction of error; CE: coefficient of efficiency.
Table 3.
Statistic of split sample calibration-verification test. R: correlation coefficient; R2: the proportion of variance explained by the regression model; RE: reduction of error; CE: coefficient of efficiency.
| Calibration (1911–1957) | Verification (1958–2005) | Calibration (1958–2005) | Verification (1911–1957) | Final Calibration (1911–2005) | |
|---|---|---|---|---|---|
| R | 0.637 | 0.789 | 0.789 | 0.637 | 0.791 |
| R2 | 40.5% | 62.2% | 62.2% | 40.5% | 62.6% |
| RE | - | 0.725 | - | 0.830 | - |
| CE | - | 0.515 | - | 0.055 | - |
© 2017 by the authors. Licensee MDPI, Basel, Switzerland. This article is an open access article distributed under the terms and conditions of the Creative Commons Attribution (CC BY) license (http://creativecommons.org/licenses/by/4.0/).
Share and Cite
MDPI and ACS Style
Zhang, X.; Zou, F.; Chen, Z. Climate-Induced Tree Growth Variations under the RCP 2.6 Scenario: A Case Study on the Southeastern Tibetan Plateau. Forests 2017, 8, 359. https://doi.org/10.3390/f8100359
AMA Style
Zhang X, Zou F, Chen Z. Climate-Induced Tree Growth Variations under the RCP 2.6 Scenario: A Case Study on the Southeastern Tibetan Plateau. Forests. 2017; 8(10):359. https://doi.org/10.3390/f8100359
Chicago/Turabian StyleZhang, Xianliang, Fenghua Zou, and Zhenju Chen. 2017. "Climate-Induced Tree Growth Variations under the RCP 2.6 Scenario: A Case Study on the Southeastern Tibetan Plateau" Forests 8, no. 10: 359. https://doi.org/10.3390/f8100359
Note that from the first issue of 2016, this journal uses article numbers instead of page numbers. See further details here.