Article

Transcriptome Characterization of the Chinese Fir (Cunninghamia lanceolata (Lamb.) Hook.) and Expression Analysis of Candidate Phosphate Transporter Genes

1
College of Forestry, Fujian Agriculture and Forestry University, Fuzhou 350002, China
2
Department of Botany, University of Wisconsin-Madison, Madison, WI 53706, USA
*
Author to whom correspondence should be addressed.
Forests 2017, 8(11), 420; https://doi.org/10.3390/f8110420
Submission received: 31 August 2017 / Revised: 21 October 2017 / Accepted: 31 October 2017 / Published: 3 November 2017

Abstract

:
Chinese fir (Cunninghamia lanceolata (Lamb.) Hook.) is the most important afforestation tree species in China because of its excellent timber quality and high yield. However, the limited availability of phosphorus in forest soils is widespread and has become an important factor in the declining productivity of Chinese fir plantations. Here we used the Illumina HiSeq™ 2000 DNA sequencing platform to sequence root, stem, and leaf transcriptomes of one-year old Chinese fir clones with phosphorus treatment. Approximately 236,529,278 clean reads were obtained and generated 35.47 G of sequencing data. These reads were assembled into 413,806 unigenes with a mean length of 520 bp. In total, 109,596 unigenes were annotated in the NR (NCBI non-redundant) database, 727,287 genes were assigned for GO (Gene Ontology) terms, information for 92,001 classified unigenes was assigned to 26 KOG (Karyotic Orthologous Groups) categories, and 57,042 unigenes were significantly matched with 132 KEGG (Kyoto Encyclopedia of Genes and Genomes) predicted pathways. In total, 49 unigenes were identified as exhibiting inorganic phosphate transporter activity, and 14 positive genes’ expression patterns in different phosphorus deficiency treatments were analyzed by qRT-PCR to explore their putative functions. This study provides a basic foundation for functional genomic studies of the phosphate transporter in Chinese fir, and also presents an extensive annotated sequence resource for molecular research.

1. Introduction

Chinese fir (Cunninghamia lanceolata (Lambert) Hooker) is an evergreen coniferous tree species that is primarily distributed in southern China and northern Vietnam [1,2]. It is the most commercially important afforestation tree species in China and is known for its rapid growth rate, high yield, and excellent timber quality [3,4,5]. The Chinese fir has been widely planted across southern China with a planting history spanning more than 1000 years, and it accounts for 24% of all forested land in China [6]. Because of its fast-growing characteristics, the Chinese fir has a high nutrient requirement for its optimal growth, especially of phosphorus (P) [7,8]. However, most of the Chinese fir plantations that have been established are deficient in available P because this macro nutrient is easily bound by Ca, Al, and Fe in tropical and subtropical soils [9]. The current P utilization rate in Chinese fir plantations is only 10–25%, which is inadequate for the timber industry’s requirement for the fast growth of this species [8,10]. Generally, suboptimal levels of P cause stunted tree growth and can result in 5–15% yield losses [10,11]. Furthermore, the successive rotation patterns characteristic of Chinese fir plantations amplify the lack of available P in forest soil [6]. Thus, the mass application of phosphate fertilizer has been commonly used in Chinese fir plantations across the country, which is now causing serious issues of soil and water pollution [12].
The limited availability of P in forest soil is widespread and has become one of the most important factors causing the declining productivity of Chinese fir plantations over successive rotations in south China [13]. As a result, extensive research has been conducted on more efficient methods of P fertilization, cultivation, and breeding of Chinese fir over the past 20 years [1,12,14,15,16]. One effective strategy for reducing the use of P fertilizers is the selecting and breeding of Chinese fir genotypes with high P acquisition and utilization efficiencies in areas where P availability is limited [17]. Wu et al. have been successful in identifying several Chinese fir clones (e.g., M1, M4, & M32), with high P-use efficiency through repeated generations of selection [10,13]. Those clones show a proliferation of root mass, modified root morphology, increase in proton secretion, and enhanced activity of acid phosphatase in leaves and roots in response to P deficiency. These changes in phenotype result in a better growth capacity than common genotypes grown in P deficient soils [10]. The high P-use efficiency genotype selection research has also been applied in some additional vital economic crops, such as Populus L. and rice [18,19]. As model plant systems, the functional genomic research focused on Populus and rice has revealed that the uptake and translocation of phosphorus from the rhizosphere to different plant tissues is achieved by phosphate transporters (PHTs) [20,21]. The efficient acquisition and utilization of soil P by plants are achieved through a diverse group of transporters including PHT1, PHT2, PHT3, and PHT4 sub-families [22]. There are at least 42 PHT genes that have been identified, and the presence of 25 genes that are highly expressed in the roots suggests that these might be involved in P uptake [21]. Thus, for Populus and rice, PHT gene identification and functional genomics analysis have been very important for the molecular identification and breeding of high P-use efficiency economic crops. Unfortunately, for Chinese fir, there is a significant lack of genomic information and genetic tools, which severely encumbers molecular breeding and functional genomic research in this important timber species [2,23]. To date, there is no report available on studies of the PHT genes identification or functional analysis on Chinese fir, even though considerable research has been published on the physiology and ecology of trees grown under conditions of serious P deficiency [1,12].
As a non-model plant species with a very large genome size that is typical of conifers (20 to 30 Gb), the limited molecular research of Chinese fir has focused primarily on transcript profile investigations and patterns of gene expression [24,25]. However, the development of next-generation DNA sequencing technologies provides a revolutionary tool for transcriptomics to detect information about a given sample’s RNA content [23]. In particular, the Illumina HiSeq 2000 platform can provide high throughput, accurate, and cost-effective approaches to generate large unigenes and expression datasets that have proven to be powerful tools to profile plant tissue transcriptomes both qualitatively and quantitatively [26]. Huang et al. used transcriptome sequencing to characterize the candidate genes related to cellulose and lignin biosynthesis in Chinese fir; in total, they found 49 unigenes [23]. Wang et al. characterized the cambial tissues transcriptome of Chinese fir and identified six alternatively expressed genes correlated with cambial activities [25]. These recently acquired transcriptome data for Chinese fir have been highly informative, but until now, have been limited and only focused on vascular cambium activity or dark-grown cotyledons, and no root or leaf transcriptome data has been released in NCBI (National Center for Biotechnology Information) to date (as of August 2017). Thus, transcriptome sequencing is a potentiality new tool that is increasingly being used to identify the genes that control traits of economic value within non-model organisms with undetermined genomes, such as phosphate transporter genes in Chinese fir [27,28,29].
In the present study, the Chinese fir clone M32 selected for its high P-use efficiency was chosen for root, stem, and leaf tissue transcriptome characterization using the Illumina DNA sequencing platform. Based on the bioinformatics analysis of assembled transcriptome data, the candidate phosphate transporter genes were identified. The 14 positive gene expression patterns in root tissues were analyzed by qRT-PCR in different phosphorus deficiency treatments. This study provides a basic foundation for functional genomic studies of the phosphate transporter, and serves as an important public information platform for functional genomics research.

2. Materials and Methods

2.1. Plant Material and Experiment

The Chinese fir clone M32, known for its high efficiency of P use, was selected for transcriptome characterization and candidate inorganic phosphate transporter genes expression analysis [10]. The one-year-old healthy seedlings were raised by reproductive cloning and were chosen for the hydroponic culture experiment in the greenhouse at the College of Forestry, Fujian Agriculture and Forestry University, China. Each seedling was cultivated in a pot, and the nutrients were added to each pot according to a modified Hoagland solution [10,13]. This solution contained 5.0 mmol·L−1 KNO3, 2.0 mmol·L−1 MgSO4-7H2O, 5.0 mmol·L−1 Ca(NO3)2-4H2O, 1.0 mL·L−1 FeEDTA, and Arnon micro nutrients including 46.3 mmol·L−1 H3BO3, 0.3 mmol·L−1 CuSO4-5H2O, 0.8 mmol·L−1 ZnSO4-7H2O, 9.1 mmol·L−1 MnCl2-4H2O, and 0.4 mmol·L−1 H2MO-4H2O. The pH of the nutrient solution was regulated to 5.5. The following concentration gradient was established: 0, 0.5, and 1.0 mmol·L−1 KH2PO4, representing P-starved, low, and normal levels of P supply, respectively, and the deficient K+ in the stress is replaced by an equal amount of KCl [13]. After normal levels of P were supplied to these hydroponic cultures for seven days, the root, stem, and leaf tissues were harvested from three M32 Chinese fir seedlings for future transcriptome analysis. The remaining seedlings continued in a treatment with 0 and 0.5 mmol·L−1 P supplied for 12 h, 24 h, and 48 h, and then the recovery of P supply occurred for 12 h, 24 h, and 48 h. The root tissue of seedlings was collected for the candidate inorganic phosphate transporter genes expression analysis. All the plant materials were quick frozen in liquid nitrogen upon harvest and stored at −80 °C in a refrigerator until they were ready for RNA extraction.

2.2. RNA Extraction, Library Preparation, and Transcriptome Sequencing

Total RNA was extracted using the Plant RNA Kit (OMEGA Bio-Tek, Norcross, GA, USA) according to the manufacturer’s instructions. RNA degradation and contamination were monitored with 1% agarose gels. RNA purity was checked using the Nano Photometer® spectrophotometer (IMPLEN, Westlake Village, CA, USA) and RNA concentration was assayed using the Qubit® RNA Assay Kit in Qubit® 2.0 Fluorometer (Life Technologies, Carlsbad, CA, USA). RNA integrity was assessed using the RNA Nano 6000 Assay Kit of the Bioanalyzer 2100 system (Agilent Technologies, San Francisco, CA, USA).
Total RNA from the root, stem, and leaves of the three plants of clone M32 was pooled prior to RNA-seq libraries preparation. Equimolar quantities of total RNA from the same tissues were combined into one RNA pool. Prior to cDNA library construction, poly-T oligo-attached magnetic beads were used to purify the mRNA, which was then broken into short fragments of approximately 200 bp by fragmentation buffer. The fragments were used to synthesize the first-strand cDNA using random hexamer (N6) primers (Illumina). Second-strand cDNA was then synthesized using DNA polymerase I, dNTPs, and RNase H. Short fragments were purified with a QiaQuick PCR extraction kit and resolved with EB buffer for end reparation and the addition of poly(A). The double-stranded cDNA fragments were connected with sequencing adapters, and a final cDNA library was selectively enriched by PCR and purified using the AMPure XP system (Beckman Coulter, Beverly, MA, USA). The library preparations were paired-end sequenced by Novogene Bioinformatics Technology Co., Ltd. (Beijing, China) via an Illumina HiSeq 2000 platform. Then, 100-bp paired-end reads were generated, and all raw sequence read data were deposited in the NCBI Sequence Read Archive (SRA) database with the accession number of SRX2586188 (Stem), SRX2586189 (Root), and SRX2586190 (Leaf).

2.3. Data Processing, Assembly, and Annotation

Prior to assembly, the raw reads were filtered using stringent requirements to remove the reads containing the adapters, reads containing over 10% ambiguous ‘N’ nucleotides, and reads with over 50% of bases with a quality score lower than 5. The downstream analyses were based on the remaining clean reads and then assembled using a combined de novo transcriptome assembly strategy. The clean reads were assembled into contigs using Trinity software as previously described for de novo transcriptome assembly without a reference genome [27].
These assembled sequences were defined as unigenes, and the unigenes function was annotated using protein similarity analysis. NCBI BLAST 2.2.28+ alignment with an E-value threshold of 10−5 was performed between the unigenes set and the following protein databases of NR [28], Swiss-Prot [29], GO [30], KOG [31], and KEGG [32,33]. Blast2GO v2.5 [34] was used to obtain Gene Ontology (GO) annotation of unigenes based on the GO and NR database. The amino acid sequence of the unigenes was analyzed by HMMER 3.0 [35] software and the outputs were searched for in the protein family (Pfam) [36] database to obtain annotated information for the unigenes. By using the DESeq R package (1.10.1) [37], the annotated unigenes were normalized in FPKM (Fragments Per Kilobase Million) [38] to calculate their relative expression levels. The metabolic pathways were predicted using the GO and KEGG enrichment analysis, respectively, based on the GOseq (1.10.0) [39] and KOBAS [40] software.

2.4. qRT-PCR Analysis for Gene Expression

Seven unigenes were chosen for gene expression validation using qRT-PCR. Specific primer pairs for these selected genes were designed by Primer Express Software V3.0 (Applied Biosystems, Foster City, CA, USA), as shown in Table S1. The first-strand cDNA was transcribed from 1 μg of total RNA using the Thermo Scientific Revertaid First Strand cDNA Synthesis Kit (Thermo, Waltham, MA, USA) in 25 μL of reaction mixture. The qRT-PCR was performed with an ABI 7500 Real-Time PCR system (Applied Biosystems) with the Power SYBRH Green PCR Master Mix (Applied Biosystems) according to the manufacturer’s protocol. The thermal profile for SYBR Green I RT-PCR was 95 °C for 10 min, followed by 40 cycles of 95 °C for 15 s and 60 °C for 1 min. Three biological replicates were carried out for selected genes, and the mean value was used for graphics plotting. The reference gene (β-Actin) was used for normalization. The comparative CT method (2−ΔΔCT method) [41] was used to analyze the expression levels of the different genes. Statistical analyses were performed using variance (ANOVA) followed by Duncan’s new multiple range tests with SPSS version 13.0 (SPSS, Chicago, IL, USA).

3. Results and Discussion

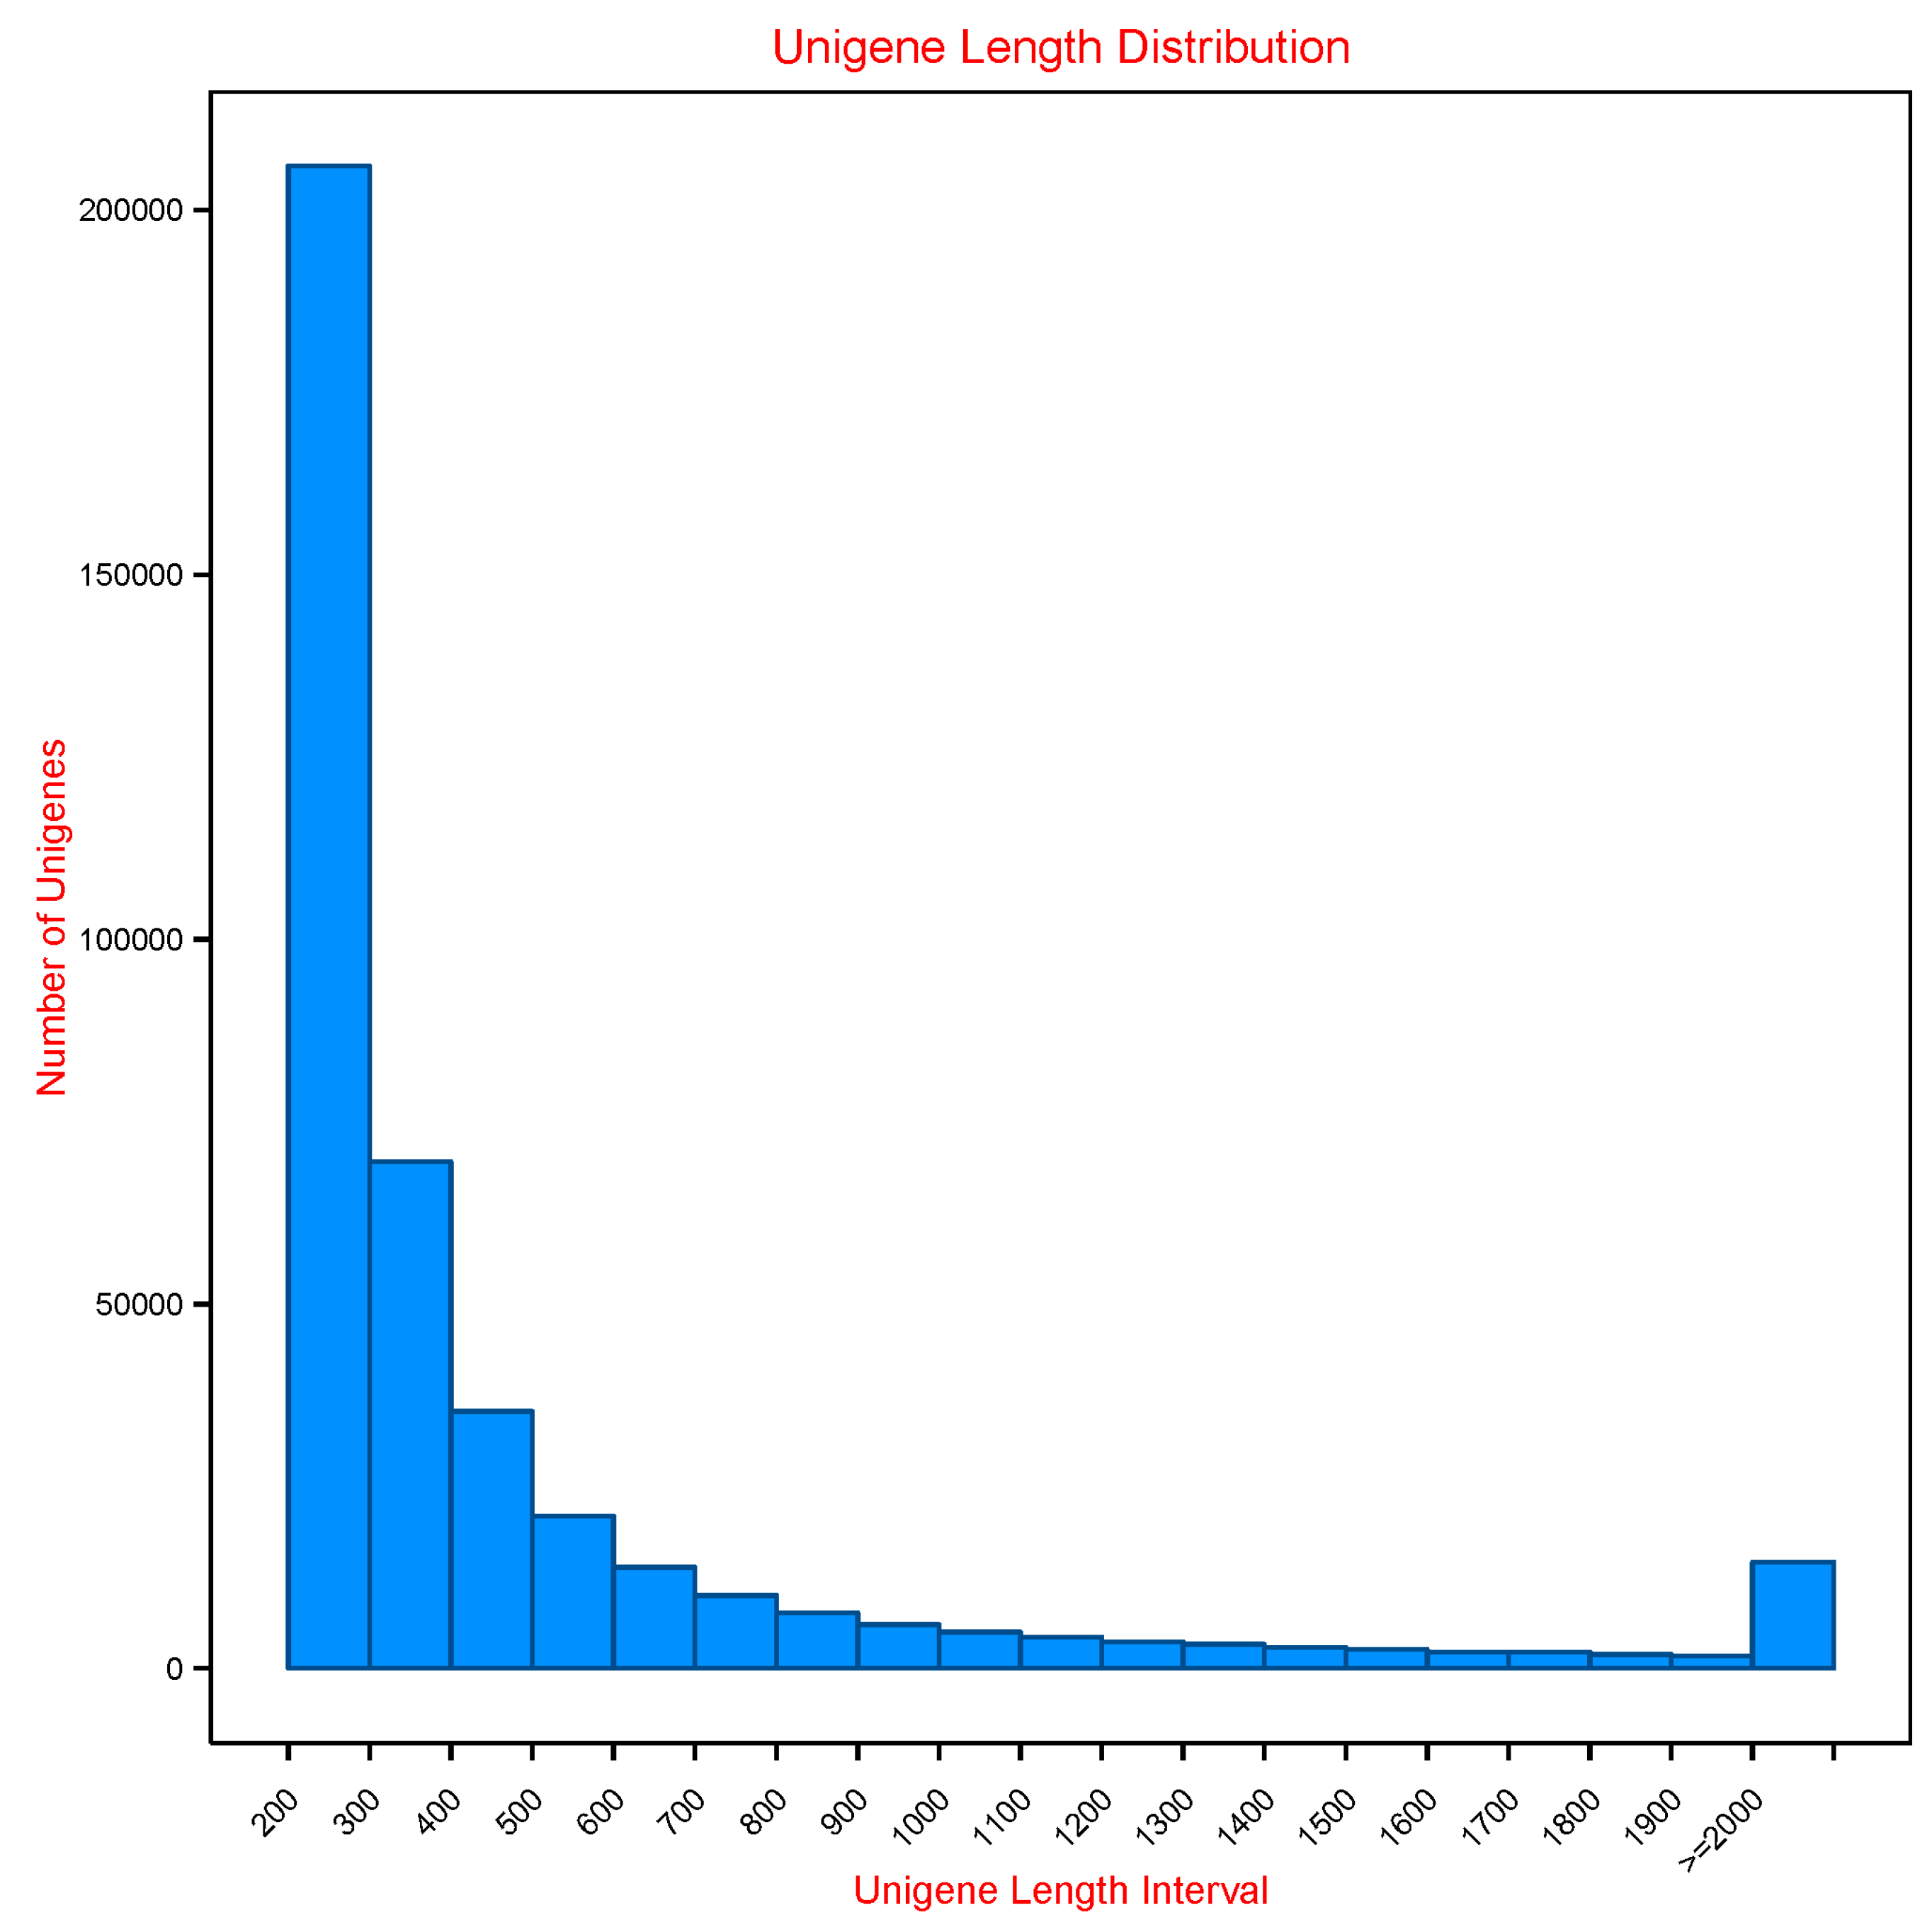
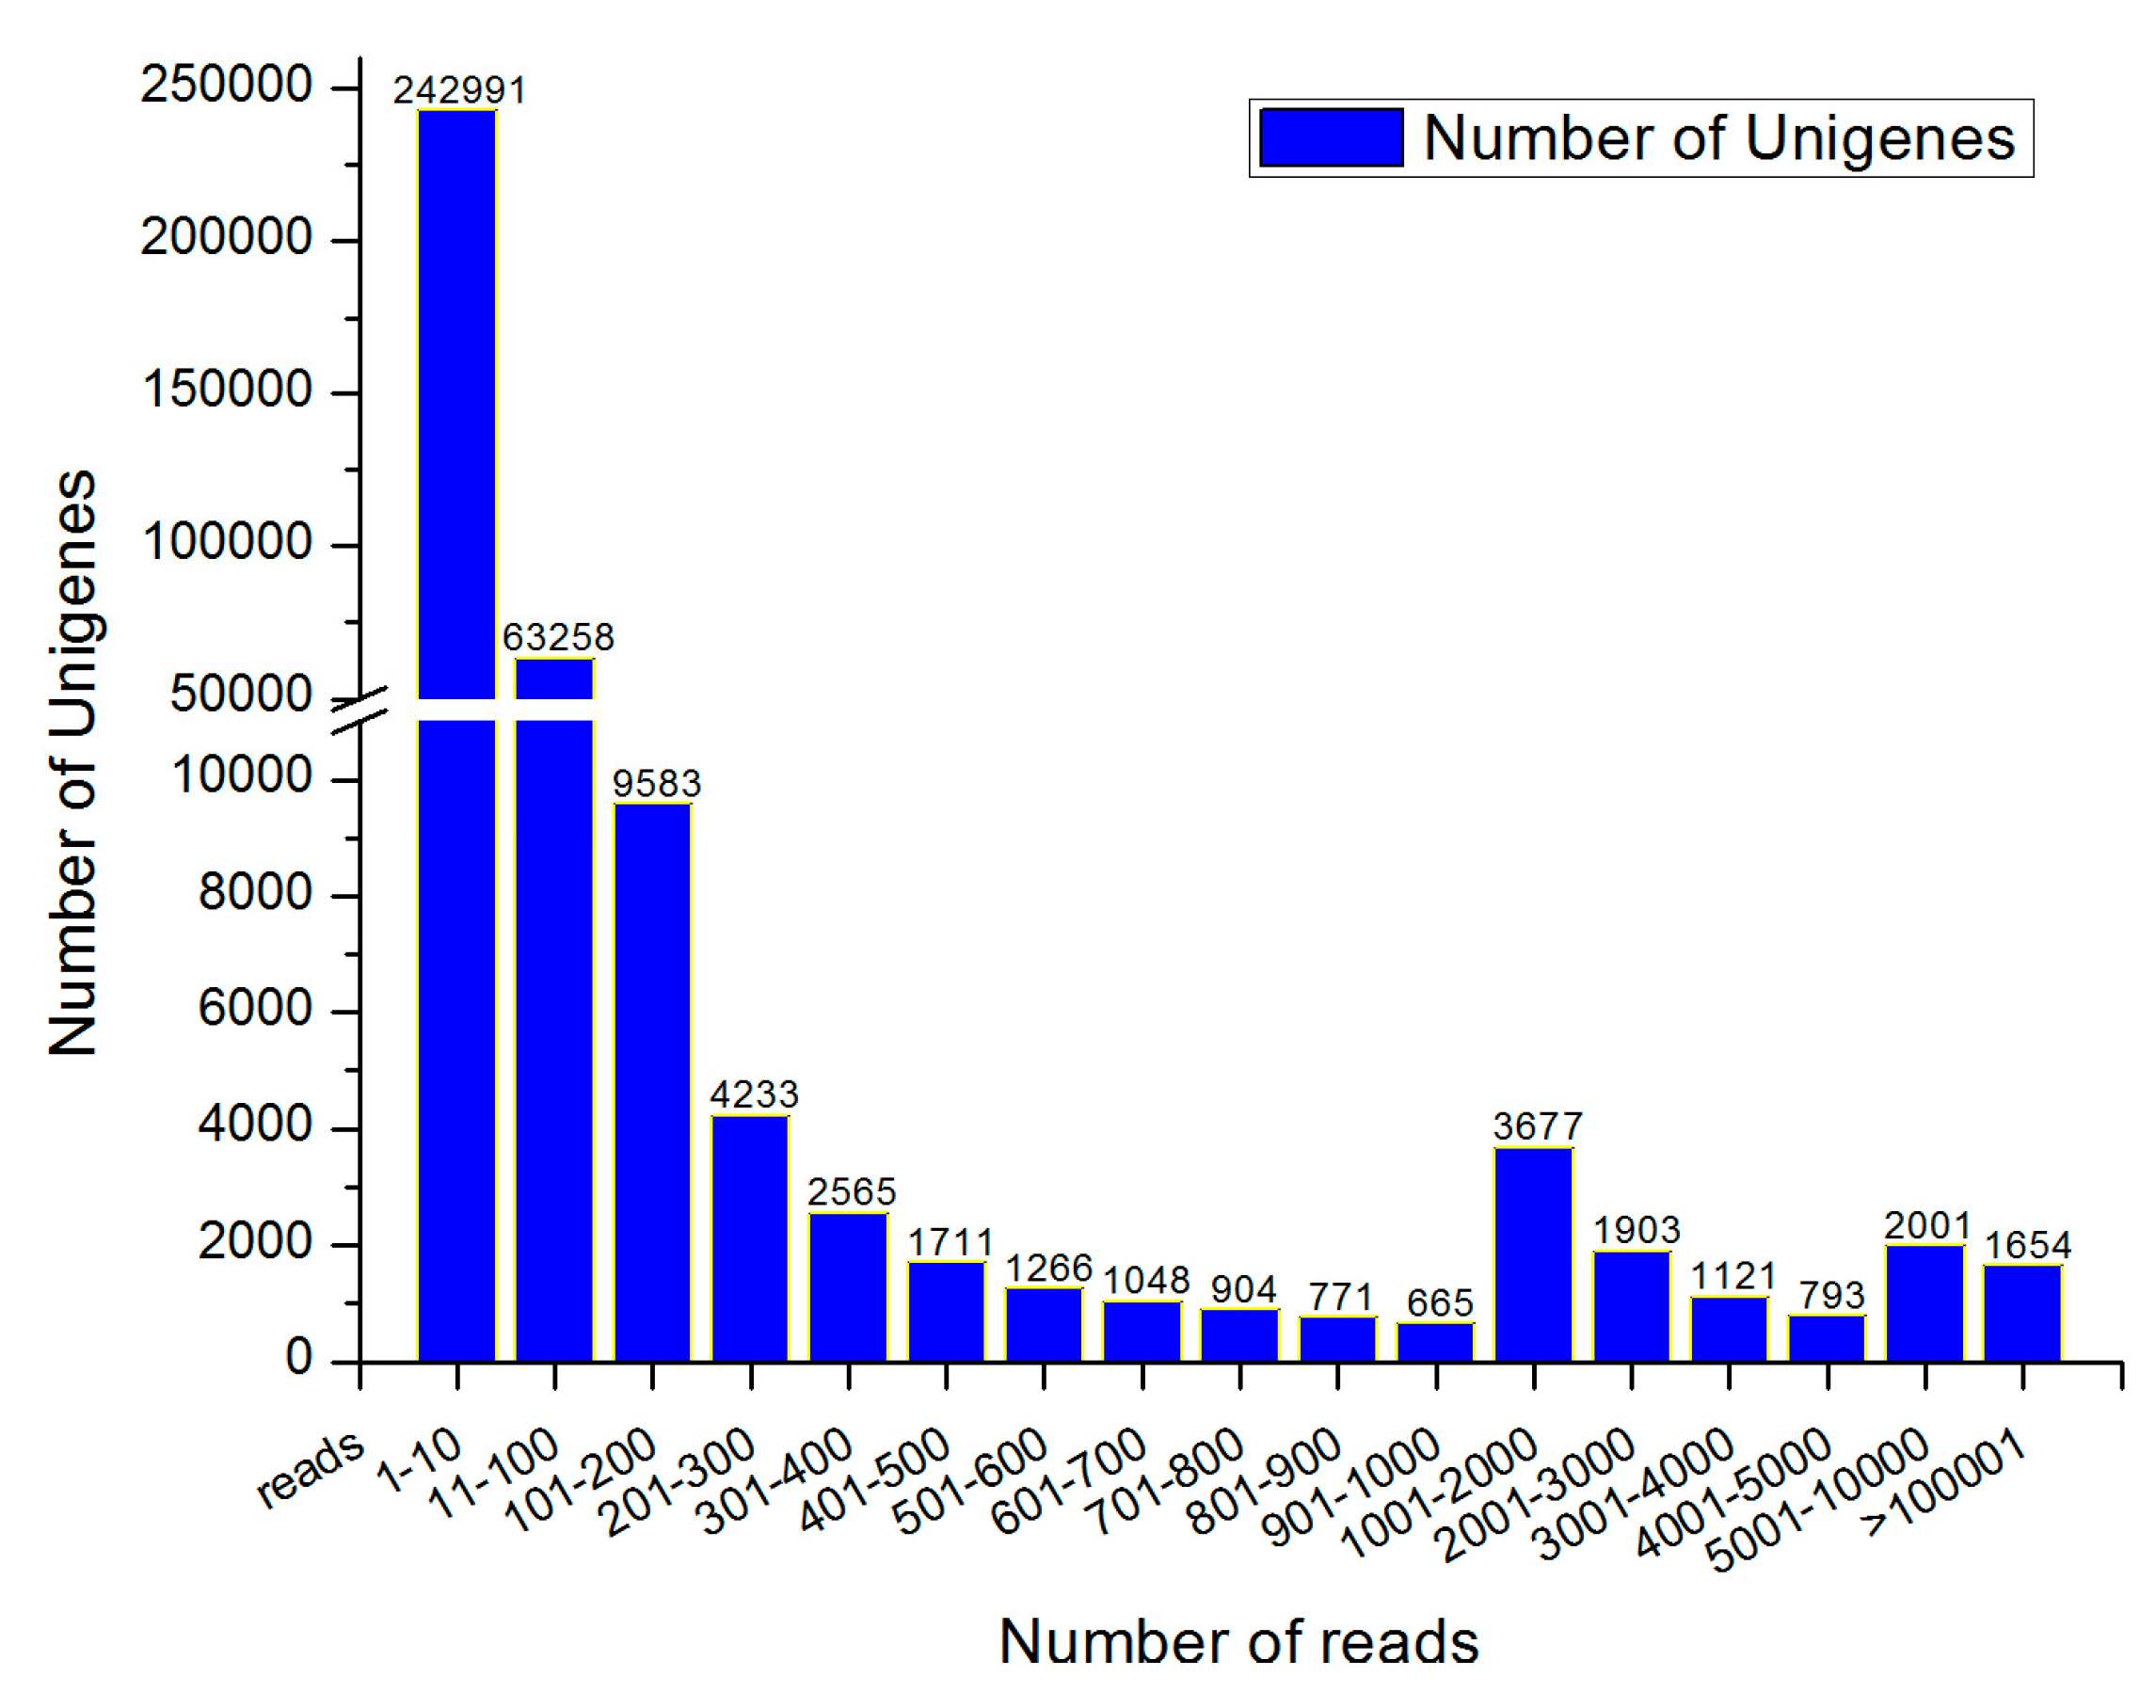
3.1. Sequencing and De Novo Assembly

To comprehensively cover the transcriptome of Chinese fir, three sequencing libraries were prepared, respectively, from the root, stem, and leaf tissues and sequenced with the Illumina HiSeqTM 2000 sequencing technology paired-end technique. There were 80,914,328 raw reads generated from the root, 86,439,146 from the stem, and 81,365,604 from the leaves (Table 1). A total of 76,829,210 clean reads were obtained from root sequencing, and 96.64% (11.52 Gbp) of the bases had Phred-like quality scores at the Q20 level (an error probability of 0.02%). Of the clean reads data from stem sequencing, 82,165,990 clean reads were obtained and 96.7% (12.32 Gbp) of the bases had a Q value ≥ 20 (an error probability of 0.01%). The clean reads for leaves were 77,534,078 and 96.79% (11.63 Gbp) of the bases had a Q value ≥ 20 (an error probability of 0.01%). The GC-contents were 47.94%, 44.22%, and 44.22% for the root, stem and leaves, respectively. The Trinity software was used to break all high-quality reads and assembled the small fragments into 479,035 transcripts (Table 2) with a mean length of 591 bp. The length of the transcripts mainly ranged from 201 to 17,835 bp, and 141,005 transcripts with a length larger than 500 bp. Size distribution of the transcripts is shown in Figure S1. We identified 413,806 unigenes with a mean length of 520 bp. The lengths of 102,702 and 44,407 unigenes were larger than 500 bp and 1000 bp, respectively, while 75.18% of the unigenes had lengths between 200 and 500 bp (Figure 1). To assess the quality and coverage of assembled unigenes, we analyzed the sequencing depth range. The sequencing depth ranged from 0.27 to 2319 folds, in which 71.45% of the unigenes were less than 10 reads, 18.6% of the unigenes ranged from 11 to 100 reads, 6.69% of the unigenes varied from 100 to 1000 reads, and approximately 3.26% were supported by more than 1000 reads (Figure 2).
The quality of transcriptome data is a decisive factor for various subsequent analyses [42]. However, the quality of the data may be affected by several factors, including the contamination of adapter sequences, poor quality reads, and assembly errors [23]. In this study, a total of 236,529,278 clean reads and 35.47 Gbs of databases were obtained from Chinese fir transcriptomes, which is much more than any previously published transcriptome research on Chinese fir [23,24,25,43]. Due to a lack of homologous unigenes, the average length of unigenes for non-model plants is usually less than 500 bp [26,44,45]. Surprisingly, the unigenes we assembled revealed a mean length of 520 bp, which is longer than those achieved in previous studies of Chinese fir as reported by Huang et al. (449 bp) [23], Wang et al. (505 bp) [24], and Qiu et al. (497 bp) [43]. However, the length distribution of the unigenes was similar to that of the transcripts, and 75.18% unigenes were less than 500 bp, indicating that the length distribution of the transcripts and unigenes was mainly represented by short sequences with relatively little redundancy. These findings are roughly consistent with the results of previous studies [23,24], suggesting that the quality of our data is comparable to similar data of Chinese fir transcriptomic research. The Trinity software we used is a popular assembly tool, but different assembly strategies have an effect on the accuracy of data, and the comparative study of different assembly software such as AbySS and SOAPdenovo can help to improve assembly accuracy [46]. For further research, a large number of accuracy assembled sequential data could provide more in-depth transcriptome information, and lead to rapid characterization for most of the transcripts and a reference for the potentially valuable genes [47].

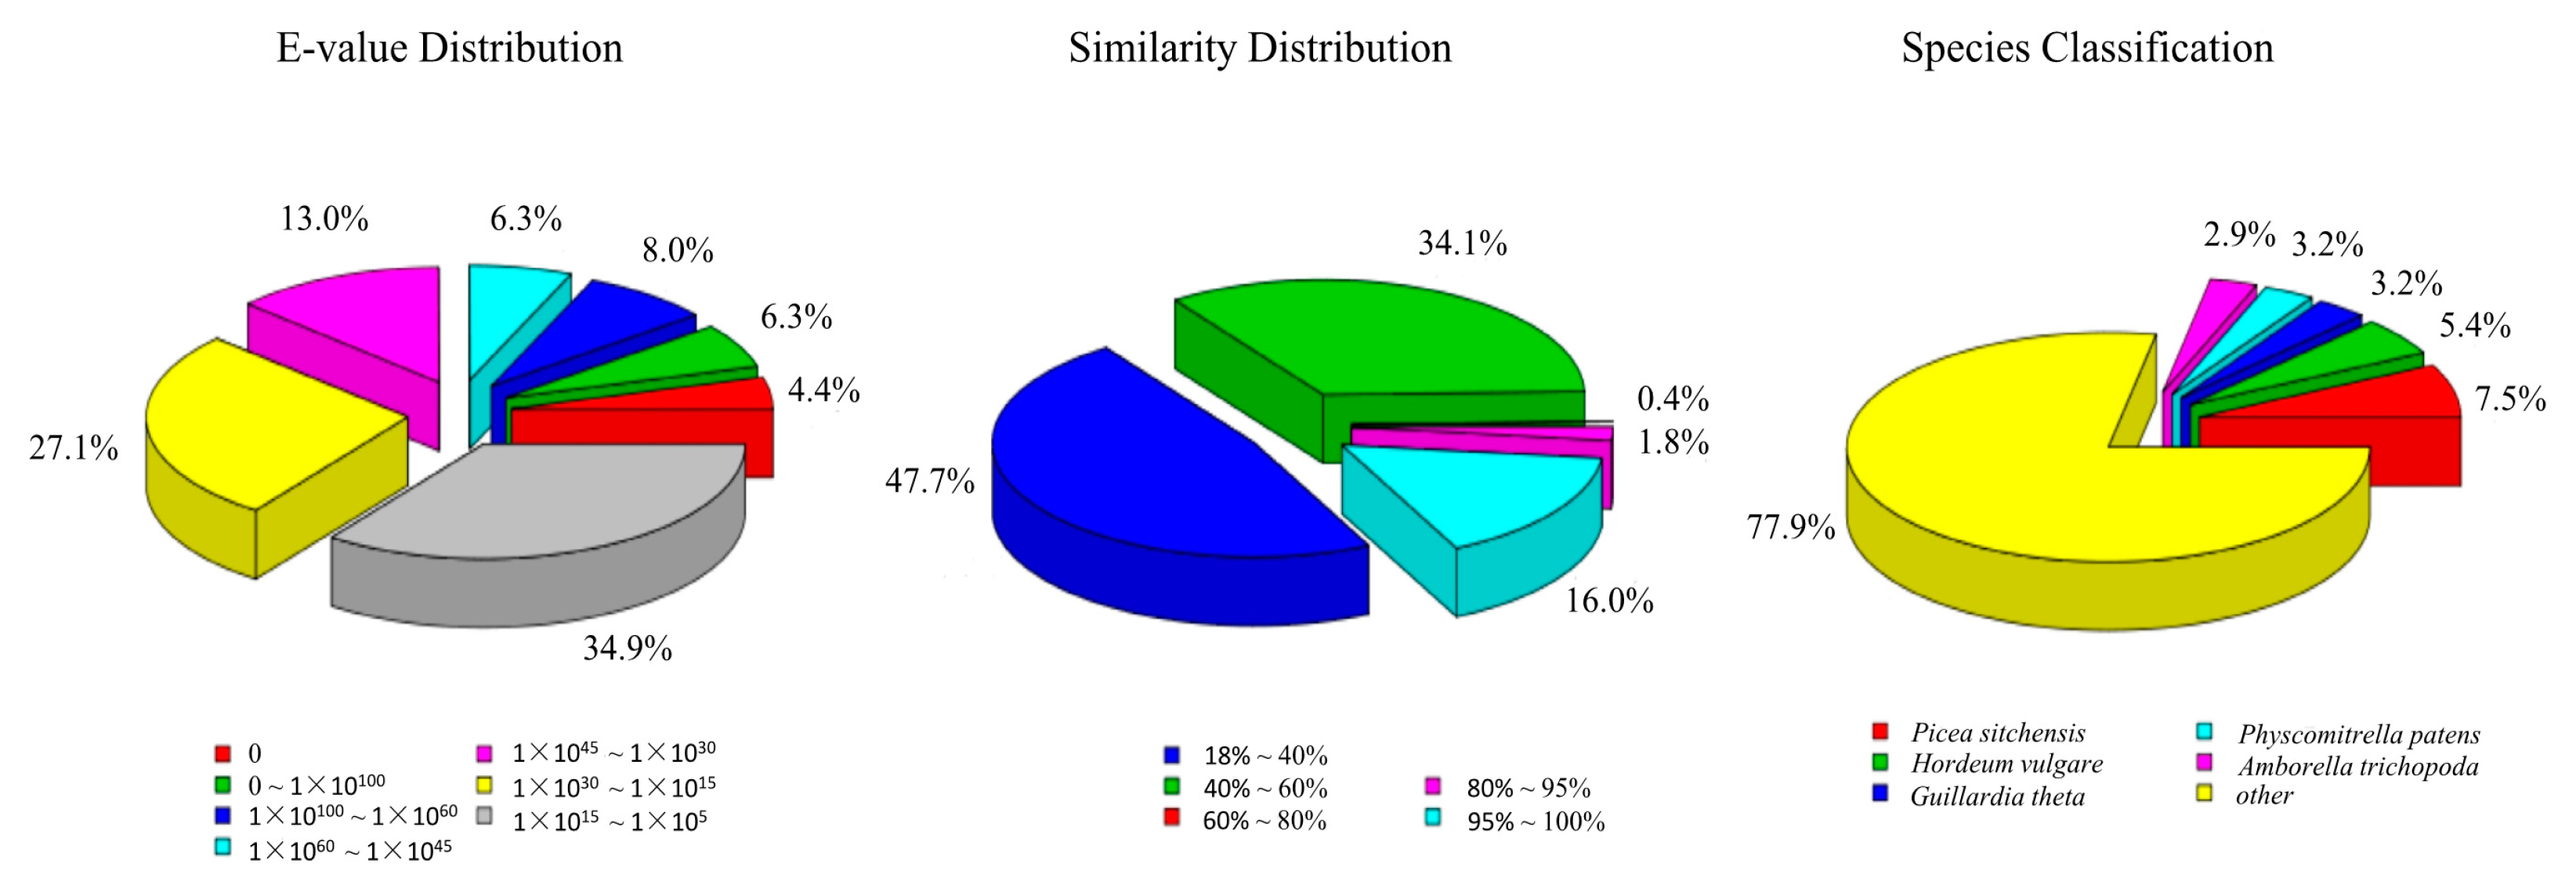
3.2. Annotation of Predicted Proteins
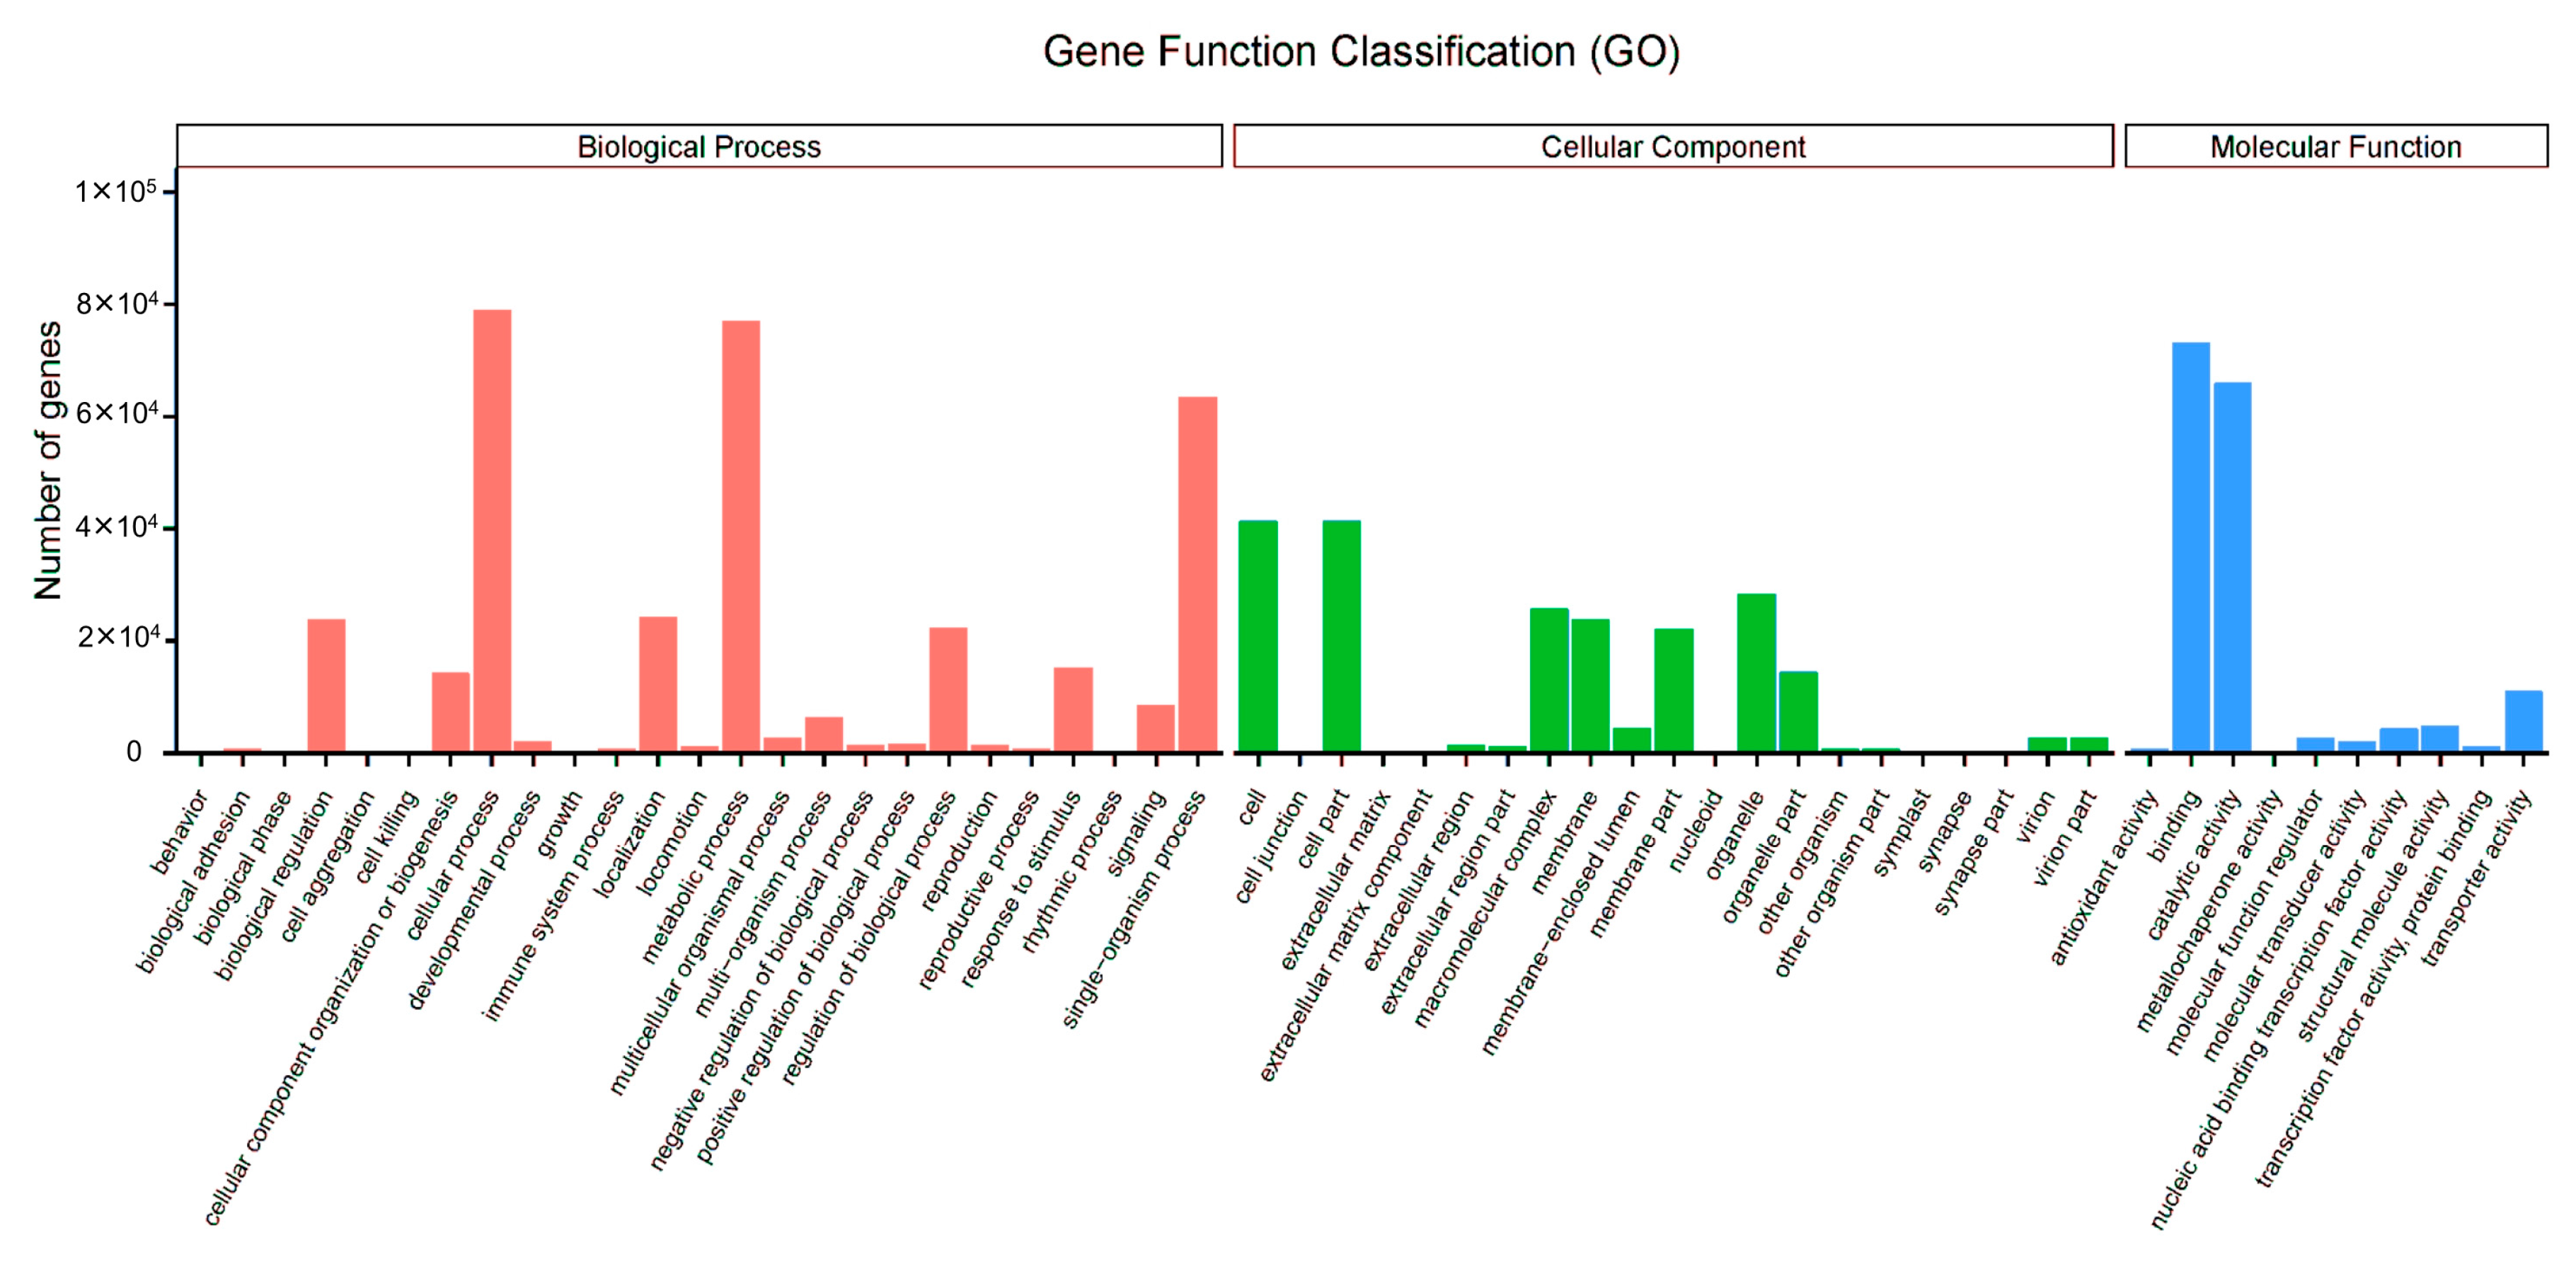
To functionally categorize all the assembled unigenes of Chinese fir, we identified the unigenes coding sequences in the following protein databases: NR, Swiss-Prot, GO, KOG, Pfam, and KEGG. Of the 413,806 unigenes, we recovered 203,404 of these (49.15%) that were represented in at least one database (Table S2). The rest of the unigene sequences (50.85%) had no significant matches in the existing databases. More specifically, 109,596 unigenes were annotated in the NR database with the E value and similarity of the annotated results, showing that 75.0% of the mapped sequences have a strong homology (ranging from 1.0 × 10⁻⁵ to 1.0 × 10−45). An additional 17.8% of the unigenes showed more than 80% similarity (Figure 3). Based on the species distribution analysis, the Chinese fir unigenes have 7.5% and 2.9% matches with sequences from the conifer Picea sitchensis (Bong.) Carr. and the flowering plant Amborella trichopoda Baill., which is sister to all living angiosperms. (Figure 3). These results indicate that the Illumina paired-end sequencing produced a substantial fraction of the Chinese fir genes, but since there is no reference genome available, there are still limits in our ability to identify the assembled unigenes. The unigenes which were not annotated in the existing databases might lack a characterized protein domain to match in the database, but some of those unigenes could also be potential specific genes for Chinese fir. In total, 203,404 unigenes were annotated in our study, which was far more than the previous study of the number of unigenes in the Chinese fir [23,25]. The species similarity analysis revealed possible incompletely defined genetic backgrounds for Chinese fir [48]. Large-capacity databases and whole genome sequence data of Chinese fir will be needed to more accurately complete future transcriptome analyses [49].

3.3. GO Assignments

Gene Ontology (GO) is an internationally standardized gene function classification system that provides a dynamic standard vocabulary and a strictly defined concept to describe the functional attributes of genes and their products [50]. In order to classify the putative functions of the predicted Chinese fir genes, the assembled unigene sequences were uploaded into the GO database. The sequence homology assessment revealed that a total of 148,466 unigenes (35.87% of all our annotated unigenes) were present in the GO database (Table S3), and 727,287 predicted genes were assigned to at least one GO term (Table S4). Furthermore, the assigned GO terms were statistically classified into three main GO categories: biological processes, molecular functions, and cellular components, and then into 56 subcategories (Figure 4). Biological processes encompassed 348,743 (47.95%) GO annotations and was the largest cluster, followed by cellular components (212,057, 29.16%) and molecular functions (166,489, 22.89%). Biological processes are the vital processes occurring in organisms to live and contain various chemical reactions or other events that result in growth and development [51]. The sub-categories of metabolic process (79,020 unigenes, 22.66%), cellular process (77,109 unigenes, 22.11%), and single-organism process (63,493 unigenes, 18.21%) were prominent in the biological processes category, indicating that the analyzed tissue has a high degree of metabolic activity and these unigenes are involved in metabolic activities of Chinese fir. In the cellular component category, 41,377 (19.51%) and 41,331 (19.49%) unigenes were assigned to cell and cell parts, respectively; with the following sub categories being well represented: organelle (28,494 unigenes, 13.44%), macromolecular complex (25,652 unigenes, 12.10%), membrane (23,894 unigenes, 11.27%), membrane parts (22144 unigenes, 10.44%), organelle parts (14,508 unigenes, 6.84%), and other subcategories with fewer unigenes. According to the classification of the molecular function category, binding (73,118 unigenes, 43.92%), catalytic activity (66,050 unigenes, 39.67%), and transporter activity (11,086 unigenes, 6.66%) represent the most abundant sub-categories. These GO classification results are similar to those revealed in previous transcriptomic studies of Chinese fir [23,43]. GO annotations describe the contour features of the overall gene expression of Chinese fir among root, stem, and leaf tissues, and revealed expressed genes encoding inorganic phosphate transporter activity functions like transporter activity—the primary focus of this study.

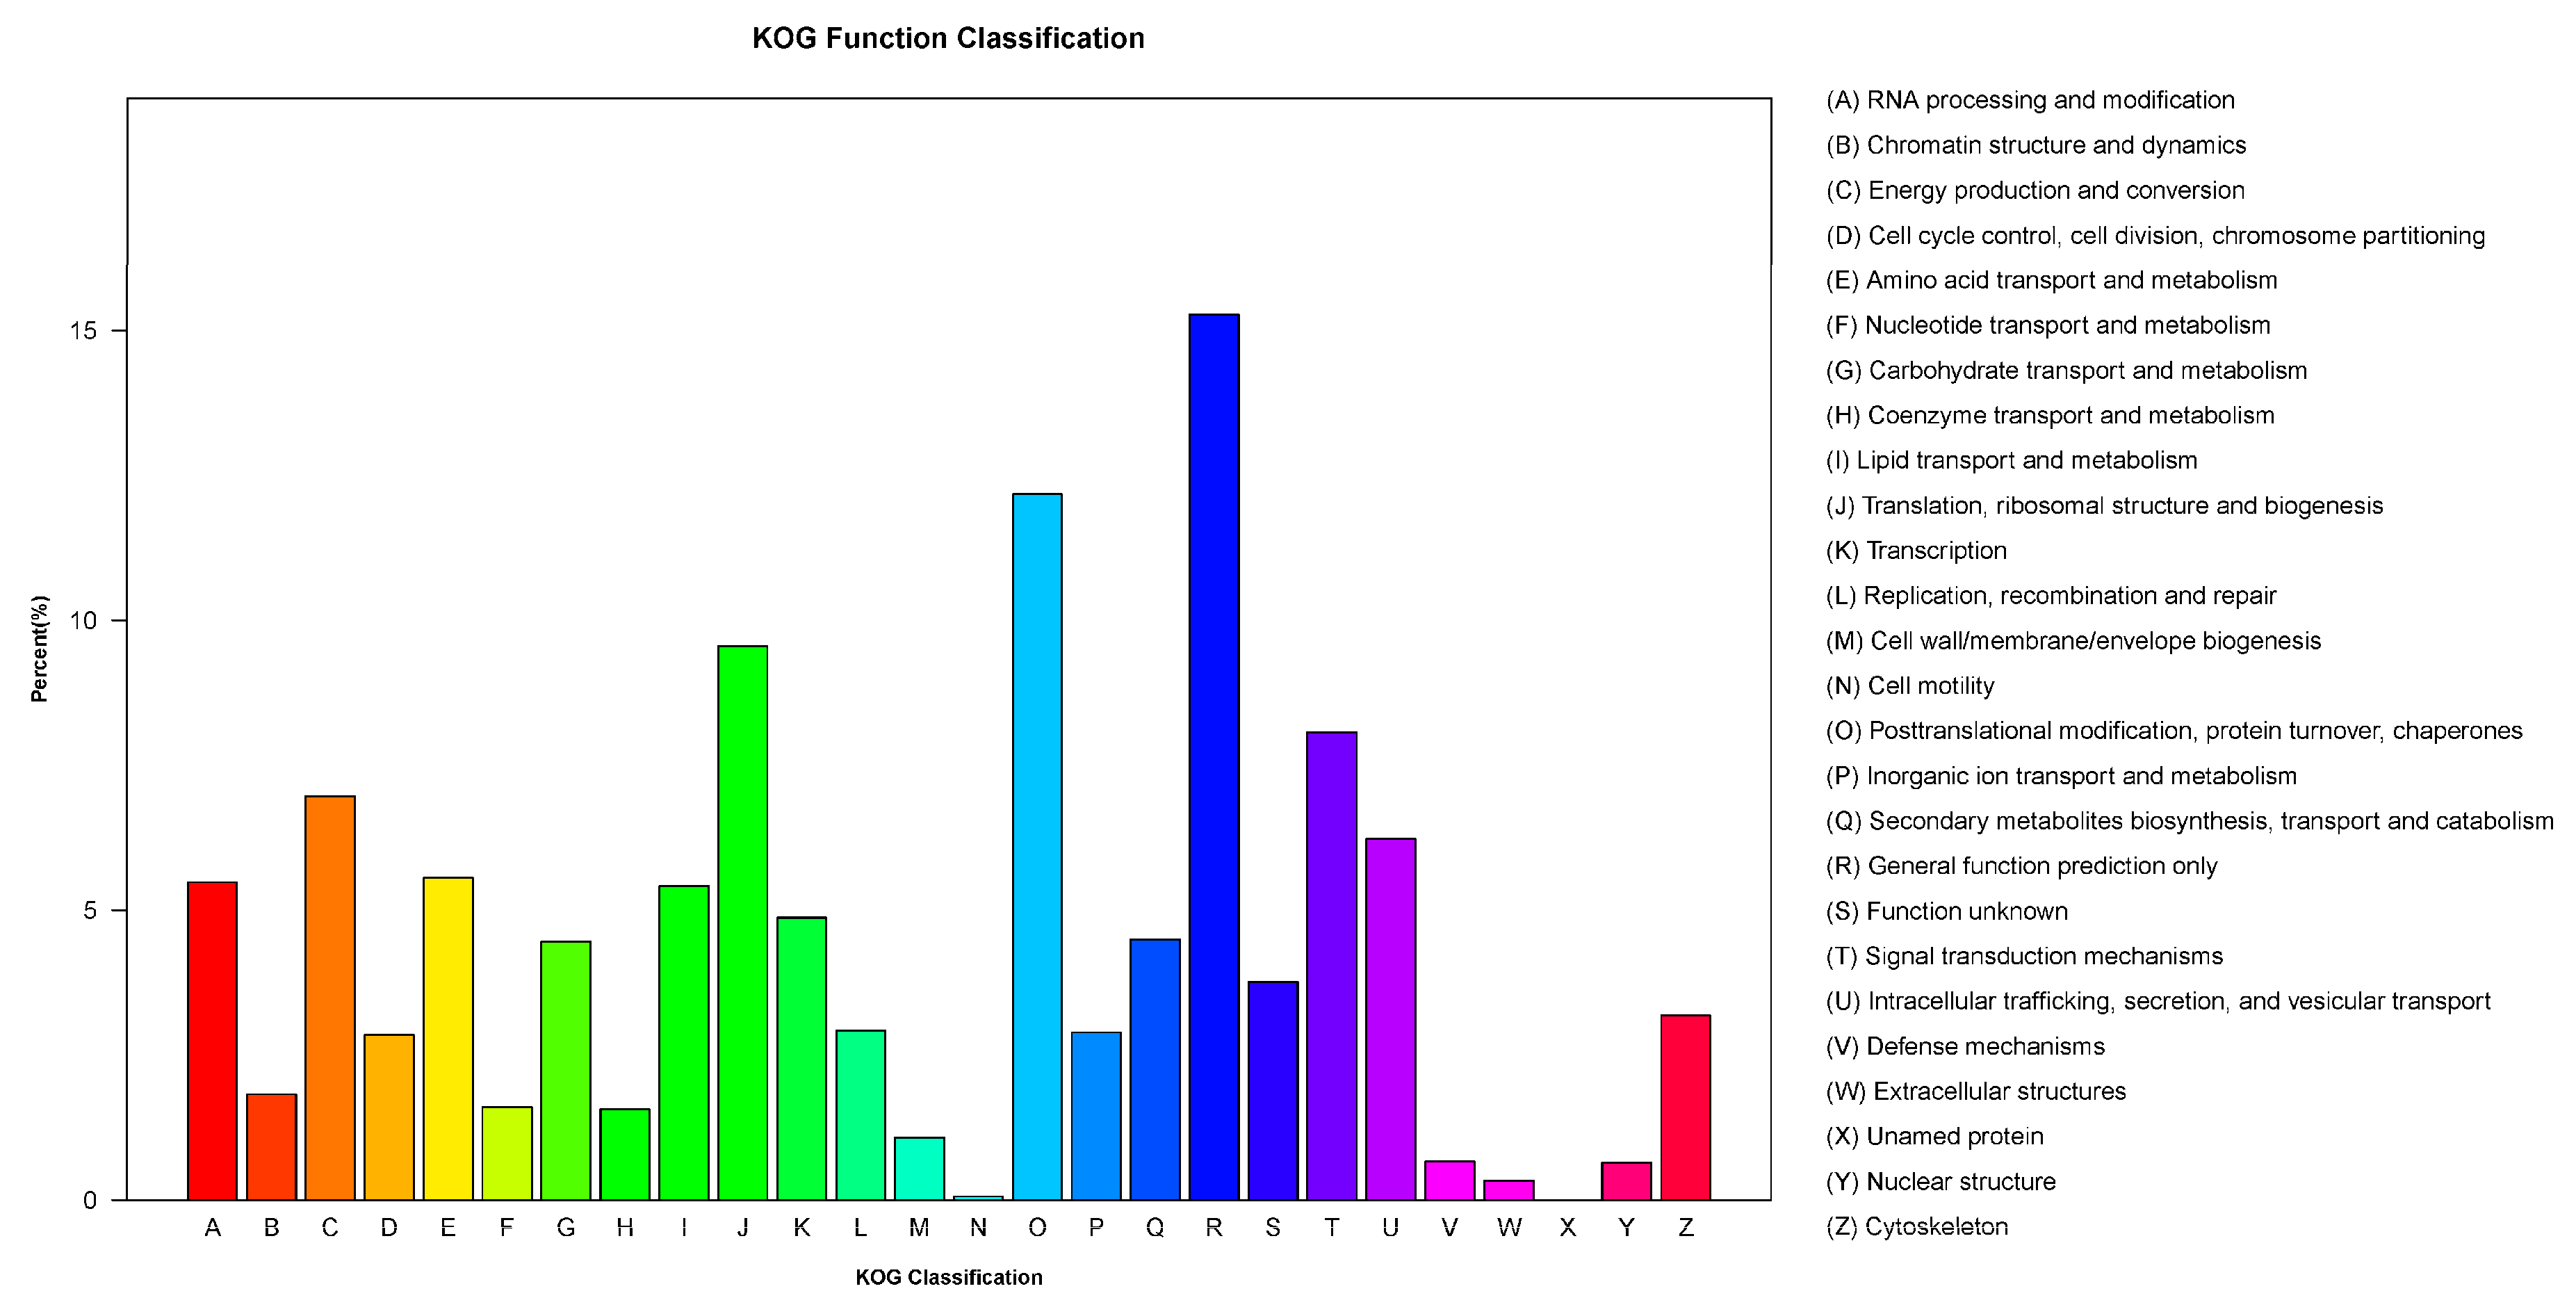
3.4. KOG Classification

An objective classification of proteins encoded within a transcriptome is required for making the unigenes useful for functional and evolutionary studies [52]. To further evaluate the completeness of our transcriptome library and to predict the unigenes’ functions, all the assembled unigenes with high levels of homology to sequences in the generic databases were searched against the KOG database containing only orthologous genes of eukaryotes [53]. In total, information for 92,001 classified unigenes was assigned to 26 KOG categories (Figure 5, Table S5). Among the 26 KOG categories, the cluster for general functional prediction (14,054 unigenes, 13.65%) represented the largest group, followed by post-translational modification, protein turnover and chaperones (11,200 unigenes, 10.88%), translation, ribosomal structure and biogenesis (8791 unigenes, 8.54%), and energy production and conversion (6406 unigenes, 6.22%). Only a few unigenes were assigned to cell motility (57 unigenes, 0.06%). Secondary metabolites biosynthesis, transport, and catabolism represented 4136 unigenes (4.02%), presumably because of the relative importance of secondary metabolic activity for the transmembrane transport of inorganic phosphate and other ions. To some extent, KOG classifications further reveal the potential specific reactions and the functional participation in molecular processes for genes expressed in Chinese fir.

3.5. KEGG Pathway Analysis

The KEGG pathway database allows for a systematic analysis of inner-cell metabolic pathways and functions of gene products within a cell [54]. To identify the biological pathways activated in Chinese fir, we mapped the annotated sequences to the canonical reference pathways in the KEGG database [33]. The results indicated that 57,042 unigenes had significant matches in the database and were assigned to 132 KEGG pathways (Table S6). These pathways are summarized and mapped in five categories with 12 sub categories (Figure S2). The top 10 pathways include unigenes involved in carbon metabolism (3457), ribosomes (3343), biosynthesis of amino acids (2696), spliceosome (2138), protein processing in endoplasmic reticulum (1962), purine metabolism (1686), RNA transport (1567), oxidative phosphorylation (1434), glycolysis/gluconeogenesis (1381), and pyrimidine metabolism (1326). These results partially explain why a large number of secondary metabolites exist in Chinese fir. The inorganic phosphate transporters that we are most interested in studying belong to the ABC (ATP-binding Cassette) transporter family [22]. Thus, we concentrated our efforts further on the membrane transport category involving 620 unigenes of ABC transporters. These annotations provide a valuable resource for investigating the processes, functions, and pathways involved in inorganic phosphate transport. The GO, KOG, and KEGG annotated more than half a percent of unigenes and basically represents the various aspects of metabolism, which also indicated that our transcriptomic yielded a substantial fraction of genes from Chinese fir.

3.6. Candidate Genes Involved in Inorganic Phosphate Transport

The expression of all unigenes was denoted by FPKM values [55]. Table S6 lists the top 10 most frequently expressed unigenes in the root, stem, and leaf transcriptomes, respectively. Unigenes c219691, c213460, and c193149, whose gene functional annotations were identified as the pathogenesis-related protein Bet v I family, thaumatin-like protein, and translationally-controlled tumor protein, respectively, had a relatively high expression level across the root, stem, and leaf transcriptions. Research over the past 20 years has provided clear evidence that the limited availability of phosphorus in forest soil is widespread and plays an important factor in the declining productivity of Chinese fir plantations over successive rotations [1,12,14,15,16]. Therefore, we have selected the unigenes with the functional annotations of inorganic phosphate transporter activity for further analysis. Approximately 49 unigenes were identified as potentially exhibiting inorganic phosphate transporter activity in the Chinese fir transcriptome (Table S7). There are 25 unigenes that were annotated as exhibiting inorganic phosphate transmembrane transporter activity, and 14 unigenes that may be homologs of the characterized PHT genes in plants or yeast (Table 3). Unfortunately, the other 11 unigenes were not authentic homology annotated to any characterized PHT genes, and their functional analysis remains to be further studied.
Ten of the candidate PHT unigenes were annotated to the mitochondrial phosphate carrier protein and had a high homology with the solute carrier family 25 members 3 genes (SLC25A3) (Table S7, number 26–35). The SLC25A3 gene is a phosphate transport protein and catalyzes the transport of phosphate into the mitochondrial matrix, either by proton cotransport or in exchange for hydroxyl ions [56]. The protein contains three related segments arranged in tandem which are related to those found in other characterized members of the mitochondrial carrier family [57]. The homologous genes of SLC25A3 identified in Arabidopsis are called mitochondrial phosphate transporters (MPT) and belong to the PHT3 sub-family, which plays crucial roles in the uptake of orthophosphate into the mitochondrial matrix, and is essential for the oxidative phosphorylation of ADP to ATP [57,58]. Therefore, the ten unigenes we discovered may belong to PHT3 and play a similar function in mitochondrial phosphate transport in Chinese fir. In comparison, 13 unigenes in the list of Table S7 exhibited functional annotations of ATP binding and ATP: ADP antiporter (AAA) activity. The AAA gene family has been reported as an obligate exchange translocase specific for ATP and ADP, and can also transport inorganic phosphate [59]. Unigene c258053-g1 was annotated to the transmembrane 9 superfamily member 2 (TM9SF2), which encodes a member of the transmembrane 9 superfamily and plays a role in small molecule transport or acts as an ion channel [60]. In total, there are 45 candidate PHT unigenes expressed in root tissue, and 12 unigenes expressed in leaves and stem tissue. Baker et al. reported that in Arabidopsis the PHT1 gene exhibits strong expression in roots and is responsible for absorbed phosphorus from soil and for the distribution and remobilization within the plant [20]. Thus, the PHT1s were the most important transporters for plants and widely studied in many plants like tomato, rice, and poplar [19,22]. The other PHT family members are mostly responsible for intracellular P distribution [61]. The PHT2s play the function of H+/Pi cotransporters in the plastids of plants, the PHT3s were recognized as mitochondrial Pi transporter genes to catalyze the exchange of Pi between the matrix and cytosol, and the PHT4s were reported to transport Pi in plastids and the Golgiapparatus [21,61].

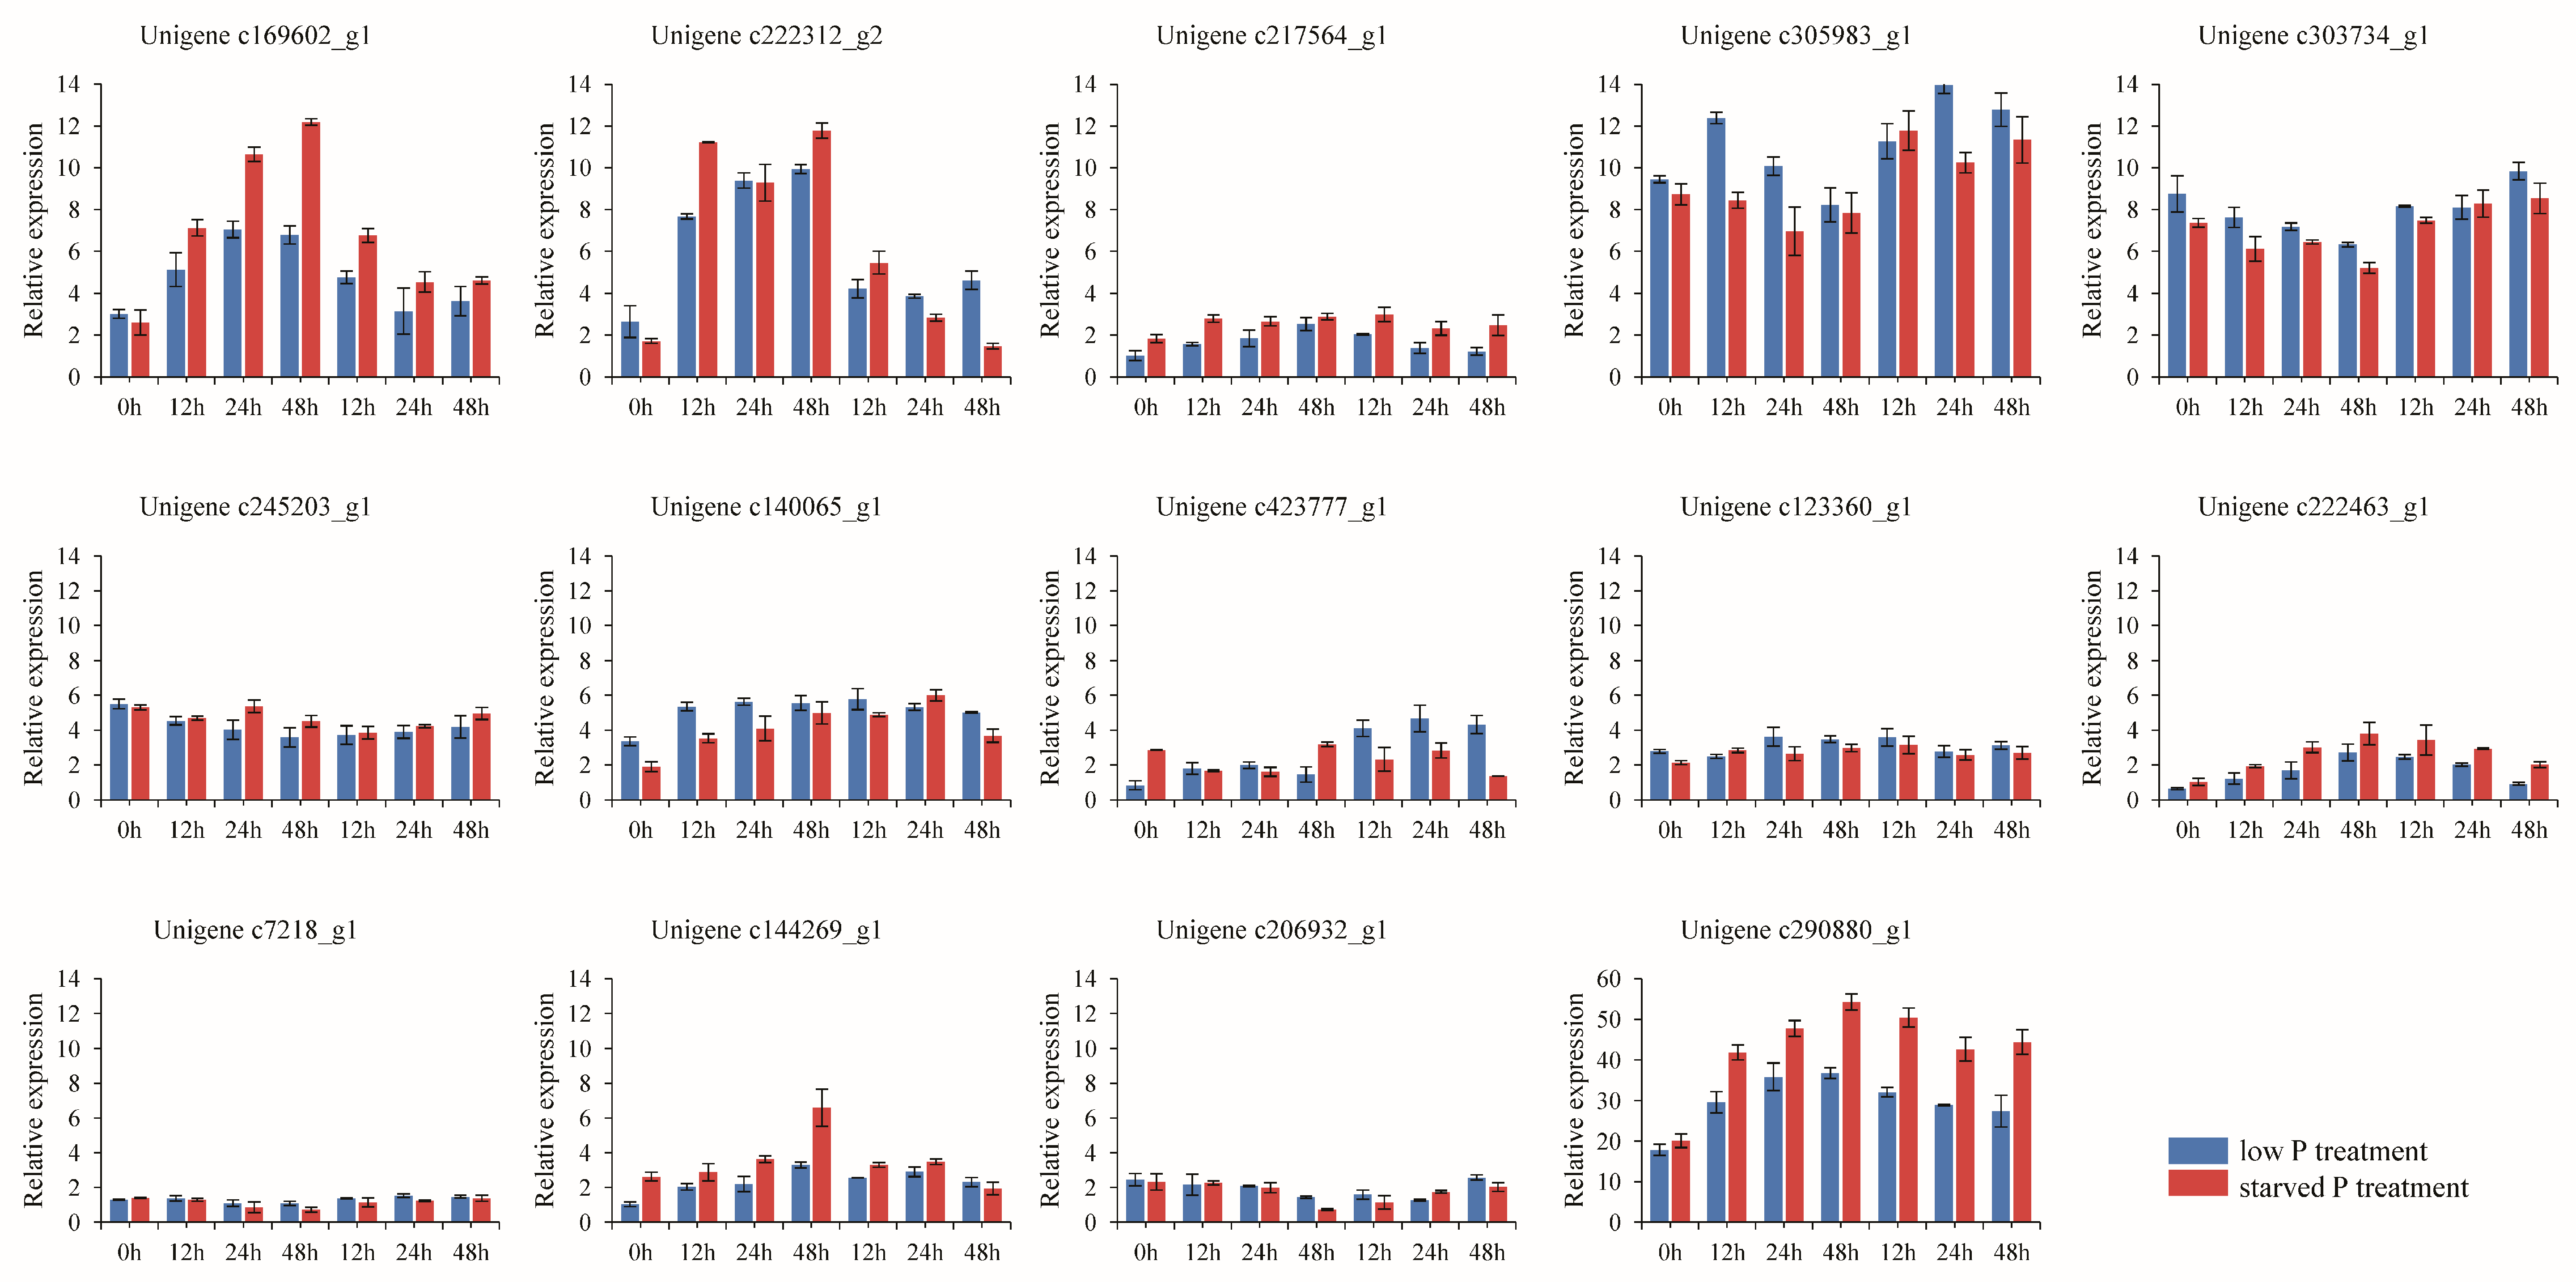
3.7. Gene Expression Analysis by qRT-PCR

We used qRT-PCR analysis to compare the relative transcript levels of the 14 candidate phosphate transporter unigenes in Chinese fir root tissue after treatment with low P or starved P stress for 0, 12 h, 24 h, and 48 h, and then the recovery to a normal level of P supply for 12 h, 24 h, and 48 h, as described above (Table 3). The results showed that all 14 unigenes exhibited positive expression in root tissue, and most of them revealed a significant expression change when faced with a P deficient or recovery supply (Figure 6). The unigene c290880_g1 performed at the highest level of expression in all unigenes, and expression levels increased significantly after P was deficient for 12 h. After being P deficient for 24 h and 48 h, the gene expression level was increased to more than double. When recovery P was supplied, the level of gene expression decreased but still maintained a high level. The unigene c169602_g1 and c222312_g2 also performed at a high level of expression in root tissue, and the expression pattern was obviously induced by P deficient and recovery supply. Under starved P stress for 48 h, the gene expression level of unigene c169602_g1 was increased to more than triple, and the unigene c169602_g1 was increased to more than six. The expression level of Unigene c222463_g1 was relatively low in root tissue but also revealed the same expression pattern as a significant increase in P deficiency and decrease in recovery P supply. The expression level of Unigene c217564_g1, c140065_g1, and c144269_g1 did not show a significant increase in P deficiency and a decrease in recovery P supply. In contrast, the unigenes c303734_g1 and c206932_g1 showed a decreased expression in P deficiency and an increased expression in recovery P supply. Additionally, the expression levels of Unigene c305983_g1, c7218_g1, c245205_g1, c423777_g1, and c123360_g1 exhibited no significant change according to the environment P concentration changes. The gene expression results from qRT-PCR were partially consistent with the FPKM value by RNA-Seq, such as the unigene c305983_g1 and c290880_g1, which both have a relatively high level of gene expression and FPKM value. On the whole, the expression results from the qRT-PCR analysis matched closely with the putative functions assigned to these unigenes.
Previous studies on Arabidopsis and rice revealed the presence of two different P uptake systems, low P inducible high-affinity systems, and constitutive low-affinity systems [20,22]. The high-affinity transporters functional expression induced by low P concentrations and low-affinity transporters are operational at high P availabilities [62]. The unigenes c169602_g1 and c222312_g2 displayed a high homology with the PHO48 gene, which was identified in yeast and encoded a H+-Pi cotransporter [63]. The first P transporters identified in Arabidopsis showed a high homology to PHO84 and were named as PHT1 for plant H+-Pi cotransporters [19,63]. The PHO48 gene belongs to the high-affinity transporters, and the unigenes c169602_g1 and c222312_g2 we characterized exhibited a similar expression pattern when induced by P deficiency. Thus, we believe these two unigenes belong to the PHT1 subfamily and show high affinity with P transporters of Chinese fir. The unigene c290880_g1 expression pattern also suggests the high-affinity transporters and a high homology with the PHT gene in the marine diatom Thalassiosira pseudonana. We believe that these three unigenes belong to the PHT1s and are functional as they absorbed phosphorus from soil in Chinese fir, and the qRT-PCR results also supported this as the expression of unigenes was induced by low Pi stress. The unigene c222463_g1 annotated high homology with PHT2 gene in Medicago truncatula Gaertn. Usually, the PHT2s belong to the low-affinity transporters and are functional as transport Pi in plastids, but the exhibited expression pattern of unigene c222463_g1 was induced by P deficiency and more work needs to be conducted to research the gene function. The unigene c206932_g1 also annotated to the PHT2 gene but showed the opposite expression pattern with Unigene c222463_g1 in P deficient experiments, and it should be the Pi transporter in plastids. Overall, those unigenes exhibiting no low P deficient induced high expression change could belong to low-affinity transporters. Further investigations are required such as a comparative transcriptomic analysis with more samples and different levels of P supply, which could give us more clear results. Nevertheless, the PHT unigenes we discovered in this study will greatly enhance our understanding of the mechanisms of P uptake and translocation in Chinese fir. Ultimately, this work should prove to be helpful for the molecular-assisted selection and breeding of high P-use efficiency genotypes in this economically important timber species.

4. Conclusions

Phosphorus (P) is the most important limiting element for the successful growth of Chinese fir, which is a major timber crop in south China. Unfortunately, there is little research on phosphate transporters for this species because of the lack of a reference genome [21]. In this study, we generated and analyzed root, stem, and leaf transcriptome sequences to identify the unigenes functionally annotated with inorganic phosphate transporter activity. In total, 413,806 unigenes were obtained and functionally classified based on their matches in the GO, KOG, and KEGG databases. The 14 positive gene expression patterns in different phosphorus deficiency treatments were analyzed by qRT-PCR to explore their putative functions. This study demonstrated that the Illumina transcriptome sequence technology is a fast and cost-effective method for gene discovery and expression profiling in non-model plants, including conifers with notoriously large genomes. The transcriptome data and expression information for Chinese fir unigenes reported herein provide a basic foundation for functional genomic studies of phosphate transporters, and serve as an important public information platform for ongoing functional genomics research.

Supplementary Materials

The following are available online at www.mdpi.com/1999-4907/8/11/420/s1, Figure S1: Transcripts length distribution, Figure S2: KEGG classification of the Chinese fir Unigenes, Table S1: Primer pairs list, Table S2: Success rate statistics of gene annotation, Table S3: Annotation GO, Table S4: GO classification, Table S5: Annotation KOG, Table S6: Top 10 expressed genes, Table S7: Phosphate transporter activity genes.

Acknowledgments

We acknowledge the financial support of the National Natural Science Foundation of China (U1405211, 31500541).

Author Contributions

Conceived and designed the experiments: Ming Li, Suo-Suo Su, Ying Zhang, Peng-Fei Wu, and Xiang-Qin Ma. Performed the experiments: Ming Li, Suo-Suo Su, Ying Zhang, and Wan-Ting Chen. Analyzed the data: Ming Li, Suo-Suo Su, and Ying Zhang. Contributed reagents/materials/analysis tools: Ming Li. wrote the paper: Ming Li and Kenneth M. Cameron.

Conflicts of Interest

The authors declare no conflict of interest.

References

  1. Ma, X.Q.; Heal, K.V.; Liu, A.Q.; Jarvis, P.G. Nutrient cycling and distribution in different-aged plantations of chinese fir in southern china. For. Ecol. Manag. 2007, 243, 61–74. [Google Scholar] [CrossRef]
  2. Bian, L.M.; Shi, J.S.; Zheng, R.H.; Chen, J.H.; Wu, H.X. Genetic parameters and genotype-environment interactions of chinese fir (Cunninghamia lanceolata) in fujian province. Can. J. For. Res. 2014, 44, 582–592. [Google Scholar] [CrossRef]
  3. Yang, Y.S.; Guo, J.F.; Chen, G.S.; Xie, J.S.; Gao, R.; Li, Z.; Jin, Z. Carbon and nitrogen pools in chinese fir and evergreen broadleaved forests and changes associated with felling and burning in mid-subtropical China. For. Ecol. Manag. 2005, 216, 216–226. [Google Scholar] [CrossRef]
  4. Fan, H.B.; Hong, W. Estimation of dry deposition and canopy exchange in chinese fir plantations. For. Ecol. Manag. 2001, 147, 99–107. [Google Scholar] [CrossRef]
  5. Tian, D.L.; Xiang, W.H.; Chen, X.Y.; Yan, W.D.; Fang, X.; Kang, W.X.; Dan, X.W.; Peng, C.H.; Peng, Y.Y. A long-term evaluation of biomass production in first and second rotations of chinese fir plantations at the same site. Forestry 2011, 84, 411–418. [Google Scholar] [CrossRef]
  6. Zhang, X.-Q.; Kirschbaum, M.U.F.; Hou, Z.H.; Guo, Z.H. Carbon stock changes in successive rotations of chinese fir (Cunninghamia lanceolata (lamb) hook) plantations. For. Ecol. Manag. 2004, 202, 131–147. [Google Scholar] [CrossRef]
  7. Xu, X.J.; Timmer, V.R. Growth and nitrogen nutrition of chinese fir seedlings exposed to nutrient loading and fertilization. Plant Soil 1999, 216, 83–91. [Google Scholar] [CrossRef]
  8. Wu, P.F.; Tigabu, M.; Ma, X.Q.; Oden, P.C.; He, Y.L.; Yu, X.T.; He, Z.Y. Variations in biomass, nutrient contents and nutrient use efficiency among chinese fir provenances. Silvae Genet. 2011, 60, 95–105. [Google Scholar] [CrossRef]
  9. Chen, H.J. Phosphatase activity and p fractions in soils of an 18-year-old chinese fir (Cunninghamia lanceolata) plantation. For. Ecol. Manag. 2003, 178, 301–310. [Google Scholar] [CrossRef]
  10. Wu, P.F.; Ma, X.Q.; Tigabu, M.; Wang, C.; Liu, A.Q.; Oden, P.C. Root morphological plasticity and biomass production of two chinese fir clones with high phosphorus efficiency under low phosphorus stress. Can. J. For. Res. 2011, 41, 228–234. [Google Scholar] [CrossRef]
  11. Shenoy, V.; Kalagudi, G. Enhancing plant phosphorus use efficiency for sustainable cropping. Biotechnol. Adv. 2005, 23, 501–513. [Google Scholar] [CrossRef] [PubMed]
  12. Chen, F.S.; Niklas, K.J.; Liu, Y.; Fang, X.M.; Wan, S.Z.; Wang, H.M. Nitrogen and phosphorus additions alter nutrient dynamics but not resorption efficiencies of chinese fir leaves and twigs differing in age. Tree Physiol. 2015, 35, 1106–1117. [Google Scholar] [CrossRef] [PubMed]
  13. Zou, X.H.; Wu, P.F.; Chen, N.L.; Wang, P.; Ma, X.Q. Chinese fir root response to spatial and temporal heterogeneity of phosphorus availability in the soil. Can. J. For. Res. 2015, 45, 402–410. [Google Scholar] [CrossRef]
  14. Chen, Y.X.; He, Y.F.; Kumar, S.; Fu, Q.L.; Tian, G.M.; Lin, Q. Soil phosphorus status under restored plant covers established to control land degradation in the red soil region of south china. J. Soil Water Conserv. 2002, 57, 381–387. [Google Scholar]
  15. Tang, Y.C.; Zhang, X.Y.; Li, D.D.; Wang, H.M.; Chen, F.S.; Fu, X.L.; Fang, X.M.; Sun, X.M.; Yu, G.R. Impacts of nitrogen and phosphorus additions on the abundance and community structure of ammonia oxidizers and denitrifying bacteria in chinese fir plantations. Soil Biol. Biochem. 2016, 103, 284–293. [Google Scholar] [CrossRef]
  16. Wang, F.E.; Chen, Y.X.; Tian, G.M.; Kumar, S.; He, Y.F.; Fu, Q.L.; Lin, Q. Microbial biomass carbon, nitrogen and phosphorus in the soil profiles of different vegetation covers established for soil rehabilitation in a red soil region of southeastern china. Nutr. Cycl. Agroecosyst. 2004, 68, 181–189. [Google Scholar] [CrossRef]
  17. Hammond, J.P.; White, P.J. Sucrose transport in the phloem: Integrating root responses to phosphorus starvation. J. Exp. Bot. 2008, 59, 93–109. [Google Scholar] [CrossRef] [PubMed]
  18. Geng, C.-N.; Zhu, Y.-G.; Liu, W.-J.; Smith, S.E. Arsenate uptake and translocation in seedlings of two genotypes of rice is affected by external phosphate concentrations. Aquat. Bot. 2005, 83, 321–331. [Google Scholar] [CrossRef]
  19. Loth-Pereda, V.; Orsini, E.; Courty, P.-E.; Lota, F.; Kohler, A.; Diss, L.; Blaudez, D.; Chalot, M.; Nehls, U.; Bucher, M. Structure and expression profile of the phosphate pht1 transporter gene family in mycorrhizal Populus trichocarpa. Plant Physiol. 2011, 156, 2141–2154. [Google Scholar] [CrossRef] [PubMed]
  20. Kavka, M.; Polle, A. Phosphate uptake kinetics and tissue-specific transporter expression profiles in poplar (Populus × canescens) at different phosphorus availabilities. BMC Plant Biol. 2016, 16, 206. [Google Scholar] [CrossRef] [PubMed]
  21. Zhang, C.; Meng, S.; Li, M.; Zhao, Z. Genomic identification and expression analysis of the phosphate transporter gene family in poplar. Front. Plant Sci. 2016, 7, 1398. [Google Scholar] [CrossRef] [PubMed]
  22. Nussaume, L.; Kanno, S.; Javot, H.; Marin, E.; Nakanishi, T.M.; Thibaud, M.-C. Phosphate import in plants: Focus on the pht1 transporters. Front. Plant Sci. 2011, 2, 83. [Google Scholar] [CrossRef] [PubMed]
  23. Huang, H.-H.; Xu, L.-L.; Tong, Z.-K.; Lin, E.-P.; Liu, Q.-P.; Cheng, L.-J.; Zhu, M.-Y. De novo characterization of the chinese fir (Cunninghamia lanceolata) transcriptome and analysis of candidate genes involved in cellulose and lignin biosynthesis. BMC Genom. 2012, 13, 648. [Google Scholar] [CrossRef] [PubMed]
  24. Wang, G.; Gao, Y.; Yang, L.; Shi, J. Identification and analysis of differentially expressed genes in differentiating xylem of chinese fir (Cunninghamia lanceolata) by suppression subtractive hybridization. Genome 2007, 50, 1141–1155. [Google Scholar] [CrossRef] [PubMed]
  25. Wang, Z.; Chen, J.; Liu, W.; Luo, Z.; Wang, P.; Zhang, Y.; Zheng, R.; Shi, J. Transcriptome characteristics and six alternative expressed genes positively correlated with the phase transition of annual cambial activities in chinese fir (Cunninghamia lanceolata (Lamb.) Hook). PLoS ONE 2013, 8, e71562. [Google Scholar] [CrossRef] [PubMed]
  26. Li, D.; Deng, Z.; Qin, B.; Liu, X.; Men, Z. De novo assembly and characterization of bark transcriptome using illumina sequencing and development of est-ssr markers in rubber tree (Hevea brasiliensis Muell. Arg.). BMC Genom. 2012, 13, 192. [Google Scholar] [CrossRef] [PubMed]
  27. Grabherr, M.G.; Haas, B.J.; Yassour, M.; Levin, J.Z.; Thompson, D.A.; Amit, I.; Adiconis, X.; Fan, L.; Raychowdhury, R.; Zeng, Q. Full-length transcriptome assembly from rna-seq data without a reference genome. Nat. Biotechnol. 2011, 29, 644–652. [Google Scholar] [CrossRef] [PubMed]
  28. Deng, Y.; Li, J.; Wu, S.; Zhu, Y.; Chen, Y.; He, F. Integrated nr database in protein annotation system and its localization. Comput. Eng. 2006, 32, 71–74. [Google Scholar]
  29. Apweiler, R.; Bairoch, A.; Wu, C.H.; Barker, W.C.; Boeckmann, B.; Ferro, S.; Gasteiger, E.; Huang, H.; Lopez, R.; Magrane, M. Uniprot: The universal protein knowledgebase. Nucleic Acids Res. 2004, 32, D115–D119. [Google Scholar] [CrossRef] [PubMed]
  30. Ashburner, M.; Ball, C.A.; Blake, J.A.; Botstein, D.; Butler, H.; Cherry, J.M.; Davis, A.P.; Dolinski, K.; Dwight, S.S.; Eppig, J.T. Gene ontology: Tool for the unification of biology. Nat. Genet. 2000, 25, 25–29. [Google Scholar] [CrossRef] [PubMed]
  31. Koonin, E.V.; Fedorova, N.D.; Jackson, J.D.; Jacobs, A.R.; Krylov, D.M.; Makarova, K.S.; Mazumder, R.; Mekhedov, S.L.; Nikolskaya, A.N.; Rao, B.S. A comprehensive evolutionary classification of proteins encoded in complete eukaryotic genomes. Genome Biol. 2004, 5, R7. [Google Scholar] [CrossRef] [PubMed]
  32. Kanehisa, M.; Goto, S.; Kawashima, S.; Okuno, Y.; Hattori, M. The kegg resource for deciphering the genome. Nucleic Acids Res. 2004, 32, D277–D280. [Google Scholar] [CrossRef] [PubMed]
  33. Kanehisa, M.; Araki, M.; Goto, S.; Hattori, M.; Hirakawa, M.; Itoh, M.; Katayama, T.; Kawashima, S.; Okuda, S.; Tokimatsu, T. Kegg for linking genomes to life and the environment. Nucleic Acids Res. 2008, 36, D480–D484. [Google Scholar] [CrossRef] [PubMed]
  34. Götz, S.; García-Gómez, J.M.; Terol, J.; Williams, T.D.; Nagaraj, S.H.; Nueda, M.J.; Robles, M.; Talón, M.; Dopazo, J.; Conesa, A. High-throughput functional annotation and data mining with the blast2go suite. Nucleic Acids Res. 2008, 36, 3420–3435. [Google Scholar] [CrossRef] [PubMed]
  35. Finn, R.D.; Bateman, A.; Clements, J.; Coggill, P.; Eberhardt, R.Y.; Eddy, S.R.; Heger, A.; Hetherington, K.; Holm, L.; Mistry, J. Pfam: The protein families database. Nucleic Acids Res. 2013, 42, D222–D230. [Google Scholar] [CrossRef] [PubMed]
  36. Eddy, S.R. Profile hidden markov models. Bioinformatics 1998, 14, 755–763. [Google Scholar] [CrossRef] [PubMed]
  37. Anders, S.; Huber, W. Differential expression analysis for sequence count data. Genome Biol. 2010, 11, R106. [Google Scholar] [CrossRef] [PubMed]
  38. Mortazavi, A.; Williams, B.A.; McCue, K.; Schaeffer, L.; Wold, B. Mapping and quantifying mammalian transcriptomes by rna-seq. Nat. Methods 2008, 5, 621–628. [Google Scholar] [CrossRef] [PubMed]
  39. Young, M.D.; Wakefield, M.J.; Smyth, G.K.; Oshlack, A. Gene ontology analysis for rna-seq: Accounting for selection bias. Genome Biol. 2010, 11, R14. [Google Scholar] [CrossRef] [PubMed]
  40. Mao, X.; Cai, T.; Olyarchuk, J.G.; Wei, L. Automated genome annotation and pathway identification using the kegg orthology (ko) as a controlled vocabulary. Bioinformatics 2005, 21, 3787–3793. [Google Scholar] [CrossRef] [PubMed]
  41. Livak, K.J.; Schmittgen, T.D. Analysis of relative gene expression data using real-time quantitative pcr and the 2−ΔΔCT method. Methods 2001, 25, 402–408. [Google Scholar] [CrossRef] [PubMed]
  42. Patel, R.K.; Jain, M. Ngs qc toolkit: A toolkit for quality control of next generation sequencing data. PLoS ONE 2012, 7, e30619. [Google Scholar] [CrossRef] [PubMed]
  43. Qiu, Z.; Wan, L.; Chen, T.; Wan, Y.; He, X.; Lu, S.; Wang, Y.; Lin, J. The regulation of cambial activity in chinese fir (Cunninghamia lanceolata) involves extensive transcriptome remodeling. New Phytol. 2013, 199, 708–719. [Google Scholar] [CrossRef] [PubMed]
  44. Shi, C.-Y.; Yang, H.; Wei, C.-L.; Yu, O.; Zhang, Z.-Z.; Jiang, C.-J.; Sun, J.; Li, Y.-Y.; Chen, Q.; Xia, T. Deep sequencing of the Camellia sinensis transcriptome revealed candidate genes for major metabolic pathways of tea-specific compounds. BMC Genom. 2011, 12, 131. [Google Scholar] [CrossRef] [PubMed]
  45. Zhang, X.-M.; Zhao, L.; Larson-Rabin, Z.; Li, D.-Z.; Guo, Z.-H. De novo sequencing and characterization of the floral transcriptome of Dendrocalamus latiflorus (poaceae: Bambusoideae). PLoS ONE 2012, 7, e42082. [Google Scholar] [CrossRef] [PubMed]
  46. Parchman, T.L.; Geist, K.S.; Grahnen, J.A.; Benkman, C.W.; Buerkle, C.A. Transcriptome sequencing in an ecologically important tree species: Assembly, annotation, and marker discovery. BMC Genom. 2010, 11, 180. [Google Scholar] [CrossRef] [PubMed]
  47. Zhu, J.-Y.; Zhao, N.; Yang, B. Global transcriptome profiling of the pine shoot beetle, tomicus yunnanensis (coleoptera: Scolytinae). PLoS ONE 2012, 7, e32291. [Google Scholar] [CrossRef] [PubMed]
  48. Rigault, P.; Boyle, B.; Lepage, P.; Cooke, J.E.; Bousquet, J.; MacKay, J.J. A white spruce gene catalog for conifer genome analyses. Plant Physiol. 2011, 157, 14–28. [Google Scholar] [CrossRef] [PubMed]
  49. Nystedt, B.; Street, N.R.; Wetterbom, A.; Zuccolo, A.; Lin, Y.-C.; Scofield, D.G.; Vezzi, F.; Delhomme, N.; Giacomello, S.; Alexeyenko, A. The norway spruce genome sequence and conifer genome evolution. Nature 2013, 497, 579–584. [Google Scholar] [CrossRef] [PubMed] [Green Version]
  50. Consortium, G.O. The gene ontology project in 2008. Nucleic Acids Res. 2008, 36, D440–D444. [Google Scholar] [CrossRef] [PubMed]
  51. Mossio, M.; Montévil, M.; Longo, G. Theoretical principles for biology: Organization. Prog. Biophys. Mol. Biol. 2016, 122, 24–35. [Google Scholar] [CrossRef] [PubMed]
  52. Tatusov, R.L.; Galperin, M.Y.; Natale, D.A.; Koonin, E.V. The cog database: A tool for genome-scale analysis of protein functions and evolution. Nucleic Acids Res. 2000, 28, 33–36. [Google Scholar] [CrossRef] [PubMed]
  53. Tatusov, R.L.; Fedorova, N.D.; Jackson, J.D.; Jacobs, A.R.; Kiryutin, B.; Koonin, E.V.; Krylov, D.M.; Mazumder, R.; Mekhedov, S.L.; Nikolskaya, A.N. The cog database: An updated version includes eukaryotes. BMC Bioinform. 2003, 4, 41. [Google Scholar] [CrossRef] [PubMed]
  54. Cancino-Rodezno, A.; Lozano, L.; Oppert, C.; Castro, J.I.; Lanz-Mendoza, H.; Encarnación, S.; Evans, A.E.; Gill, S.S.; Soberón, M.; Jurat-Fuentes, J.L. Comparative proteomic analysis of Aedes aegypti larval midgut after intoxication with cry11aa toxin from bacillus thuringiensis. PLoS ONE 2012, 7, e37034. [Google Scholar] [CrossRef] [PubMed]
  55. Garber, M.; Grabherr, M.G.; Guttman, M.; Trapnell, C. Computational methods for transcriptome annotation and quantification using rna-seq. Nat. Methods 2011, 8, 469–477. [Google Scholar] [CrossRef] [PubMed]
  56. Baseler, W.A.; Thapa, D.; Jagannathan, R.; Dabkowski, E.R.; Croston, T.L.; Hollander, J.M. Mir-141 as a regulator of the mitochondrial phosphate carrier (slc25a3) in the type 1 diabetic heart. Am. J. Physiol. Cell Physiol. 2012, 303, C1244–C1251. [Google Scholar] [CrossRef] [PubMed]
  57. Zhu, W.; Miao, Q.; Sun, D.; Yang, G.; Wu, C.; Huang, J.; Zheng, C. The mitochondrial phosphate transporters modulate plant responses to salt stress via affecting atp and gibberellin metabolism in arabidopsis thaliana. PLoS ONE 2012, 7, e43530. [Google Scholar] [CrossRef] [PubMed]
  58. Jia, F.; Wan, X.; Zhu, W.; Sun, D.; Zheng, C.; Liu, P.; Huang, J. Overexpression of mitochondrial phosphate transporter 3 severely hampers plant development through regulating mitochondrial function in arabidopsis. PLoS ONE 2015, 10, e0129717. [Google Scholar] [CrossRef] [PubMed]
  59. Trentmann, O.; Jung, B.; Neuhaus, H.E.; Haferkamp, I. Nonmitochondrial atp/adp transporters accept phosphate as third substrate. J. Biol. Chem. 2008, 283, 36486–36493. [Google Scholar] [CrossRef] [PubMed]
  60. Perrin, J.; Mortier, M.; Jacomin, A.-C.; Viargues, P.; Thevenon, D.; Fauvarque, M.-O. The nonaspanins tm9sf2 and tm9sf4 regulate the plasma membrane localization and signalling activity of the peptidoglycan recognition protein pgrp-lc in drosophila. J. Innate Immun. 2014, 7, 37–46. [Google Scholar] [CrossRef] [PubMed]
  61. Baker, A.; Ceasar, S.A.; Palmer, A.J.; Paterson, J.B.; Qi, W.; Muench, S.P.; Baldwin, S.A. Replace, reuse, recycle: Improving the sustainable use of phosphorus by plants. J. Exp. Bot. 2015, 66, 3523–3540. [Google Scholar] [CrossRef] [PubMed]
  62. López-Arredondo, D.L.; Leyva-González, M.A.; González-Morales, S.I.; López-Bucio, J.; Herrera-Estrella, L. Phosphate nutrition: Improving low-phosphate tolerance in crops. Annu. Rev. Plant Biol. 2014, 65, 95–123. [Google Scholar] [CrossRef] [PubMed]
  63. Poirier, Y.; Jung, J.-Y. Phosphate transporters. Annu. Plant Rev. Phosphorus Metab. Plants 2015, 48, 125. [Google Scholar]
Figure 1. Unigenes length distribution. The y-axis number has been converted into a logarithmic scale.
Forests 08 00420 g001
Figure 2. Distribution of uniquely mapped reads of assembled unigenes. The y-axis indicates the number of reads. The x-axis indicates the number of assembled unigenes.
Forests 08 00420 g002
Figure 3. Characteristics of the homology search of Illumina sequences against the NR database.
Forests 08 00420 g003
Figure 4. Distribution of GO categories assigned to the Chinese fir transcriptome.
Forests 08 00420 g004
Figure 5. KOG function classification of the Chinese fir transcriptome.
Forests 08 00420 g005
Figure 6. Expression analysis of candidate phosphate transporter unigenes in phosphorus deficient and recovery supply by qRT-PCR. The x-axis represents low P or starved P treatment from 0 h to 48 h and then recovery P supply for 12 h, 24 h, and 48 h; the y-axis represents the unigene relative expression level.
Forests 08 00420 g006
Table 1. Data quality and statistics.
SampleRaw ReadsClean ReadsClean BasesError (%)Q20 1 (%)Q30 2 (%)GC (%)
Root80,914,32876,829,21011.52 G0.0296.6492.1847.94
Stem86,439,14682,165,99012.32 G0.0196.792.3144.22
Leaves81,365,60477,534,07811.63 G0.0196.7992.4544.22
Summary248,719,078236,529,27835.47 G 45.46
1 Q20: The percentage of bases with a Phred value >20; 2 Q30: The percentage of bases with a Phred value >30.
Table 2. Length distribution of assembled transcripts and Unigenes.
Fragment Length (bp)TranscriptsUnigenes
200–500 bp338,030311,104
500–1000 bp74,14458,295
1000–2000 bp43,31129,834
>2000 bp23,55014,573
Total479,035413,806
Minimal length (bp)201201
Maximal length (bp)17,83517,835
N50 (bp)891671
Mean length (bp)591520
Total Nucleotides282,892,631215,269,640
Table 3. Putative identification and function of annotated PHT genes for qRT-PCR analysis.
Gene_IDGene Length (bp)FPKM LeafFPKM RootFPKM StemFunction Annotation
c169602_g1110201.730MFS transporter, PHO48, high affinity inorganic phosphate transporter
c222312_g245101.160MFS transporter, PHO48, high affinity inorganic phosphate transporter
c217564_g127671.860.280.54MFS transporter, ACS family, SLC17A, inorganic diphosphate transmembrane transporter activity
c305983_g124706.860SLC20A PIT, inorganic phosphate transmembrane transporter activity
c290880_g126306.230SLC20A PIT, inorganic phosphate transmembrane transporter activity
c303734_g127204.890SLC20A PIT, inorganic phosphate transmembrane transporter activity
c245203_g127103.350SLC20A PIT, inorganic phosphate transmembrane transporter activity
c140065_g142201.860SLC20A PIT, inorganic phosphate transmembrane transporter activity
c423777_g146601.260SLC20A PIT, inorganic phosphate transmembrane transporter activity
c123360_g199001.020SLC20A PIT, inorganic phosphate transmembrane transporter activity
c222463_g128414.570.142.49Inorganic phosphate transporter 2-1 (Medicago truncatula)
c7218_g147800.510SLC20A PIT, inorganic phosphate transmembrane transporter activity
c144269_g153200.940SLC20A PIT, inorganic phosphate transmembrane transporter activity
c206932_g131270.80.610.95Inorganic phosphate transporter 2-1 (Medicago truncatula)

