Article

Genetic Variation in Quercus acutissima Carruth., in Traditional Japanese Rural Forests and Agricultural Landscapes, Revealed by Chloroplast Microsatellite Markers

1
Graduate School of Agricultural and Life Sciences, University of Tokyo, 1-1-1, Yayoi, Bunkyo, Tokyo 113-8657, Japan
2
Sugadaira Research Station, Mountain Science Center, University of Tsukuba, 1278-294 Sugadairakogen, Ueda, Nagano 386-2204, Japan
3
Department of Forest Molecular Genetics and Biotechnology, Forestry and Forest Products Research Institute, Matsunosato 1, Tsukuba, Ibaraki 305-8687, Japan
4
NTT DATA Intellink Corporation, Tsukishima 1-15-7, Chuo, Tokyo 104-0052, Japan
5
Mynavi Corporation, Chiyoda, Tokyo 100-0003, Japan
6
School of Ecological and Environmental System, Kyungpook National University, Sangju 742-711, Korea
7
State Key Laboratory of Forest Genetics and Breeding, Northeast Forestry University, Hexing Road 26, Harbin 150040, China
*
Author to whom correspondence should be addressed.
Forests 2017, 8(11), 451; https://doi.org/10.3390/f8110451
Submission received: 23 August 2017 / Revised: 1 November 2017 / Accepted: 13 November 2017 / Published: 17 November 2017
(This article belongs to the Special Issue Genetics and Genomics of Forest Trees)

Abstract

:
Quercus acutissima Carruth. is an economically important species that has long been cultivated in Japan, so is a valuable subject for investigating the impact of human activities on genetic variation in trees. In total, 2152 samples from 18 naturally regenerated populations and 28 planted populations in Japan and 13 populations from the northeastern part of Eurasia, near Japan, were analyzed using six maternally inherited chloroplast (cpDNA) simple sequence repeat (SSR) markers. Although 23 haplotypes were detected in total, both the Japanese natural and artificial populations exhibited much lower genetic diversity than the continental populations. The level of genetic differentiation among natural populations in Japan was also much lower (GST = 0.261) than that on the continent (GST = 0.856). These results suggest that human activities, such as historical seed transfer, have reduced genetic diversity within and among populations and resulted in a homogeneous genetic structure in Japan. The genetic characteristics of natural and artificial populations of Quercus acutissima in Japan are almost the same and it is likely that most of the natural populations are thought to have originated from individuals that escaped from plantations.

1. Introduction

Genetic diversity and genetic structure reflect the evolutionary process, including aspects such as colonization history and adaptation to the environment over long periods. Ecological characteristics, such as the mating system, seed dispersal and hybridization with related species, are also reflected in the genetic variation of tree species. However, historical human activities, such as the transfer of seeds and saplings, breeding, domestication and environmental impacts may also be reflected in the genetic structure of tree species. Relatively few studies have examined tree species strongly affected by human activities over a long period [1,2,3,4,5]. Appropriate and sustainable use and management of forest systems, however, requires an understanding of the effects of human activities on genetic structure and population demography. For example, olive (Olea europaea L.) and cork oak (Quercus suber L.) are species that were considered to have been greatly influenced by human beings in Europe. Besnard et al. [6] reported five clades in a chlorotype consensus phylogram of olive populations in Africa and the Mediterranean, with each located in a specific geographic zone. However, within the Mediterranean area, the chlorotype originated in the east and had spread west, indicating seed transportation by humans. On the other hand, cork oak retains clear phylogeographic structure in the western Mediterranean and much less human impact than expected was detected [7]. This may be because cork oak has approximately the same distribution today as it did prior to the Neolithic [7] and seed transportation by humans has been rare. These studies suggest that the relationship between historical human activities and genetic structure of valuable tree species is complicated and their pattern is not always as expected.
Molecular makers are very useful tools to clarify the genetic structure patterns exhibited by tree species. Among the many molecular makers available, chloroplast DNA (cpDNA) is particularly useful for determining colonization routes, because (i) it does not recombine, therefore haplotypes remain mostly unchanged when passed to the next generation; and (ii) in angiosperms it is generally transmitted through seed only [8,9,10] because of its maternal inherited mode, so colonization patterns which derive from seed dispersal are not obscured by pollen flow [11]. Thus, levels of among-population genetic differentiation are expected to be much higher for cpDNA markers than for nuclear DNA markers [12]. However, detecting useful polymorphisms at the population level is often difficult because of the low level of substitutions in the chloroplast genome; chloroplast microsatellites represent potentially useful markers to circumvent this problem and, to date, studies have demonstrated high levels of inter- and intra-specific variability [7,13,14,15]. There are many studies which employed chloroplast microsatellites, so called cpSSR markers, to clarify the phylogeography of oak species widely in the world (e.g., [16,17,18]).
Quercus acutissima Carruth., Lepidobalanus Sect. Cerris, is one of the most economically and ecologically important deciduous tree species growing in Satoyama, a traditional Japanese rural forest and agricultural landscape. It is an anemophilous species and its seeds are dispersed by gravity and animals such as rodents [19]. This species is found in the warm-temperate zone from East Asia to the Himalayas [20], but the range is considered to be heavily influenced by human activities because of its long cultivation history, like that of European chestnut, Castanea sativa Mill. The origin of Japanese populations of Q. acutissima is unknown. Unlike other Japanese oak species, Q. acutissima is seldom observed in mountainous areas, but is found in and around human settlements in Japan. Kurata [21] questioned whether Q. acutissima is native to Japan. Fukamachi et al. [22] also suggested that Q. acutissima is an introduction from China, because it is less common than the native oaks Quercus serrata Murray and Quercus crispla Blume in woodlands, and it is usually pollarded, whereas the native oaks are coppiced in the Satoyama landscape. Although there is no available pollen fossil data specific to Q. acutissima in Japan, during the last glacial, warm-temperate evergreen broadleaved forest, in which Q. acutissima grows, was restricted to the Paleo-Yaku Peninsula, around the southern island of Kyushu, based upon pollen and plant macrofossil data [23]. Moreover, a recent study based on ecological niche model by Zhang et al. [24] revealed that Q. acutissima could not distribute in the main archipelago of Japan during the last glacial maximum (ca. 21,000 years BP). About 6000 years ago, when the climate was warmest, the evergreen forest extended to Kanto area, central Japan [25]. The plant residue of Q. acutissima or Quercus variabillis Blume (Lepidobalanus Sect. Cerris) has been found in the Japanese archipelago as fossil wood from the Jomon era, from approximately 16,500 to 3000 years ago [26]. The timber was used as a building material [26] and the seeds as food [27]. In recent years, especially since the 1960s, the demand for fresh Shiitake mushrooms has grown and Q. acutissima logs for cultivation have become more scarce, so the species has been planted widely in Japan [28].
In Japan, there are 15 native Quercus species [20] and they are widely distributed from south to north and from the coasts to the mountains. They are familiar to forest researchers and many ecological studies have been conducted on them, especially in the temperate zone (e.g., [29,30]). However, only a few reports have examined the phylogeographic characteristics of oak trees (e.g., [31,32,33]) and the genetic variation in Q. acutissima in Japan has not been investigated.
The aims of the study reported here were (1) to clarify the genetic diversity and structure of Q. acutissima using chloroplast microsatellite; (2) to detect evidence of the impact of human activity on genetic diversity and structure; and (3) to compare genetic variation in naturally regenerated and planted populations in Japan and continental populations in eastern Eurasia (South Korea and Northeast China).

2. Materials and Methods

2.1. Sampling of Plant Populations

Leaves of Q. acutissima of adult individuals were collected from 18 populations that had regenerated naturally along rivers (except for two populations, GO and SM) and two Gene Conservation Forests (Japanese natural populations) and 28 planted populations in Japan, covering the species’ entire distribution (Table 1, Figure 1). Naturally regenerated populations were seldom found except for in sunny river valleys; they were small populations containing several to several dozen individuals. We selected the individuals separated by at least 10 m from the next tree in river side areas and 30 m in mountain areas. Every planted population was a subcompartment of a private forest without information of seed source and all of them were older than 40 years according to the forest registers. In order to compare Japanese populations with natural continental populations in mountainous areas or hillside, thirteen populations from northeastern Eurasia (referred to as continental populations, hereafter) (Table 1, Figure 1) were sampled, where possible, separated by at least 30 m from the next tree. In total, 59 populations, consisting of a total of 2152 individuals were sampled. Leaves were dried with silica gel in plastic bags before DNA extraction.

2.2. Chloroplast SSR Analysis

Total DNA was extracted from dried material using the modified CTAB method [34]. Each extract was then amplified by polymerase chain reaction (PCR) using a multiplex PCR Kit (Qiagen, Hilden, German) with six maternally inherited cpSSR primer pairs—μcd4, μcd5, μdt1, μdt3, μdt4, and μkk4 [35]—developed for Quercus. All primers were included in the same reaction mixture. Each 5.0-μL amplification reaction mixture contained 2.5 μL of MasterMix solution (Qiagen, Hilden, German), 1.5 μL of RNase-free water, 0.5 μL of the primer mix solution (including the six pairs of primers, each at 0.5 pmol/μL), and 0.5 μL of the extracted DNA (5–100 μg/mL). The reaction program was as follows: 15 min denaturation at 95 °C followed by 25 cycles of 30 s, denaturation at 94 °C, annealing for 90 s at 48 °C, and extension for 60 s at 72 °C, followed by a final extension at 60 °C for 30 min. CpSSR PCR products were analyzed using an ABI3100 Genetic Analyser (Thermo Fisher Scientific Inc., Waltham, MA, USA), and the sizes of the amplified alleles were estimated using GeneMapper software (Thermo Fisher Scientific Inc., Waltham, MA, USA).

2.3. Genetic Data Analysis

Haplotypes were determined based on the fragment length of the six cpSSR markers. The level of polymorphism within populations was estimated using haplotypic diversity based on unordered (hs) or ordered haplotypes (vs) following Pons and Petit [36], taking the number of differences in the repeats of cpSSR haplotypes into account. In the overall sample, total haplotypic diversity statistics based on unordered alleles which assumes that new allele is generated randomly, and ordered alleles assuming a stepwise mutation model, for the mutations of the SSR (ht and vt, respectively) [37], were also calculated following Pons and Petit [36]. Haplotypic richness was calculated using RAREFAC [38] software.
Population differentiation at chloroplast loci was then evaluated in terms of unordered alleles (GST) [39] and ordered alleles, which assumes a stepwise mutation model of the SSR (RST [40]). Moreover, NST [36] was also employed to evaluate population differentiation. If a bias in homoplasy or multistep mutation of the SSR is large enough, it is better to employ NST, which considers the number of shared cpSSR loci with an identical allele as genetic distance among haplotypes. Following Pons and Petit [36], 1000 random haplotype permutations among populations were used to test whether the RST and NST values were significantly higher than the GST values. These calculations and tests were conducted using software PERMUT/CpSSR ver 2.0 [36]. Because GST, the index of the genetic differentiation values, is dependent on the level of genetic variation, standardized values of GST and GST [41], which can range from 0 (no differentiation) to 1 (complete differentiation) regardless of polymorphism of examined markers, were also calculated. To determine phylogenetic relationships among the chloroplast DNA haplotypes, a Neighbor-net [42] was constructed with the software SplitsTree4 [43]. To clarify the genetic relationships between populations, a neighbor joining tree was constructed based on the genetic distance of (δμ)2 [44] using Populations ver.1.2.30 [45] and visualized on a hypometric map using Mapmaker and GenGIS2 software [46].

3. Results

3.1. Haplotypes

The six chloroplast microsatellite primers assayed for 2152 individuals in 59 populations (Table 1) gave 22 different alleles: μcd4, three alleles; μcd5, two alleles; μdt1, four alleles; μdt3, five alleles; μdt4, five alleles; and μkk4, three alleles. Thus, 23 haplotypes were identified (Table 2) and the haplotypes were divided into three groups on the Neighbor-net (Figure 2). Seven, eight and eight haplotypes belonged to Group I, II and III, respectively. In the total sample, haplotype 20 of group III and haplotype 7 of group I were the most common, with frequencies of 72.2% and 11.9%, respectively. Haplotype 20 was dominant in Japan and haplotype 7 was dominant on the continent (Table 2, Figure 1). In total, there were four haplotypes in the Japanese natural populations, twelve in the plantation populations, and twenty in the continental populations (Table 2). The number of haplotypes unique to each population group was three (haplotypes 4, 10, 38) in the Japanese plantations and ten (haplotypes 1, 12, 21, 32, 34, 36, 37, 39, 40, 41) in the continental populations. There were no haplotypes that only occurred in Japanese natural populations.

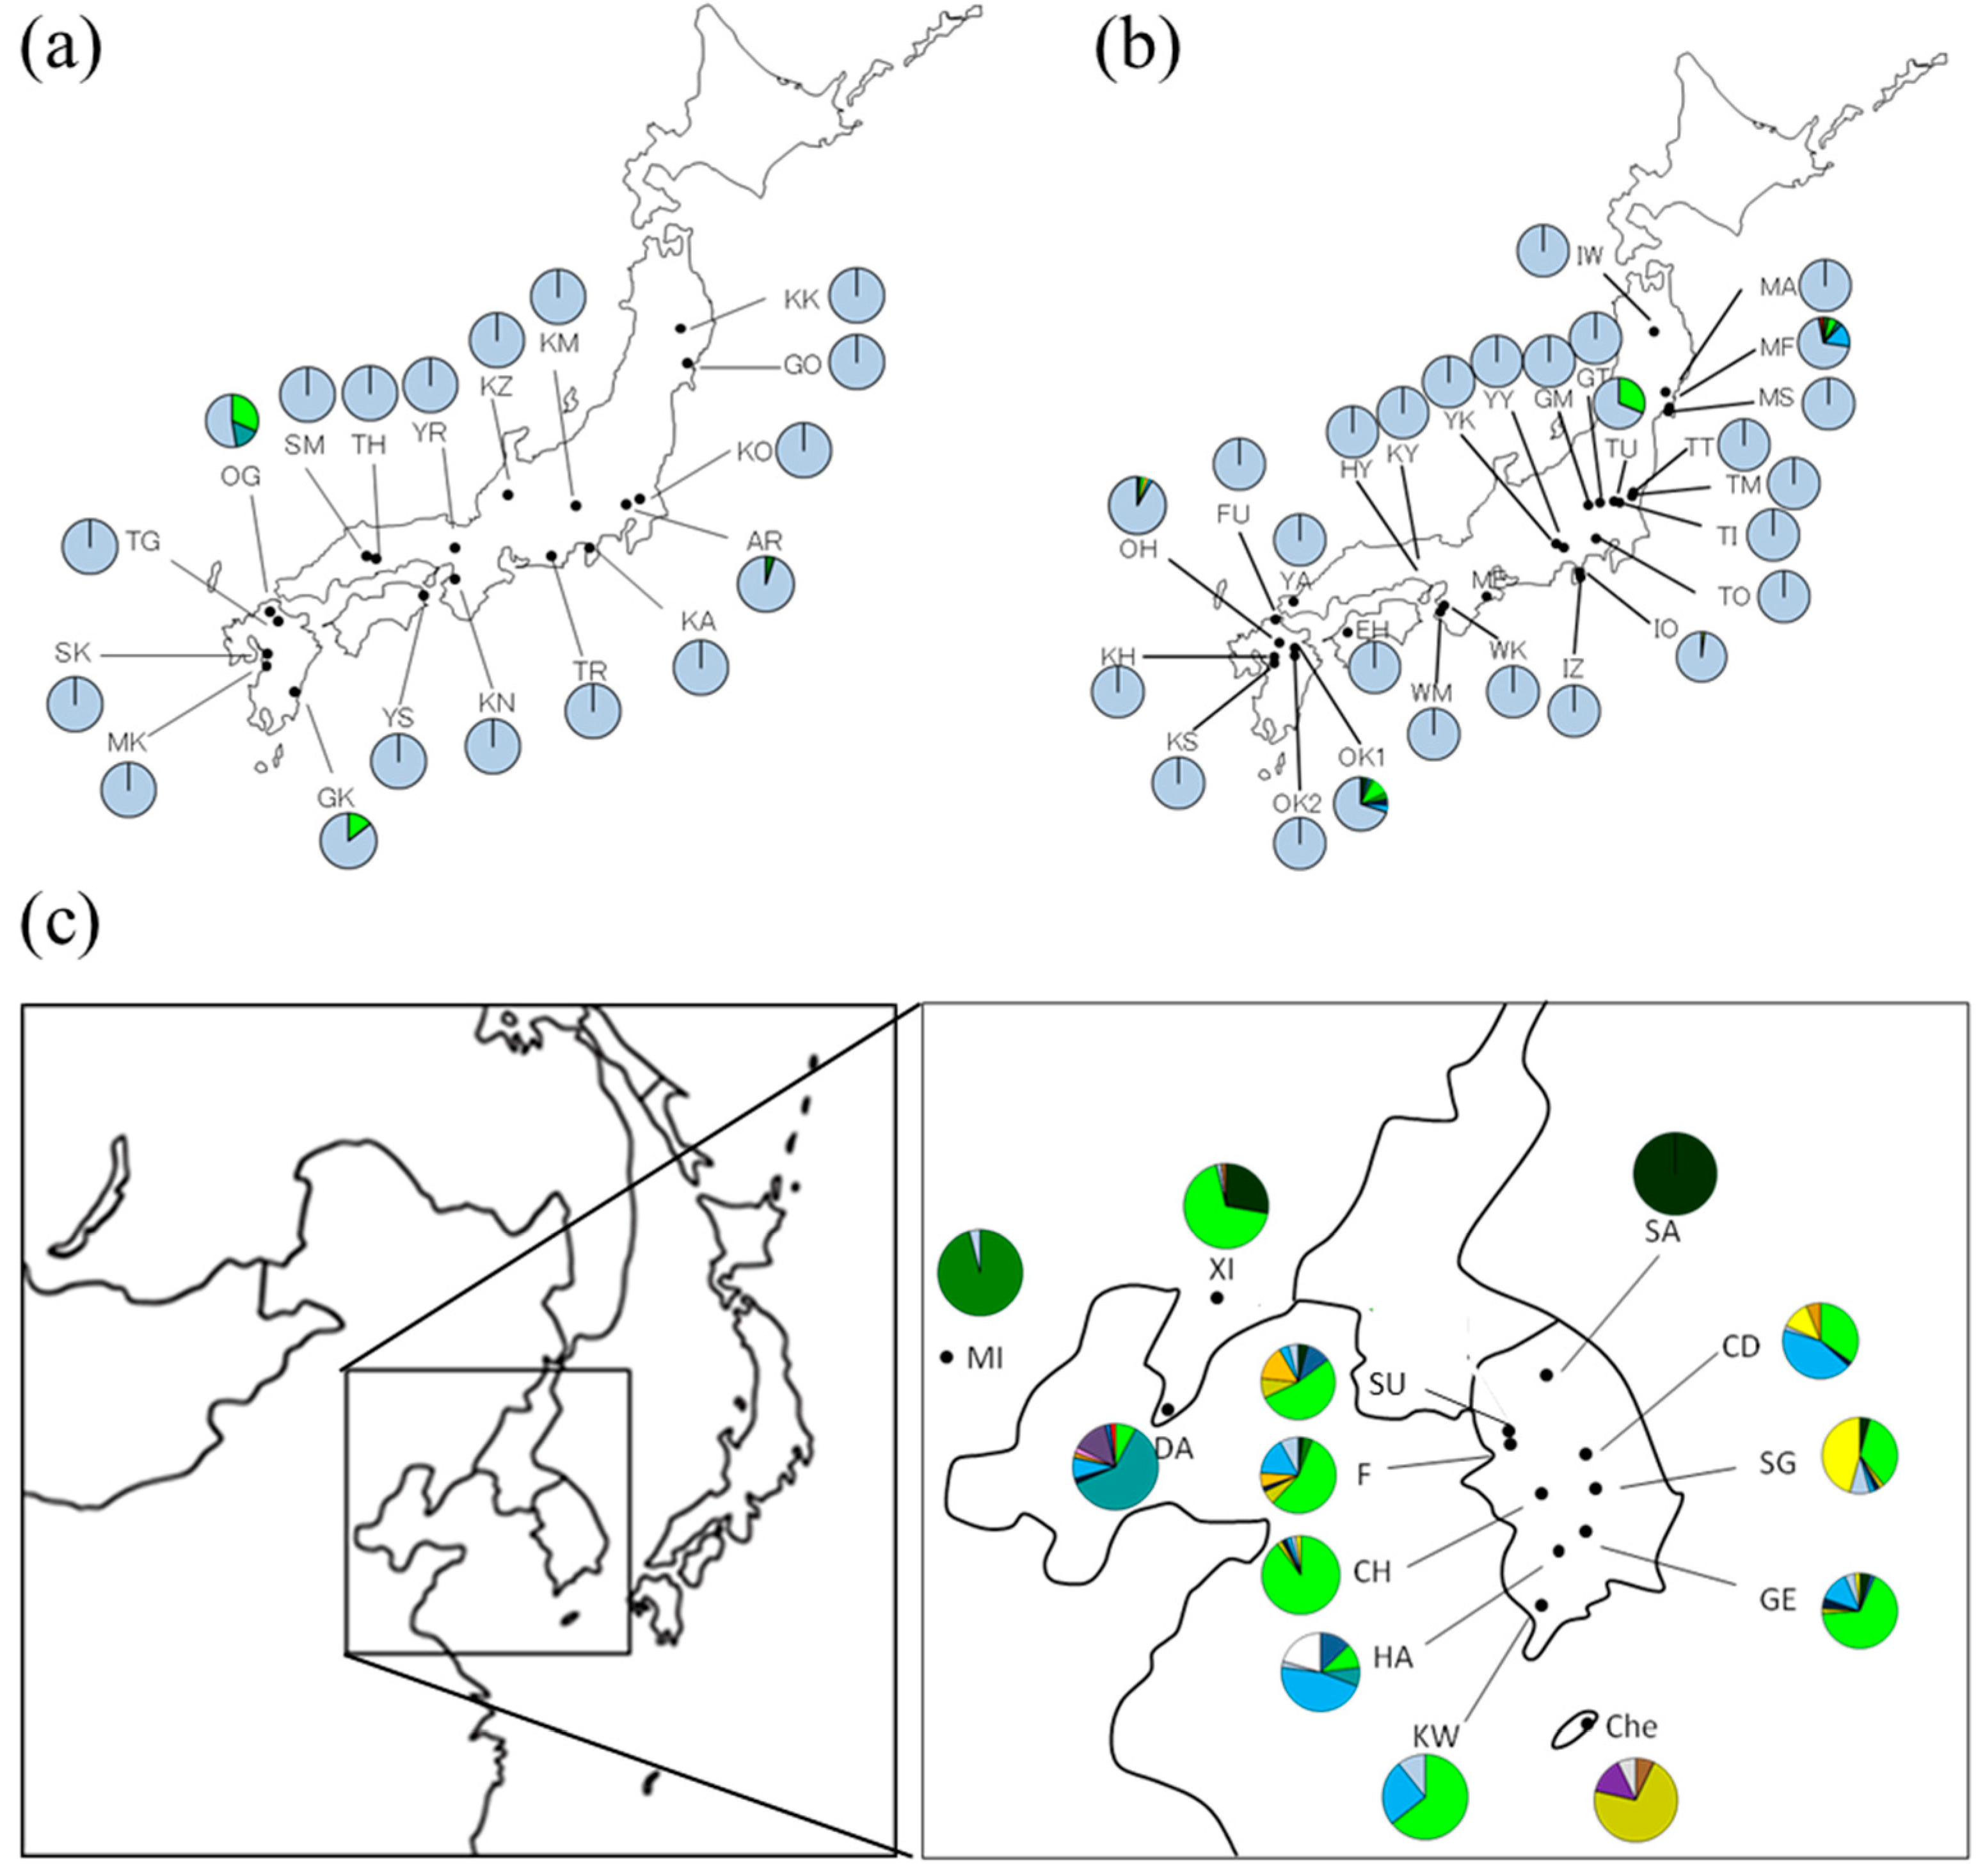
3.2. Geographical Distribution of Haplotypes of Q. acutissima

The relationship between geographical distribution and genetic variation is shown in Figure 1 and Table 1 and Table 2. Haplotype 20 was found at high frequencies in all natural and artificial plantations in Japan and was also present at low frequencies in 11 of 13 continental populations, at most 10.7% occurrences in KW and 8.7% in SG in South Korea. On the other hand, 87.5% of the occurrences of Haplotype 7 were in 10 of 13 continental populations and only six of the 46 Japanese populations contained this haplotype. Ten of the 23 haplotypes were unique to a single population. On the continent, haplotypes 1, 39 and 41 were only found in Che; haplotypes 34, 36 and 40 were only found in DA; and haplotype 32 was only found in HA. In Japan, haplotype 38 was only found in MF, haplotype 4 only in IO and haplotype 10 only in the OK1 plantation. In Japan, 11 haplotypes, i.e., all except haplotype 20, were found at low frequencies and they were concentrated in eight of the 46 populations. Although no phylogeographic structure was detected because of the fixation of haplotype 20 in Japan, haplotypes of Group II were distributed mainly in China and northern Korea and haplotypes of Group III were dominant only in HA on the continent (Figure 3).

3.3. Genetic Diversity within Populations and Differentiation between Populations of Q. acutissima

Most populations, both natural and artificial, in Japan were monomorphic, containing only haplotype 20; in contrast, on the continent, all populations except for SA were polymorphic. Within population variation is shown in Table 3. All calculated parameters were higher on the continent (hs: 0.488; vs: 0.482) than in Japan (hs: 0.055, 0.059; vs: 0.053, 0.057 in natural and artificial populations, respectively). In Japan, the values were almost the same in the natural and artificial populations. Although the number of haplotypes in artificial populations is more than in natural populations, most of the artificial populations were also dominated haplotype 20 (Table 1). Only five artificial populations had multiple haplotypes (Figure 1).The level of population subdivision was relatively low, for the natural and artificial populations in Japan, and the continental populations, respectively. These values were low for both types of population in Japan. RST was not significantly larger than GST for any dataset. Only in the continental populations was high population differentiation (GST = 0.856) shown, and NST was significantly higher than GST, suggesting phylogeographic structure.

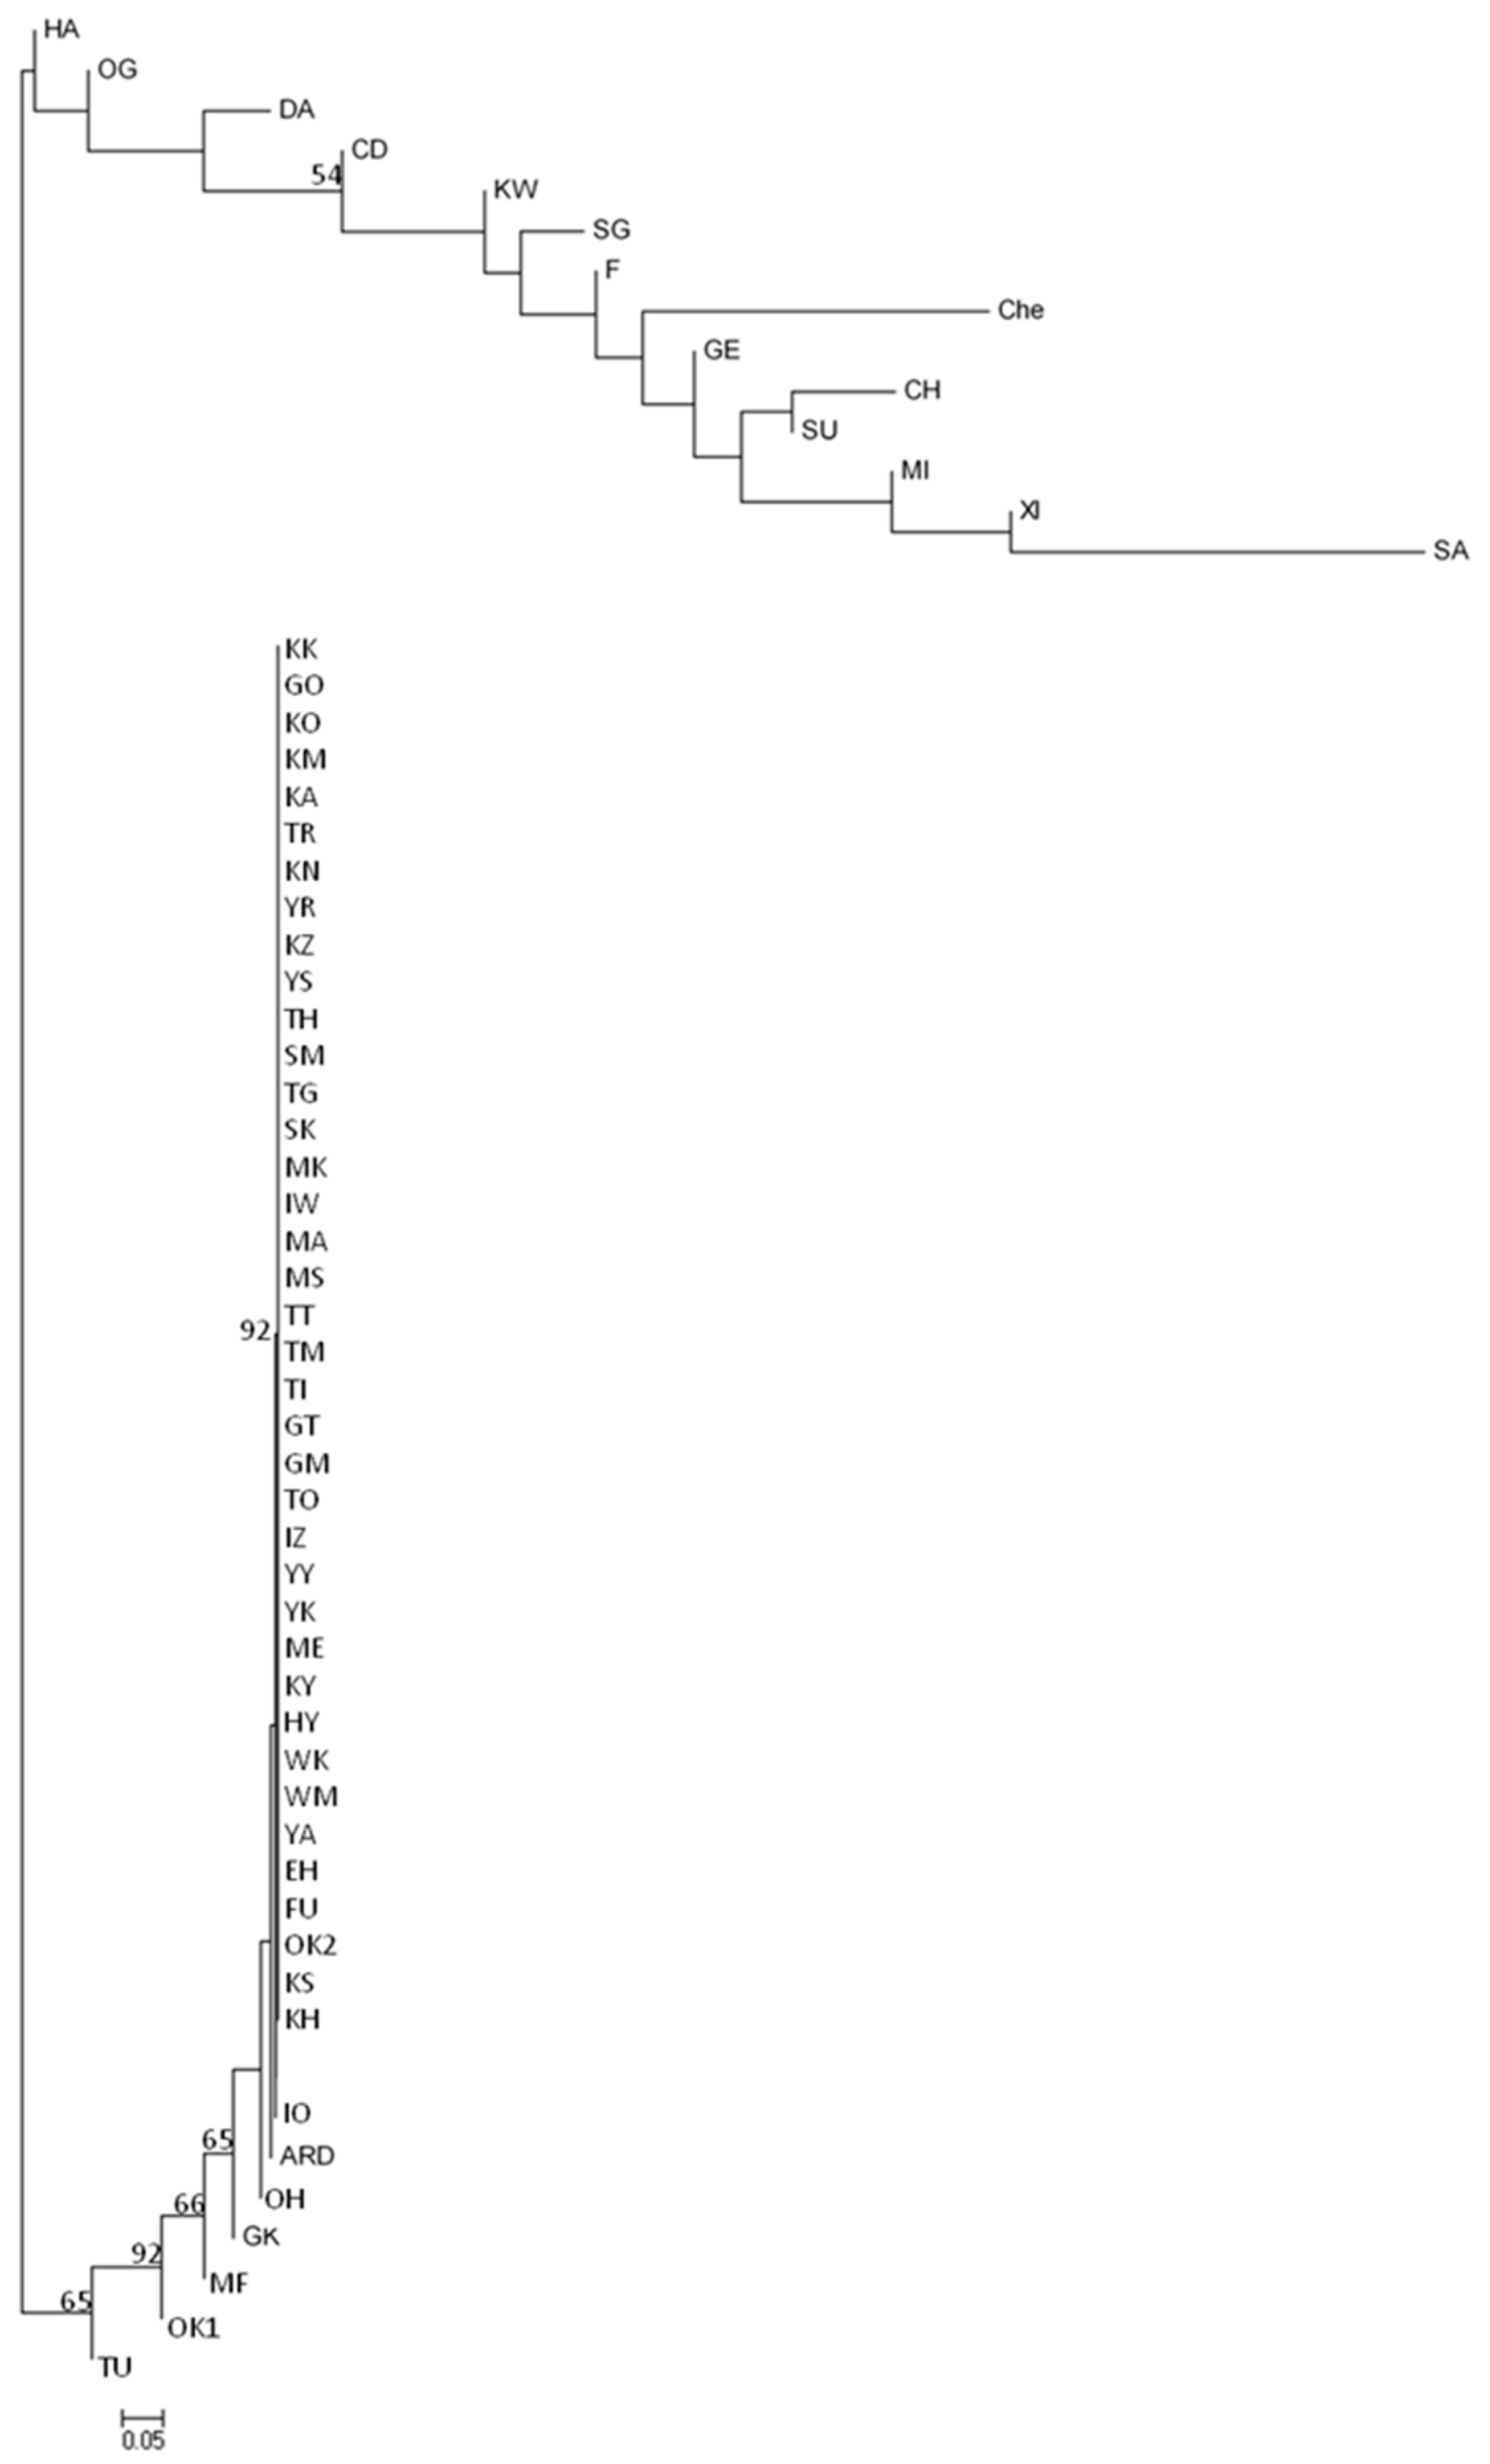
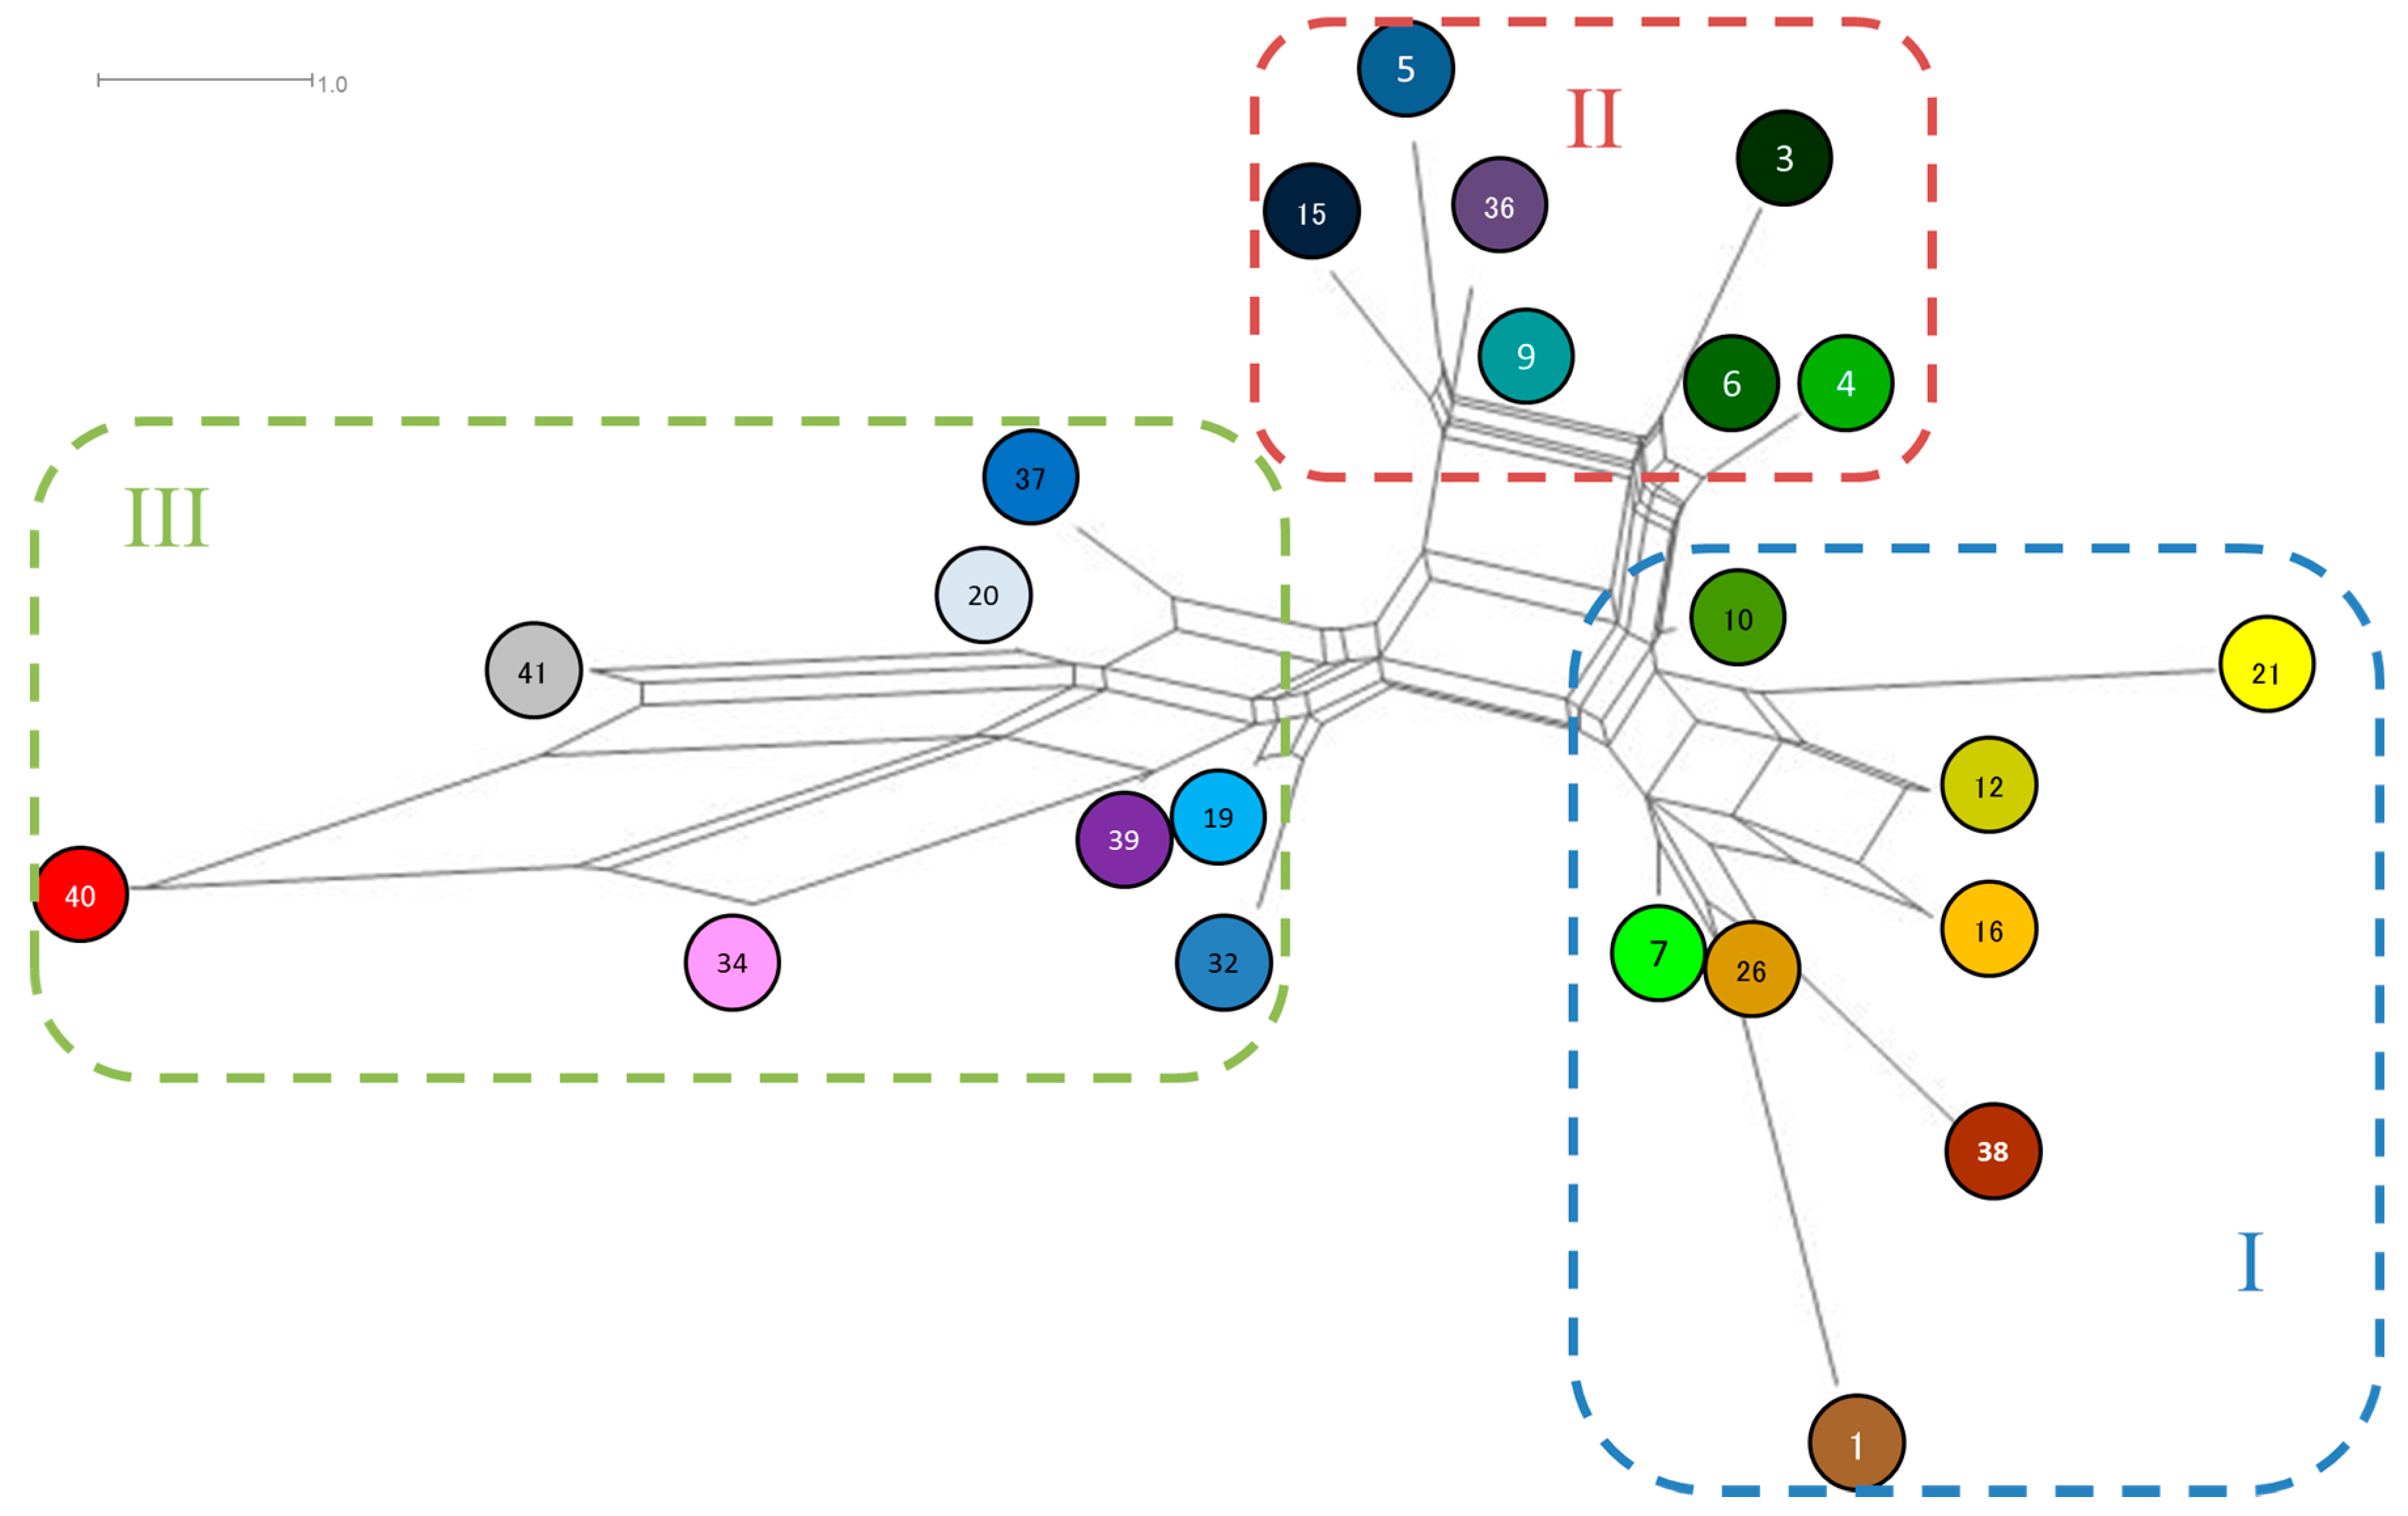
3.4. Genetic Relationship between Populations of Q. acutissima

A Neighbor-Joining tree for 59 populations was constructed based on the genetic distance (δμ)2 [44] (Appendix A). Two clades were recognized: one representing Japanese natural and artificial populations and the other continental populations. This suggests that Japanese populations and continental populations are genetically differentiated. Only OG, a Japanese natural population, belonged to the continental clade. No phylogeographic structure was apparent in the Japanese clade. However, the other clade had two subclades, one consisting of populations from northern Korea and China and the other of South Korean populations (Figure 4). Thus genetic structure was shown on the edge of the Eurasian continent.

4. Discussion

In total, 59 Q. acutissima populations from Japan and Eurasia (South Korea and Northeast China), were analyzed using cpSSR markers and 23 haplotypes were detected in total and the markers used were highly polymorphic.

4.1. Genetic Characteristics of Q. acutissima Natural Populations in Northeast Asia

Genetic diversity was much lower in the Japanese populations than in the continental ones. Most populations were fixed for haplotype 20 alone, and genetic diversity with respect to chloroplast DNA was lacking in Japan despite the polymorphic markers. In tree species, the same haplotype or genetically related haplotypes are sometimes located close to each other geographically (e.g., Betula maximowicziana Regel [47], Fraxinus angustifolia Vahl. [48]); this is referred to as phylogeographic structure. Among the oak species present on the Japanese archipelago, Q. crispra, Q. serrata, Quercus dentata Thunb. and Quercus aliena Blume, all of them are autochthonous in Japan, do exhibit clear phylogeographic structure reflecting the presence of a refugium during the last glacial maximum and subsequent migration based on chloroplast DNA variation [31,32]. In this study, there was no phylogeographic structure identified for Q. acutissima in Japan. Thus the haplotype distribution of Q. acutissima is completely different from that found in these four native oak species. Q. variabilis in Japan, related species of Q. acutissima, also fixed for haplotype 20 as same as Q. acutissima [49]. Q. variabilis is inferred that the distribution was influenced by human activity as same as Q. acutissima. It must be chloroplast capture but it could not be determined which species incited the capture. Although it is not known when the introgression happened, it must have happened before they expanded over the Japanese archipelago. The haplotype distribution patterns of C. sativa [2] and Prunus avium L. [8] in Europe, which have both been influenced greatly by human activities, are similar to Q. acutissima in Japan, with one major haplotype covering almost all the distribution range. Alternatively, the absence of phylogeographic structure throughout Japan could be attributed to the monomorphism of cpDNA and long distance gene flow with seed among populations [5].
Japanese horse chestnut (Aesculus turbinate Blume), which is also a tree species used by human beings, has several haplotypes on the Japanese archipelago but one of these has a wide distribution extending circa 900 km [50]. The authors of that study discuss the discrepancy between a distribution range predicted based on migration capability and the actual distribution range, which is known as Reid’s Paradox [51], and note that rare long-distance seed-dispersal events could account for more rapid colonization [50]. Similarly, in the case of Q. acutissima, haplotype 20 is present in all populations extending across a range of almost 1400 km. Acorns of Q. acutissima are transported by rodents and the maximum reported distance is 38.5 m [19]. The youngest reproductive age of the species is four years [52]. Based on these figures, if refugia of Q. acutissima during the last glacial maximum (LGM) existed around the southern part of Japan (e.g., Paleo-Yaku Peninsula) as suggested by the paleoecologial study [23], more than 300,000 years would be needed to cover the entire current distribution range. However, a recent study clearly suggested that Q. acutissima did not distribute in the main archipelago of Japan during the LGM [24]. Thus, it is difficult to explain the modern distribution of Q. acutissima only by natural population colonization although natural rare long-distance seed-dispersal events could account for rapid colonization. Indeed, haplotype 7, common on the continent, was also found in six Japanese populations. Although this may suggest the long distance dispersal, it would be more likely that this continental haplotype was introduced to Japan via past human activities, as discussed below.

4.2. Genetic Structure and Population Differentiation

Since most of the Q. acutisima populations in Japan were fixed for one haplotype, this tree species experienced a severe bottleneck when Q. acutissima expanded its distribution to the Japanese archipelago either naturally or artificially. On the other hand, some populations, mainly on Kyushu Island, have multiple haplotypes and these populations must have experienced several introductions of seeds from the continent. However, these seeds did not spread to other regions of Japan, as happened with haplotype 20. It is possible that these haplotypes arrived after haplotype 20 and after it had spread across the Japanese archipelago. There are plantations which were made by Korean seed sources in 1970s in Kyushu Island for the high demand of logs of Q. acutissima for Shiitake cultivation [53]. The haplotypes, except for haplotype 20, might have come over to Japan quite recently. Furthermore, there may not have been enough time for mutations to accumulate after haplotype 20 was spread over the archipelago.
The level of population differentiation was very low for Q. acutissima, particularly in Japan. Aguinagalde et al. [54] reviewed genetic structure associated with maternally inherited markers in European trees and shrubs, and the average for three species that are cached by animals (Corylus avellana L., Fagus sylvatica L., Quercus robur L.) was GST = 0.83 ± 0.05 SD (standard deviation) and for 15 wind dispersed species was GST = 0.56 ± 0.07 SD. In contrast, Duminil et al. [55] found that species with gravity-dispersed seeds had significantly higher GST values based on maternal DNA, although no significant relationships were identified between GST and the other modes of seed dispersal. The genetic differentiation revealed by maternal DNA markers for native tree species in Japan is summarized in Table 4, and there does not appear to be any link between seed dispersal mode and GST value, as Duminil et al. [55] described. Most species have values higher than 0.9 for GST and 0.97 for GST and are highly differentiated because of restricted gene flow by seed. The values for Japanese natural populations of Q. acutissima (GST = 0.251, GST = 0.261) are much lower than those for other Japanese species. Even Q. gilva, which was heavily influenced by human activity in Japan, because of its edible acorns and valuable timber, showed much higher differentiation (GST = 0.754) [56] than this study. In general, seed or seedling transfer by humans reduces genetic differentiation and degrades genetic structure in the same way as high gene flow. C. sativa (GST = 0.43) [2] and P. avium (GST = 0.29) [5] also exhibit low genetic differentiation (Table 4). Both of these species are used by humans and their distributions have been influenced accordingly. The value of GST for Q. robur is much lower in roadside plantations than natural populations [4]. As described above, Q. variabilis, heavely influenced by human activity as same as Q. acutissima, has no cpDNA variation in Japan [49]. These support the suggestion that some non-natural factor influenced the current genetic structure of Q. acutissima, possibly human transport of seeds and plants over a long period. Moreover, a recent study by Zhang et al. [24] reconstructed the past distribution of Q. acutissima and they revealed that there was little distribution of the species during the LGM in the current land area of Japan. Thus, it is reasonable to consider that Q. acutissima started to distribute after the LGM in Japan. This also supports that this species was possibly transported through human impact.
Although the continental populations of Q. acutissima exhibited relatively low differentiation in GST (0.421), the standardized G’ST value was high (0.856). Thus, the much lower value of GST on the continent was due to high polymorphism of the examined cpSSRs, as Hedrick [41] pointed out. Moreover, GST-NST tests suggested the existence of phylogeographic structure on the continent and indeed the NJ tree supports this finding, showing two groups. Thus, although human impact might affect the genetic structure of Q. acutissima on the continent, it is likely to have been much less than the influence on Japan populations.

5. Conclusions

Based on our results, it is probable that the genetic structure of Q. acutissima is heavily influenced by human activities in Japan and it is difficult to reconstruct the past introduction routes to Japan from the continent because of complicated multiple introductions including secondary transportation within Japan. The genetic characteristics of natural and non-natural populations in Japan are almost the same and it is likely that the natural populations originated from individuals that escaped from plantations. Thus, at least considering cpDNA variation, modern seed transfer may not affect the current genetic structure of this species, except for some populations on Kyusyu Island. A future study not only based on bi-parental nuclear DNA genetic variation but also on human geographic study of usage of this tree species, would provide more information on past demographic history of this species in Japan in order to propose a management program for these genetic resources.

Acknowledgments

This research was supported by a grant for Research on Genetic Guidelines for Restoration Programs using Genetic Diversity Information (FY2005–2009) from the Ministry of Environment, Japan. We thank Leanne Kay Faulks for English editing.

Author Contributions

Y. Saito conceived and designed the research program, conducted genetic experiments, analyzed the data and wrote the manuscript, Y. Tsuda analyzed the data and wrote the manuscript, K. Uchiyama contributed genetic experiments and data analysis, T. Fukuda contributed samplings and experiments of Japanese natural populations, Y. Seto contributed samplings and experiments of Japanese artificial populations, P. Kim contributed samplings of Korean populations, H. Shen contributed samplings of Chinese populations, Y. Ide conceived and designed the research program.

Conflicts of Interest

The authors declare no conflict of interest.

Appendix A

Figure A1. Neighbour-joining tree for Quercus acutissima Carruth. populations based on (δμ)2 genetic distance. Numbers indicate mean probabilities based on 1000 bootstraps and only those greater than 50 are shown.
Forests 08 00451 g0a1

References

  1. Baldoni, L.; Tosti, N.; Ricciolini, C.; Belaj, A.; Arcioni, S.; Pannelli, G.; Germana, M.; Mulas, M.; Porceddu, A. Genetic structure of wild and cultivated olives in the central Mediterranean Basin. Ann. Bot. 2006, 98, 935–942. [Google Scholar] [CrossRef] [PubMed]
  2. Fineschi, S.; Taurchini, D.; Villani, F.; Vendramin, G.G. Chloroplast DNA polymorphism reveals little geographical structure in Castanea sativa Mill. (Fagaceae) throughout southern European countries. Mol. Ecol. 2000, 9, 1495–1503. [Google Scholar] [CrossRef] [PubMed]
  3. Gunn, B.; Baudouin, L.; Olsen, K. Independent origins of cultivated coconut (Cocos nucifera L.) in the old world tropics. PLoS ONE 2011, 6, e21143. [Google Scholar] [CrossRef] [PubMed] [Green Version]
  4. König, A.O.; Ziegenhaben, B.; Dam, B.C.; Csaikl, U.M.; Coart, E.; Degen, B.; Burg, K.; Vries, S.M.G.; Petit, R.J. Chloroplast DNA variation of oaks in western central Europe and genetic consequences of human influences. For. Ecol. Manag. 2002, 156, 147–166. [Google Scholar] [CrossRef]
  5. Mohanty, A.; Martin, J.P.; Aguinaglade, I. A population genetic analysis of chloroplast DNA in wild populations of Prunus avium L. in Europe. Heredity 2001, 87, 421–427. [Google Scholar] [CrossRef] [PubMed]
  6. Besnard, G.; Khadari, B.; Baradat, P.; Bervill, A. Olea europaea (Oleaceae) phylogeography based on chloroplast DNA polymorphism. Theor. Appl. Genet. 2002, 104, 1353–1361. [Google Scholar] [PubMed]
  7. Magri, D.; Fineschi, S.; Bellarosa, R.; Buonamici, A.; Sebastiani, F.; Schirone, B.; Simeone, M.C.; Vendramin, G.G. The distribution of Quercus suber chloroplast haplotypes matches the palaogeographical history of the western Mediterranean. Mol. Ecol. 2007, 16, 5259–5266. [Google Scholar] [CrossRef] [PubMed]
  8. Dumolin, S.; Demesure, B.; Petit, R.J. Inheritance of chloroplast and mitochondrial genomes in pedunculate oak investigated with an efficient PCR method. Theor. Appl. Genet. 1995, 91, 1253–1256. [Google Scholar] [CrossRef] [PubMed]
  9. Petit, R.J.; Kremer, A.; Wagner, D. Geographic structure of chloroplast DNA polymorphisms in European oaks. Theor. Appl. Genet. Int. J. Plant Breed. Res. 1993, 87, 122–128. [Google Scholar] [CrossRef] [PubMed]
  10. Rajora, O.P.; Dancik, B.P. Chloroplast DNA inheritance in Populus. Theor. Appl. Genet. 1992, 84, 280–285. [Google Scholar] [CrossRef] [PubMed]
  11. Heuertz, M.; Fineschi, S.; Anzidei, M.; Pastorelli, R.; Salvini, D.; Paule, L.; Frascaria-Lacoste, N.; Hardy, O.J.; Vekemans, X.; Vendramin, G.G. Chloroplast DNA variation and postglacial recolonization of common ash (Faxinus excelsio L.) in Europe. Mol. Ecol. 2004, 13, 3437–3452. [Google Scholar] [CrossRef] [PubMed]
  12. Palme, A.E.; Su, Q.; Rautenberg, A.; Manni, F.; Lascoux, M. Postglacial recolonization and cpDNA variation of silver birch, Betula pendula. Mol. Ecol. 2003, 12, 201–212. [Google Scholar] [CrossRef] [PubMed]
  13. Ebert, D.; Peakall, R. Chloroplast simple sequence repeats (cpSSRs): Technical resources and recommendations for expanding cpSSR discovery and applications to a wide array of plant species. Mol. Ecol. Res. 2009, 9, 673–690. [Google Scholar] [CrossRef] [PubMed]
  14. Bagnoli, F.; Tsuda, Y.; Fineschi, S.; Bruschi, P.; Magri, D.; Zhelev, P.; Paule, L.; Simeone, M.; González-Martínez, S.; Vendramin, G. Combining molecular and fossil data to infer demographic history of Quercus cerris: Insights on European eastern glacial refugia. J. Biogeogr. 2016, 43, 679–690. [Google Scholar] [CrossRef]
  15. Provan, J.; Powell, W.; Hollingswoth, P.M. Chloroplast microsatellites: New tools for studies in plant ecology and evolution. Trends Ecol. Evol. 2001, 16, 142–147. [Google Scholar] [CrossRef]
  16. Grivet, D.; Deguilloux, M.F.; Petet, R.J.; Sork, V.L. Contrasting patterns of historical colonization in white oaks (Quercus spp.) in California and Europe. Mol. Ecol. 2006, 15, 4085–4093. [Google Scholar] [CrossRef] [PubMed]
  17. Marsico, T.D.; Hellmann, J.J.; Romero-Severson, J. Patterns of seed dispersal and pollen flow in Quercus garryana (Fagaceae) following post-glacial climatic changes. J. Biogeogr. 2009, 36, 929–941. [Google Scholar] [CrossRef]
  18. Mohammad-Panah, N.; Shabanian, N.; Khadivi, A.; Rahmani, M.S.; Emami, A. Genetic structure of gall oak (Quercus infectoria) characterized by nuclear and chloroplast SSR markers. Tree Genet. Genomes 2017, 13, 70–81. [Google Scholar] [CrossRef]
  19. Iida, S. Quantitative analysis of acorn transportation by rodents using magnetic locator. Vegetatio 1996, 124, 39–43. [Google Scholar] [CrossRef]
  20. Satake, Y.; Hara, H.; Watari, S.; Tominari, T. Wild Flowers of Japan—Woody Plants; Heibonsha Ltd.: Tokyo, Japan, 1989. (In Japanese) [Google Scholar]
  21. Kurata, S. Trip for Plants and Literature; Chikyu-Sha: Tokyo, Japan, 1976. (In Japanese) [Google Scholar]
  22. Fukamachi, K.; Oku, H.; Rackham, O. A comparitive stydy on tees and hedgerows in Japan and England. In Landscape Interfaces; Palang, H., Fry, G., Eds.; Kluwer Academic Publishers: Dordrecht, The Netherlands, 2003; pp. 53–69. [Google Scholar]
  23. Tsukada, M. Map of vegetation during the Last Glacial Maximum in Japan. Quat. Res. 1985, 23, 369–381. [Google Scholar] [CrossRef]
  24. Zhang, X.; Li, Y.; Liu, C.; Xia, T.; Zhang, Q.; Fang, Y. Phylogeography of the temperate tree species Quercus acutissima in China: Inferences from chloroplast DNA variations. Biochem. Syst. Ecol. 2015, 63, 190–197. [Google Scholar] [CrossRef]
  25. Yasuda, Y.; Miyoshi, N. Illustration Vegetation History of Japan; Asakura Pub.: Tokyo, Japan, 1998. (In Japanese) [Google Scholar]
  26. Shimaji, K.; Itoh, T. Comprehensive List of Unearthed Wood Product from the Remains in Japan; Yuzankaku Pub.: Tokyo, Japan, 1988. (In Japanese) [Google Scholar]
  27. Suzuki, M. Japanese and Wood Culture; Yasaka Shobo: Tokyo, Japan, 2002. (In Japanese) [Google Scholar]
  28. Nakamura, K. Historical Study on Shitake Mushroom Culture; Tohsen Pub.: Tokyo, Japan, 1983. (In Japanese) [Google Scholar]
  29. Abrams, M.D.; Copenheaver, C.A.; Terazawa, K.; Umeki, K.; Takiya, M.; Akashi, N. A 370-year dendroecological history of an old-growth Abies-Acer-Quercus forest in Hokkaido, northern Japan. Can. J. For. Res. 1999, 29, 1891–1899. [Google Scholar] [CrossRef]
  30. Sakai, T.; Tanaka, H.; Shibata, M.; Suzuki, W.; Nomiya, H.; Kanazashi, T.; Iida, S.; Nakashizuka, T. Riparian disturbance and community structure of a Quercus-Ulmus forest in central Japan. Plant Ecol. 1999, 140, 99–109. [Google Scholar] [CrossRef]
  31. Kanno, M.; Yokoyama, J.; Suyama, Y.; Ohyama, M.; Itoh, T.; Suzuki, M. Geographical distribution of two haplotypes of chloroplast DNA in four oak species (Quercus) in Japan. J. Plant Res. 2004, 117, 311–317. [Google Scholar] [CrossRef] [PubMed]
  32. Okaura, T.; Quang, N.D.; Ubukata, M.; Harada, K. Phylogeographic structure and late Quaternary population history of the Japanese oak Quercus mongolica var. crispula and related species revealed by chloroplast DNA variation. Genes Genet. Syst. 2007, 82, 465–477. [Google Scholar] [PubMed]
  33. Ohsawa, T.; Tsuda, Y.; Saito, Y.; Ide, Y. The genetic structure of Quercus crispula in northeastern Japan as revealed by nuclear simple sequence repeat loci. J. Plant Res. 2011, 124, 645–654. [Google Scholar] [CrossRef] [PubMed]
  34. Lian, C.L.; Oishi, R.; Miyashita, N.; Nara, K.; Nakaya, H.; Wu, B.Y.; Zhou, Z.H.; Hogetsu, T. Genetic structure and reproduction dynamics of Salix reinii during primary succession on Mount Fuji, as revealed by nuclear and chloroplast microsatellite analysis. Mol. Ecol. 2003, 12, 609–618. [Google Scholar] [CrossRef] [PubMed]
  35. Deguilloux, M.F.; Dumolin-Lapegue, S.; Gielly, L.; Grivet, D.; Petit, R.J. A set of primers for the amplification of chloroplast microsatellites in Quercus. Mol. Ecol. Notes 2003, 3, 24–27. [Google Scholar] [CrossRef]
  36. Pons, O.; Petit, R.J. Mesuring and testing genetic differentiation with orderd versus unorderd allels. Genetics 1996, 14, 1237–1245. [Google Scholar]
  37. Estoup, A.; Jarne, P.; Cornuet, J.M. Homoplasy and mutation model at microsatellite loci and their consequences for population genetics analysis. Mol. Ecol. 2002, 11, 1591–1604. [Google Scholar] [CrossRef] [PubMed]
  38. Petit, R.J.; El Mousadik, A.; Pons, O. Identifying populations for conservation on the basis of genetic markers. Conserv. Biol. 1998, 12, 844–855. [Google Scholar] [CrossRef]
  39. Nei, M. Analysis of gene diversity in subdivided populations. Proc. Natl. Acad. Sci. USA 1973, 70, 3321–3323. [Google Scholar] [CrossRef] [PubMed]
  40. Slatkin, M. A measure of population subdivision based on microsatellite allele frequencies. Genetics 1995, 139, 457–462. [Google Scholar] [PubMed]
  41. Hedric, P.W. A standardized genetic differentiation measure. Evolution 2005, 59, 1633–1638. [Google Scholar] [CrossRef]
  42. Bryant, D.; Moulton, V. NeighborNet: An agglomerative method for the construction of planar phylogenetic networks. In Algorithms in Bioinformatics, Proceedings of WABI, Rome, Italy, 17–21 September 2002; Guigó, R., Gusfield, D., Eds.; Springer: Berlin, Germany, 2002; Volume 2452, pp. 375–391. [Google Scholar]
  43. Huson, D.H.; Bryant, D. Application of Phylogenetic Networks in Evolutionary Studies. Mol. Biol. Evol. 2006, 23, 254–267. [Google Scholar] [CrossRef] [PubMed]
  44. Goldstein, D.B.; Linares, A.R.; Feldman, M.W.; Cavallisforza, L.L. Genetic absolute dating based on microsatellites and origin of modern humans. Proc. Natl. Acad. Sci. USA 1995, 92, 6720–6727. [Google Scholar] [CrossRef]
  45. Langella, O. Population 1.2.30. Logiciel de Génétique des Populations. Laboratoire Populations, Génétique et Évolution, CNRS UPR 9034, Gif-sur-Yvette. Available online: http://www.cnrs-gif.fr/pge/ (accessed on 2 October 2009).
  46. Parks, D.H.; Mankowski, T.; Zangooei, S.; Porter, M.S.; Armanini, D.G.; Baird, D.J.; Langille, M.G.I.; Beiko, R.G. GenGIS 2: Geospatial Analysis of Traditional and Genetic Biodiversity, with New Gradient Algorithms and an Extensible Plugin Framework. PLoS ONE 2013, 8, e69885. [Google Scholar] [CrossRef] [PubMed]
  47. Tsuda, Y.; Ide, Y. Chloroplast DNA phylogeography of Betula maximowicziana, a long-lived pioneer tree species and noble hardwood in Japan. J. Plant Res. 2010, 123, 343–353. [Google Scholar] [CrossRef] [PubMed]
  48. Heuertz, M.; Carnevale, S.; Fineschi, S.; Sebastiani, F.; Hausman, J.F.; Paule, L.; Vendramin, G.G. Chloroplast DNA phylogeography of European ashes, Fraxinus sp. (Oleaceae): Roles of hybridization and life history traits. Mol. Ecol. 2006, 15, 2131–2140. [Google Scholar] [CrossRef] [PubMed]
  49. Saito, Y.; Tsuda, Y.; Uchiyama, K.; Fukuda, T.; Ide, Y. Genetic structure of Quercus variabilis in Japan. For. Genet. Tree Breed. 2017. in print. (In Japanese with English Summary). [Google Scholar]
  50. Sugahara, K.; Kaneko, Y.; Ito, S.; Yamanaka, K.; Sakio, H.; Hoshizaki, K.; Suzuki, W.; Yamanaka, N.; Setoguchi, H. Phylogeography of Japanese horse chestnut (Aesculus turbinata) in the Japanese Archipelago based on chloroplast DNA haplotypes. J. Plant Res. 2011, 124, 75–83. [Google Scholar] [CrossRef] [PubMed]
  51. Clark, J.S.; Fastie, C.; Hurtt, G.; Jackson, S.T.; Johnson, C.; King, G.A.; Lewis, M.; Lynch, J.; Pacala, S.; Prentice, C.; et al. Reid’s Paradox of Rapid Plant Migration: Dispersal theory and interpretation of paleoecological records. BioScience 1998, 48, 13–24. [Google Scholar] [CrossRef]
  52. Hashizume, H. Flowering habit in young trees of Quercus acutissima Carr. and Quercus serrata Thunb. Hardwood Res. 1983, 2, 49–54, (In Japanese with English Summary). [Google Scholar]
  53. Toda, T.; Fujimoto, Y.; Nishimura, K.; Maeda, T. Reserch of 18 year old plantation Quercus acutissima established by imported seed. Annu. Rep. Kyushu Reg. Breed. 1986, 13, 100–106. (In Japanese) [Google Scholar]
  54. Aguinagalde, I.; Hampe, A.; Mohanty, A.; Martin, J.P.; Duminil, J.; Petit, R.J. Effects of life-history traits and species distribution on genetic structure at maternally inherited markers in European trees and shrubs. J. Biogeogr. 2005, 32, 329–339. [Google Scholar] [CrossRef] [Green Version]
  55. Duminil, J.; Fineschi, S.; Hampe, A.; Jordano, P.; Salvini, D.; Vendramin, G.G.; Petit, R.J. Can population genetic sturcture be predicted from life-history traits? Am. Nat. 2007, 169, 662–672. [Google Scholar] [PubMed]
  56. Sugiura, N.; Tang, D.; Kurokochi, H.; Saito, Y.; Ide, Y. Genetic structure of Quercus gilva Blume in Japan as revealed by chloroplast DNA sequences. Botany 2015, 93, 873–880. [Google Scholar] [CrossRef]
  57. Tomaru, N.; Takahashi, M.; Tsumura, Y.; Takahashi, M.; Ohba, K. Intraspecific variation and phylogeographic patterns of Fagus crenata (Fagaceae). Am. J. Bot. 1998, 85, 629–636. [Google Scholar] [CrossRef] [PubMed]
  58. Okaura, T.; Harada, K. Phylogeographical structure revealed by chloroplast DNA variation in Japanese beech (Fagus crenata Blume). Heredity 2002, 88, 322–329. [Google Scholar] [CrossRef] [PubMed]
  59. Aizawa, M.; Yoshimaru, H.; Saito, H.; Katsuki, T.; Kawahara, T.; Kitamura, K.; Shi, F.; Kaji, M. Phylogeography of a northeast Asian spruce, Picea jezoensis, inferred from genetic variation observed in organelle DNA markers. Mol. Ecol. 2007, 16, 3393–3405. [Google Scholar] [CrossRef] [PubMed]
Figure 1. Chloroplast haplotype distribution of Quercus acutissima Carruth. for (a) 18 natural populations in Japan, (b) 28 artificial populations in Japan and (c) 13 continental populations. The color of haplotype is same as Figure 2.
Forests 08 00451 g001
Figure 2. A Neighbor-net of 23 Chloroplast haplotypes for Quercus acutissima. Haplotypes of Group I were distributed mainly in Korea, haplotypes of Group II were in China and northern Korea and haplotypes of Group III were dominant in Japan.
Forests 08 00451 g002
Figure 3. Three chloroplast haplotype group distribution of Q. acutissima for (a) 18 natural populations in Japan; (b) 28 artificial populations in Japan and (c) 13 continental populations.
Forests 08 00451 g003
Figure 4. Neighbour-joining tree for Quercus acutissima Carruth. continental populations only, based on (δμ)2 genetic distance.
Forests 08 00451 g004
Table 1. Populations and sample size of Quercus acutissima Carruth. forest and detected haplotypes.
RegionForest TypeCodeLatitude (N)Longitude (E)Sample SizeDetected Haplotype
JapanNaturalKK39°16′141°07′5320
GO38°45′141°23′1620
ARD36°07′139°19′416, 20
KO36°02′140°01′3220
KM35°39′138°30′1320
KA35°10′138°90′420
TR34°48′137°49′1420
KN34°14′135°09′1520
YR35°17′135°19′1320
KZ35°54′136°38′1520
YS34°06′134°30′1320
TH34°52′133°33′620
SM34°53′133°25′1220
OG33°35′130°39′197, 9, 20
TG33°20′130°50′820
SK32°46′130°36′1420
MK32°42′130°36′1320
GK32°39′131°25′217,20
ArtificalIW39°46′141°08′3720
MF38°20′140°59′336, 7, 19, 20, 38
MA38°38′140°59′4920
MS38°21′141°00′2220
TT36°31′140°13′4620
TM36°30′140°12′4620
TI36°29′139°59′4820
TU36°29′139°55′487, 20
GT36°17′139°04′4020
GM36°16′138°45′4820
TO35°38′139°18′5020
IZ34°53′139°06′4020
IO35°01′138°59′504, 20
YY35°30′138°28′5020
YK35°28′138°30′5020
ME34°21′136°29′5020
KY34°57′135°32′5020
HY34°55′135°27′4620
WK34°11′135°17′5020
WM34°02′135°13′3120
YA34°16′131°18′5020
EH33°37′132°49′5020
FU33°47′130°53′4220
OH33°19′130°57′483, 7, 16, 19, 20
OK133°11′131°16′503, 5, 7, 10, 15, 20
OK233°08′131°16′5020
KS33°02′130°50′4820
KH33°04′130°53′4720
ContinentNaturalSA37°36′128°01′413
SU37°19′127°01′473, 5, 7, 12, 16, 19, 20
F37°12′126°59′503, 6, 7, 12, 15, 16, 19, 20
CD36°50′127°57′497, 15, 19, 20, 21, 26
CH36°24′127°15′497, 12, 15, 19, 20, 21
SG36°22′128°08′463, 7, 12, 15, 19, 20, 21
GE35°44′127°47′463, 5, 7, 12, 15, 19, 20, 21
HA35°38′127°17′395, 7, 9, 19, 20, 32
KW35°09′126°56′287, 19, 20
Che33°31′126°32′141, 26, 39, 41
XI40°23′123°18′543, 7, 20, 26
MI39°55′116°24′476, 20
DA38°55′121°21′517, 9, 15, 19, 20, 26, 34, 36, 37, 40
Table 2. The 23 chloroplast haplotypes revealed by the six simple sequence repeat (SSR) markers and the fragment length of each marker, and frequency of each haplotype.
HaplotypeMakerHaplotype Frequency *
μcd4 (VIC)μcd5 (FAM)μdt1 (PET)μdt3 (FAM)μdt4 (PET)μkk4 (NED)JapanContinentTotal
NaturalArtificial
2010181901291391150.9570.9650.0370.7217
710181901281361150.0280.0180.3990.1190
191018190129138115-0.0060.1210.0353
31018190126137115-0.0020.1120.0307
610181901271371150.0060.0020.0840.0237
910181901271381150.0090.0010.0610.0177
211028291128137115--0.0520.0135
261018189128136115--0.0270.0070
51008190127138115-0.0010.0200.0056
161028190129136115-0.0010.0180.0051
121028190128136115--0.0180.0046
151028190127138115-0.0020.0120.0042
321028190129138115--0.0140.0037
361018189127138115--0.0120.0033
101018190128137115-0.002-0.0009
391018189129138115--0.0040.0009
41018190127136115-0.001-0.0005
381018189129135115-0.001-0.0005
11018189128136113--0.0020.0005
341018288129138115--0.0020.0005
371018189128139115--0.0020.0005
401018288130139116--0.0020.0005
411018190130139116--0.0020.0005
Total number of allells324553
VIC, FAM, PET, NED, Fluorescent Dye; *, The haplotype frequencies were rounding off four decimal place. The total of frequencies of raw data is 1.000 in each area.; -, no detection.
Table 3. Genetic diversity and genetic differentiation in the three population groups of Quercus acutissima Carruth.: Natural and artificial populations in Japan plus natural continental populations.
RegionForest TypeNo. of PopulationsSample SizeAshsvshtvtGSTGSTRSTNST
JapanNatural183221.1110.0550.0530.0730.0730.2460.2610.2380.238
(0.076)(0.037)(0.037)(0.051)(0.050)
JapanArtificial2812691.1220.0590.0570.0720.0720.1800.1910.2010.179
(0.061)(0.029)(0.028)(0.035)(0.035)
ContinentNatural135612.0880.4880.4820.8430.8440.4210.8560.4290.480 *
(0.159)(0.067)(0.063)(0.054)(0.099)
As, haplotypic richness; hs, unorderd haplotypic diversity; vs, orderd haplotypic diversity; ht, unorderd total haplotypic diversity; vt, orderd total haplotypic diversity; GST, unorderd population differentiation index; GT, standardized value of GST; RST, orderd alleles based population differentiation index; NST, ordered loci based population differentiation index; standard errors in parentheses; * NST is significantly larger than GST (p < 0.05).
Table 4. Genetic differentiation of organelle DNA of five Japanese tree species, which are little used by humans and two European tree species, which are intensively used.
SpeciesDispersal TypeNo. of PopulationsNo. of IndividualsDNAGSTGSTReference
Quercus acutissimaG and A18322C0.2460.261This study
Quercus gilvaG and A25135C0.6680.754[55]
Quercus mongolocaG and A33501C0.8570.979 *[32]
Fagus crenataG and A17409M0.9630.996 *[57]
Fagus crenataG and A21351C0.95-[58]
Betula maximowiczianaW25400C0.9500.977[47]
Picea jezoensisW33264M0.9010.974 *[59]
Prunus aviumG and A23211C0.290.44 *[5]
Castanea sativaG and A38181C0.430.70 *[2]
G, gravity; A, animal; W, wind; C, Chloroplast; M, Mitochondria; *, GST is calculated in this paper.

