Article

Soil Microbial Communities in Natural and Managed Cloud Montane Forests

3
Biodiversity Research Center, Academia Sinica, Nangang, Taipei 11529, Taiwan
2
Environmental Monitoring and Research Division, Monitoring and Research Department, Metropolitan Water Reclamation District of Greater Chicago, 6001 W. Pershing Road, Cicero, IL 60804, USA
1
Mackay Junior College of Medicine, Nursing and Management, Beitou, Taipei 112, Taiwan
*
Author to whom correspondence should be addressed.
Forests 2017, 8(2), 33; https://doi.org/10.3390/f8010033
Submission received: 7 December 2016 / Accepted: 23 January 2017 / Published: 26 January 2017

Abstract

:
Forest management often results in changes in soil microbial communities. To understand how forest management can change microbial communities, we studied soil microbial abundance and community structure in a natural Chamaecyparis (NCP) forest, a disturbed Chamaecyparis (DCP) forest, a secondary (regenerated) Chamaecyparis (SCP) forest and a secondary (reforested) Cryptomeria (SCD) forest. We analyzed soil microbial abundance by measuring phospholipid fatty acids (PLFAs) and microbial community structure by denaturing gradient gel electrophoresis (DGGE) in the studied forest soils. The content of the soil PLFA fungal biomarker decreased from NCP to SCP, DCP and SCD forest soils, associated with the degree of disturbance of forest management. The ratio of soil Gram positive–to-negative bacteria and the stress index (16:1ω7t to 16:1ω7c) increased from NCP to SCP and DCP soils; thus, disturbed forests except for SCD showed increased soil microbial stress. Principal component analysis of soil microbial groups by PLFAs separated the four forest soils into three clusters: NCP, DCP and SCP, and SCD soil. The DGGE analysis showed no difference in the microbial community structure for NCP, DCP and SCP soils, but the community structure differed between SCD and the three other forest soils. In cloud montane forests, disturbance due to forest management had only a slight influence on the soil microbial community, whereas reforestation with different species largely changed the soil microbial community structure.

1. Introduction

Soil microorganisms are essential for maintaining soil fertility and plant growth because they play important roles in nutrient cycling and availability [1]. The soil microbial community is vital for a forest ecosystem to maintain long-term sustainability. Forest management such as tree harvesting and replanting can change the soil microbial community and the soil physico-chemical properties, such as the C and N contents, and biochemical activities [2,3,4,5]. These effects are attributed to changes in litter quality, root exudates, and nutrient uptake with forest management [6,7].
Chamaecyparis cypress, including C. formosensis and C. obtusa, can grow to 60 m and live for more than 1000 years; the giant timber ranks at the top in quality. Chamaecyparis species are valuable in eastern Asia. Before large-scale logging in Taiwan 100 years ago, Chamaecyparis forests were widely distributed in the cloud montane area, about 800 m to 2800 m above sea level. The timber of Chamaecyparis is rich in essential oils, and with its rigid intrinsic structure, the wood can resist decay for decades, leading to a large accumulation of organic matter on the soil surface. Large numbers of fallen trees also remain intact on the floor in a natural Chamaecyparis forest.
Although soil bacteria in the natural Chamaecyparis forest have low diversity because of very high soil acidity and low nutrient fluxes under the perhumid conditions [8], the high soil organic matter (SOM) in this forest supports high soil microbial biomass. Studies have indicated that management of this forest by removing fallen wood or replanting increased soil bacterial diversity [3]. Such changes could be related to the increase in litter decomposition due to disturbance with wood removal or a change in litter quality with the introduced different tree species, possibly leading to an increase in nutrient availability to bacteria. However, little is known about what changes occur in the whole microbial community under such forest management (wood removal and replanting).
Wood harvesting increases the soil exposure, thus increasing the soil temperature fluctuation in addition to the loss of SOM. The reforestation of the natural forest site can lead to the loss of SOM accumulated over the long-term. The soil microbial community might need time to adapt to the litter of new tree species. Therefore, forest management such as tree removal and replanting/reforestation in a cloud montane forest can disturb the forest ecosystem and stress the existing soil microbial community. Thus, we hypothesized that forest management (wood removal and/or replanting) of a natural Chamaecyparis forest would decrease the soil microbial abundance and change the soil microbial community structure.
Molecular methods such as DNA-based methods [9,10] and phospholipid fatty acid (PLFA) analysis [2,7] have been used to determine changes in soil microbial community structure resulting from forest management practices on different coniferous species [11]. Particularly, some ratios of PLFAs such as trans/cis (16:1ω7t/16:1ω7c) and cyclo/monounsaturated precursor (cy17:0/16:1ω7c and cy19:0/18:1ω7c) can be used to indicate stress or starvation of microbial communities [12]. Thus, we aimed to examine soil microbial biomass and microbial community structure in forests of Chamaecyparis with and without disturbance and forests reforested with Chamaecyparis and another species by measuring PLFAs and by denaturing gradient gel electrophoresis (DGGE).

2. Materials and Methods

2.1. Site Description

The study was conducted in the Yuanyang Lake ecosystem (24°35′ N, 121°24′ E) from 1700 m to 2220 m, located in the north-central part of Taiwan. The annual precipitation is about 4000 mm and annual mean temperature approximately 12 °C. The vegetation is dominated by Hinoki cypress (Chamaecyparis obtusa Sieb. & Zucc. var. formosana (Hayata) Rehder) and Taiwan false cypress trees (C. formosensis Matsum.) with understory evergreen broadleaf shrubs predominantly Rhododendron formosanum. The natural Chamaecyparis forest generally has a large number of fallen trees and a thick layer of undecomposed plant residues.
This study included a natural Chamaecyparis (NCP) forest in the lake area and three nearby disturbed forests, located less than 5 km away from the NCP site. The three disturbed forests reflected the increased disturbance along with the forest management for wood harvest and reforestation. Because large numbers of fallen trees remain intact on the floor of the Chamaecyparis forest, collecting fallen trees is considered an alternative way to harvest these valuable trees and minimize disturbance to the forest. For establishing one disturbed forest, dead wood and fallen trees were removed about 15 years ago; we call this disturbed Chamaecyparis (DCP) forest. The second disturbed forest was the secondary (regenerated) Chamaecyparis (SCP) forest after natural Chamaecyparis trees were logged 50 years ago. The third disturbed forest was a secondary Japanese cedar-Cryptomeria japonica (L. f.) D. Don (SCD) forest reforested 30 years ago after a clear-cut of natural Chamaecyparis trees. Japanese cedar was introduced from Japan and widely planted in middle elevation in Taiwan.
Surface soils (0–10 cm) were randomly collected by using a soil corer (3 cm in diameter) from the four forests. Five replicate plots (50 m × 50 m) were selected in each forest. In each plot, three cores were taken. After gentle homogenization and removal of roots and litter, moist soil was sieved through a 2 mm sieve. Soil samples were stored at 4 °C in the dark. Microbial properties, including microbial biomass were analyzed within one month of field collection. Portions of soil samples were freeze-dried at −20 °C immediately after sampling for PLFA analysis and DGGE. Soil samples for chemical analysis were air-dried and milled.

2.2. Biochemical Assays

Soil microbial biomass C and N content (Cmic and Nmic) was determined in fresh moist soil samples by the chloroform fumigation extraction method [13]. Dissolved organic C in the extracted solution was measured by use of a total organic C analyzer (Model 1010 O.I. Analytical, College Station, TX, USA). Soil microbial N (Nmic) was determined by measuring ninhydrin-reactive N as described [14].
Moist soil was oven-dried for 72 h at 105 °C to determine soil moisture content. Soil organic carbon (SOC) and total N contents were determined by use of a Fisons NA1500 elemental analyzer (ThermoQuest Italia, Milan, Italy). Soil pH values were measured in a 1:2.5 soil-to-water suspension.
Extraction and analysis of PLFAs was performed as described [15]. PLFAs were identified and analyzed as described [16]. Fatty acid nomenclature was applied according to Frostegård et al. [15]. The position of the double bond is defined by symbol ω from the methyl end of the molecule. The prefix c refers to cis configuration. Iso and anteiso branching are designated by the prefix i or a, respectively. The prefix cy refers to cyclopropane fatty acids. The fatty acids i15:0, a15:0, 15:0, i16:0, 16:1ω7c, 17:0, i17:0, cy17:0, 18:1ω7c, and cy19:0 represent bacteria; 18:2ω6 represents fungi; 16:1ω5c represents vesicular arbuscular mycorrhizae (VAM) fungi; i15:0, a15:0, i16:0, and i17:0 represent Gram-positive (G+) bacteria; 16:1ω7c, cy17:0, 18:1ω7c, and cy19:0 represent Gram-negative (G−) bacteria; and 10Me18:0 represents actinobacteria [17,18].
Soil DNA was extracted by using the PowerSoil DNA isolation kit (MO BIO lab, Solana Beach, CA, USA). The 16S rDNA and 18S rDNA genes were amplified with bacterial universal primers F968-GC/R1401 [19] and fungal universal primers NS1/GC-Fung, respectively [20]. DGGE involved use of the Dcode Universal Mutation Detection System (Bio-Rad, Hercules, CA, USA) as follows: PCR products were separated on a 6% polyacrylamide gel and 50% to 70% denaturants for bacterial analysis and 7% polyacrylamide and 20% to 45% denaturants for fungal analysis. After running for 16 h at 60 V, the gels were stained with 1:10,000 Gelstar for 30 min and captured by a Gel Doc XR gel imaging system (Bio-Rad).

2.3. Statistical Analysis

Data from biochemical and chemical analysis were converted to an oven-dried basis. Statistical analysis involved ANOVA and Duncan’s multiple range test. Principal component analysis (PCA) was used to test relative concentrations (mole percent of total PLFAs) of individual fatty acids. All statistical analyses involved use of SPSS v18.0 (SPSS Inc., Chicago, IL, USA). p < 0.05 was considered statistically significant. Hierarchical cluster analysis of the DGGE banding pattern from the forest sites involved use of the unweighted pair-group method by Ward (Quantity One v4.6, Bio-Rad, Hercules, CA, USA).

3. Results

3.1. Soil Characteristics and Microbial Biomass
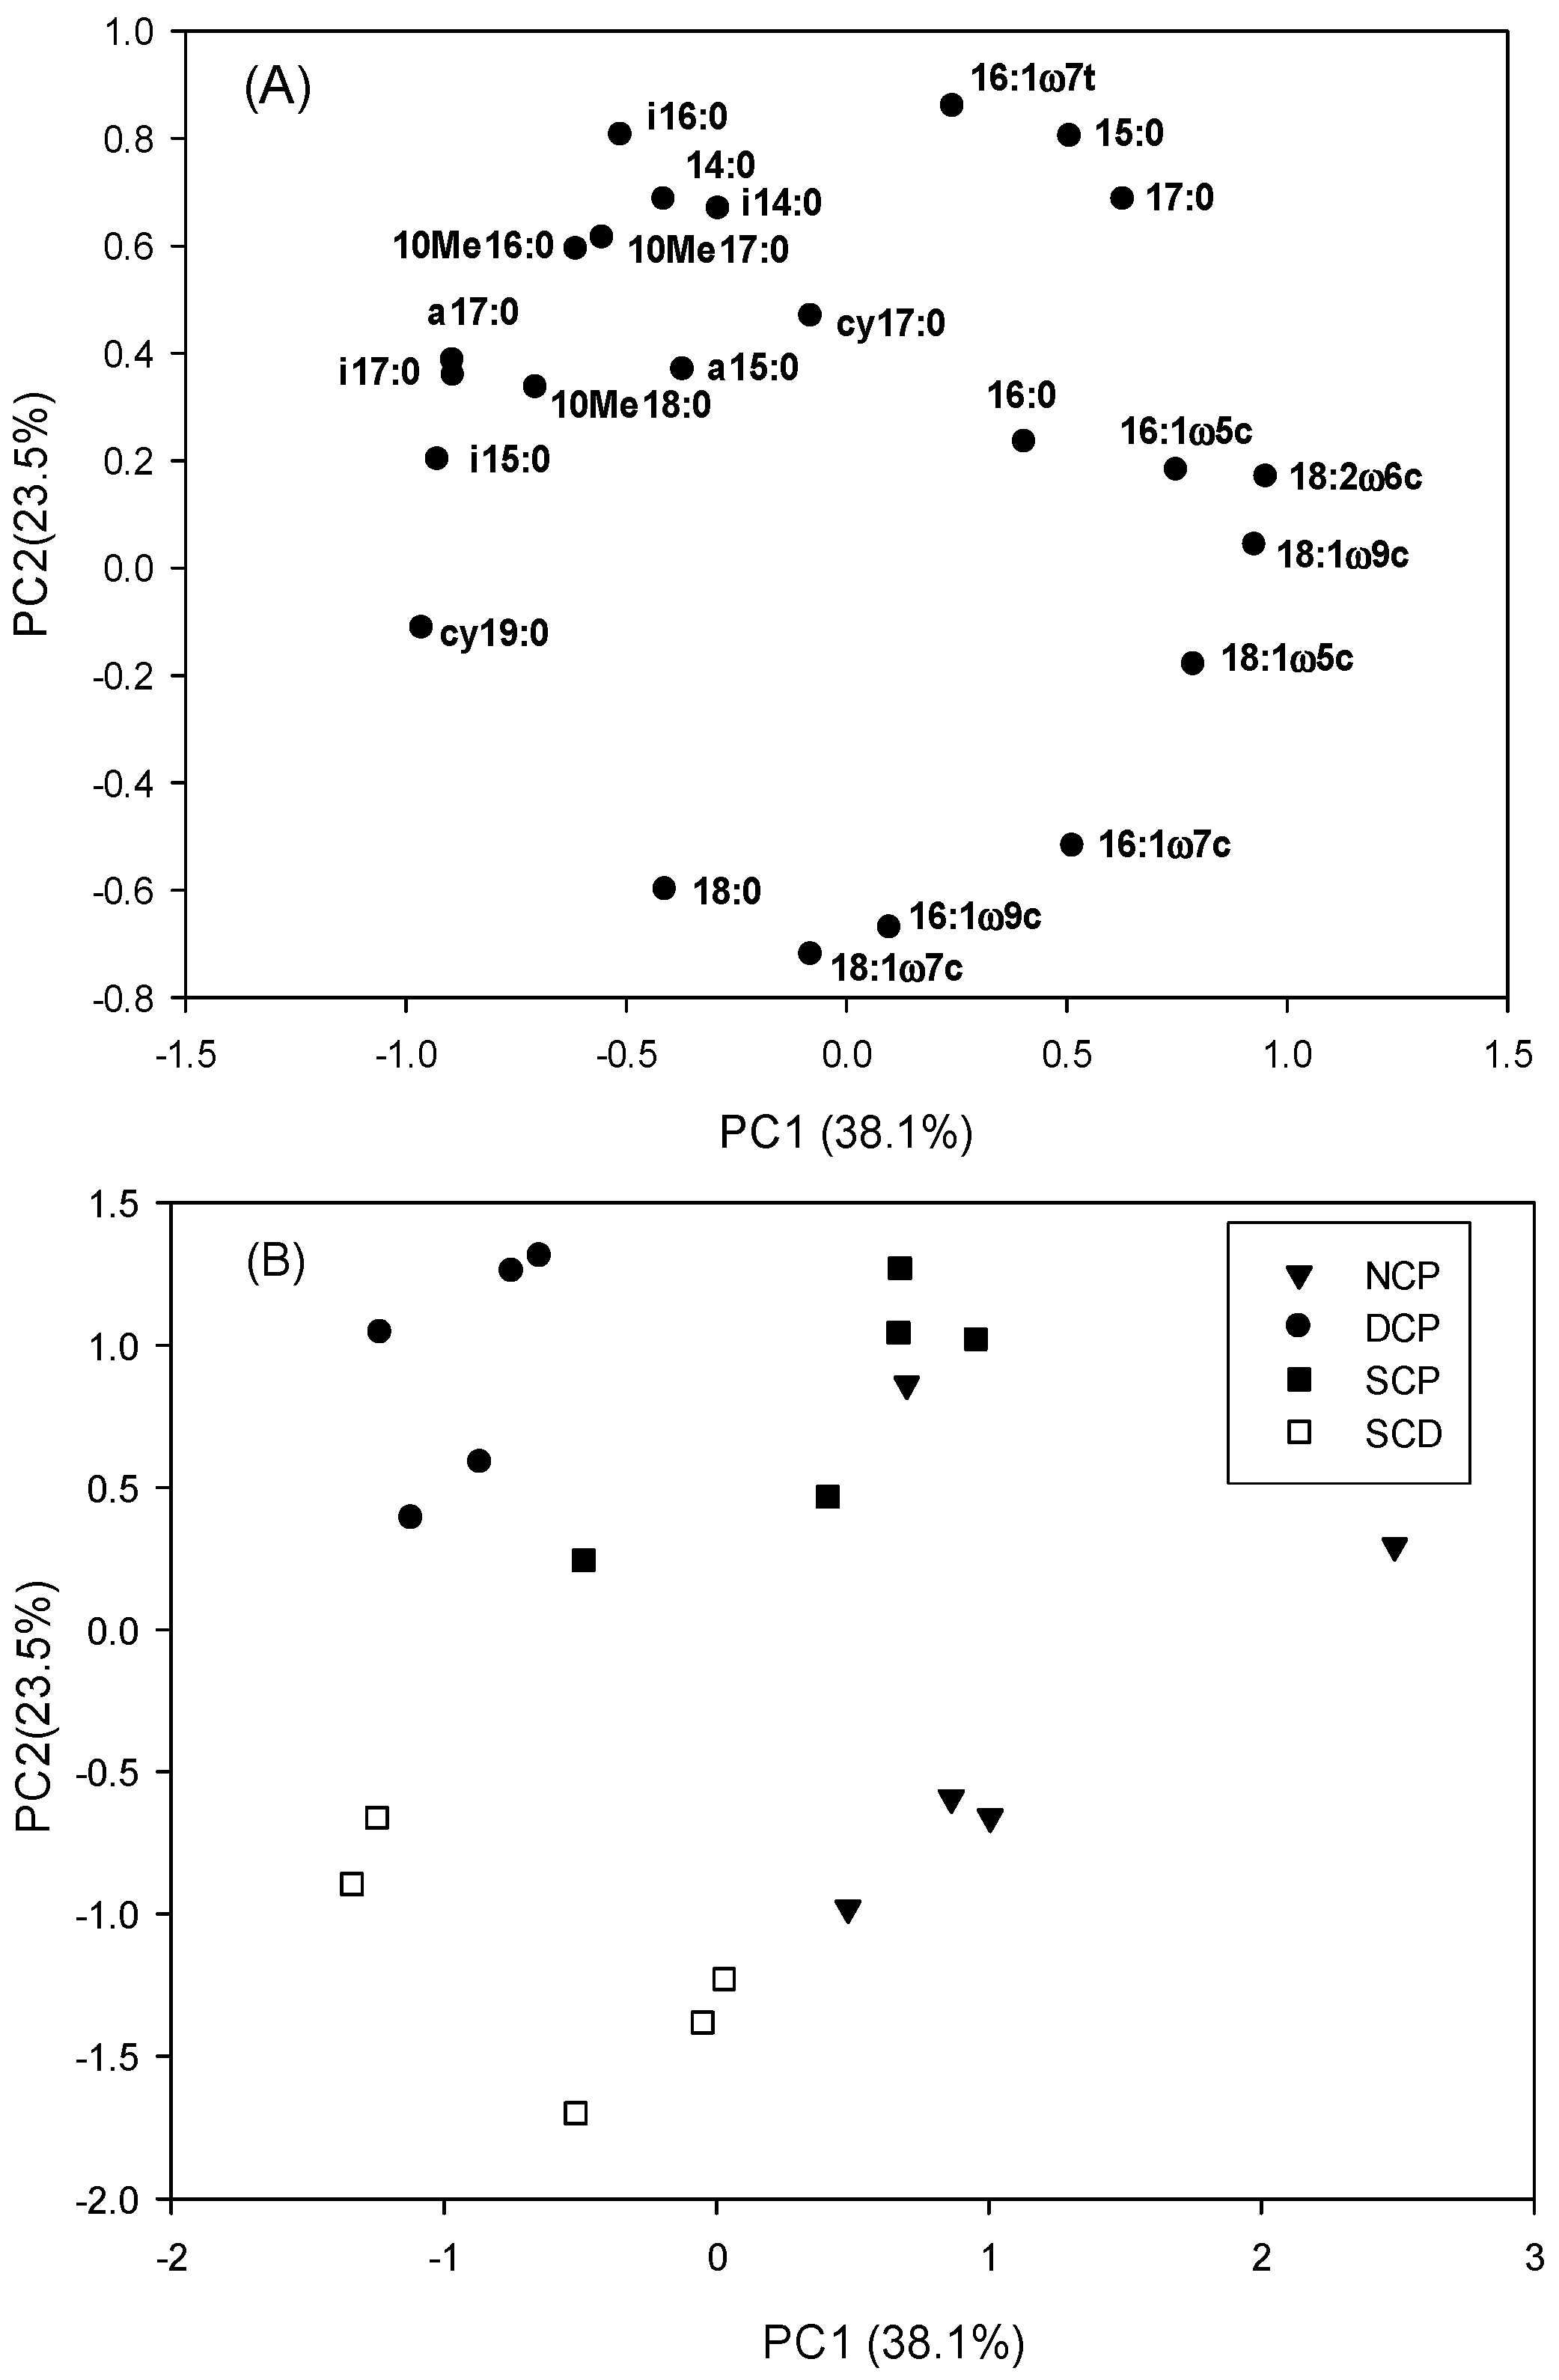
The soil pH ranged from 3.5 to 3.7, with no significant difference among forests (Table 1). The SOC content was lower in the reforested Cryptomeria (SCD) forest than in all Chamaecyparis forests, and it did not differ among the three Chamaecyparis forests (NCP, DCP and SCP). In addition, the soil total N content was lower in SCD than Chamaecyparis soil. The soil C-to-N ratio was lower in SCD and DCP than NCP and SCP forests. The soil microbial biomass C (Cmic) content was highest in the NCP and SCP forests, followed by DCP, then SCD forests. The soil microbial biomass N (Nmic) content was highest in SCP and NCP forests, followed by DCP, then SCD forests.

3.2. PLFA Analyses

Total PLFA, bacteria, fungi, and actinobacteria content differed among different forests (Table 2). The natural forest (NCP) soil had the highest total PLFA, G− bacteria and VAM fungi content. The NCP soil also had the highest fungi content, followed by SCP, then DCP and SCD soil. The ratio of G+/G− soil bacteria was the highest in DCP soil, followed by SCP and SCD, then NCP soil. The ratio of 16:1ω7t (trans-unsaturated fatty acid) to 16:1ω7c (cis-unsaturated fatty acid) was lower in SCD and NCP than DCP and SCP soil.

3.3. Microbial Community Patterns by Forest Management
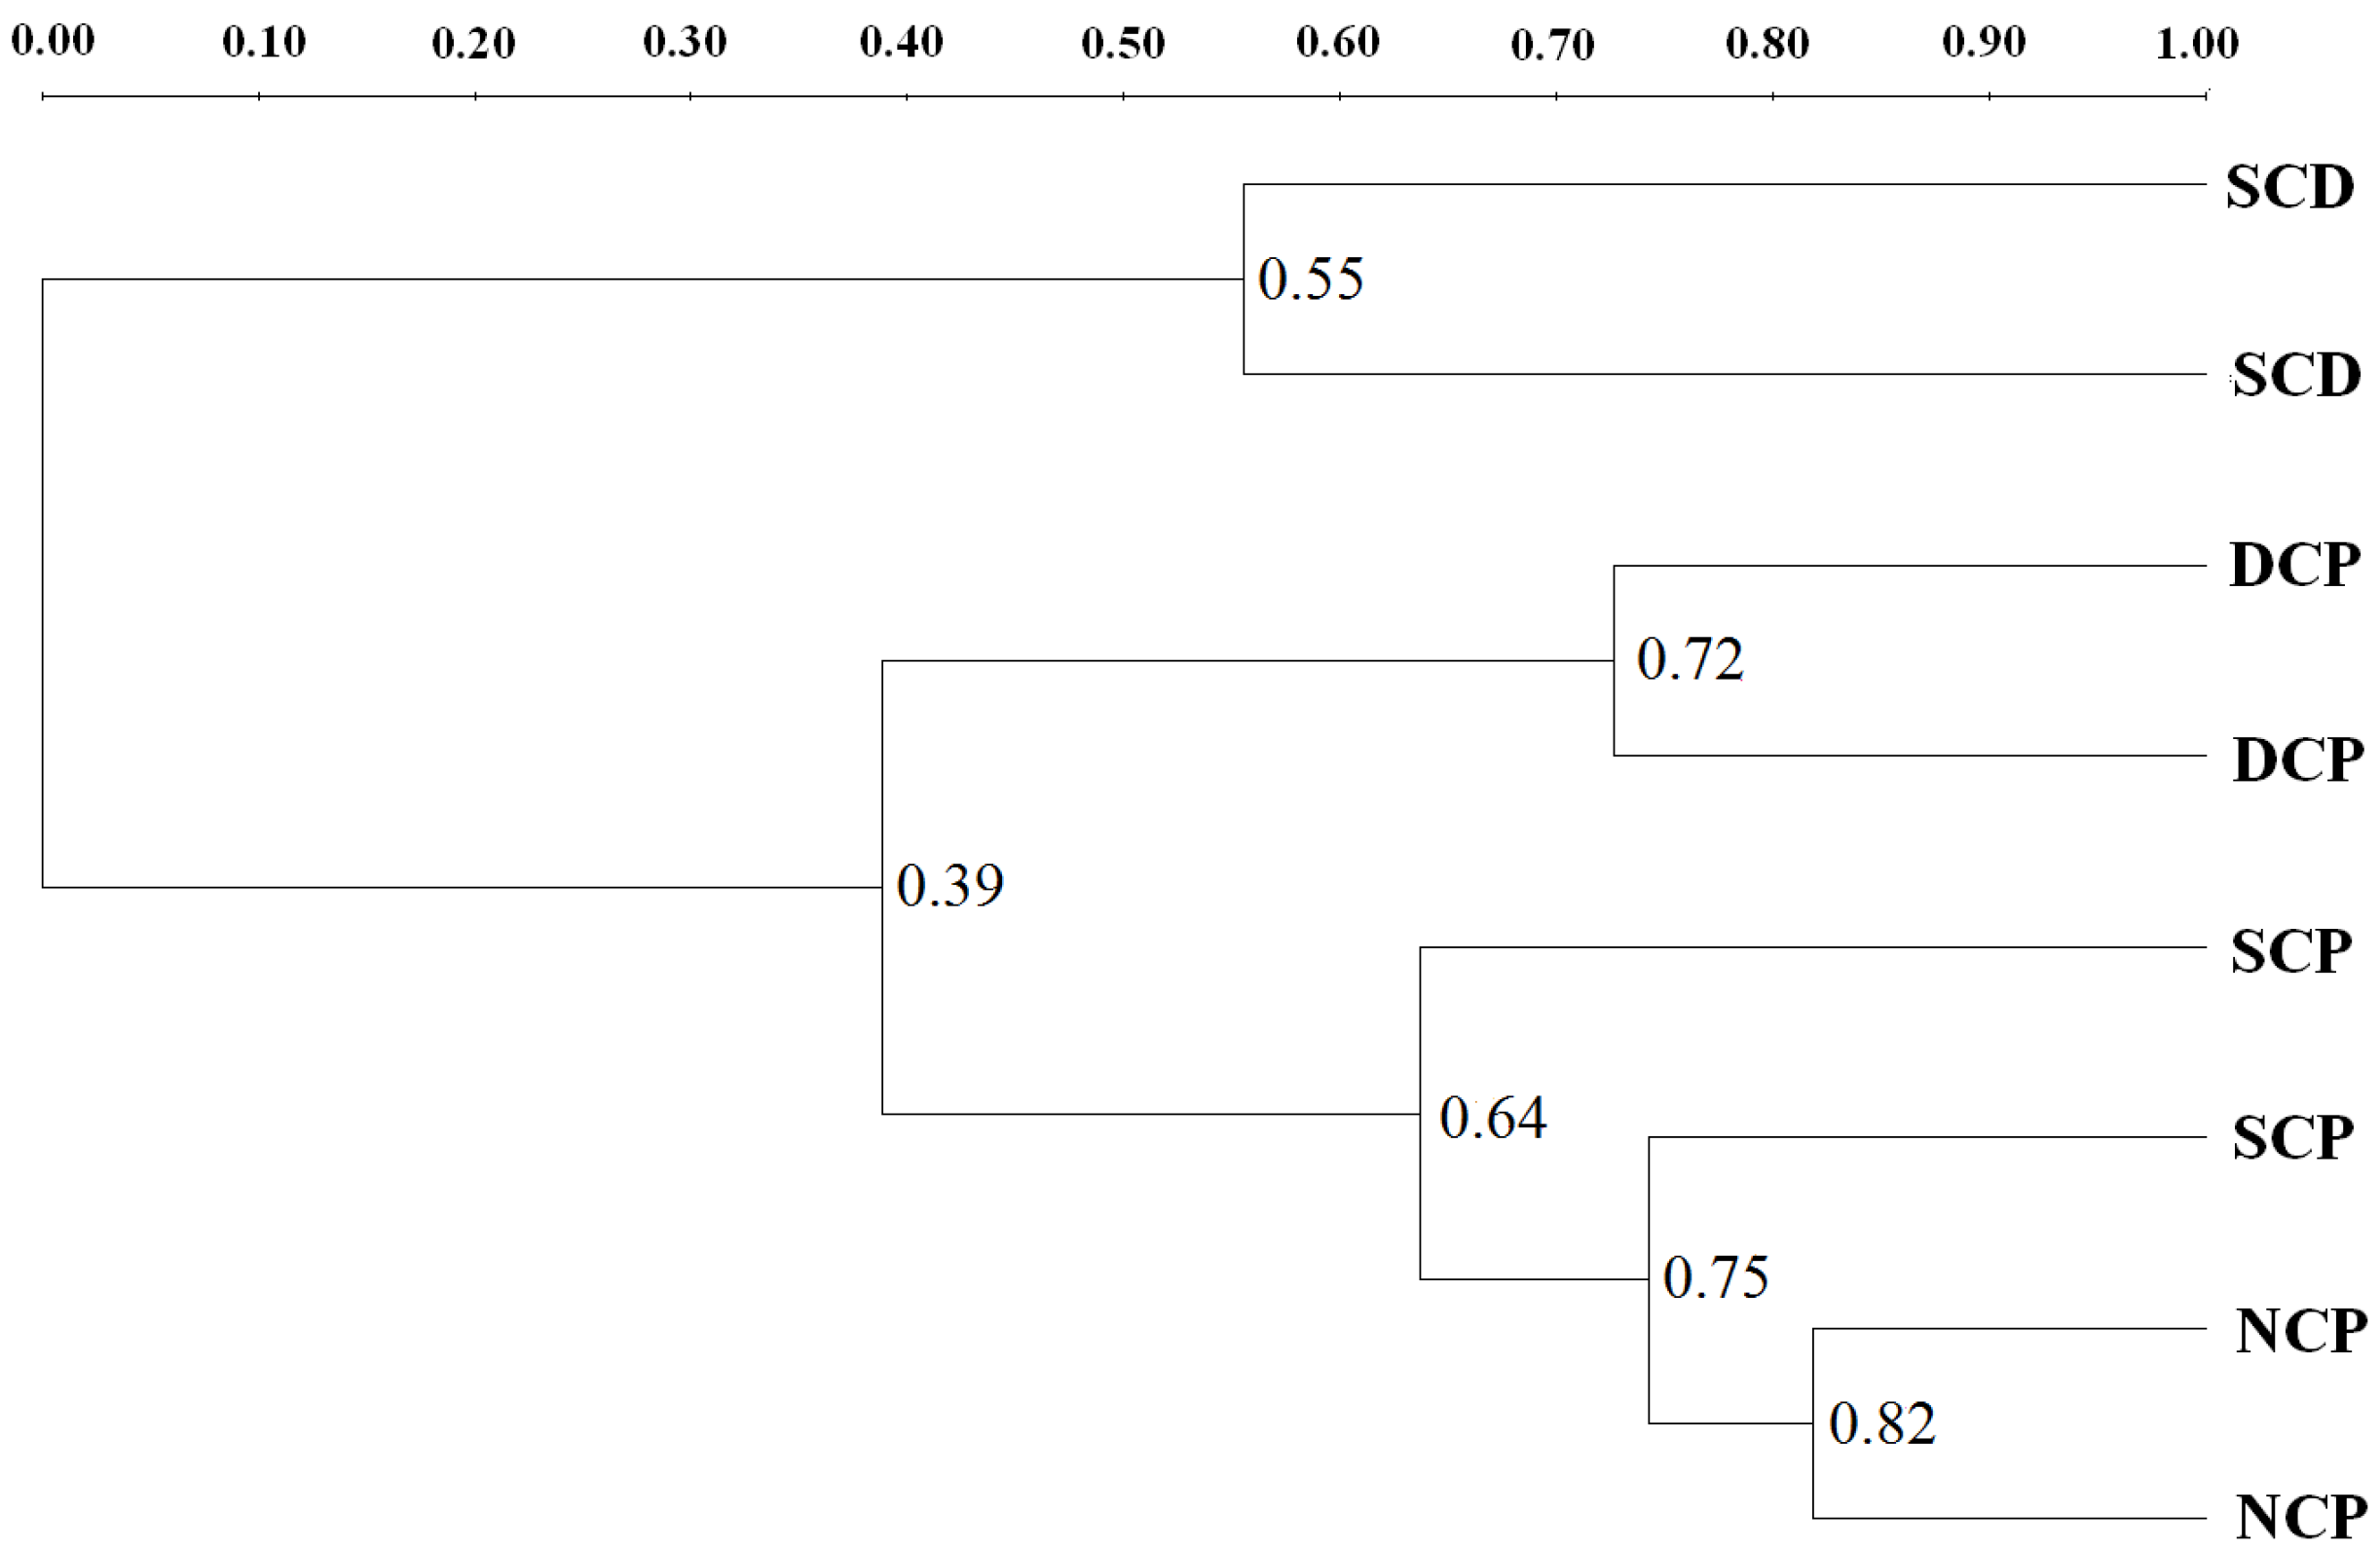
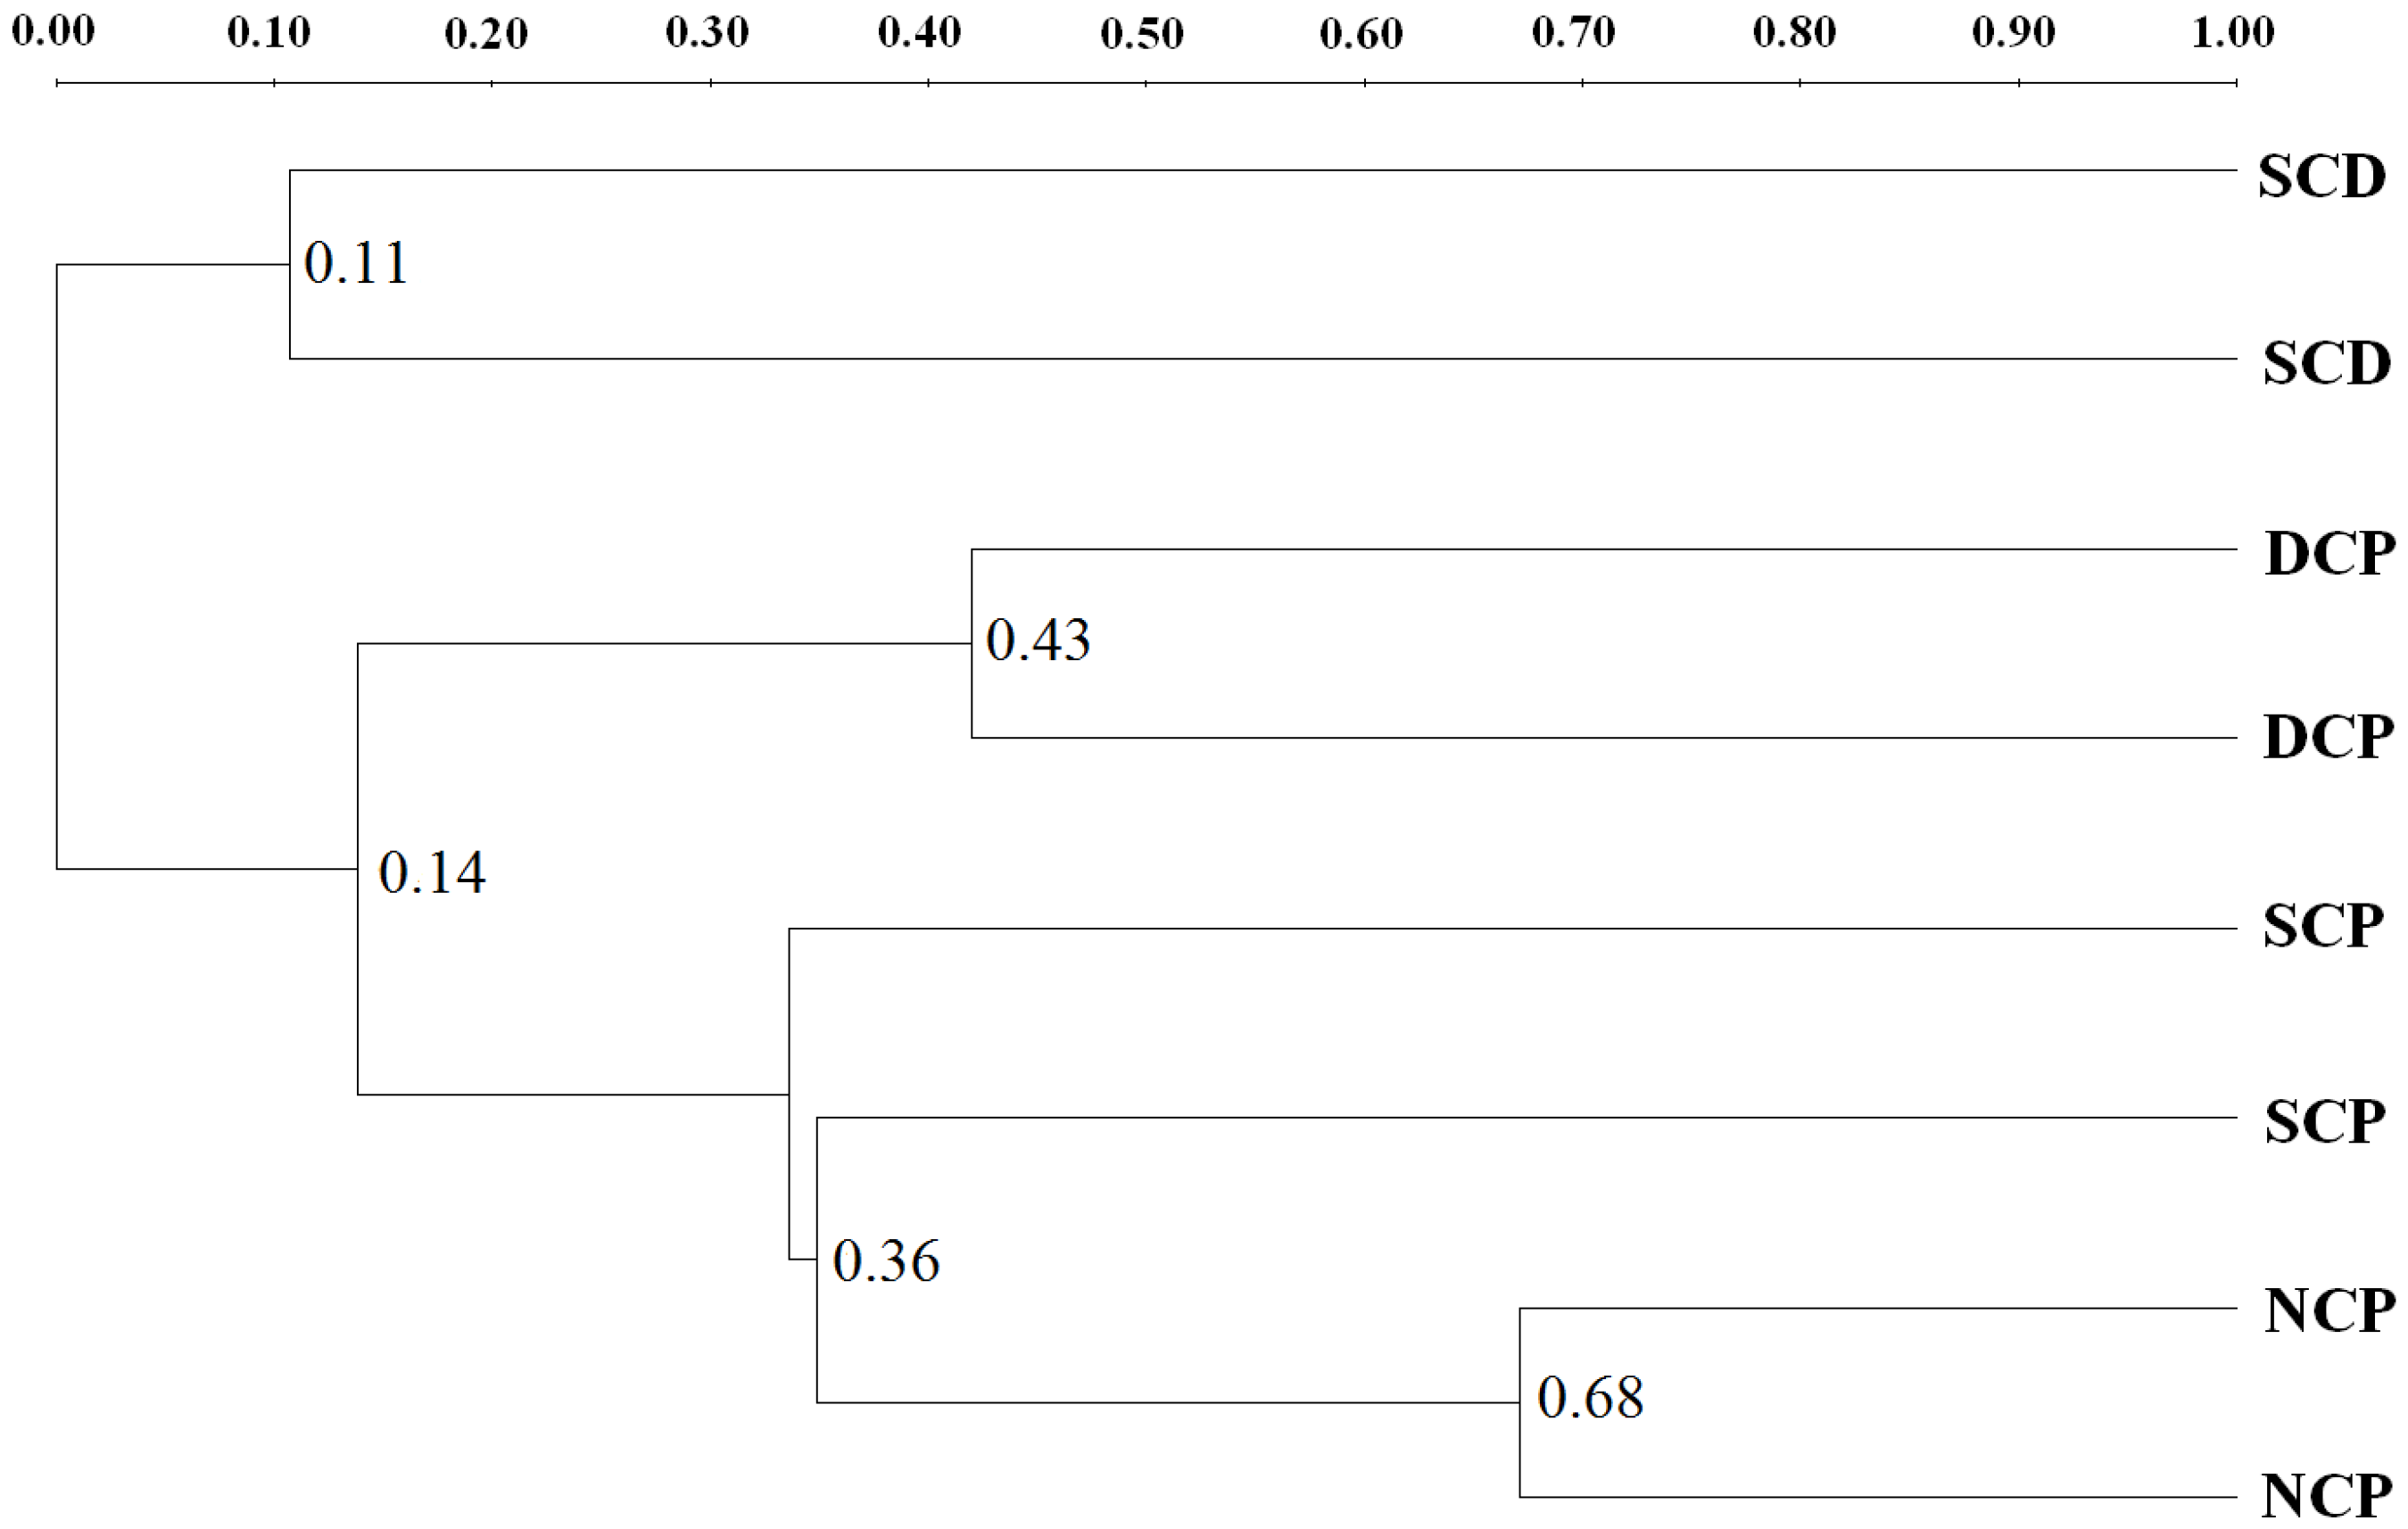
The first principal component (PC1) and second principal component (PC2) together accounted for 61.6% of the variation in PLFAs in the soil (Figure 1). The loadings in PC1 were contributed mainly by G+ bacteria and actinobacteria (i15:0, i17:0; 10Me16:0, 10Me18:0; negative loadings) and fungi (18:2ω6C, 18:1ω9c; positive loadings) (Figure 1). The loading in PC2 was contributed mainly by G− bacteria (16:1ω7c, 18:1ω7c; negative loading). Soil microbial communities, as analyzed by the PCA of PLFA levels, significantly differed among the forest types and could be divided into three large clusters: one for NCP soil, another for DCP and SCP soils, and the third for SCD soil. In this study, PC1, which explained 38.1% of the PLFA variability, separated NCP and SCP (positive loadings) from DCP and SCD soil (negative loadings). PC2, which explained 23.5% of the PLFA variability, separated SCD (negative loadings) from DCP and SCP soil (positive loadings) (Figure 1).

3.4. DGGE Analysis

Dendrograms of soil bacterial similarity obtained by DGGE analysis showed similarities and differences among the different forest types (Figure 2). The entire samples from the four forest sites could be broadly divided into two groups: SCD soil as one group and NCP, DCP and SCP soils as the other group. Cluster analysis by fungal communities showed the same two major groups, SCD soil versus NCP, DCP and SCP soils (Figure 3). In this study, the similarity between NCP and SCP soil for fungal community was 35%.

4. Discussion

PLFA and DGGE analyses revealed that wood removal and reforestation in Chamaecyparis forest ecosystems decreased soil microbial biomass, but only reforestation altered the soil microbial community structure. The natural forest (NCP) had a large number of fallen trees that remained intact on the floor, which reasonably supported the highest soil microbial biomass among the forests studied. The wood removal in the DCP forest might decrease the shading by the overstory and increase the soil temperature, thereby promoting the decomposition of organic matter by microorganisms [21]. The loss of SOM in the DCP forest decreased the soil microbial biomass. The forest clearing caused SOM loss in the regenerated Chamaecyparis forest and the reforested cedar forest. Ichikawa et al. [22] reported decreased SOM when a natural broadleaved forest was converted to a Chamaecyparis obtusa and Cryptomeria japonica forest. The large decrease in SOC by reforestation explained the lowest soil microbial biomass in the SCD forest. The disturbed Chamaecyparis forest and reforested cedar forest showed a loss in the soil fungal and VAM fungal abundance, which could be attributed to the decrease in the thickness of the humus layer [23].
The abundance of soil G− bacteria was reported to increase with high SOM content and high substrate availability [24,25]. Thus, the low ratio of G+/G− bacteria in the NCP forest we observed may be due to the better growth of G− bacteria supported by substrate-rich conditions in natural Chamaecyparis soils. This result agrees with findings by Lin et al. [3] for the same site that β-Proteobacteria was the most abundant group in the undisturbed NCP forest and Acidobacteria the most abundant in other disturbed forests. The Proteobacteria are a major group of G− bacteria that are copiotrophic and use more C sources [26]. In contrast with Proteobacteria, Acidobacteria are considered an oligotrophic group and exist in nutrient-limited environments [26]. Slow-growing specialists, such as G+ bacteria, feature an effective cell metabolism and effectively use recalcitrant substances such as cellulose and lignin in a coniferous environment [27]. Heipieper et al. [28] showed an increased ratio of 16:1ω7t to 16:1ω7c isomer along with stress and starvation conditions for soil bacteria. The higher ratio of 16:1ω7t to 16:1ω7c in disturbed Chamaecyparis forest than in undisturbed NCP forest soils therefore suggests the stress conditions in disturbed Chamaecyparis forest and supports our finding of a high ratio of G+/G− bacteria in disturbed Chamaecyparis forest soils.
The abundance of G− bacteria was higher in the SCD forest than in other disturbed Chamaecyparis forests (SCP and DCP). Sakai et al. [29] indicated that the C accumulation rate was much greater in Japanese cedar than in Hinoki cypress (Chamaecyparis) after afforestation. In this study, the SCD forest soil had the lowest C/N ratio (Table 1). Ollinger et al. [30] indicated that a lower C/N ratio of organic matter favors its mineralization in forests. Thus, the 30-year-old SCD forest may provide more easily degradable C to G− bacteria than other Chamaecyparis forests.
Some studies have shown that changes in vegetation with replanting of forests may lead to shifts in the soil microbial community structure [31,32]. Our PCA analysis of PLFA content clearly distinguished Chamaecyparis from Cryptomeria forest soil in PC1. PCR-DGGE dendrograms of soil bacteria and fungi showed primary differences between microbial communities related to the change in plant species. Priha et al. [33] showed that the quality not the quantity of SOM affected the soil microbial community structure. Therefore, the forest type would be an important factor affecting the microbial community structure in these ecosystems. The soil microbial community structure did not differ between disturbed and natural forests in our study, which does not mean that the disturbance in forest management cannot alter the soil microbial community: such a difference might occur with greater disturbance, which is worthy of further investigation.

5. Conclusions

Forest management practices, including wood harvesting and forest conversion, could affect the soil microbial community in the cloud montane forest. The soil microbial abundance was decreased with the conversion of a natural Chamaecyparis forest to a secondary Chamaecyparis forest, the removal of fallen trees in a Chamaecyparis forest, and reforestation, largely due to SOM loss. The disturbance to the Chamaecyparis forest led to the increased G+/G− bacteria ratio. However, the change in the soil microbial community structure by forest management in this study was only observed in forest reforested with different tree species. Despite the decrease in the soil microbial abundance due to disturbance, the soil microbial structure in the disturbed and secondary Chamaecyparis forest did not differ from the natural Chamaecyparis forest. The conversion of natural Chamaecyparis forests should be managed carefully to avoid a negative impact on the soil microbial community structure and the need for a long-term restoration. The study implies that the choice of plant species for reforestation is critical to the soil microbial community in the cloud montane forest.

Acknowledgments

This work was funded by the Ministry of Science and Technology, Taiwan (MOST 105-2313-B-436-001) and by Academia Sinica.

Author Contributions

E.H.C. and C.Y.C. conceived and designed the experiments; E.H.C. performed the experiments and analyzed the data; E.H.C. wrote the original draft; G.T. and C.Y.C. reviewed and edited the manuscript.

Conflicts of Interest

The authors declare no conflict of interest.

References

  1. Nannipieri, P.; Ascher, J.; Ceccherini, M.T.; Landi, L.; Pietramellara, G.; Renella, G. Microbial diversity and soil functions. Eur. J. Soil Sci. 2003, 54, 655–670. [Google Scholar] [CrossRef]
  2. Ushio, M.; Kitayama, K.; Balser, T.C. Tree species-mediated spatial patchiness of the composition of microbial community and physicochemical properties in the topsoils of a tropical montane forest. Soil Biol. Biochem. 2010, 42, 1588–1595. [Google Scholar] [CrossRef]
  3. Lin, Y.T.; Jangid, K.; Whitman, W.B.; Coleman, D.C.; Chiu, C.Y. Soil bacterial communities in native and regenerated perhumid montane forests. Appl. Soil Ecol. 2011, 47, 111–118. [Google Scholar] [CrossRef]
  4. Lucas-Borja, M.E.; Candel, D.; Jindo, K.; Moreno, J.L.; Andres, M.; Bastida, F. Soil microbial community structure and activity in monospecific and mixed forest stands, under Mediterranean humid conditions. Plant Soil 2012, 354, 359–370. [Google Scholar] [CrossRef]
  5. Chang, E.H.; Chen, T.H.; Tian, G.; Hsu, C.K.; Chiu, C.Y. Effect of 40 and 80 Years of conifer regrowth on soil microbial activities and community structure in subtropical low mountain forests. Forests 2016, 7, 244. [Google Scholar] [CrossRef]
  6. Grayston, S.J.; Prescott, C.E. Microbial communities in forest floors under four tree species in coastal British Columbia. Soil Biol. Biochem. 2005, 37, 1157–1167. [Google Scholar] [CrossRef]
  7. Yin, K.; Zhang, L.; Chen, D.; Tian, Y.; Zhang, F.; Wen, M.; Yuan, C. Understory herb layer exerts strong controls on soil microbial communities in subtropical plantations. Sci. Rep. 2016, 6, 27066. [Google Scholar] [CrossRef] [PubMed]
  8. Lin, Y.T.; Lin, C.P.; Chaw, S.M.; Whitman, W.B.; Coleman, D.C.; Chiu, C.Y. Bacterial community of very wet and acidic subalpine forest and fire-induced grassland soils. Plant Soil 2010, 332, 417–427. [Google Scholar] [CrossRef]
  9. Suzuki, C.; Nagaoka, K.; Shimada, A.; Takenaka, M. Bacterial communities are more dependent on soil type than fertilizer type, but the reverse is true for fungal communities. Soil Sci. Plant Nutr. 2009, 55, 80–90. [Google Scholar] [CrossRef]
  10. Vetrovsky, T.; Baldrian, P. Analysis of soil fungal communities by amplicon pyrosequencing: Current approaches to data analysis and the introduction of the pipeline SEED. Biol. Fert. Soils 2013, 49, 1027–1037. [Google Scholar] [CrossRef]
  11. Demoling, F.; Nilsson, L.O.; Bååth, E. Bacterial and fungal response to nitrogen fertilization in three coniferous forest soils. Soil Biol. Biochem. 2008, 40, 370–379. [Google Scholar] [CrossRef]
  12. Frostegård, Å.; Tunlid, A.; Bååth, E. Use and misuse of PLFA measurements in soils. Soil Biol. Biochem. 2011, 43, 1621–1625. [Google Scholar] [CrossRef]
  13. Vance, E.D.; Brookes, P.C.; Jenkinson, D.S. An extraction method for measuring soil microbial biomass C. Soil Biol. Biochem. 1987, 19, 703–707. [Google Scholar] [CrossRef]
  14. Amato, M.; Ladd, J.N. Assay for microbial biomass based on ninhydrin-reactive nitrogen in extracts of fumigated soils. Soil Biol. Biochem. 1988, 20, 107–114. [Google Scholar] [CrossRef]
  15. Frostegård, A.; Tunlid, A.; Bååth, E. Phospholipid fatty acid composition, biomass, and activity of microbial communities from two soil types exposed to different heavy metals. Appl. Environ. Microbiol. 1993, 59, 3605–3617. [Google Scholar] [PubMed]
  16. Chang, E.H.; Chen, T.H.; Tian, G.; Chiu, C.Y. The effect of altitudinal gradient on soil microbial community activity and structure in moso bamboo plantations. Appl. Soil Ecol. 2016, 98, 213–220. [Google Scholar] [CrossRef]
  17. Zogg, G.P.; Zak, D.R.; Ringleberg, D.B.; MacDonald, N.W.; Pregitzer, K.S.; White, D.C. Compositional and functional shifts in microbial communities due to soil warming. Soil Sci. Soc. Am. J. 1997, 61, 475–481. [Google Scholar] [CrossRef]
  18. Zelles, L. Fatty acid patterns of phospholipids and lipopolysaccharides in the characterisation of microbial communities in soil: A review. Biol. Fert. Soils 1999, 29, 111–129. [Google Scholar] [CrossRef]
  19. Nübel, U.; Engelen, B.; Felske, A.; Snaidr, J.; Wieshuber, A.; Amann, R.I.; Ludwig, W.; Backhaus, H. Sequence heterogeneities of genes encoding 16S rRNAs in Paenibacillus polymyxa detected by temperature gradient gel electrophoresis. J. Bacteriol. 1996, 178, 5636–5643. [Google Scholar] [CrossRef] [PubMed]
  20. White, T.J.; Bruns, T.; Lee, S.; Taylor, J.W. Amplification and Direct Sequencing of Fungal Ribosomal RNA Genes for Phylogenetics. In PCR Protocols: A Guide to Methods and Applications; Innis, M.A., Gelfand, D.H., Sninsky, J.J., White, J.J., Eds.; Academic Press: New York, NY, USA, 1990; pp. 315–322. [Google Scholar]
  21. Williamson, J.R.; Neilsen, W.A. The influence of forest site on rate and extent of soil compaction and profile disturbance of skid trails during ground-based harvesting. Can. J. For. Res. 2000, 30, 1196–1205. [Google Scholar] [CrossRef]
  22. Ichikawa, T.; Yamaguchi, T.; Takahashi, T.; Asano, Y. Effects of the conversion of the forest management type from natural deciduous broad-leaved forests to artificial Japanese cypress (Chamaecyparis obtusa) and Japanese cedar (Cryptomeria japonica) forests on soil microbial flora and mineralization characteristics of organic carbon. Jpn. J. For. Environ. 2003, 45, 81–87. [Google Scholar]
  23. Mahmood, S.; Finlay, R.D.; Erland, S. Effects of repeated harvesting of forest residues on the ectomycorrhizal community in a Swedish spruce forest. New Phytol. 1999, 142, 577–585. [Google Scholar] [CrossRef]
  24. Zelles, L.; Bai, Q.Y.; Beck, T.; Beese, F. Signature fatty acids in phospholipids and lipopolysaccharides as indicators of microbial biomass and community structure in agricultural soils. Soil Biol. Biochem. 1992, 24, 317–332. [Google Scholar] [CrossRef]
  25. Bossio, D.A.; Scow, K.M.; Gunapala, N.; Graham, K.J. Determinants of soil microbial communities: Effects of agricultural management, season, and soil type on phospholipid fatty acid profiles. Microb. Ecol. 1998, 36, 1–12. [Google Scholar] [CrossRef] [PubMed]
  26. Fierer, N.; Mark, A.B.; Robert, B.J. Toward an ecological classification of soil bacteria. Ecology 2007, 88, 1354–1364. [Google Scholar] [CrossRef] [PubMed]
  27. Kourtev, P.S.; Ehrenfeld, J.G.; Haggblom, M. Experimental analysis of the effect of exotic and native plant species on the structure and function of soil microbial communities. Soil Biol. Biochem. 2003, 35, 895–905. [Google Scholar] [CrossRef]
  28. Heipieper, H.J.; Meulenbeld, G.; VanOirschot, Q.; de Bont, J.A.M. Effect of environmental factors on the trans/cis ratio of unsaturated fatty acids in Pseudomonas putida S12. Appl. Environ. Microbiol. 1996, 62, 2773–2777. [Google Scholar] [PubMed]
  29. Sakai, H.; Inagaki, M.; Noguchi, K.; Sakata, T.; Yatskov, M.A.; Tanouchi, H.; Takahashi, M. Changes in soil organic carbon and nitrogen in an area of Andisol following afforestation with Japanese cedar and Hinoki cypress. Soil Sci. Plant Nutr. 2010, 56, 332–343. [Google Scholar] [CrossRef]
  30. Ollinger, S.V.; Smith, M.L.; Martin, M.E.; Hallett, R.A.; Goodale, C.L.; Aber, J.D. Regional variation in foliar chemistry and N cycling among forests of diverse history and composition. Ecology 2002, 83, 339–355. [Google Scholar]
  31. Zornoza, R.; Guerrero, C.; Mataix-Solera, J.; Scow, K.M.; Arcenegui, V.; Mataix-Beneyto, J. Changes in soil microbial community structure following the abandonment of agricultural terraces in mountainous areas of Eastern Spain. Appl. Soil Ecol. 2009, 42, 315–323. [Google Scholar] [CrossRef] [PubMed]
  32. Burns, J.H.; Anacker, B.L.; Strauss, S.Y.; Burke, D.J. Soil microbial community variation correlates most strongly with plant species identity, followed by soil chemistry, spatial location and plant genus. AoB Plants 2015, 7, plv030. [Google Scholar] [CrossRef] [PubMed]
  33. Priha, O.; Grayston, S.J.; Pennanen, T.; Smolander, A. Microbial activities related to C and N cycling and microbial community structure in the rhizospheres of Pinus sylvestris, Picea abies and Betula pendula seedlings in an organic and mineral soil. Fems Microb. Ecol. 1999, 30, 187–199. [Google Scholar] [CrossRef]
Figure 1. Principle component analysis of microbial phospholipid fatty acids (mole percent of total PLFAs) in natural and managed forest soil. (A) Loadings of fatty acid distribution in two PCs; (B) Sample distribution by the first two principal components (PC). (NCP, natural Chamaecyparis forest; DCP, Chamaecyparis forest with wood removal; SCP, secondary (regenerated) Chamaecyparis forest; SCD, secondary (reforested) Cryptomeria forest).
Forests 08 00033 g001
Figure 2. Cluster analysis of forest types by soil bacterial community.
Forests 08 00033 g002
Figure 3. Cluster analysis of forest types by soil fungal community.
Forests 08 00033 g003
Table 1. Soil chemical properties and microbial biomass under natural and managed forest.
Forest Type 1pHOrganic C (%)Total N (%)C/NCmic (mg·kg−1)Nmic (mg·kg−1)
NCP3.5 a 248.6 a1.89 b23.1 a4931 a728 ab
DCP3.7 a44.3 a2.28 a18.9 b3601 b619 b
SCP3.6 a46.9 a1.97 b25.5 a4839 a845 a
SCD3.7 a19.7 b1.16 c16.5 b1542 c264 c
1 NCP: natural Chamaecyparis forest, DCP: disturbed Chamaecyparis forest with wood removal, SCP: secondary (regenerated) Chamaecyparis forest, SCD: secondary (reforested) Cryptomeria forest; 2 Values in each column followed by different letters are significantly different at p < 0.05 by Duncan’s multiple range test.
Table 2. Content of phospholipid acid biomarkers (nmol·g−1 soil) and ratios of biomarkers in natural and managed forest soil.
Forest Type 1Total PLFAsBacteriaFungiVAM FungiActino-BacteriaG+G−G+/G−16:1ω7t/16:1ω7c
NCP550 a 2240 ab110 a21.4 a34.7 b71.2 b57.7a1.24 c0.117 b
DCP511 ab268 a64.5 c15.1 b42.7 a97.3 a46.5 b2.12 a0.225 a
SCP445 c197 b80.5 b15.7 b32.6 b68.1 b39.4 b1.75 b0.280 a
SCD483 bc232 ab51.7 c10.8 c32.7 b71.2 b49.8 ab1.43 bc0.099 b
1 NCP: natural Chamaecyparis forest, DCP: disturbed Chamaecyparis forest with wood removal, SCP: secondary (regenerated) Chamaecyparis forest, SCD: secondary (reforested) Cryptomeria forest; 2 Values in each column followed by different letters are significantly different at p < 0.05 by Duncan’s multiple range test.

