
An Assessment of Carbon Storage in China’s Arboreal Forests


1
State Key Laboratory of Simulation and Regulation of Water Cycle in River Basin, China Institute of Water Resources and Hydropower Resources, Beijing 100038, China
2
College of Water Sciences, Beijing Normal University, Beijing 100875, China
3
Dalian Waterwood Engineering Co. Ltd., Dalian 116021, China
*
Authors to whom correspondence should be addressed.
Forests 2017, 8(4), 110; https://doi.org/10.3390/f8040110
Submission received: 27 February 2017
/
Revised: 27 March 2017
/
Accepted: 4 April 2017
/
Published: 6 April 2017
(This article belongs to the Special Issue Soil Carbon Sequestration in Forests)
Abstract
:In the years 2009–2013, China carried out its eighth national survey of forest resources. Based on the survey data, this paper used a biomass conversion function method to evaluate the carbon stores and carbon density of China’s arboreal forests. The results showed that: (1) By age group, the largest portion of carbon stores in China’s arboreal forests are in middle-aged forests. Over-mature forests have the least carbon storage; (2) By origin, natural forests of all age groups have higher carbon storage and carbon density than man-made forest plantations. The carbon density of natural forests and forest plantations increases gradually with the age of the trees; (3) By type (dominant tree species), the 18 most abundant types of arboreal forest in China account for approximately 94% of the nation’s total arboreal forest biomass and carbon storage. Among these, broadleaf mixed and Quercus spp. form the two largest portions. Taxus spp. forests, while comprising a very small portion of China’s forested area, have very high carbon density; (4) By region, the overall arboreal forest carbon storage is highest in the southwest part of China, and lowest in the northwest. However, because of differences in land use and forest coverage ratios, regions with arboreal forests of high carbon density are not necessarily the same regions that have high overall carbon storage; (5) By province, Heilongjiang, Yunnan, Tibet, Sichuan, Inner Mongolia, and Jilin have rather high carbon storage. The arboreal forests in Tibet, Jilin, Xinjiang, Sichuan, Yunnan, and Hainan have a rather high carbon density. This paper’s evaluation of carbon storage in China’s arboreal forests is a valuable reference for interpreting the role and function of Chinese ecosystems in coping with global climate change.
1. Introduction
Forest ecosystems are the main component of terrestrial ecosystems and an important component of the Earth’s biosphere. They play an important role in regulating and maintaining balance among Earth’s ecosystems. Although forests only cover 40% of the Earth’s ice-free land area, they contain approximately 90% of the Earth’s terrestrial biomass. Carbon stores in forest ecosystems comprise three parts, the vegetation, the ground, and the soil. Carbon stored in forest vegetation accounts for 60% of the carbon in the Earth’s terrestrial biosphere. Thus, forests are the largest terrestrial ecosystem in terms of carbon storage [1,2,3,4]. Forests absorb and store the greenhouse gas CO2, and play an irreplaceable role in balancing CO2 in the atmosphere. They are an important carbon store and carbon sink in the global carbon cycle [5,6,7]. Changes in the quantity of carbon stored in forest systems directly affect the carbon stores of terrestrial ecosystems and the global carbon balance. On the one hand, forest growth can absorb and stabilize large quantities of carbon, and act as an important carbon sink for atmospheric CO2. On the other hand, harvesting and consumption of forest resources can release the carbon that they once stored; hence, forests can also become a significant source of atmospheric CO2. Clearly, forests hold a prominent position in research related to carbon cycles and carbon storage in global terrestrial ecosystems. Carbon storage in forest ecosystems is one of the fundamental parameters of research on carbon exchange between forest ecosystems and the atmosphere [8]. Research on the temporal and spatial dynamics of carbon storage in forest vegetation systems has great significance in the context of global warming. According to the fifth assessment report by the Intergovernmental Panel on Climate Change (IPCC AR5), climate change will affect carbon cycle processes through accelerated increases in the amount of CO2 in the atmosphere. Not only is vegetation itself capable of absorbing and storing large amounts of carbon, but plant litter that gets mixed with soil also becomes a huge carbon sink. Research indicates that the high-latitude forests of the northern hemisphere are an important global carbon sink. They play a key role in reducing deficits in the global carbon cycle [9,10]. China’s current forest coverage is 21.63%. Being the largest country in Asia, a sink/source analysis of China’s forests is not only critical to the study on regional carbon cycles, but also an essential component of the global carbon cycle research.
Carbon storage in forests has been widely studied by domestic and international researchers in recent years. The methods have varied, but the estimates are typically based on forest biomass. Forest biomass, in turn, is typically calculated in one of three ways: sample plot surveys, remote sensing estimates, and model simulations [11,12]. The sample plot survey method also includes biomass methods, life form list methods, volume methods, and micrometeorological methods. Of these, biomass methods are the most widely used in carbon sink calculations. The biomass method is relatively simple to implement, and appropriate for use in large-scale surveys of forest resources. The other sub-methods that comprise the sample plot inventory method are expansions and extensions of the biomass method. Remote sensing estimates are useful when researching the dynamics of carbon storage over long periods in forests that cover large geographical areas. Remote sensing can be used to directly study forest vegetation dynamics. Modeling simulation methods use mathematical models to estimate carbon storage in forests. The models can be precise and reliable. Mathematical models are a good supplementary method for large-scale carbon storage research [13,14,15]. The biomass method is clearly the most widely used method, as seen in related literature. In China, researchers often use national forest resource inventory data and the biomass method to analyze carbon stores and biomass of forest vegetation. There are different forms of the biomass method. The most common is the biomass expansion factor (BEF) method, also known as the volume-derived biomass method. Its basic principle is to use the total stock volume of a certain forest type (dominant tree species) and its biomass expansion factor to calculate its total biomass. Specific applications of this method are in the Intergovernmental Panel on Climate Change (IPCC) method, the biomass expansion factor function method [13], and the empirical model (regression method) to estimate biomass.
Since trees are the primary biological components of forest communities, in this study, we analyzed the carbon stores of China’s arboreal forests using biomass methods based on the specific data for trees from China’s forest resources inventory. We also analyzed the carbon stores and carbon density of China’s arboreal forests based on biomass estimates of the 40 most common tree species. Separate estimates were carried out for forests of different sources (natural or planted), ages (young, middle-aged, nearly mature, mature, and overly mature), and regions (northern, northeastern, eastern, south central, southwestern, and northwestern). The estimates of carbon stores in China’s arboreal forests that are included in this paper are highly significant as a reference for interpreting carbon cycle dynamics in China’s forests, and analyzing their function as a carbon sink in the context of global climate change.
2. Study Area
In this study, the biomass and carbon stores of China’s forests were estimated based on the Forest Inventory Data (FID) from China’s eighth national survey and inventory of forest resources [16,17]. The national survey and inventory of forest resources refers to the survey and verification of the distribution and quality factors of each type of forest resource in specific regions over specific periods. Since the establishment of People’s Republic of China (PRC), China’s Ministry of Forestry has carried out eight consecutive national surveys and inventories of forest resources. They occurred in the following years: first (1973–1977); second (1978–1982); third (1984–1988); fourth (1989–1993); fifth (1994–1998); sixth (1999–2003); seventh (2004–2008); and eighth (2009–2013). The surveys included the major types of forests in China, their areas and volumes, and their distribution by province [18,19]. China’s forest vegetation types include: (1) Boreal, mainly distributed in the mountains regions of the north Daxingan Mountains and the Yilehuli Mountains branching from them. The primary forest types are Larix gmelinii, Cloud fir, and Pinus sylvestris; (2) Temperate Boreal, mainly distributed in the warm temperate plains, hills, and low mountains. They also appear in low and medium-high mountains in sub-tropical regions. The primary forest types are Pinus tabuliformis forests, Pinus armandii forests, Pinus henryi forests, Pinus hwangshanensis forests, Platycladus orientalis forests, and Cryptomeria japonica forests; (3) Temperate mixed coniferous and broadleaf, mainly distributed in the vast mountainous regions to the north and east of the northeast plains with a southern boundary at the line connecting Dandong and Shenyang and extending northwards to the Xiaoxingan mountains of Heilongjiang. They also occur in the mountains of southwest China. The primary forest types are temperate coniferous mixed with broadleaf forests, with Pinus koraiensis as the dominant species and mixed coniferous and broadleaf forests, with Tsuga chinensis as the dominant species; (4) Warm temperate broadleaf deciduous, in southeast China; these are mainly located in the low plains. In western China, they can be found in the hills of the loess plateau. They are the found in the mountains of central and northern China. The primary forest types are afforested Quercus spp. and Betula spp. plantations; (5) Mixed evergreen, deciduous, and broadleaf forests and tropical/sub-tropical evergreen forests, mainly distributed south of the Qinling Mountain—Huai River Line and north of the Tropic of Cancer, east of the line connecting the Tibetan Plateau and Yunnan Province. The primary forest types are Castanopsis, Cyclobalanopsis, Lithocarpus, and Schima superba [20,21,22].
According to the eighth national forest resources inventory, China’s total forested area is 2.08 × 10⁶ km2 (21.63%). Its forest stock volume is 15.137 km3 [23]. When compared with the seventh national forest inventory survey (2004–2008), the eighth survey (2009–2013) has four outstanding features: (1) The overall quantity of forest in China continues to increase. The forested area increased from 19.5 × 10⁵ km2 (20.36%) to 20.8 × 10⁵ km2 (21.63%). Forest stock volume increased from 13.721 km3 to 15.137 km3; (2) The quality of China’s forests continues to improve. The forest stock volume per hectare has reached 89.79 m3. With the increase in total quantity and quality of China’s forests, their ecological functions have also strengthened; (3) Natural forests have steadily increased. Natural forest area has increased from 11.969 × 10⁵ km2 ha to 12.184 × 10⁵ km2, and natural forest stock volume has increased from 11.402 km3 to 12.296 km3; (4) Forest plantations have developed quickly. Afforested plantation area has increased from 6.169 × 10⁵ km2 to 6.933 × 10⁵ km2, and plantation forest volume has increased from 1.961 to 2.483 km3 [23]. In addition to the data from the national forestry resources survey, large quantities of data from other sources were also collected for this paper. Other researchers have conducted preliminary research on forest biomass and carbon stores for certain areas of China. These areas include China as a whole [24], Heilongjiang Province [25], Henan [26], Shanxi [27], Shanghai [28], Jiangsu [29], Zhejiang [30], and Yunnan [31]. Among these studies, the data were mainly collected from the 1980s to the first part of this century. However, some of the results from these studies, especially those that include parameters for specific types of forests, have been useful for this paper.
3. Study Methods
Estimates of carbon storage in arboreal forests are based on biomass analysis. The biomass density of a forest generally refers to the total mass of organic matter per unit area, including plants, animals, and microorganisms. However, since microorganisms only account for a tiny portion of the total, and animal biomass is only about 10% of plant biomass, the biomass of the plants is generally used to represent the total biomass of arboreal forests [32]. The volume-derived biomass method is suitable for estimating the biomass of forests. Its continuous biomass conversion function method has proved to be suitable for use in China. It can take advantage of the forest resources inventory data to accurately estimate forest biomass in China [11,24]. Therefore, this study used the continuous biomass conversion function method from the volume-derived biomass method to calculate arboreal forest biomass and carbon stores.
3.1. Estimating Biomass
Arboreal biomass is estimated using the continuous biomass conversion function method [11,24] with area and volume data for forests of each age group and each type of dominant species from the eighth national forest resource inventory. The following biomass expansion formula was set up to calculate the biomass in China’s arboreal forests based on their volume:
In the formula, is the biomass of a certain tree species per unit area, is the volume of a certain tree species per unit area, and a and are calculation parameters. Table 1 shows the a and parameter values for each type of tree. The main sources of data were related literature, the Ministry of Forestry’s resource inventory, and field monitoring data [26,30,33,34].
3.2. Estimation of Carbon Stores and Carbon Density
The quantity of carbon stored in an arboreal forest is estimated by multiplying the biomass of the arboreal forest by its carbon factor. The carbon factor (CF) [24,26] can be calculated using the cellulose, hemicellulose, and lignin content of each type of tree and the carbon contents of those materials (Table 1). The formula is as follows:
Since the composition of tree species, age, and population structure of forests vary by type, the carbon factor also varies. International studies often use carbon factors of 0.45–0.50 [35]. Li Lei (2010) [34] list the following carbon factors for the tree species in China: Cupressus funebris 0.5034; Pinus thunbergii 0.5136; Pinus tabuliformis 0.5207; Pinus massoniana 0.4596; Cunninghamia lanceolate 0.5201; Quercus spp. 0.5004; Populus spp. 0.4956; Paulownia 0.4695; mixed broadleaf forests 0.4900; mixed coniferous forests 0.5101; mixed broadleaf and coniferous forests 0.4978. Other species not listed in Table 1 use carbon factors of 0.50. The calculated arboreal forest carbon stores do not include carbon stored in the undergrowth layer, plant litter, or forest root systems. Carbon density is simply the carbon stock per unit area.
4. Results and Discussion
4.1. Analysis by Source and Age Group
Analysis indicates that China’s arboreal forests have a total area of 165 × 106 ha and total carbon stores of 7616 × 106 Mg. Of that, there are 118 × 106 ha of natural forests with carbon density 54 Mg/ha. These natural forests account for approximately 83% of the total biomass and carbon storage of China’s forests. There are 47 × 106 ha of afforested plantations. They account for the remaining 17% of arboreal forest biomass and carbon storage in China. The average carbon density of these man-made forests is only 27 Mg/ha. The national average carbon density in China’s forests is 46 Mg/ha. China’s middle-aged forests and overly mature forests account for approximately 28% and 13% of total carbon stores, respectively. Young forests, nearly mature forests, and mature forests each account for approximately 20% of total carbon stores. Carbon density increases with the age of the forests. The average carbon density by age group ranges from 29 Mg/ha to 87 Mg/ha.
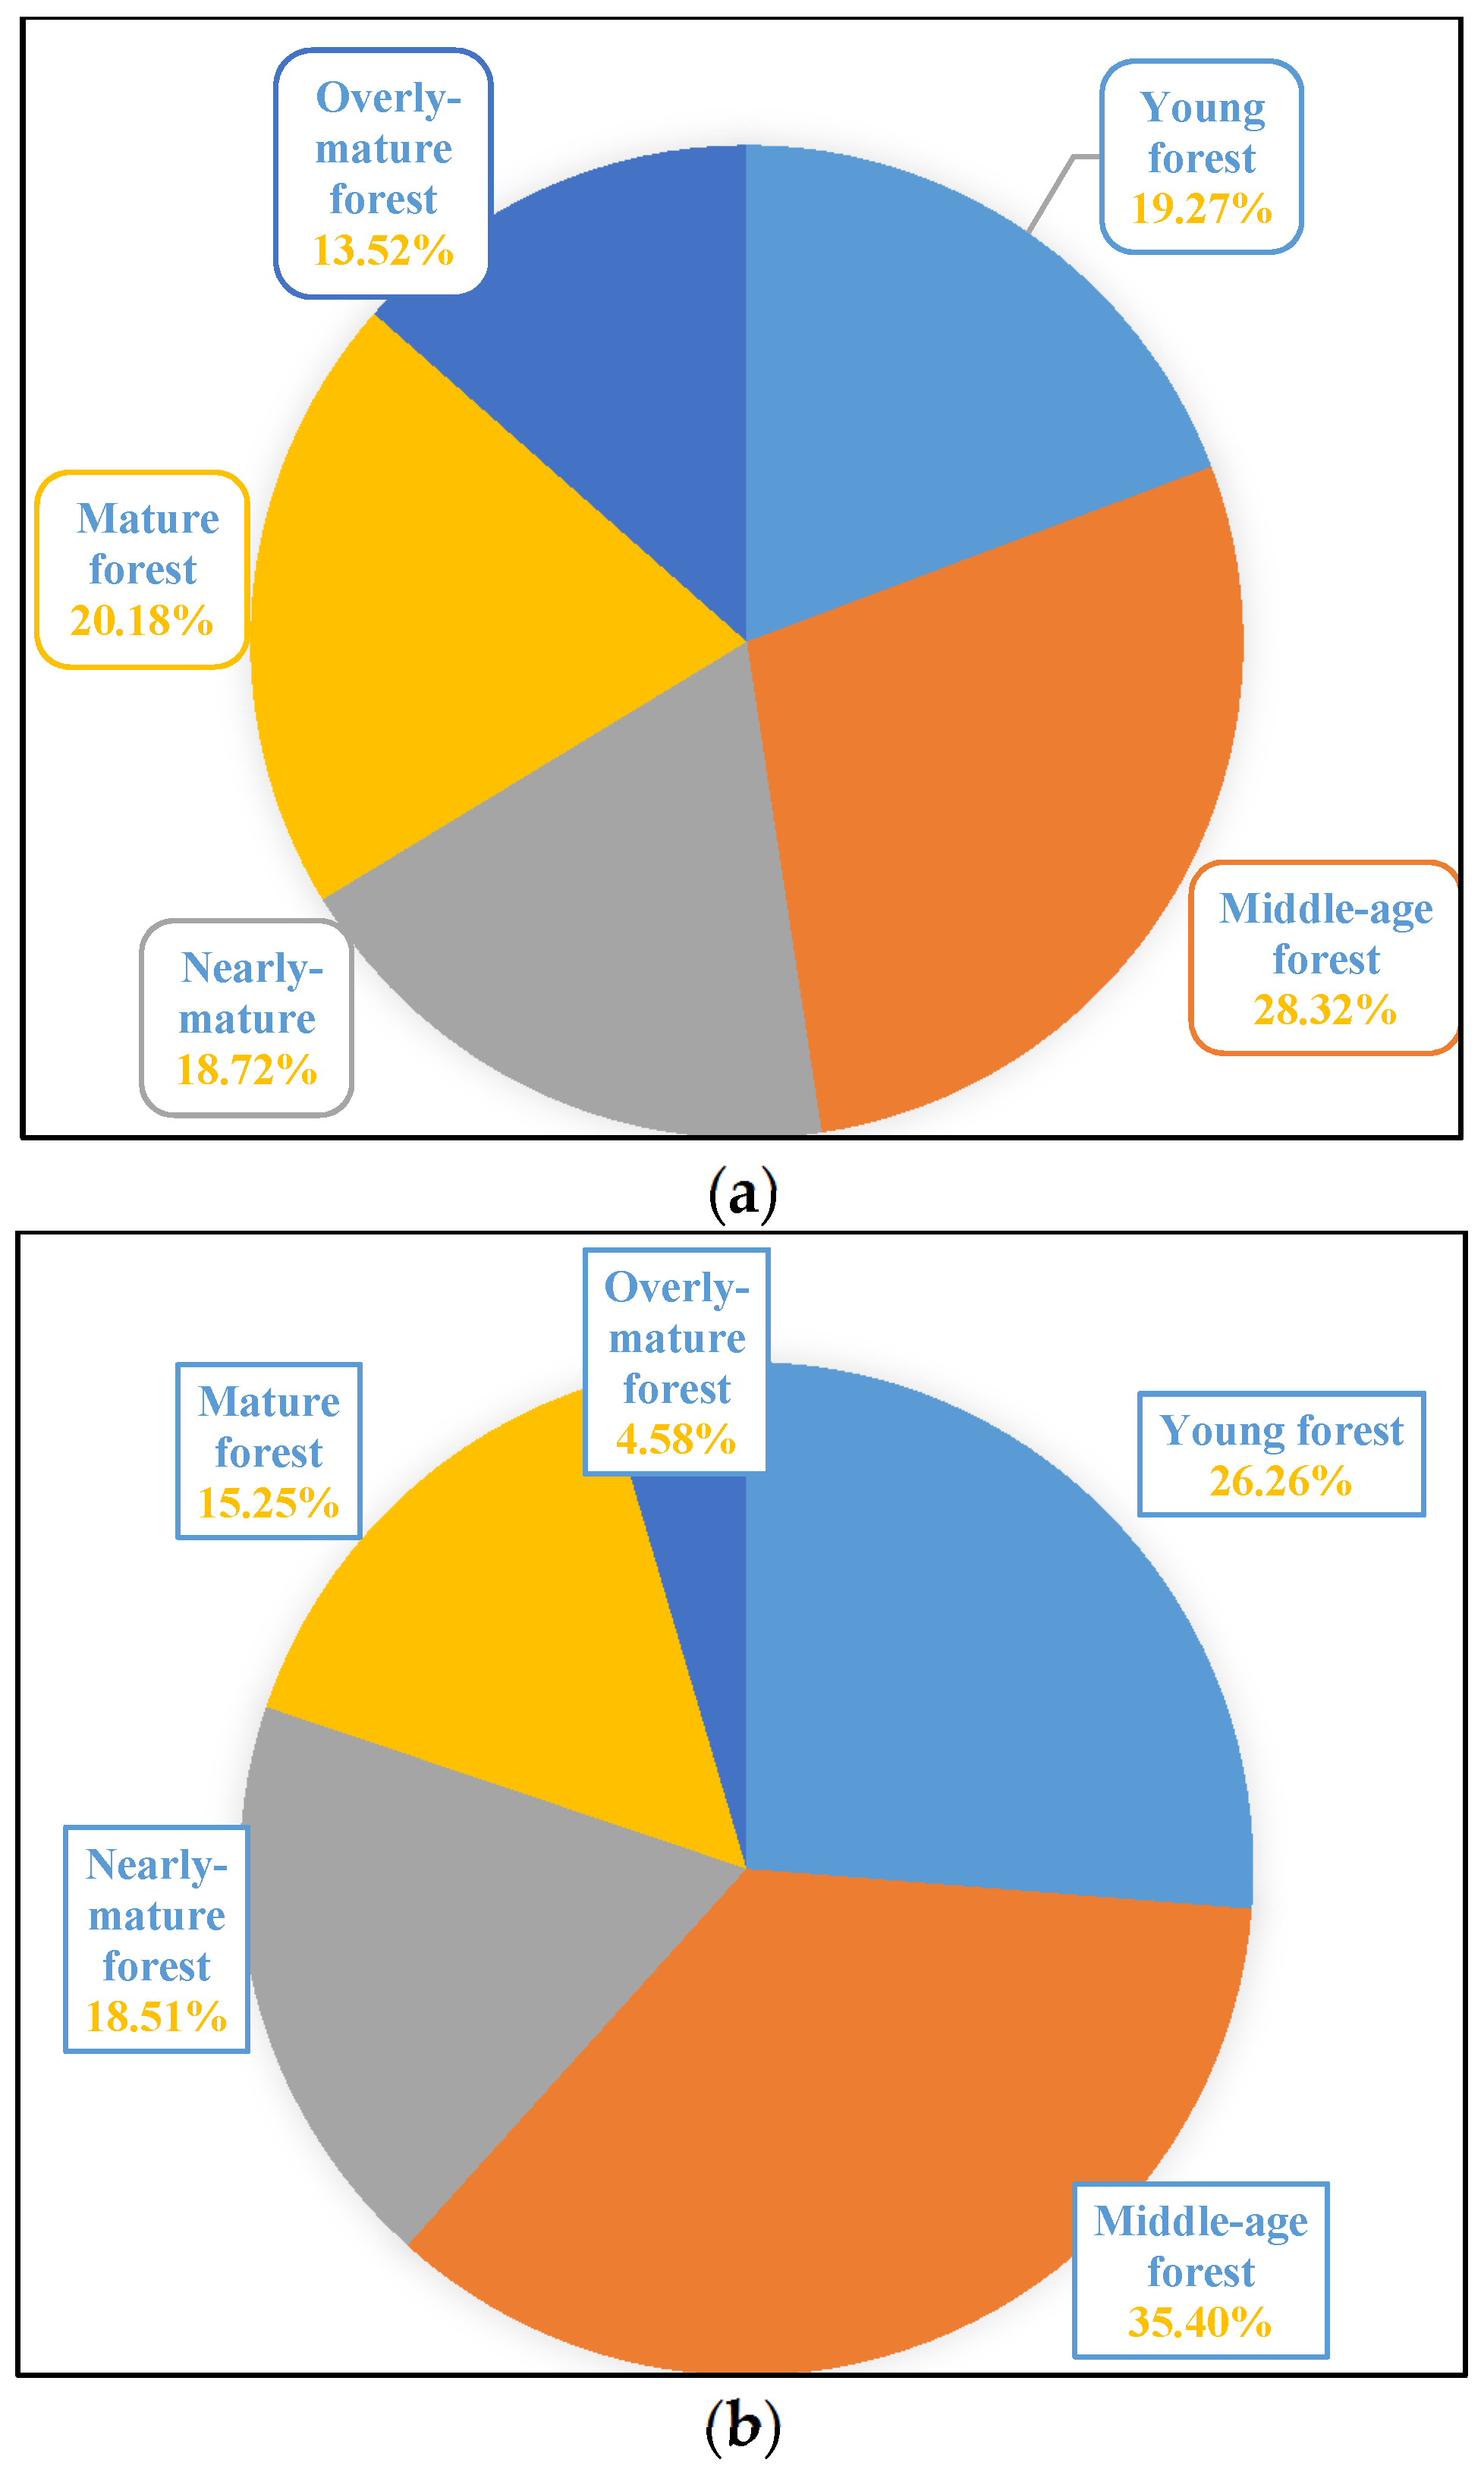
Figure 1a shows the carbon stored in natural forests by age group. Middle-aged forests have the most stored carbon (28%). Similar amounts of carbon are stored in young, nearly mature, and mature forests. Overly mature forests account for the smallest proportion of carbon (14%). The differences in the amounts of carbon stored in natural forests of different age groups are rather small. Figure 1b shows the carbon stored in forest plantations by age group. Middle-aged forest plantations account for over one-third of the total and the next are young forests, approximately one-quarter of the total. Overly mature forest plantations only account for 1/20 of the carbon stores in these man-made forests. That is far less than forest plantations in the other four age groups. In each age group, natural forests have much more carbon storage than forest plantations. The biggest difference is a multiple of 15 (Figure 2).
Carbon density in natural forests and forest plantations both increase gradually with the age of the forests. In natural forests, the relationship between carbon density and age is linear. In forest plantations, carbon density increases more slowly with the age of the trees, and tends to level off when the forests reach the mature stage of forest development (Figure 3). Natural forests of all ages have higher carbon density than forest plantations, but the difference in carbon density between natural forests and forest plantations is rather low for young and middle-aged forests. Subsequently, the difference in carbon density between natural and artificial forests gradually becomes more pronounced. The carbon density ratio for forests of these two types (in the same age group) ranges from 1.61 to 2.42.
4.2. Analysis by Tree Species (Group)
A total of 77 different types of forest (dominant species) were identified in China’s eighth national forest resources inventory survey. Eighteen of these forest types represented more than 1% of China’s total forested area each (Figure 4). Together, these 18 types represented 92% of the total area. The total biomass and total carbon storage of these 18 types of forest were 14,323 × 106 Mg and 7133 × 106 Mg, respectively, which was approximately 94% of the total. The two types with the largest areas, mixed broadleaf forests and Quercus spp. forests, had the largest biomass and carbon stores. Together, these two types account for 46% of the biomass and carbon stores in China’s arboreal forests. The other 16 largest types, except for Pinus tabuliformis, each accounted for 1%–7% of the total biomass and carbon stores in China’s arboreal forests. While Pinus tabuliformis occupied more than 1% of the total area, it only accounted for 0.75% of the biomass and carbon stores. More detailed analysis of these 18 types of forest shows that Abies fabri, while only accounting for 2% of the arboreal forest area of China, and less than 5% of the biomass and carbon stores, had a carbon density of 110 Mg/ha. That is much higher than the national average carbon density of arboreal forests, which is 46 Mg/ha. Of the top 18, four other types (Picea asperata, mixed broadleaf, Quercus spp., and Larix gmelinni) also had carbon densities higher than the national average. The other 13 had carbon densities lower than the national average. The lowest was Pinus massoniana, with only 14 Mg/ha.
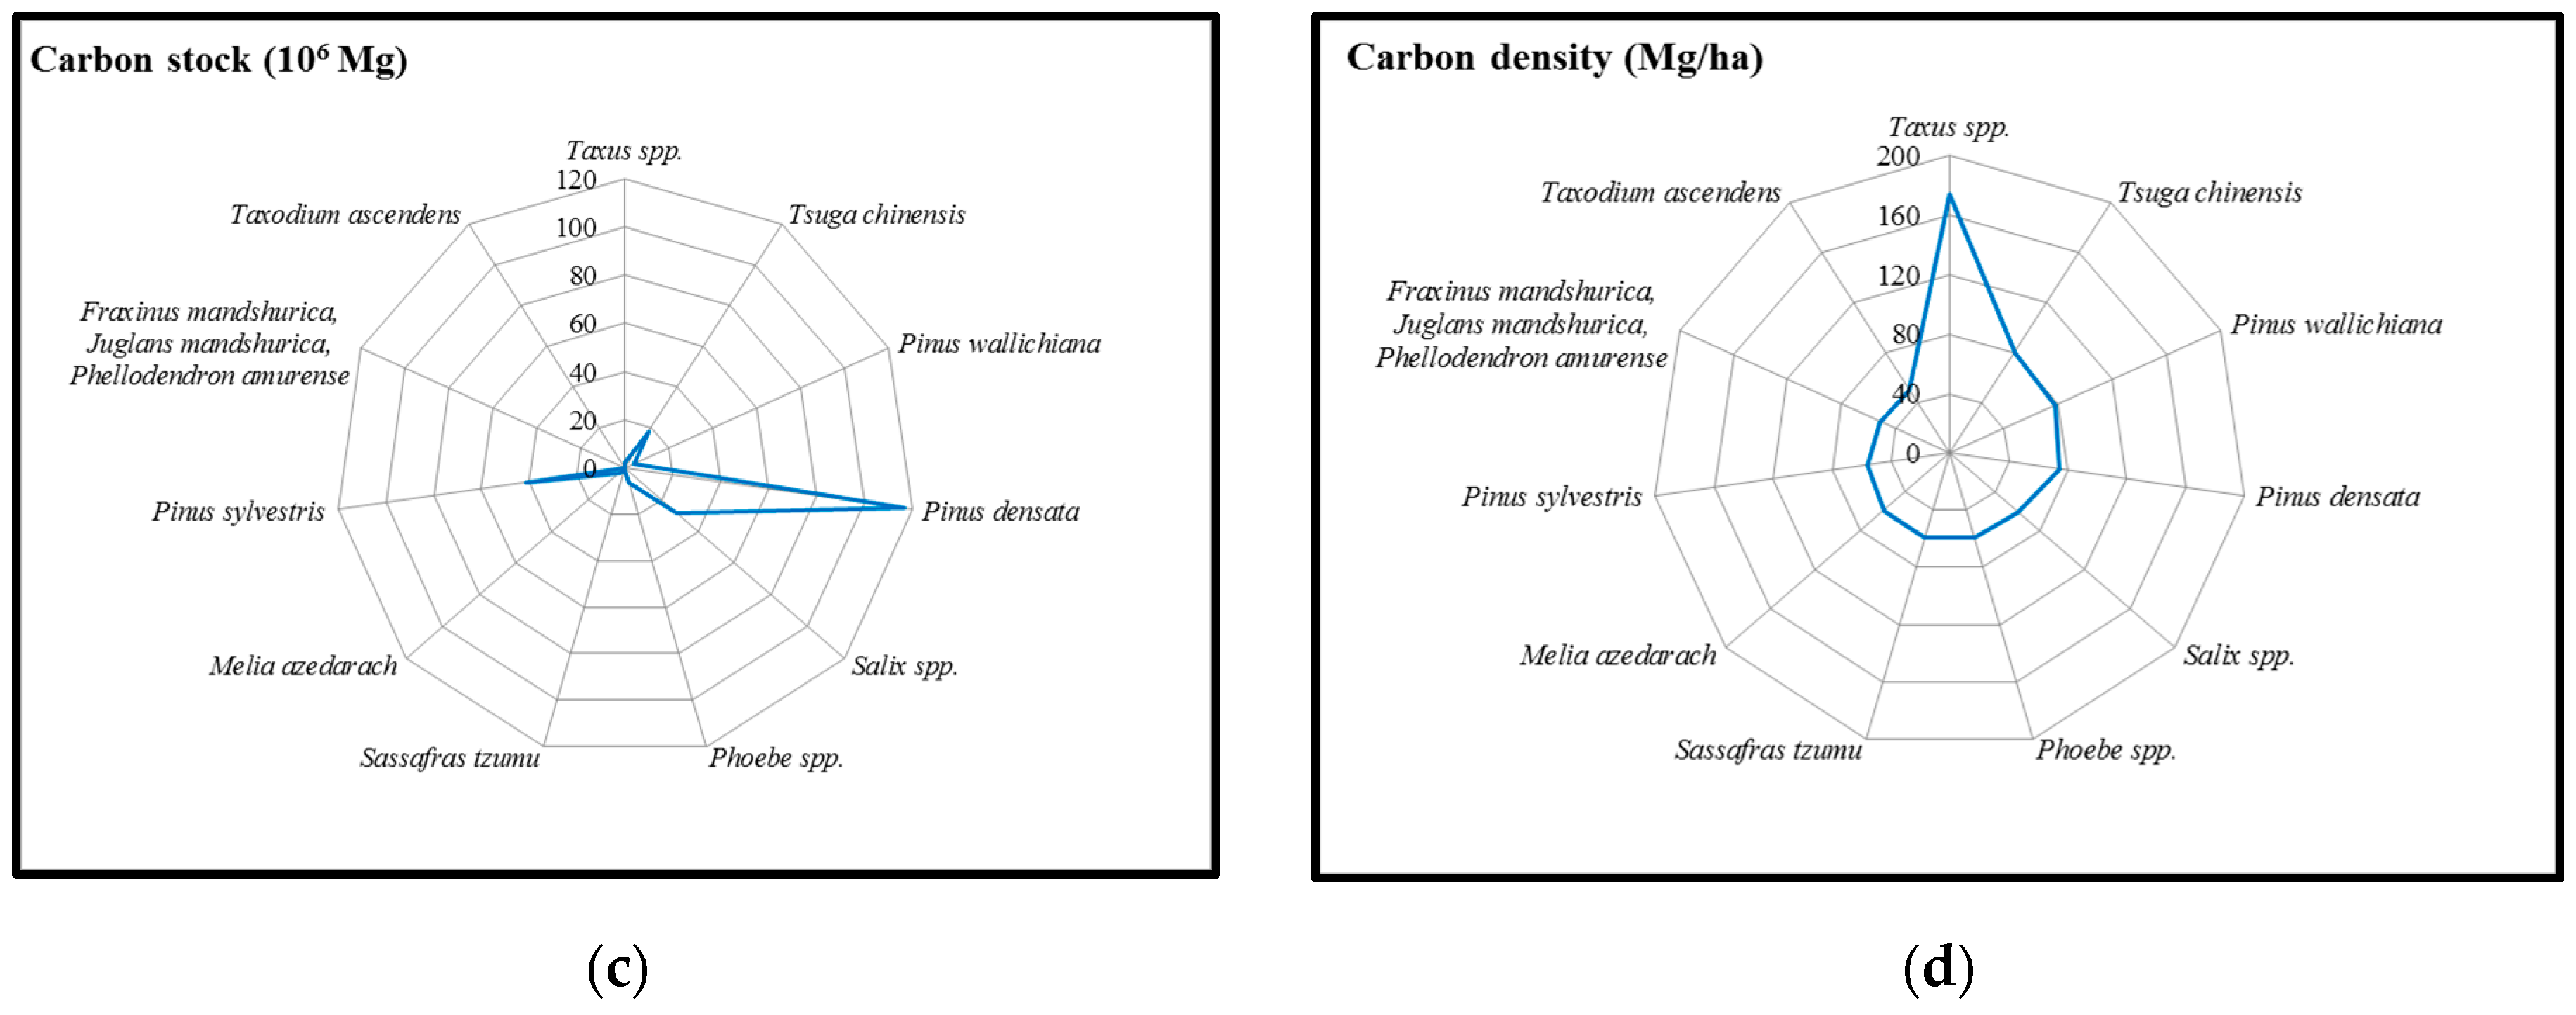
Of the 59 types of forest accounting for less than 1% of the total arboreal forested area each, 11 had carbon densities higher than the national average of 46 Mg/ha (Figure 5), and above 50 Mg/ha. Their combined area was less than 2% of the total, however, and their combined biomass and carbon stores were less than 3% of the total. One notable type, Taxus spp., while occupying less than 0.01% of the total arboreal forested land in China and with less than 0.03% of the total biomass and carbon storage, had a carbon density of 174 Mg/ha, almost 4 times the national average. This is the highest carbon density of any type of arboreal forest in China.
4.3. Analysis of Geographical Distribution Patterns
In terms of forest distribution, China can be divided into the following regions: north China, northeast China, east China, south central China, southwest China, and northwest China. North China includes Beijing, Tianjin, Hebei, Shanxi, and Inner Mongolia. Northeast China includes Liaoning, Jilin, and Heilongjiang. East China includes Shanghai, Jiangsu, Zhejiang, Anhui, Fujian, Jiangxi, and Shandong. South central China includes Henan, Hubei, Hunan, Guangdong, Guangxi and Hainan. Southwest China includes Chongqing, Sichuan, Guizhou, Yunnan, and Tibet. Northwest China includes Shaanxi, Gansu, Qinghai, Ningxia, and Xinjiang [36].
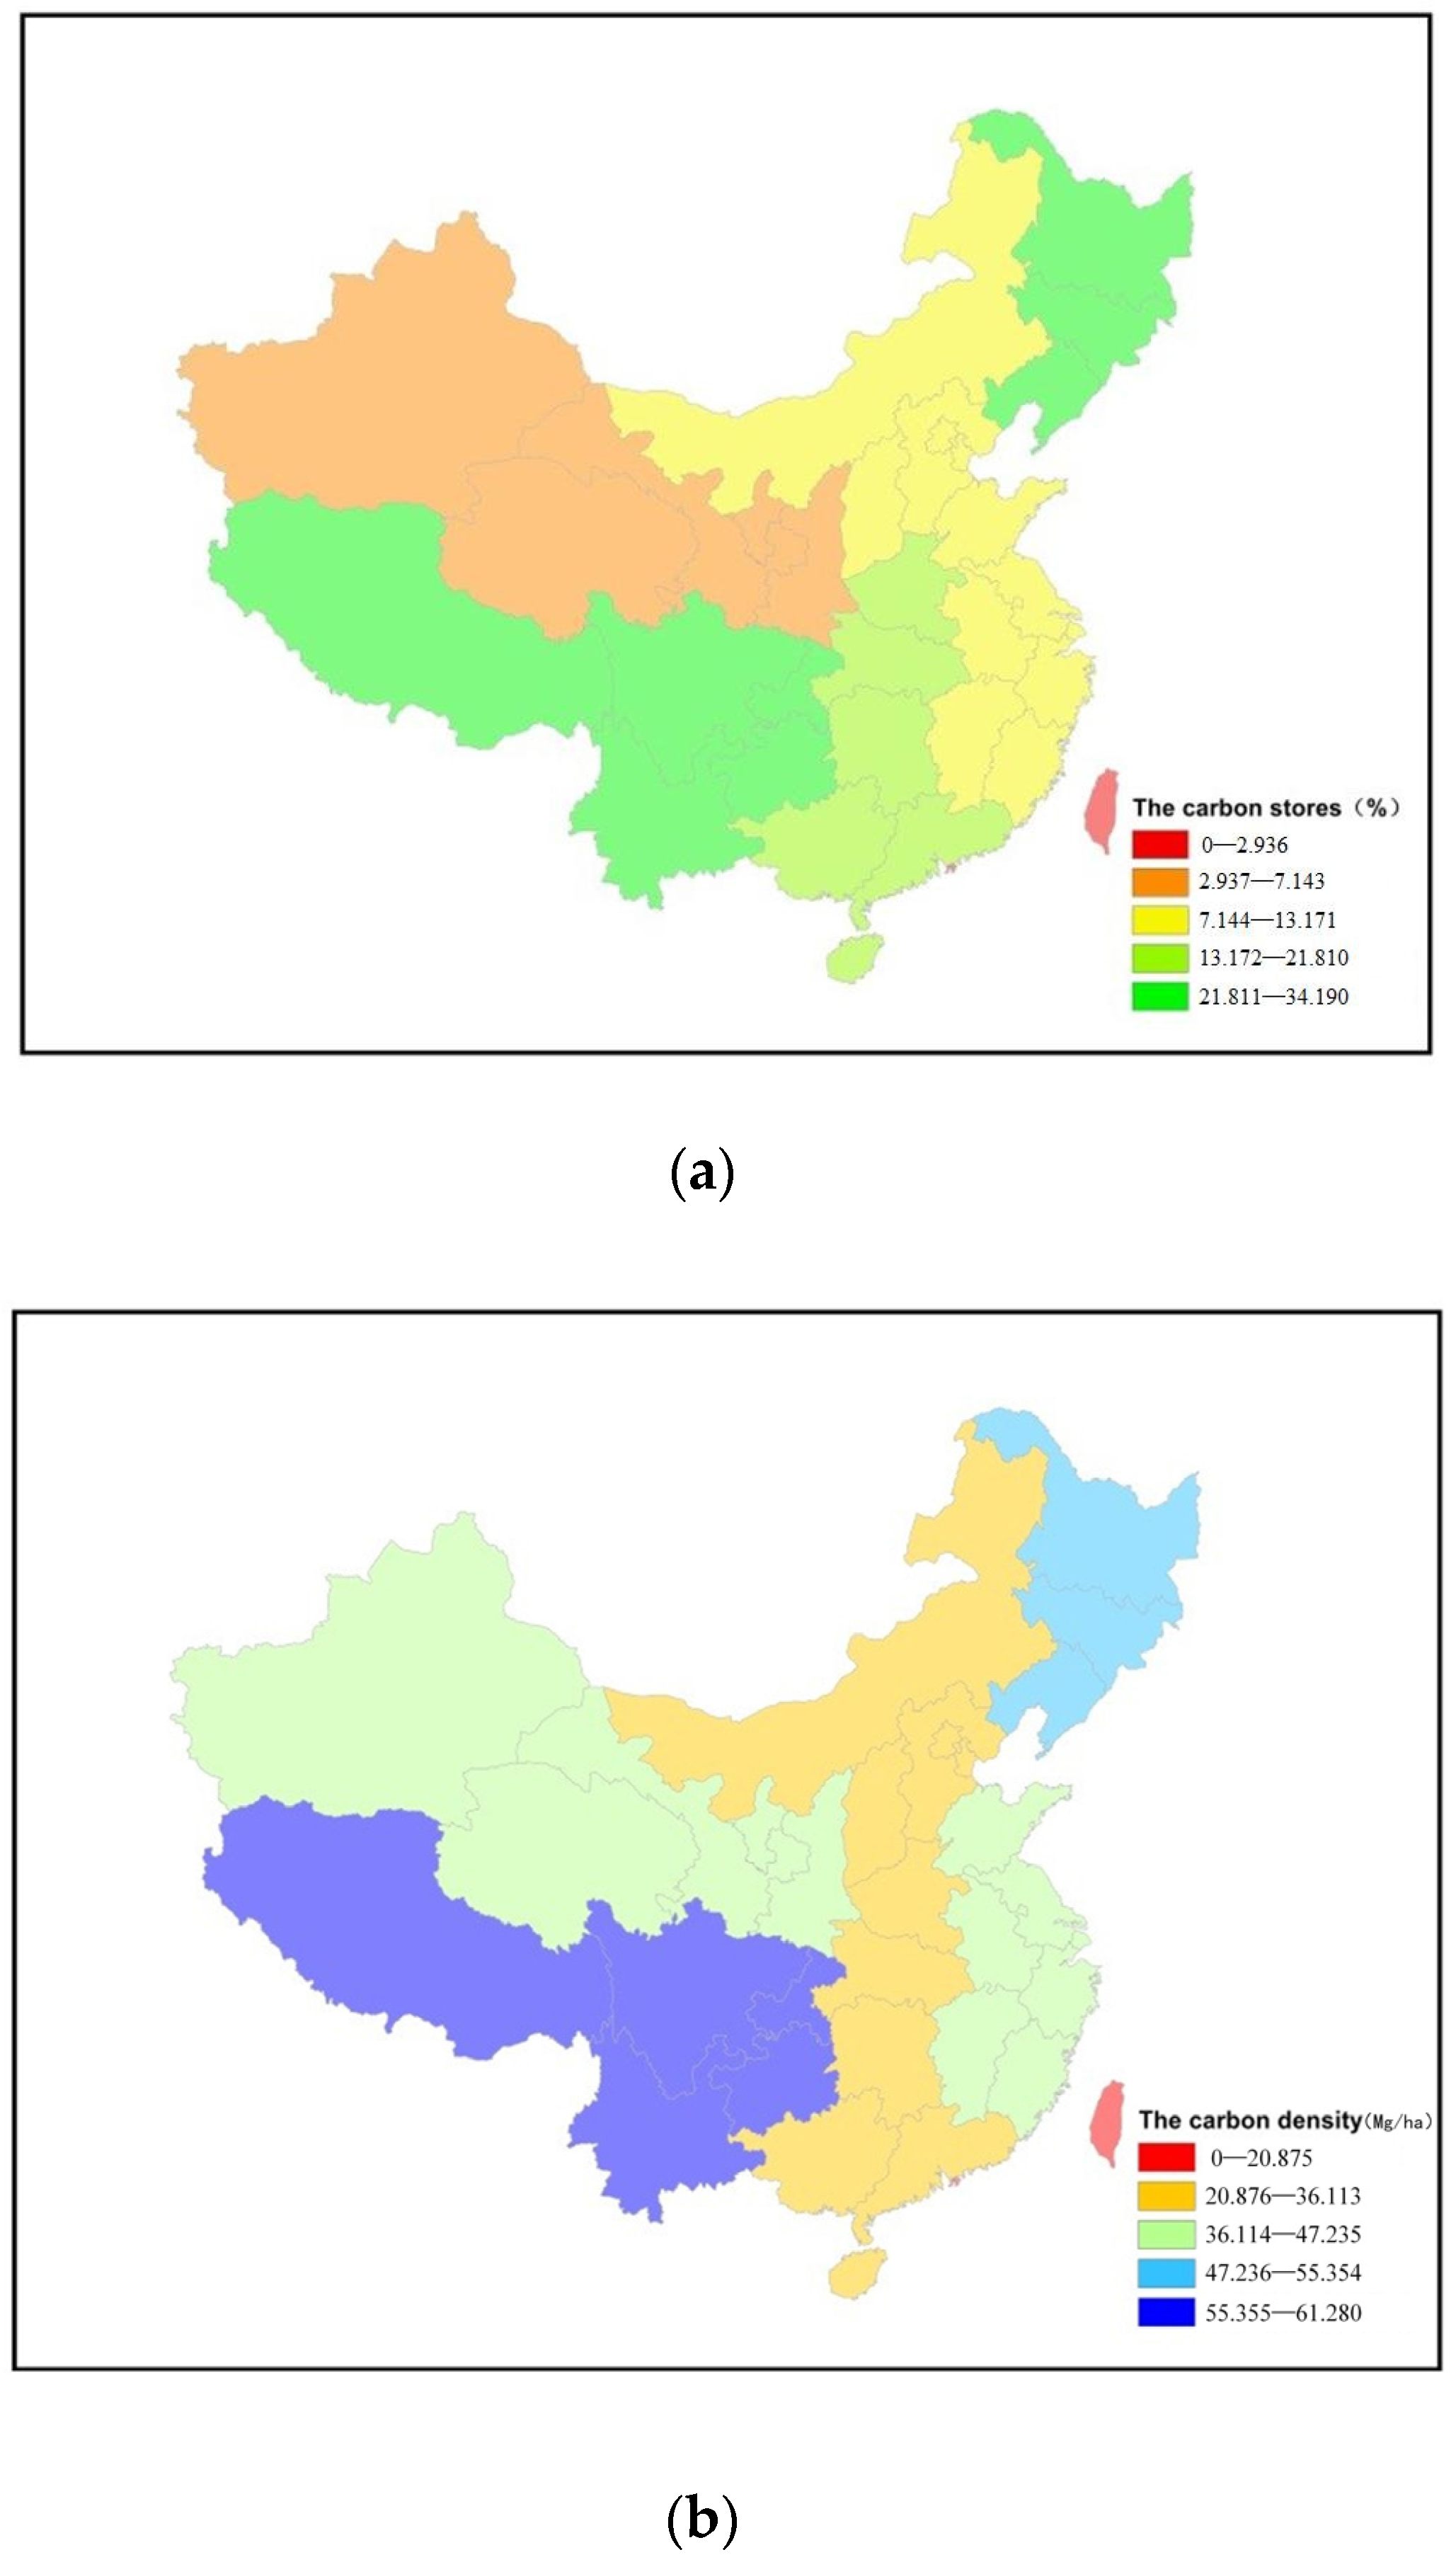
The geographical distribution of biomass and carbon stores in China’s arboreal forests is similar. They both have extremes (Figure 6a). The southwest China region accounts for more than one-third of the nation’s total biomass and carbon stores. It mainly contains dark needle coniferous forests such as those of Picea asperata and Abies fabri. Northwest China’s biomass and carbon stores account for less than 1/15 of the nation’s total stores. The other four regions each have 1/10–1/5 of the total. The spatial distributions of biomass density and carbon density are not completely the same as the distribution of carbon stores (Figure 6b). However, both the biomass density and the carbon storage density are highest in the forests of the southwest region. They are 20 Mg/ha and 15 Mg/ha higher than the national average, respectively; the second highest are the forests of northeast China. The biomass density and carbon density of northeastern forests are also higher than the national average. Arboreal forests in northwest China are not common, but where they do occur, they are dense. Therefore, the biomass density and carbon store density of the arboreal forests of the northwest are just below the national average. The relatively high biomass sub-alpine coniferous forests are mainly found in these three regions. Forests in north China, east China, and south central China are mainly afforested plantations. Their biomass densities and carbon densities are both far below the national average.
Figure 7 shows the carbon statistics in China’s arboreal forests by province. There are six provinces with at least 5% of the nation’s total arboreal forest carbon stores each. They include Heilongjang, Yunnan, Tibet, Sichuan, Inner Mongolia, and Jilin. The carbon density of arboreal forests in Inner Mongolia is slightly lower than the national average, but the carbon density of arboreal forests in the other five is above the national average and above 50 Mg/ha. Arboreal forests in Tibet have an average carbon density that is more than twice the national average. Of the 18 provinces that have forests with carbon densities higher than the national average, Hainan and Qinghai each have less than 1% of China’s total arboreal forest carbon stores, 0.71% and 0.25%, respectively. The other nine provinces with total carbon stores less than 1% of the national total, namely, Hebei, Chongqing, Shanxi, Shandong, Jiangsu, Beijing, Ningxia, Tianjin, and Shanghai have forests with the lowest carbon densities. They are almost all below 30 Mg/ha.
4.4. Discussion
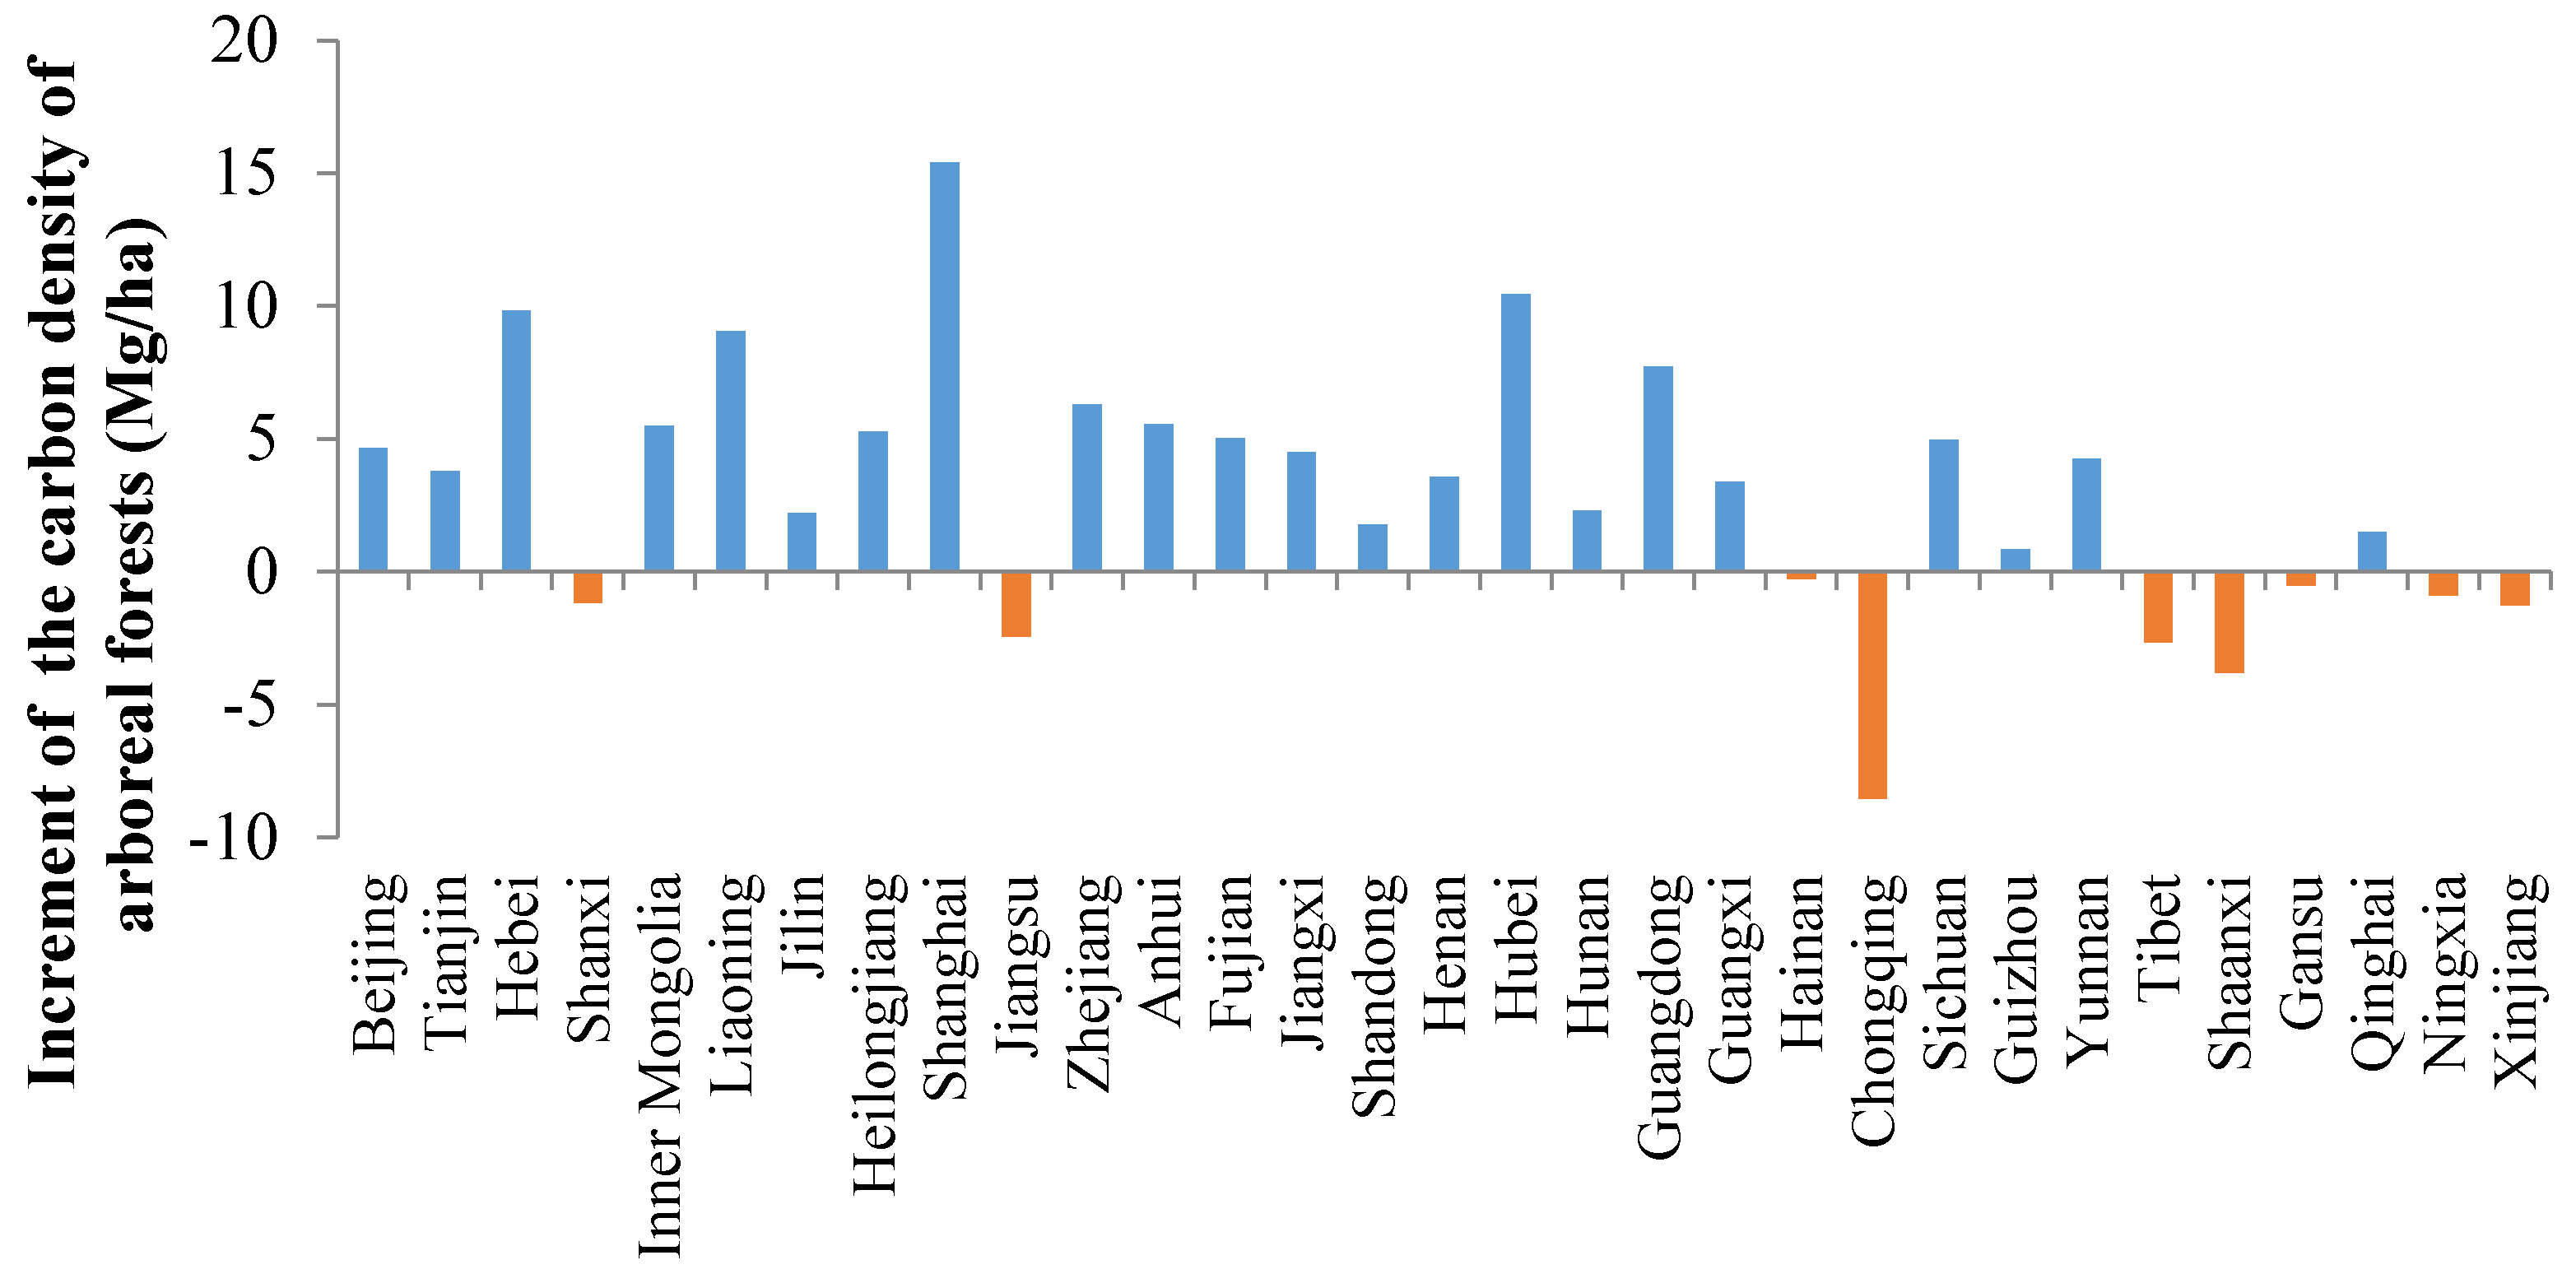
Compared with the estimated results based on the China’s seventh national forest resources inventory survey [37], the total carbon storage of arboreal forest increased by 14.3% in recent years, from 6662 × 106 Mg to 7616 × 106 Mg. Regarding the consideration of sources, although the carbon storage of natural forest and forest plantations both increased, the respective proportion in the total carbon storage of the arboreal forest showed little change, being 83% and 17%, respectively. In considering age groups, among natural forests, the proportion of carbon storage in the young forest, middle-age forest, and nearly-mature forest increased from 61.85% to 66.31%, while the proportion of carbon storage in mature and overly-mature forests reduced from 38.15% to 33.69%; among artificial forests, the proportion of carbon storage in the young forest, middle-age forest, and nearly-mature forest reduced from 81.35% to 80.17%, while that in mature and overly-mature forests increased from 18.65% to 19.83%. Observing regional change, only forest carbon density in the northwest region decreased slightly (by 2.79 Mg/ha). The carbon density in all the other areas increased. The national average carbon density of arboreal forest increased from 42 Mg/ha to 46 Mg/ha. Figure 8 shows the variation of carbon density of arboreal forest in each province, and the carbon density decreased only in 9 of the 31 provinces, while the other provinces have increased.
From the above information, in the period of the eighth national forest resources inventory survey during 2009 to 2013, China’s arboreal forest carbon storage and carbon density showed an overall increase, which is mainly because in recent years the country attached great importance to ecological system protection. The forested area increased from 19.5 × 10⁵ km2 to 20.8 × 10⁵ km2, and the forest coverage rate increased from 20.36% to 21.36%. The forest stock volume also increased. The quantity and quality of the forest resources in China has entered a period of steady development; at the same time, the ecological function of the forest has been enhanced.
5. Conclusions
This paper has analyzed the information from China’s eighth national forest resources inventory survey. It has been seen that the total biomass in China’s arboreal forests is 15,306 × 106 Mg, with total carbon stores of 7616 × 106 Mg. The carbon density of China’s arboreal forests is 46 Mg/ha. Natural forests account for approximately 83% of the biomass and carbon stores, while man-made forest plantations account for the remaining 17%. Carbon density in natural forests is higher than the national average. Middle-aged forests have the highest proportion of biomass and carbon stores, while overly mature forests have the lowest. Forests in the other three age groups are in-between and very similar to each other. Carbon density increases gradually with the age of the forests. In natural forests, the increase is linear, but in man-made forest plantations, the increase is more gradual, and carbon density tends to stabilize in the mature stage of forest development. Of the 77 different types of forest identified by dominant species (groups), broadleaf mixed forests had the highest biomass and carbon stores, with Quercus spp. being the second highest. Together, these two types accounted for almost half of the nation’s total carbon stores. The carbon density of Taxus spp. forests was nearly 4 times the national average, the highest of any type of forest. However, Taxus spp. forests had very low overall carbon stores (<1% of the total). Fraxinus chinensis forests had the lowest carbon density, only 4 Mg/ha. Geographically, the carbon stores in the southwest and northeast regions were clearly higher than other regions. Together, these two regions had more than half of China’s total carbon stores. Among the other four regions, the northwest had the least favorable climate for vegetation to grow. Total carbon stores tend to increase from the northwest towards the southeast. Only the southwest and northeast regions had carbon densities higher than the national average. Because of the severe influence of human activities, forests in north China, east China, and south central China had much lower carbon densities than the forests of the northwest; however, in terms of total carbon stores, the exact opposite is true.
By comparing the results in this paper with the estimated results based on the seventh national forest resources inventory survey, it has been shown that the forest resources in China have entered a period of steady growth in both quantity and quality, which reflects that the country has paid more attention to the construction of ecological civilization and has achieved some remarkable results in recent years. However, overall, the situation of the relative shortage of forest resources and their uneven distribution still remains, and the contradiction between effective forest supply and the increasing social demand is still outstanding, so the task of forest protection and ecological afforestation is still substantial. In the future, more social forces need to be mobilized in the implementation of ecological restoration engineering to obtain steady expansion of forest area, and the scientific management of forests should be promoted, improving forests’ quality and benefit, and enhancing their ecological function.
Acknowledgments
The researchers would like to extend their thanks to the Chinese National key research and development program (2016YFC0401401) and Chinese National Natural Science Foundation (No. 51522907, No. 51109222). The study was also supported by the Research Fund of the China Institute of Water Resources and Hydropower Research (No. WR0145B502016, No. 2016ZY02).
Author Contributions
W.S. and J.L. conceived and designed the study methods; J.C. and H.W. analyzed the data; H.Z. and H.H. created the tables and figures.
Conflicts of Interest
The authors declare no conflict of interest.
References
- Bellassen, V.; Viovy, N.; Luyssaert, S.; Maire, G.L.; Schelhaas, M.J.; Ciais, P. Reconstruction and attribution of the carbon sink of European forests between 1950 and 2000. Glob. Chang. Biol. 2011, 17, 3274–3292. [Google Scholar] [CrossRef]
- Fang, J.; Guo, Z.; Hu, H.; Kato, T.; Muraoka, H.; Son, Y. Forest biomass carbon sinks in East Asia with special reference to the relative contributions of forest expansion and forest growth. Glob. Chang. Biol. 2014, 20, 2019–2030. [Google Scholar] [CrossRef] [PubMed]
- Hayes, D.J.; Turner, D.P.; Stinson, G.; Mcguire, A.D.; Wei, Y.; West, T.; Heath, L.; Dejong, B.; Mcconkey, B.; Birdsey, R.A.; et al. Reconciling estimates of the contemporary North American carbon balance among terrestrial biosphere models, atmospheric inversions, and a new approach for estimating net ecosystem exchange from inventory-based data. Glob. Chang. Biol. 2012, 9, 1282–1299. [Google Scholar] [CrossRef]
- Saatchi, S.S.; Harris, N.L.; Brown, S.; Lefsky, M.; Mitchard, E.T.A.; Salas, W.; Zutta, B.R.; Buermann, W.; Lewis, S.L.; Hagen, S.; et al. Benchmark map of forest carbon stocks in tropical regions across three continents. Proc. Natl. Acad. Sci. USA 2011, 108, 9899–9904. [Google Scholar] [CrossRef] [PubMed]
- Lai, R. Carbon sequestration. Philos. Trans. R Soc. Lond. B Biol. Sci. 2008, 363, 815–830. [Google Scholar]
- Cusack, D.F.; Axsen, J.; Shwom, R.; Hartzell-Nichols, L.; White, S.; Mackey, K.R. An interdisciplinary assessment of climate engineering strategies. Front. Ecol. Environ. 2014, 12, 280–287. [Google Scholar] [CrossRef]
- Bonan, G.B. Forests and climate change: Forcings, feedbacks, and the climate benefits of forests. Science 2008, 320, 1444–1449. [Google Scholar] [CrossRef] [PubMed]
- Zhao, M.; Zhou, G. Carbon Storage of forest vegetation and its relationship with Climatic Factors. Sci. Geogr. Sin. 2004, 24, 50–54. [Google Scholar] [CrossRef]
- Valentini, R.; Mattenccl, G.; Dolman, A.J.; Schulze, E.D.; Rebmann, C.; Moors, E.J. Respiration as the main determinant of carbon balance in European forests. Nature 2000, 404, 861–865. [Google Scholar] [CrossRef] [PubMed]
- Schimel, D.; Melillo, J.; Tian, H.Q.; McGuire, A.D.; Kickleghter, D.; Kittel, T.; Rosenbloom, N.; Running, S.; Thornton, P.; Ojima, D.; et al. Contribution of increasing CO2 and climate to carbon storage by ecosystems in the United States. Science 2000, 287, 2004–2006. [Google Scholar] [CrossRef] [PubMed]
- Fang, J.; Chen, A.; Zhao, S.; Ci, L. Estimating Biomass carbon of China’s forest: Supplementary notes on report published in Science (291:2320–2322) by Fang et al. (2001). Acta Phytoecol. Sin. 2002, 26, 243–249. [Google Scholar]
- Liu, W.; Wang, X.; Lv, F.; Ouyang, Z. Regional and global estimates of carbon stocks and carbon sequestration capacity in forest ecosystems. Chin. J. Appl. Ecol. 2015, 26, 2881–2890. [Google Scholar]
- Fang, J.; Chen, A.; Peng, C.; Zhao, S.; Ci, L. Changes in forest biomass carbon storage in China between 1949 and 1998. Science 2001, 292, 2320–2322. [Google Scholar] [CrossRef] [PubMed]
- Sitch, S.; Smith, B.; Prentice, I.C.; Arneth, A.; Bondeau, A.; Cramer, W.; Kaplan, J.O.; Levis, S.; Lucht, W.; Sykes, M.T.; et al. Evaluation of ecosystem dynamics, plant geography terrestrial carbon cycling in the LPJ dynamic global vegetation model. Glob. Chang. Biol. 2003, 9, 161–185. [Google Scholar] [CrossRef]
- Gerten, D.; Schaphoff, S.; Haberlandt, U.; Lucht, W.; Sitch, S. Terrestrial vegetation and water balance—Hydrological of a dynamic global vegetation model. J. Hydrol. 2004, 286, 249–270. [Google Scholar] [CrossRef]
- Wang, B.; Liu, M.; Zhang, B. Dynamics of net production of Chinese forest vegetation based on forest inventory data. Forest Resour. Manag. 2009, 2, 35–42. [Google Scholar]
- Deng, L.; Shangguan, Z. Methods for forest carbon storage estimation based on forest Inventory Data. Bull. Soil Water Conserv. 2011, 31, 143–147. [Google Scholar]
- People’s Republic of China Ministry of Forestry. National Forest Resource Statistics (1984–1988); China Forestry Publishing House: Beijing, China, 1989.
- People’s Republic of China Ministry of Forestry. National Forest Resource Statistics (1989–1993); China Forestry Publishing House: Beijing, China, 1994.
- Jiang, Y.; Guo, Q.; Ma, J. Classification and Characteristics of Chinese Forest Communities; China Sciences Publishing and Media, Ltd. and China Forestry Publishing House: Beijing, China, 1998. [Google Scholar]
- Li, W.; Li, F. China Forest Resource Research; China Forestry Publishing House: Beijing, China, 1996. [Google Scholar]
- Luo, T. Biological Production Patterns in China’s Main Forest Types and Their Mathematical Models. Ph.D. Thesis, Chinese Academy of Sciences, Natural Resources Comprehensive Investigation Committee, Beijing, China, 1996. [Google Scholar]
- Ministry of Forestry. China Forestry Network. Announcing the Results of the 8th National Forest Resources Inventory. Available online: http://www.forestry.gov.cn/main/72/content-659780.html (accessed on 26 February 2014).
- Fang, J.; Chen, A. Dynamic forest biomass carbon pools in China and their significance. Acta Bot. Sin. 2001, 43, 967–973. [Google Scholar]
- Jiao, Y.; Hu, H. Carbon storage and its dynamics of forest vegetations in Heilongjiang Province. Chin. J. Appl. Ecol. 2005, 6, 2249–2252. [Google Scholar]
- Jia, S. Study on carbon storage of forest vegetation and its economic value in Henan Province based on continuous forest resources inventory. Hubei Agric. Sci. 2016, 55, 1612–1616. [Google Scholar]
- Ren, S. Statistical analysis of carbon storage of arbor stand in Shanxi. Shanxi For. 2011, 40, 35–37. [Google Scholar]
- Wang, M. Estimating Biomass and Carbon Storage of Arbor Stand in Shanghai. Master Thesis, East China Normal University, Shanghai, China, 2013. [Google Scholar]
- Wang, L.; Ding, J.; Ji, Y.; Liang, Z.; Li, R.; Ruan, H. The dynamic carbon storage and economic value assessment of forest in Jiangsu Province. J. Nanjing For. Univ. (Nat. Sci. Ed.) 2010, 34, 1–5. [Google Scholar]
- Zhang, M.; Wang, G.; Liu, A. Estimation of forest biomass and net primary production for Zhejiang Province based on continuous forest resources inventory. Sci. Silvae Sin. 2009, 45, 13–17. [Google Scholar]
- Li, L. Carbon Storage Dynamics in the Forest Vegetation of Yunnan Province from 1992 to 2007 and Analysis of Its Carbon Sink Potential. Master Thesis, Yunnan University of Finance and Economics, Kunming, China, 2012. [Google Scholar]
- Brown, S.L.; Schroeder, P.E. Spatial patterns of aboveground production and mortality of woody biomass for eastern U.S. forest. Ecol. Appl. 1999, 9, 968–980. [Google Scholar]
- Li, H.; Lei, Y. Estimates of Biomass and Carbon Stores in China’s Forests; China Forestry Publishing House: Beijing, China, 2010. [Google Scholar]
- Gao, Y. Carbon Density and Storage of Forest and Grassland Ecosystems in the Loess Plateau Region. Ph.D. Thesis, Northwest Agriculture and Forestry University, Yangling, China, 2014. [Google Scholar]
- Lamlom, S.H.; Savidge, R.A. A reassessment of carbon content in wood: Variation within and between 41 North American species. Biomass Bioenergy 2003, 25, 381–388. [Google Scholar] [CrossRef]
- Ma, X.; Wang, Z. Estimation of provincial forest carbon sink capacities in Chinese mainland. Chin. Sci. Bull. 2011, 56, 433–439. [Google Scholar] [CrossRef]
- Li, H.; Lei, Y.; Zeng, W. Forest carbon storage in China Estimated using forestry inventory data. Sci. Silvae Sin. 2011, 47, 7–12. [Google Scholar]
Figure 1.
(a) Total natural forest carbon stores by age group; (b) Total forest plantation carbon stores by age group.
Figure 1.
(a) Total natural forest carbon stores by age group; (b) Total forest plantation carbon stores by age group.

Figure 2.
Carbon storage by source and age group.
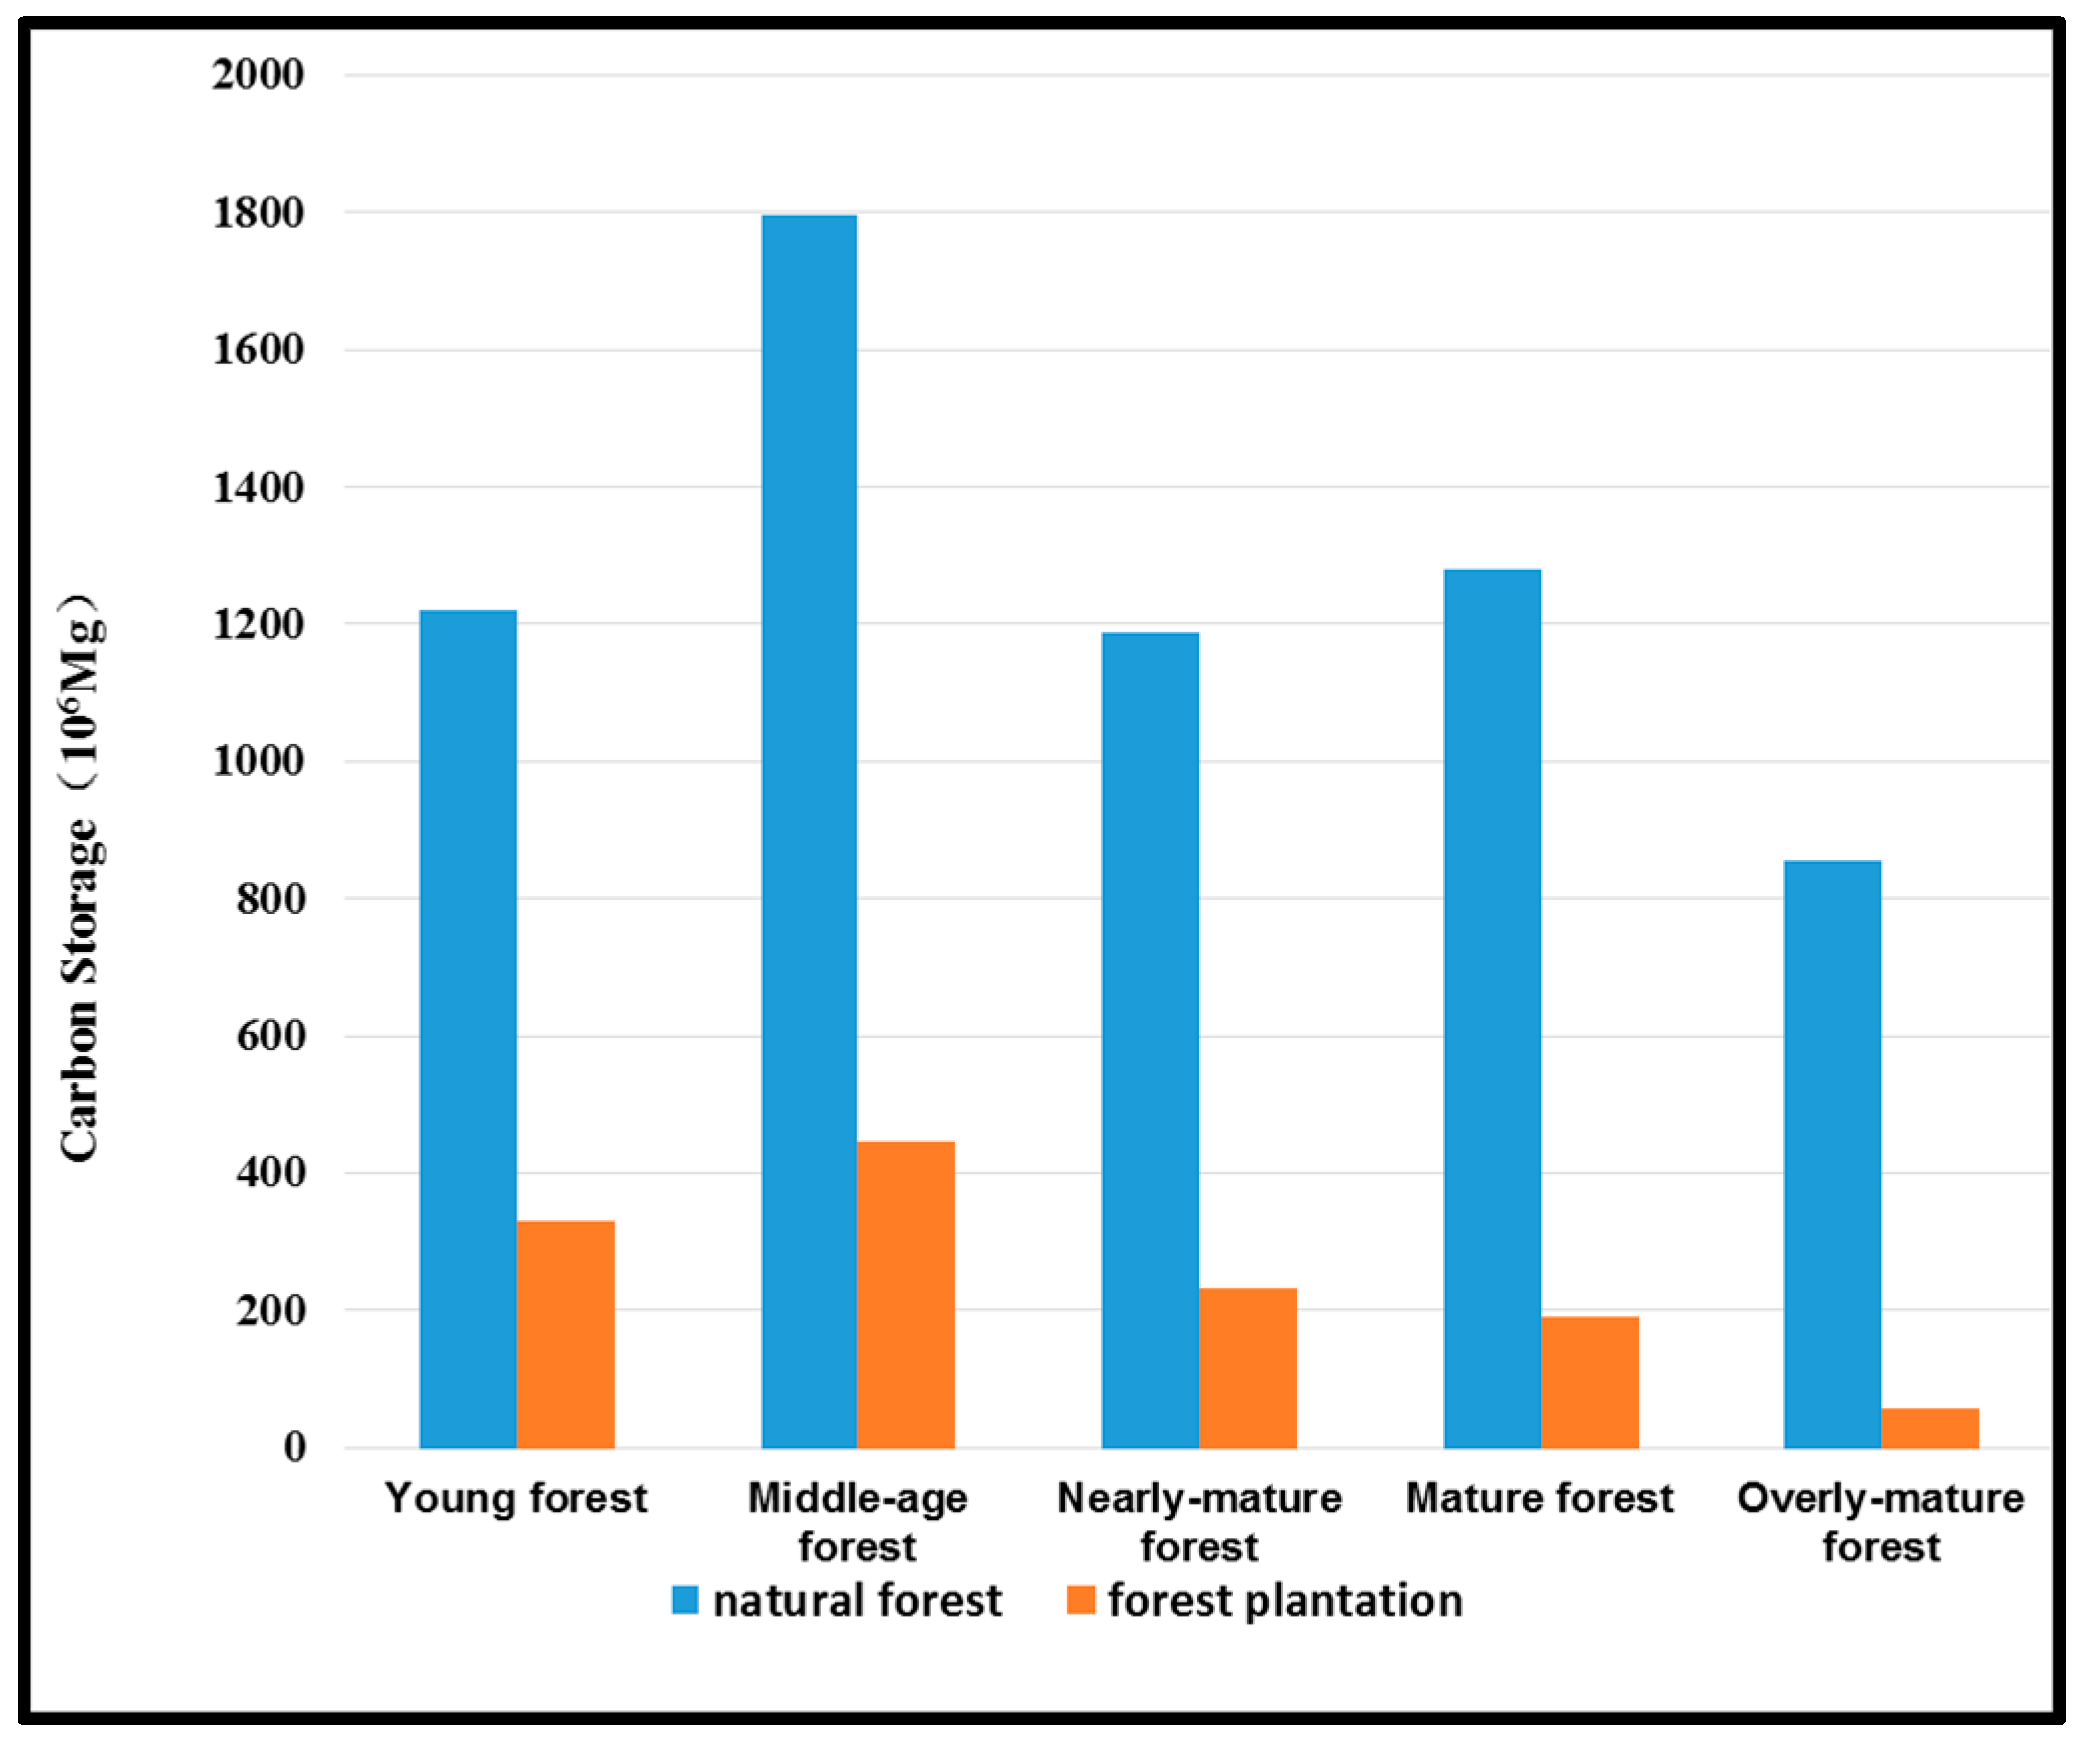
Figure 3.
Carbon density by source and age group.
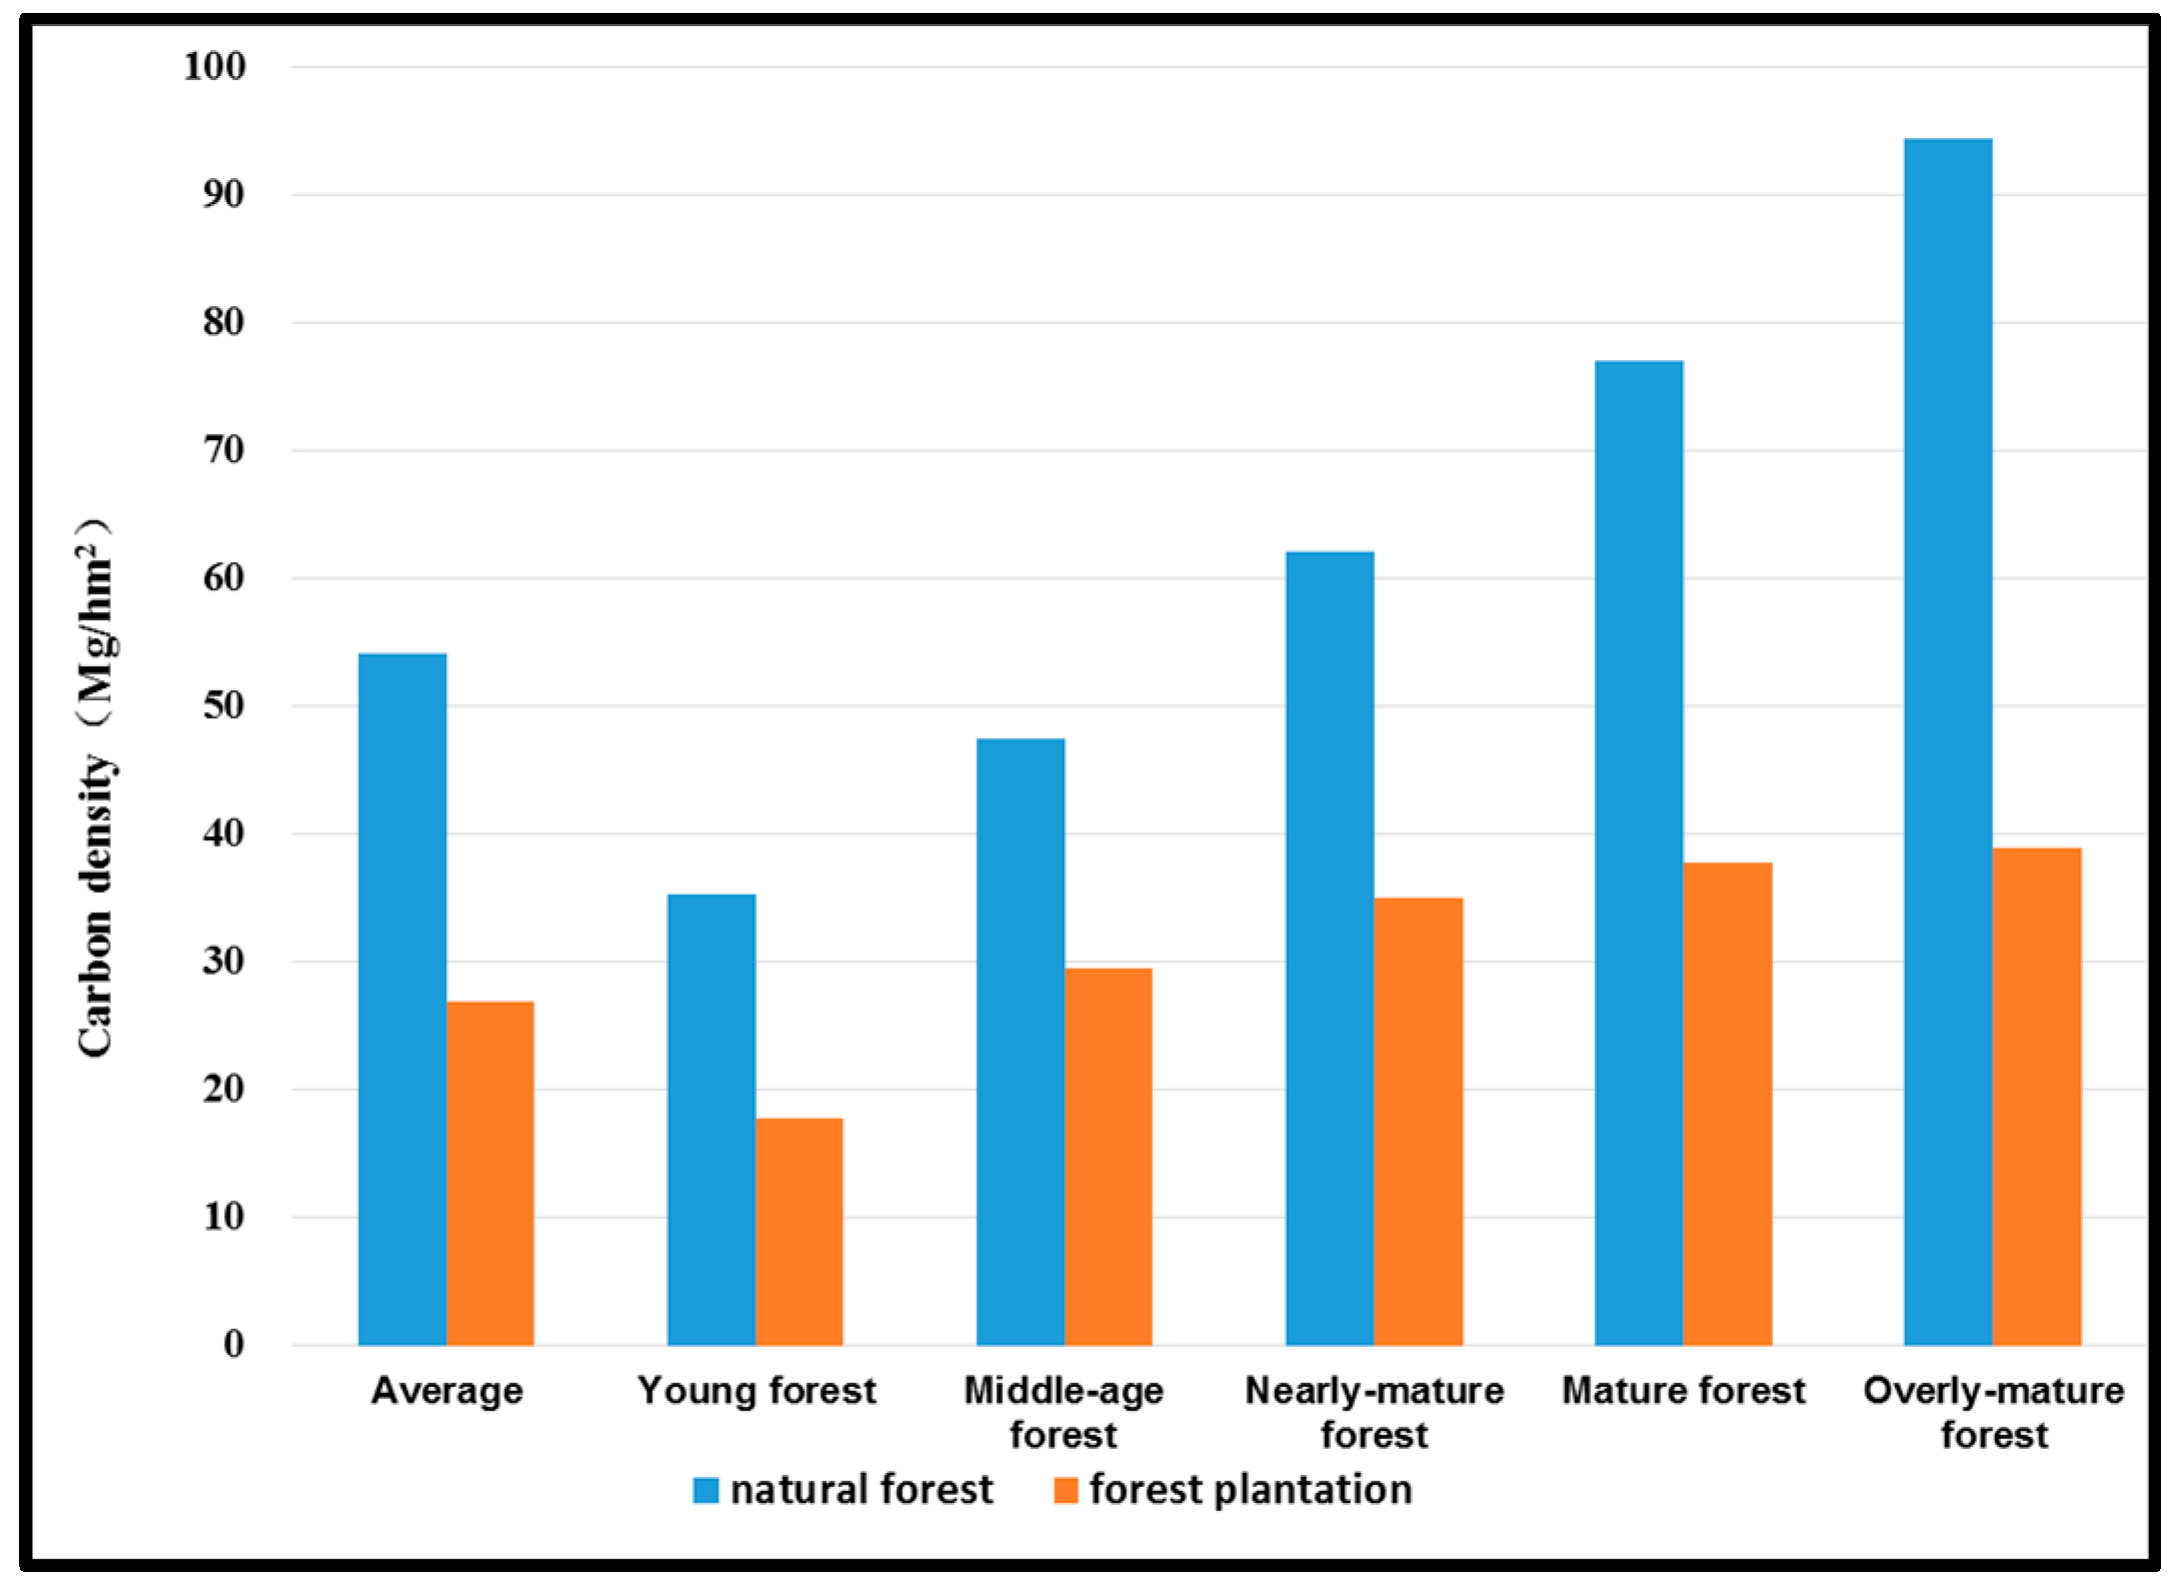
Figure 4.
Species occupying more than 1% of China’s total arboreal forest area. Subfigures (a–d) are occupied area, biomass, carbon stock and carbon density of these species, respectively.
Figure 4.
Species occupying more than 1% of China’s total arboreal forest area. Subfigures (a–d) are occupied area, biomass, carbon stock and carbon density of these species, respectively.
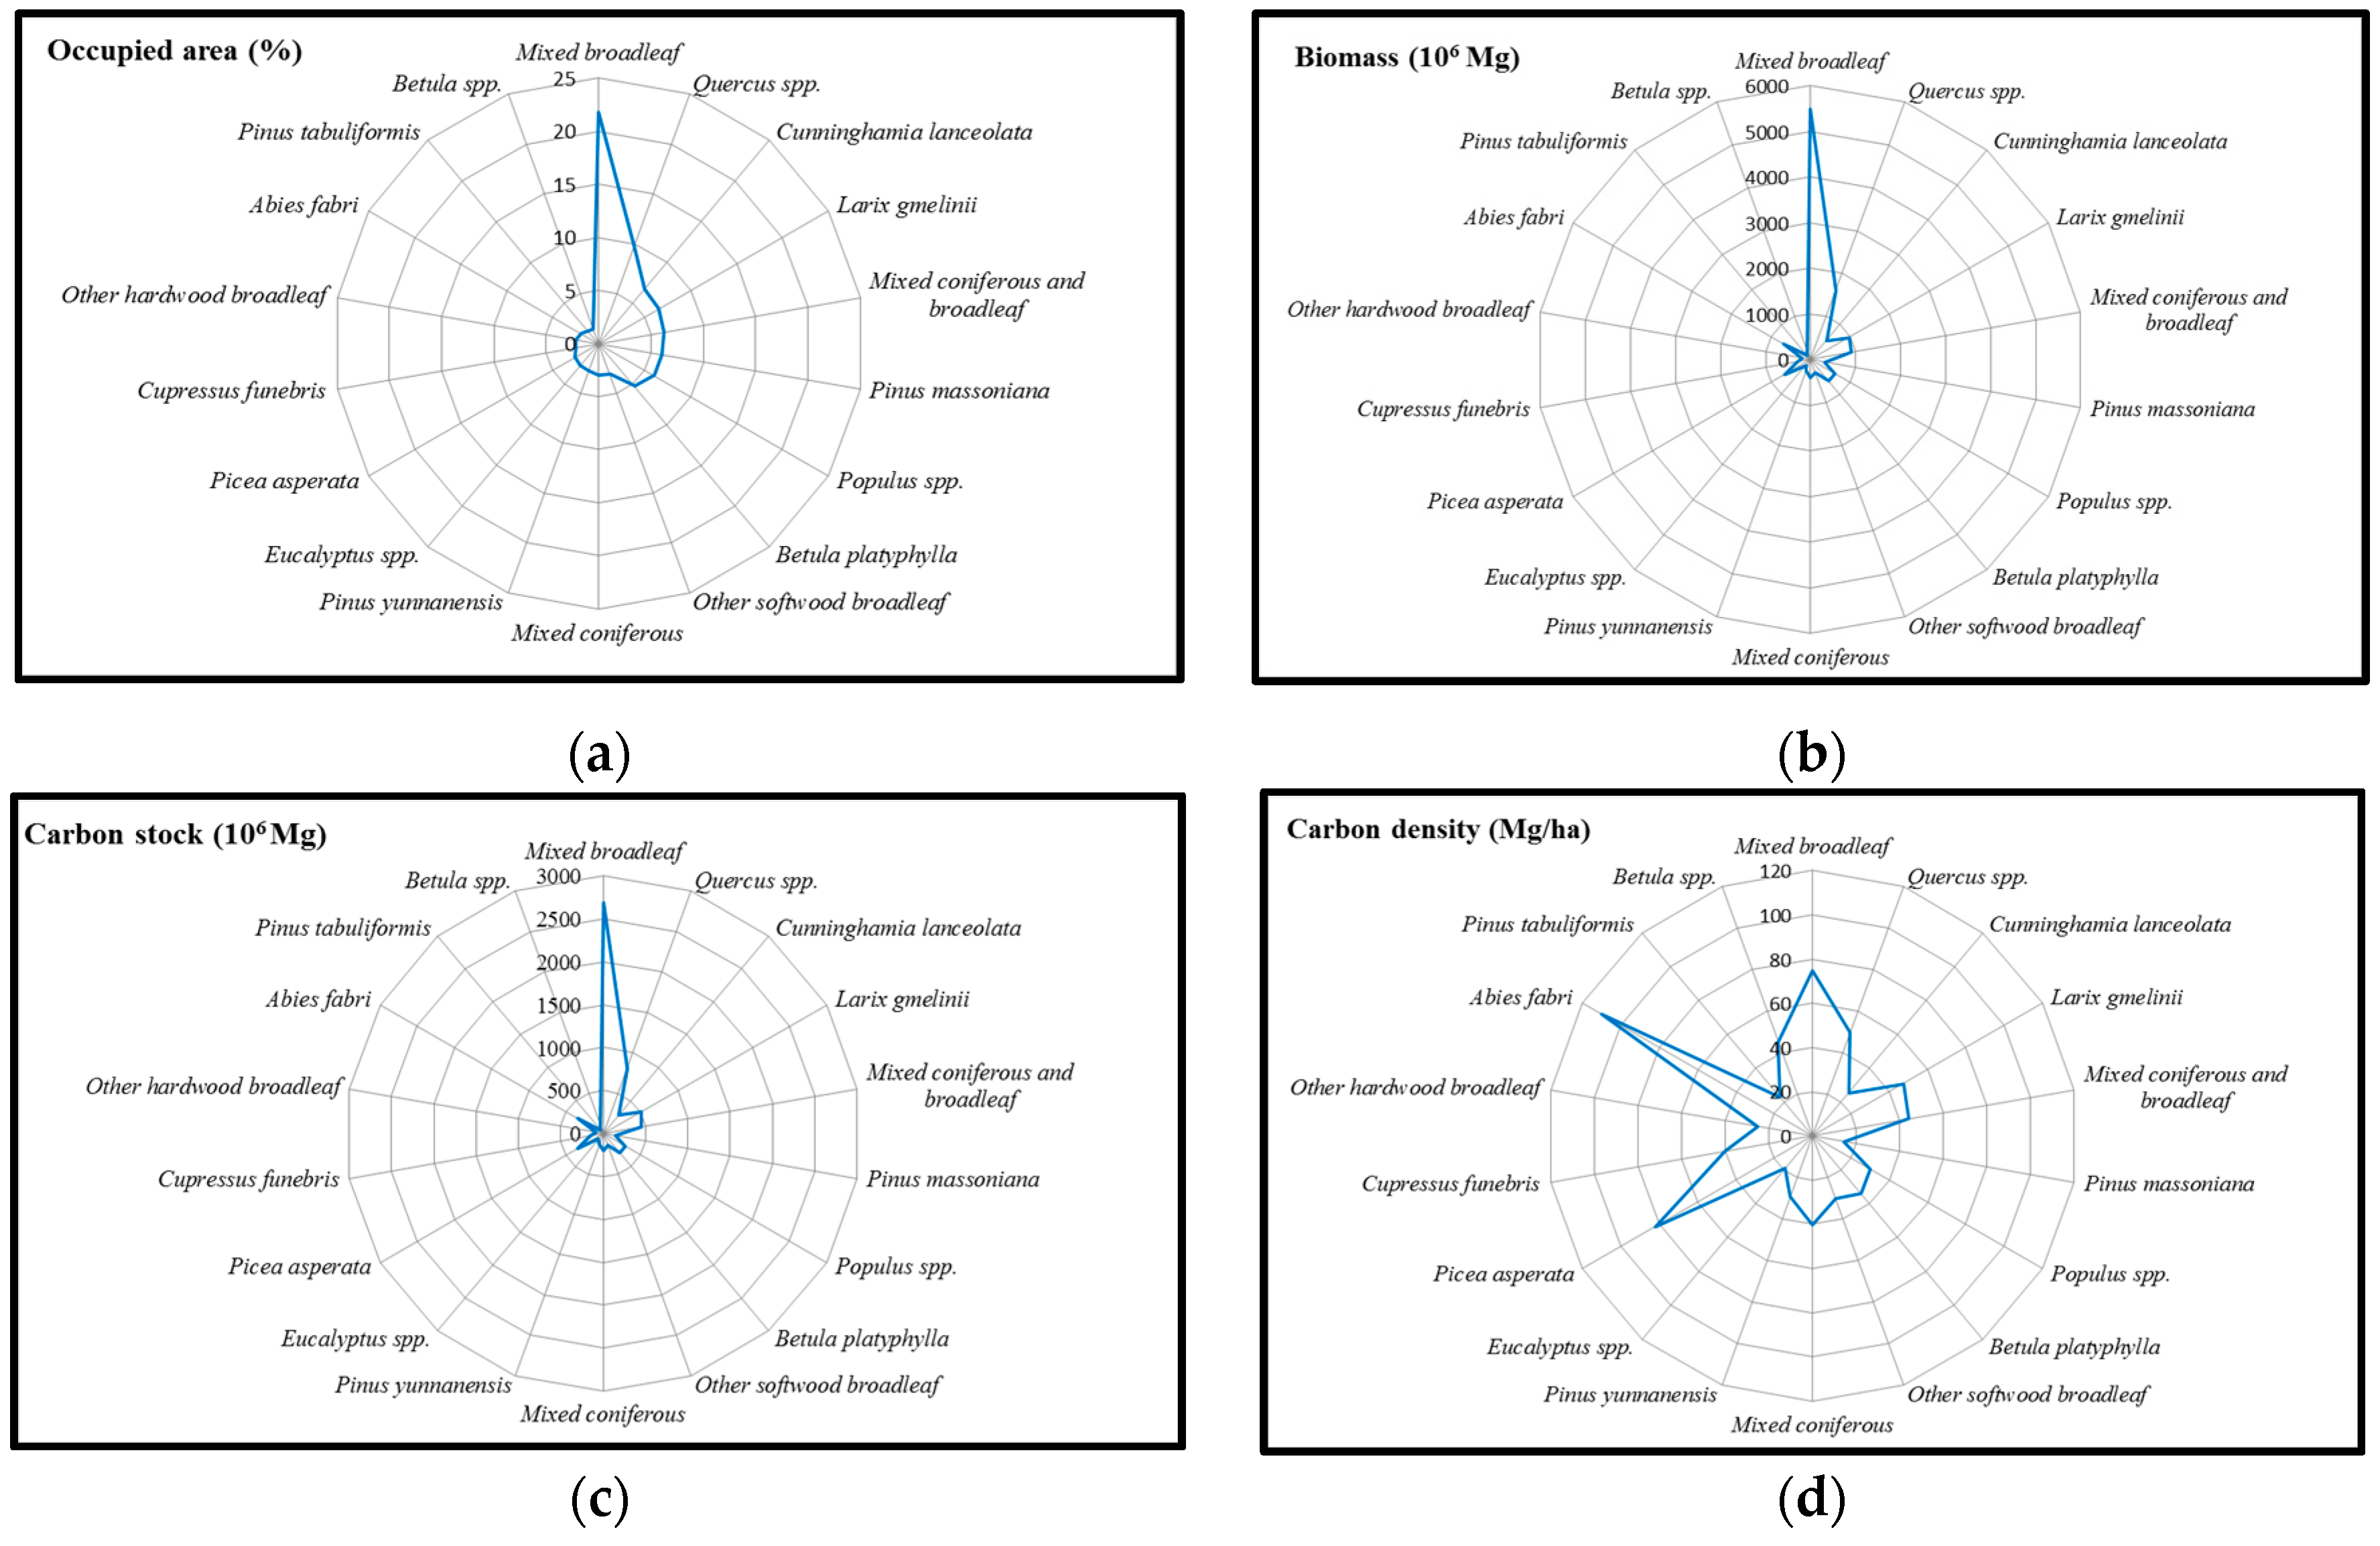
Figure 5.
Species with carbon densities greater than the national average that occupy <1% of total arboreal forest area. Subfigures (a–d) are occupied area, biomass, carbon stock and carbon density of these species, respectively.
Figure 5.
Species with carbon densities greater than the national average that occupy <1% of total arboreal forest area. Subfigures (a–d) are occupied area, biomass, carbon stock and carbon density of these species, respectively.
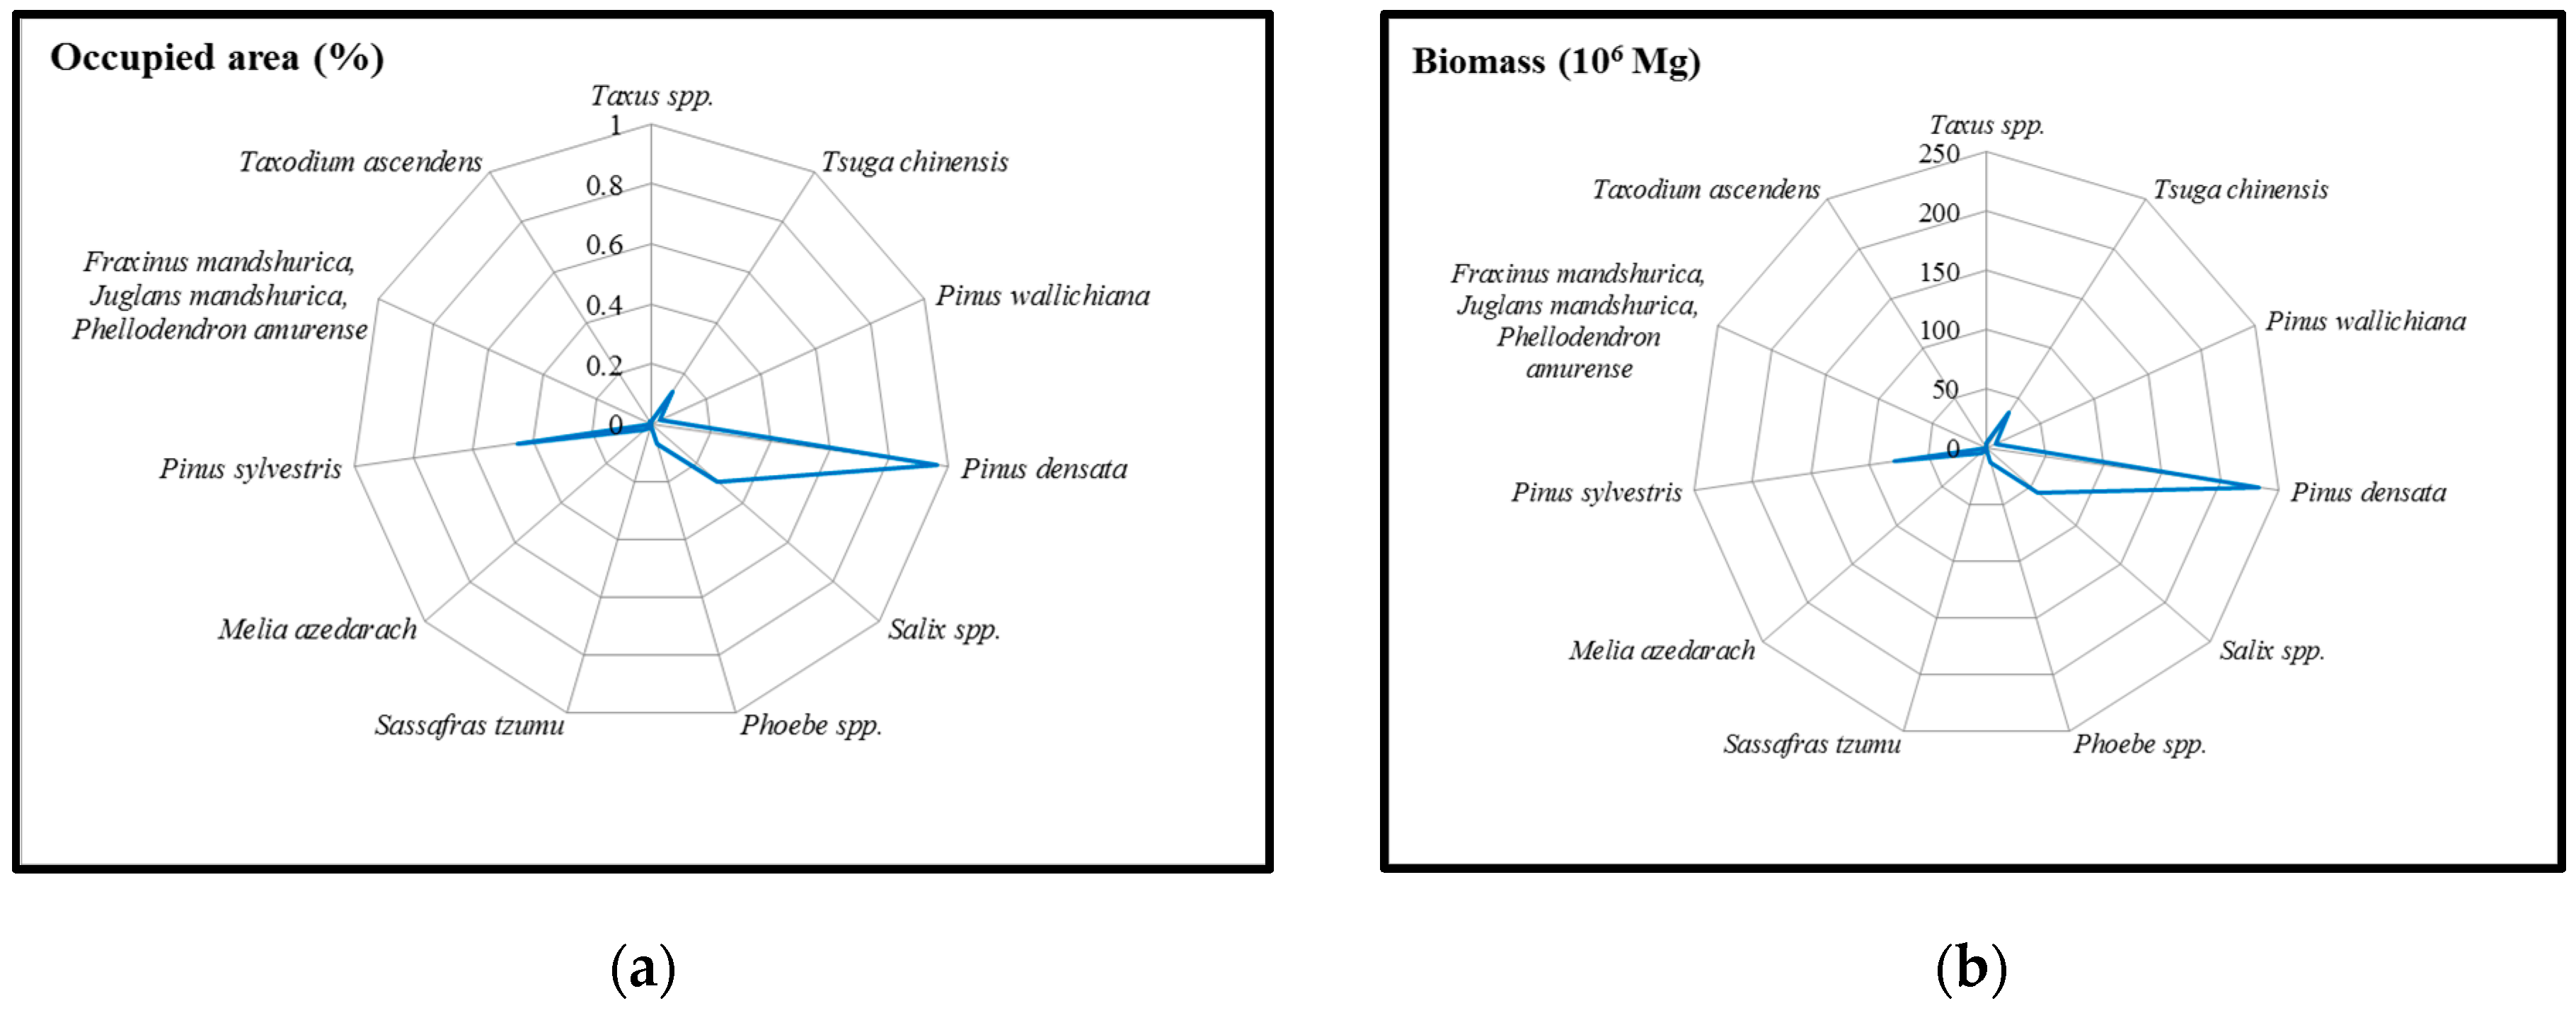

Figure 6.
(a) Geographical distribution of carbon stores in China’s arboreal forests; (b) Geographical distribution of carbon density in China’s arboreal forests.
Figure 6.
(a) Geographical distribution of carbon stores in China’s arboreal forests; (b) Geographical distribution of carbon density in China’s arboreal forests.

Figure 7.
(a) Arboreal forest carbon store statistics by province; (b) Arboreal forest carbon density statistics by province.
Figure 7.
(a) Arboreal forest carbon store statistics by province; (b) Arboreal forest carbon density statistics by province.
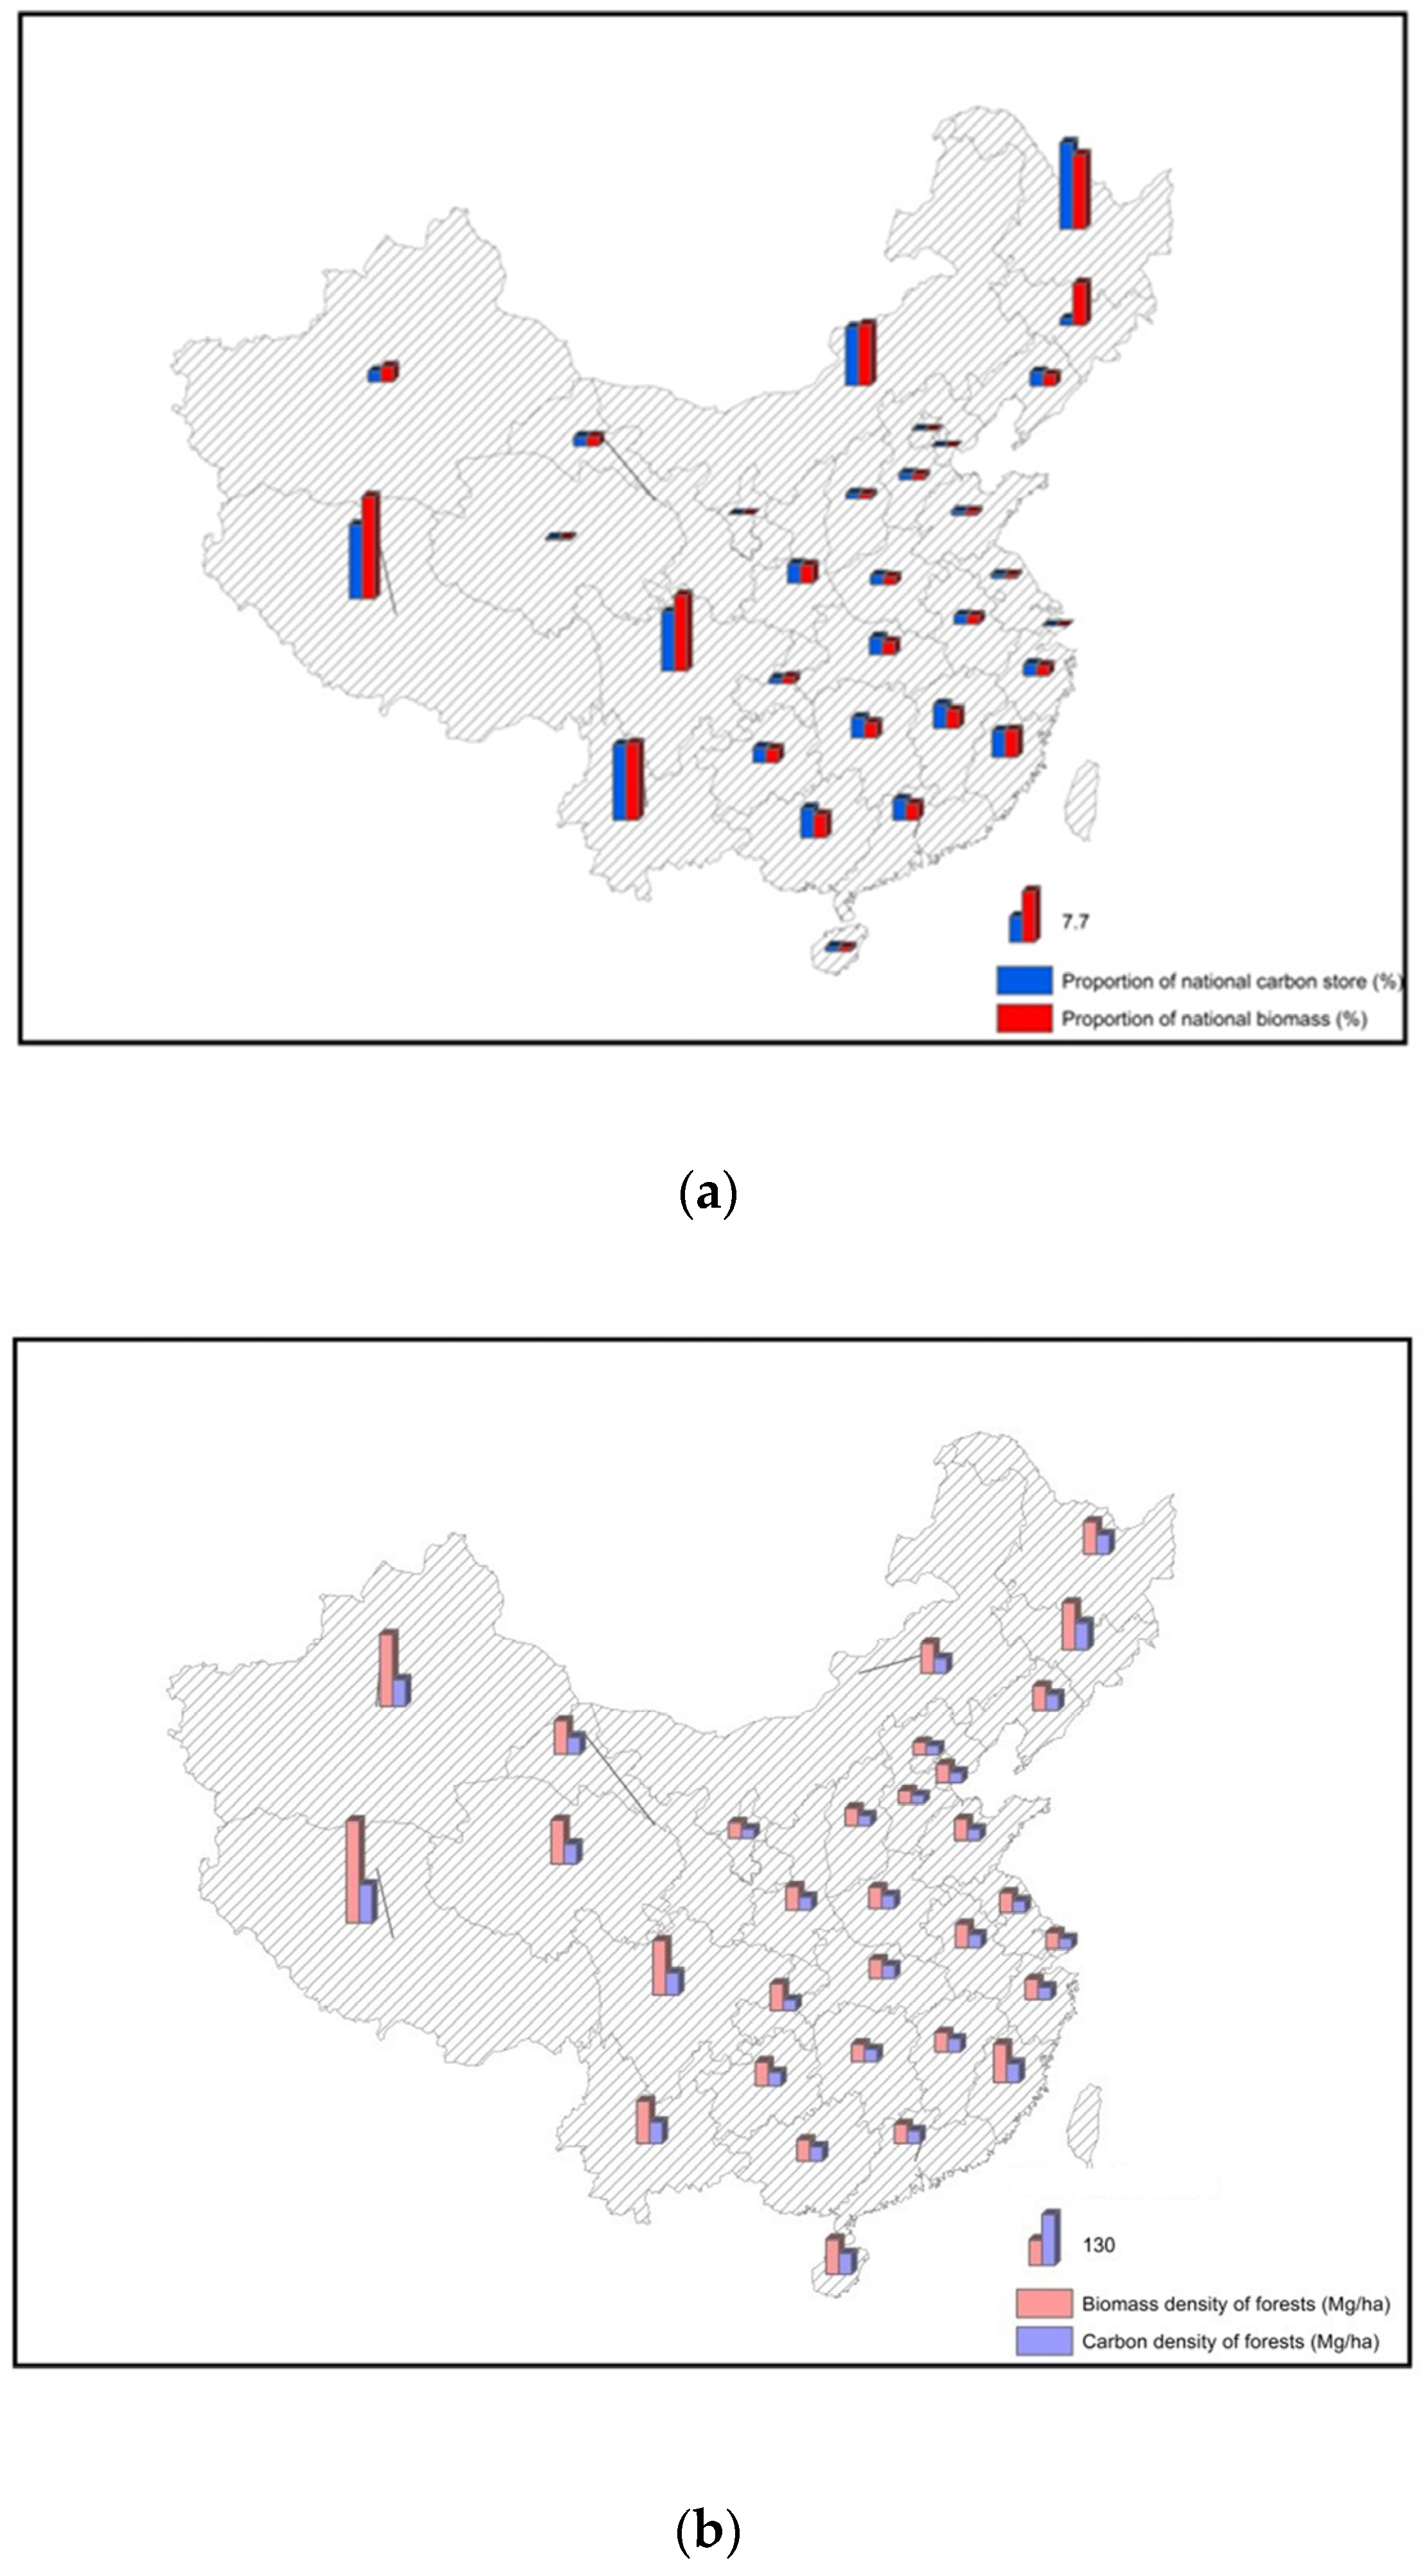
Figure 8.
The variation of carbon density of arboreal forest in the provinces.


Table 1.
Biomass expansion formula parameters and carbon factors for the principal tree species in China’s arboreal forests.
Table 1.
Biomass expansion formula parameters and carbon factors for the principal tree species in China’s arboreal forests.
| No. | Tree Species | Biomass Expansion Formula Parameters | Cellulose Content (%) | Hemicellulose Content (%) | Lignin Content (%) | Carbon Factor | |
|---|---|---|---|---|---|---|---|
| a | |||||||
| 1 | Quercus spp. | 1.1453 | 8.5473 | 44.91 | 26.89 | 21.72 | 0.5004 |
| 2 | Pinus sylvestris | 1.0945 | 2.004 | 55.34 | 11.7 | 27.15 | 0.5223 |
| 3 | Pinus densiflora | 1.0945 | 2.004 | 50.19 | 21.62 | 23.45 | 0.5141 |
| 4 | Betula spp. | 1.0687 | 10.237 | 41.82 | 30.37 | 20.37 | 0.4914 |
| 5 | Phoebe spp. | 1.0357 | 8.0591 | 48.79 | 21.88 | 22.71 | 0.503 |
| 6 | Cinnamomum camphora | 1.0357 | 8.0591 | 47.46 | 23.41 | 21.2 | 0.4916 |
| 7 | Paulownia spp. | 0.8956 | 0.0048 | 44.30 | 21.32 | 21.37 | 0.4695 |
| 8 | Ulmus pumila | 0.8918 | 28.441 | - | - | - | - |
| 9 | Eucalyptus spp. | 0.8873 | 4.5539 | 40.33 | 20.65 | 30.68 | 0.5253 |
| 10 | Mixed coniferous and broadleaf | 0.8136 | 18.466 | - | - | - | 0.4978 |
| 11 | Fraxinus mandshurica, Juglans mandshurica, Phellodendron amurense | 0.798 | 0.42 | - | - | - | 0.4827 |
| 12 | Tilia spp. | 0.798 | 0.42 | 41.84 | 23.52 | 17.81 | 0.4392 |
| 13 | Robinia pseudoacacia and miscellaneous broadleaf hardwoods | 0.7564 | 8.3103 | - | - | - | 0.4834 |
| 14 | Pinus tabuliformis | 0.7554 | 5.0928 | 55.32 | 11.94 | 26.83 | 0.5207 |
| 15 | Casuarina equisetifolia | 0.7441 | 3.2377 | 42.55 | 17.94 | 27.66 | 0.498 |
| 16 | Mixed broadleaf | 0.6255 | 91.0013 | 0.49 | |||
| 17 | Sassafras tzumu | 0.6255 | 91.0013 | 42.91 | 22.08 | 23.57 | 0.4848 |
| 18 | Cupressus funebris | 0.6129 | 46.1451 | 50.13 | 7.72 | 29.87 | 0.5034 |
| 19 | Larix gmelinii | 0.6096 | 33.806 | 52.63 | 15.33 | 26.46 | 0.5211 |
| 20 | Pinus armandii | 0.5856 | 18.7435 | 56.17 | 19.63 | 22.34 | 0.5225 |
| 21 | Pinus koraiensis | 0.5185 | 18.22 | 53.98 | 13.48 | 25.56 | 0.5113 |
| 22 | Pinus thunbergii | 0.5168 | 33.2378 | 52.09 | 11.46 | 28.10 | 0.5146 |
| 23 | Mixed coniferous | 0.5168 | 33.2378 | - | - | - | 0.5101 |
| 24 | Metasequoia glyptostroboides | 0.5168 | 33.2378 | 42.19 | 9.05 | 32.92 | 0.5013 |
| 25 | Pinus densata | 0.5168 | 33.2378 | 47.26 | 13.99 | 27.65 | 0.5009 |
| 26 | Pinus hwangshanensis, Pinus taiwanensis, Pinus wallichiana, Pinus griffithii | 0.5168 | 33.2378 | - | - | - | 0.5 |
| 27 | Pinus yunnanensis | 0.5101 | 1.0451 | 49.89 | 11.42 | 28.91 | 0.5113 |
| 28 | Pinus massoniana | 0.5101 | 1.0451 | 43.45 | 10.09 | 26.84 | 0.4596 |
| 29 | Pinus kesiya | 0.5101 | 1.0451 | 50.91 | 25.74 | 22.18 | 0.224 |
| 30 | Populus spp., Acacia spp., broad-leaved softwood | 0.4754 | 30.6034 | 44.57 | 21.54 | 24.28 | 0.4956 |
| 31 | Picea asperata | 0.4642 | 47.499 | 58.96 | 8.14 | 26.98 | 0.5208 |
| 32 | Abies fabri | 0.4642 | 47.499 | 41.34 | 17.19 | 28.96 | 0.4999 |
| 33 | Cryptomeria japonica | 0.4158 | 41.3318 | 43.03 | 11.18 | 32.24 | 0.5235 |
| 34 | Tsuga chinensis | 0.4158 | 41.3318 | 44.96 | 9.79 | 31.13 | 0.5022 |
| 35 | Keteleeria fortunei | 0.4158 | 41.3318 | 55.13 | 7.7 | 26.73 | 0.4997 |
| 36 | Cunninghamia lanceolata | 0.3999 | 22.541 | 33.51 | 10.76 | 32.24 | 0.5201 |
Note: In the table, the data of the cellulose, hemicellulose, and lignin contents refer to reference [33].
© 2017 by the authors. Licensee MDPI, Basel, Switzerland. This article is an open access article distributed under the terms and conditions of the Creative Commons Attribution (CC BY) license (http://creativecommons.org/licenses/by/4.0/).
Share and Cite
MDPI and ACS Style
Shao, W.; Cai, J.; Wu, H.; Liu, J.; Zhang, H.; Huang, H. An Assessment of Carbon Storage in China’s Arboreal Forests. Forests 2017, 8, 110. https://doi.org/10.3390/f8040110
AMA Style
Shao W, Cai J, Wu H, Liu J, Zhang H, Huang H. An Assessment of Carbon Storage in China’s Arboreal Forests. Forests. 2017; 8(4):110. https://doi.org/10.3390/f8040110
Chicago/Turabian StyleShao, Weiwei, Jingya Cai, Haibing Wu, Jiahong Liu, Haixing Zhang, and Hao Huang. 2017. "An Assessment of Carbon Storage in China’s Arboreal Forests" Forests 8, no. 4: 110. https://doi.org/10.3390/f8040110
Note that from the first issue of 2016, this journal uses article numbers instead of page numbers. See further details here.