Development of Sessile Oak and European Hornbeam Sprouts after Thinning
by
Zdeněk Adamec
1, 
Jan Kadavý
1,
Barbora Fedorová
1,*,
Robert Knott
2,
Michal Kneifl
1 and
Karel Drápela
1 1
Department of Forest Management and Applied Geoinformatics, Faculty of Forestry and Wood Technology, Mendel University in Brno, Zemědělská 3, 61300 Brno, Czech Republic
2
Department of Silviculture, Faculty of Forestry and Wood Technology, Mendel University in Brno, Zemědělská 3, 61300 Brno, Czech Republic
*
Author to whom correspondence should be addressed.
Forests 2017, 8(9), 308; https://doi.org/10.3390/f8090308
Submission received: 27 July 2017
/
Revised: 18 August 2017
/
Accepted: 22 August 2017
/
Published: 24 August 2017
Abstract
:We observed the growth of juvenile sprouts at stool level in an oak-hornbeam selective coppice after selective thinning. We tested the relations of sprouting probability, number and height of new sprouts, and stool biometric characteristics with thinning intensity and light conditions. We compared the results between the two species. The sprouting probability, number of new sprouts, and height of new sprouts were modelled using different types of regression (logistic, generalized linear, and multiple linear regression) evaluated from 84 sessile oak (Quercus petraea Matt. Liebl.) and 139 European hornbeam (Carpinus betulus L.) stools with the same site conditions. There were no significant relations between sprouting probability and the tested parameters because nearly all stools re-sprouted. The growth (number and height) of new sprouts depended on the stool basal area before thinning and on thinning intensity. Light conditions (indirect site factor) only influenced the number of new European hornbeam sprouts in 2016 and the height of new sessile oak sprouts. The number of new sprouts in European hornbeam was higher than in sessile oak.
1. Introduction
Coppicing has recently become more popular, as it provides a renewable source of energy (biomass and firewood), promotes higher biodiversity, and provides an adaptation of forest management to climate change [1,2,3].
Several coppice management systems may be distinguished, such as (a) traditional coppice forests; (b) coppice-with-standards forests; (c) short-rotation coppice forests; (d) ‘high coppice’ forests; (e) coppice forests for transformation and reconstruction; (f) pollarding/grazing forests; (g) selective coppice forests; and (h) shelterbelts [4,5]. In this study, we focus on selective coppice forests.
Selective coppicing has been used in several European countries and was established in Sweden for Betula pendula Roth, Betula pubescens Ehrh., and Populus tremula L. [6]; in Italy for beech [7]; in Spain for Arbutus unedo L. [8] and for Quercus ilex L. and Quercus cerris Wilk. & Costa [9]; and in France for Quercus ilex [10,11]. Our pilot project tested whether a selective approach applied to coppicing in the Czech Republic could be used under the current conditions for Quercus petraea Matt. Liebl. (sessile oak) and Carpinus betulus L. (European hornbeam). There are no recent results for selective coppicing in Central Europe. In the selective coppice system, sprouts of different ages are present on the same stool, for which the individual approach is considered as the most appropriate measure. During the rotation period—between eight and 12 years—the largest and the oldest sprouts are cut, and smaller sprouts are lightly thinned [7]. Another definition describes selective coppicing as a strategy in which trees are cut when they reach a certain height, resulting in an uneven aged structure, which favours shade tolerant species [4]. Sprouts that remain after thinning are called retained sprouts, and the new generation that emerges after thinning is called the new sprouts. In comparison with this management system, traditional coppice means that sprouts on one stool are of the same age. At the end of the rotation period, all sprouts in the stool are harvested. Low thinning or thinning from below consists of the removal of suppressed and sub-dominant trees of a small diameter cut primarily from the lower part of the canopy. The goals of such low thinning are to remove competing smaller trees and to establish better conditions (more light, water, and nutrients) for the growth of larger trees [12]. The removal of mature stools (stools that consist of individual sprouts) and the consequent formation of secondary cutting surfaces encourage re-sprouting [13] and result in a more uneven-aged stand structure [14]. Early selective thinning can improve future sprout value and quality without compromising the stand stability or long-term financial viability [15]. Selective thinning may therefore be more attractive in urban forests [6].
Sessile oak, as a light-demanding tree species during early development, is considered moderately shade tolerant [16]. Sessile oak represents the main tree species in the uplands of the Czech Republic. European hornbeam is more shade tolerant and is more competitive with light-demanding species [17].
Our aim in the present study was to describe the growth of new sprouts in oak-hornbeam coppices during the first two years after selective low thinning. Together with light measurements, the results may be considered unique in the Czech Republic. We tested whether the sprouting probability and number and height of new sprouts were related to stool biometric parameters: basal area of the stool before and after thinning, leaf area index, etc. (1); thinning intensity (2); and light conditions (3). We also compared the results between the two species (4).
2. Materials and Methods
2.1. Study Area
The pilot project for selective coppicing (or uneven-aged coppicing) was established in Drahanská vrchovina in the southeast region of the Czech Republic, in the Training Forest Enterprise Masaryk Forest Křtiny, 323 m a.s.l. Predominant soil types are cambisols on a granodiorite bedrock. The dominant tree species are sessile oak and European hornbeam.
The pilot project was established at the beginning of the growing season in 2008, where the clear-cut was applied in the winter of 2008/2009. The sample plot was rectangular (125 m × 40 m), covering 5000 m2 in total.
During the 2014/2015 winter, at a stand age of seven years, thinning from below was applied to 50 % of the sample plot (2500 m2). The thinning intensity ranged between 6% and 83%. The weakest sprouts were cut, and one to four dominant sprouts per stool were left.
The positions of all stools were recorded, along with the stool basal area before (BAbt) and after (BAat) thinning, and the basal area of harvested sprouts (BAt) was measured at the height of stump level. The thinning intensity (It), defined as the removed proportion of the total stool basal area, was computed from measured variables. The probability of stump sprouting, the number of live and dead new sprouts, and the height of the tallest new sprouts were recorded for both tree species after selective thinning. The sprouting probability was determined by logistic regression due to its suitability for modelling binary data (e.g., “occurrence” and “absence”) [18]. In our data, “occurrence” was defined as at least one live new sprout, and “absence” was defined as the absence of any new live sprouts. In total, we analysed 84 sessile oak and 139 European hornbeam stools at this site.
The potential solar radiation below the canopy was evaluated by the analysis of hemispherical photographs taken in the centre of each stool 1 m above the ground using a Canon EOS 60D camera (Canon Inc., Tokyo, Japan) with a Sigma (4.5 mm) fisheye lens (Sigma corporation, Kanagawa, Japan) during the middle of the growing season after the thinning. The camera was levelled horizontally and oriented towards magnetic north using a compass. Photos were taken under standard overcast conditions early in the day. All images were analysed with WinScanopy software (version Pro 2012, Regent Instruments Inc., Québec, QC, Canada). The following data were used: gap fraction (GF), openness (OP), leaf area index (LAI) from the Licor LAI2000 using the generalized linear method, direct site factor (DSF), indirect site factor (ISF), and total site factor (TSF). Basic information concerning the measured data is listed in Table 1 and Table 2.
2.2. Data Analysis
Three types of models were built for an evaluation of the relationships between analysed variables:
- the sprouting probability model constructed using logistic regression (LR);
- the number of new sprouts model, which used a generalized linear model (GLM) with a Poisson distribution (live new sprouts) or with a zero inflated Poisson distribution (ZIP) (dead new sprouts);
- and the height model of new sprouts assembled by using multiple linear regression (MLR).
The logistic regression model of stump sprouting probability uses a binomial distribution with a logit-link function of the response variable. The significance of the model parameters was verified by the Wald statistic, and model significance was provided by the χ2 test of maximum log-likelihood. The sprouting probability model is expressed by the equation:
pit—modelled probability of stump sprouting; β0, β1, β2, …βj—estimated parameters of the model; and X1it, X2it, …Xjit—explanatory variables j of subject stool i in year t.
As the number of live new sprouts is a discrete variable, the dependent variable of the model follows a Poisson distribution with a log-link function. The model of live new sprouts could be expressed by the following equations:
where
E(Yit)—mean value of the distribution (fitted count) of the number of live new sprouts of the subject stool i in year t; μit—modelled mean for the Poisson count data; β0, β1, β2, …βj—estimated parameters of the model; and X1it, X2it, …Xjit—explanatory variables j of subject stool i in year t.
In the case of dead new sprouts, there were two sets of data. Count data (with true zeros—at stool level, there were only live sprouts (number of dead new sprouts was 0 = true zero) throughout the duration of the experiment), which are distributed as a Poisson with a log-link function, and false zero data (for example, a mistake by an observer who did not see any dead sprouts even though they were present or a dead sprout that broke off before counting), which have a binomial distribution with a logit-link function. For more information about true and false zero data, see [19]. The model for dead new sprouts thus has the equations [19]:
where
and
E(Yit)—mean value of distribution (fitted count) of the number of dead new sprouts of the subject stool i in year t; μit—modelled mean for the Poisson count data; πit—modelled probability of false zeros for the binomial distribution; β0, β1, β2, …βj, γ0, γ1, γ2 … γj—estimated parameters of the model; and X1it, X2it, …Xjit—explanatory variables j of subject stool i in year t.
The significance of the model parameters of the number of new sprouts was tested by a z-test and the overall model significance by the likelihood ratio χ2 test.
The model for the heights of new sprouts assumed a normal distribution (with an identity link function) of the dependent variable. The significance of the model parameters was tested by a t-test and the overall model significance by the F-test. The model can be expressed by the equation:
E(Yit)—mean value of distribution (fitted height) of the height of the new sprouts of the subject stool i in year t; β0, β1, β2, …βj—estimated parameters of the model; and X1it, X2it, Xjit—explanatory variables j of subject stool i in year t.
All models were constructed for both species and years separately. Models were developed for each biometric variable concerning the state of the stools before and after thinning and for each variable characterizing the light conditions of the stools (Table 1). Forward stepwise regression was used for the selection of the best model based on the combination of tested variables. Goodness of fit characteristics of models based on each variable and the best combinations of variables according to stepwise regression for each model are shown in Tables S1–S4. Akaike’s Information Criterion (AIC) [20], coefficient of determination (R2) for the MLR model, and pseudo R2 [21] for LR and GLM models were used as goodness of fit criteria. A statistically better model was chosen such that the value of AIC was seven to 10 units less than the comparison model [22] and according to the likelihood ratio test in the comparison of GLM models. All statistical analyses were performed using the software package R [23] and tested at a significance level α = 0.05.
3. Results
3.1. Probability of Stump Sprouting
The fitted models of stump sprouting probability for sessile oak and European hornbeam were not statistically significant for the tested biometric variables and their combinations for either studied year (all tested models had p values > 0.05). This was because in 2015, 96.4% of sessile oak stumps re-sprouted, and only three stumps had no sprouts. The re-sprouting of European hornbeam stumps was 100% in the same year. In 2016, 100% of stumps of both studied species re-sprouted. We may thus conclude that the stump sprouting probabilities of sessile oak and European hornbeam did not depend on the tested variables, and the probability of stump sprouting was essentially 100% (96.4% for sessile oak in year 2015) for both studied species under the given conditions.
3.2. Live New Sprouts
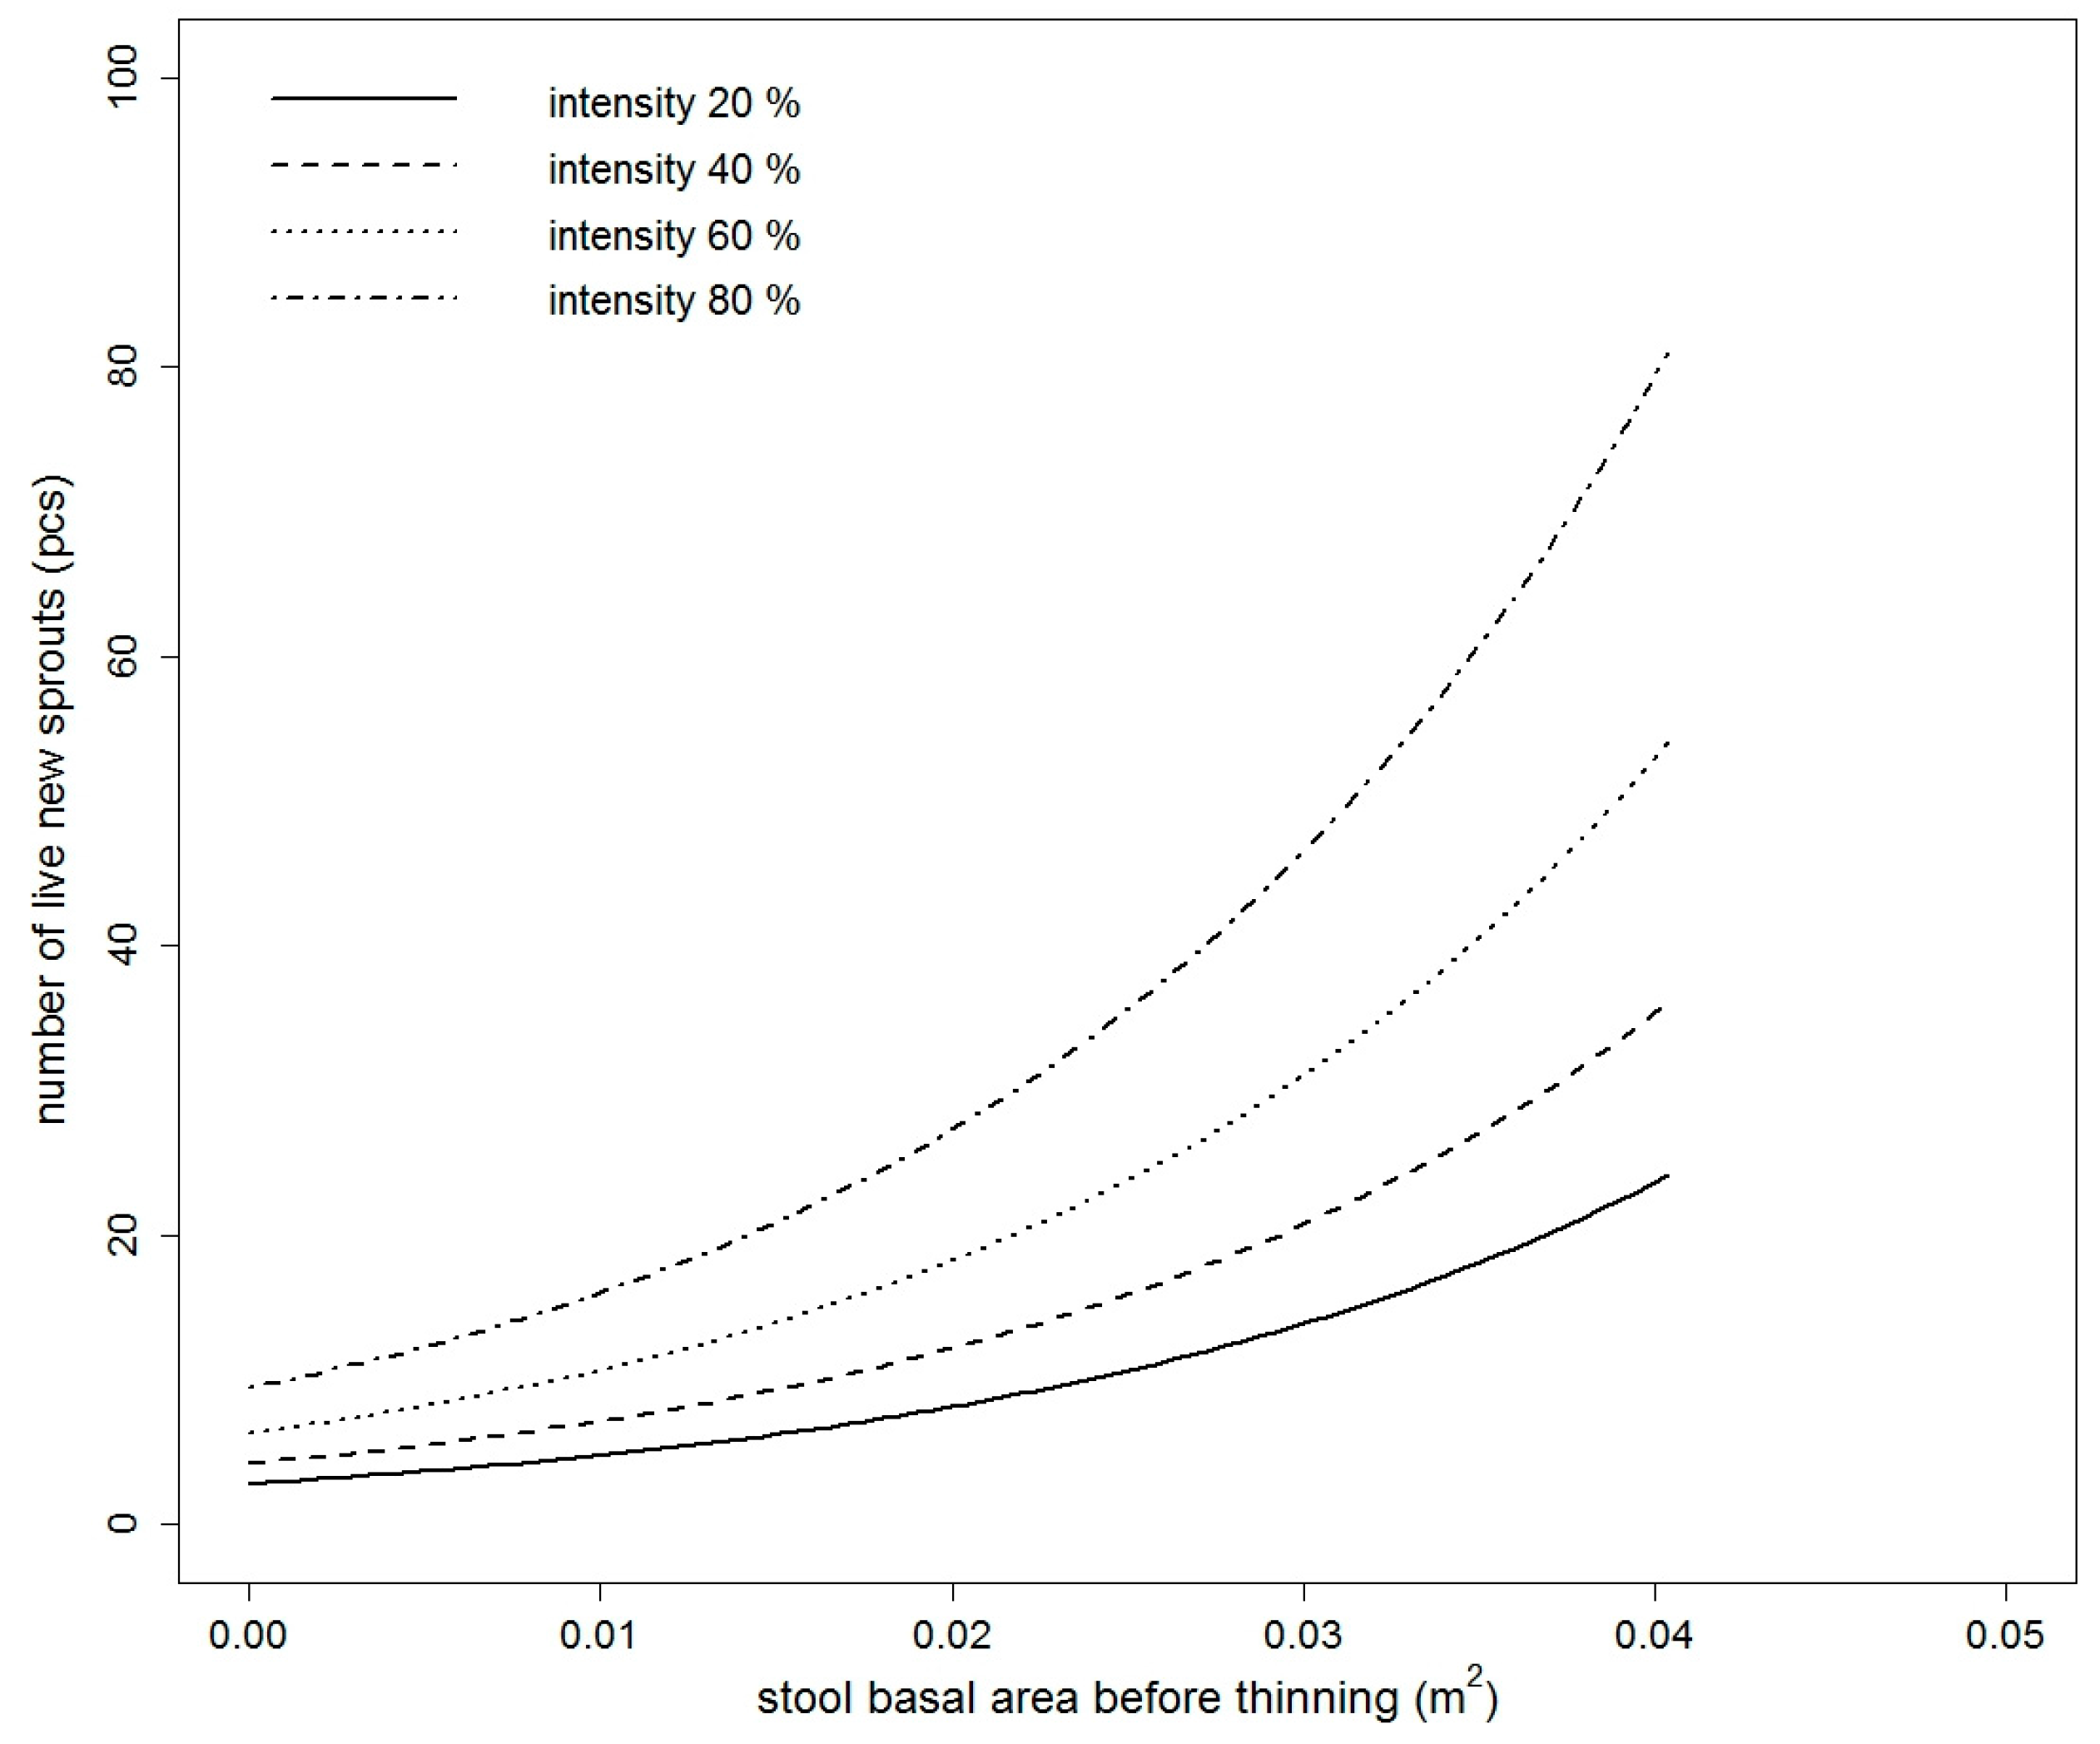
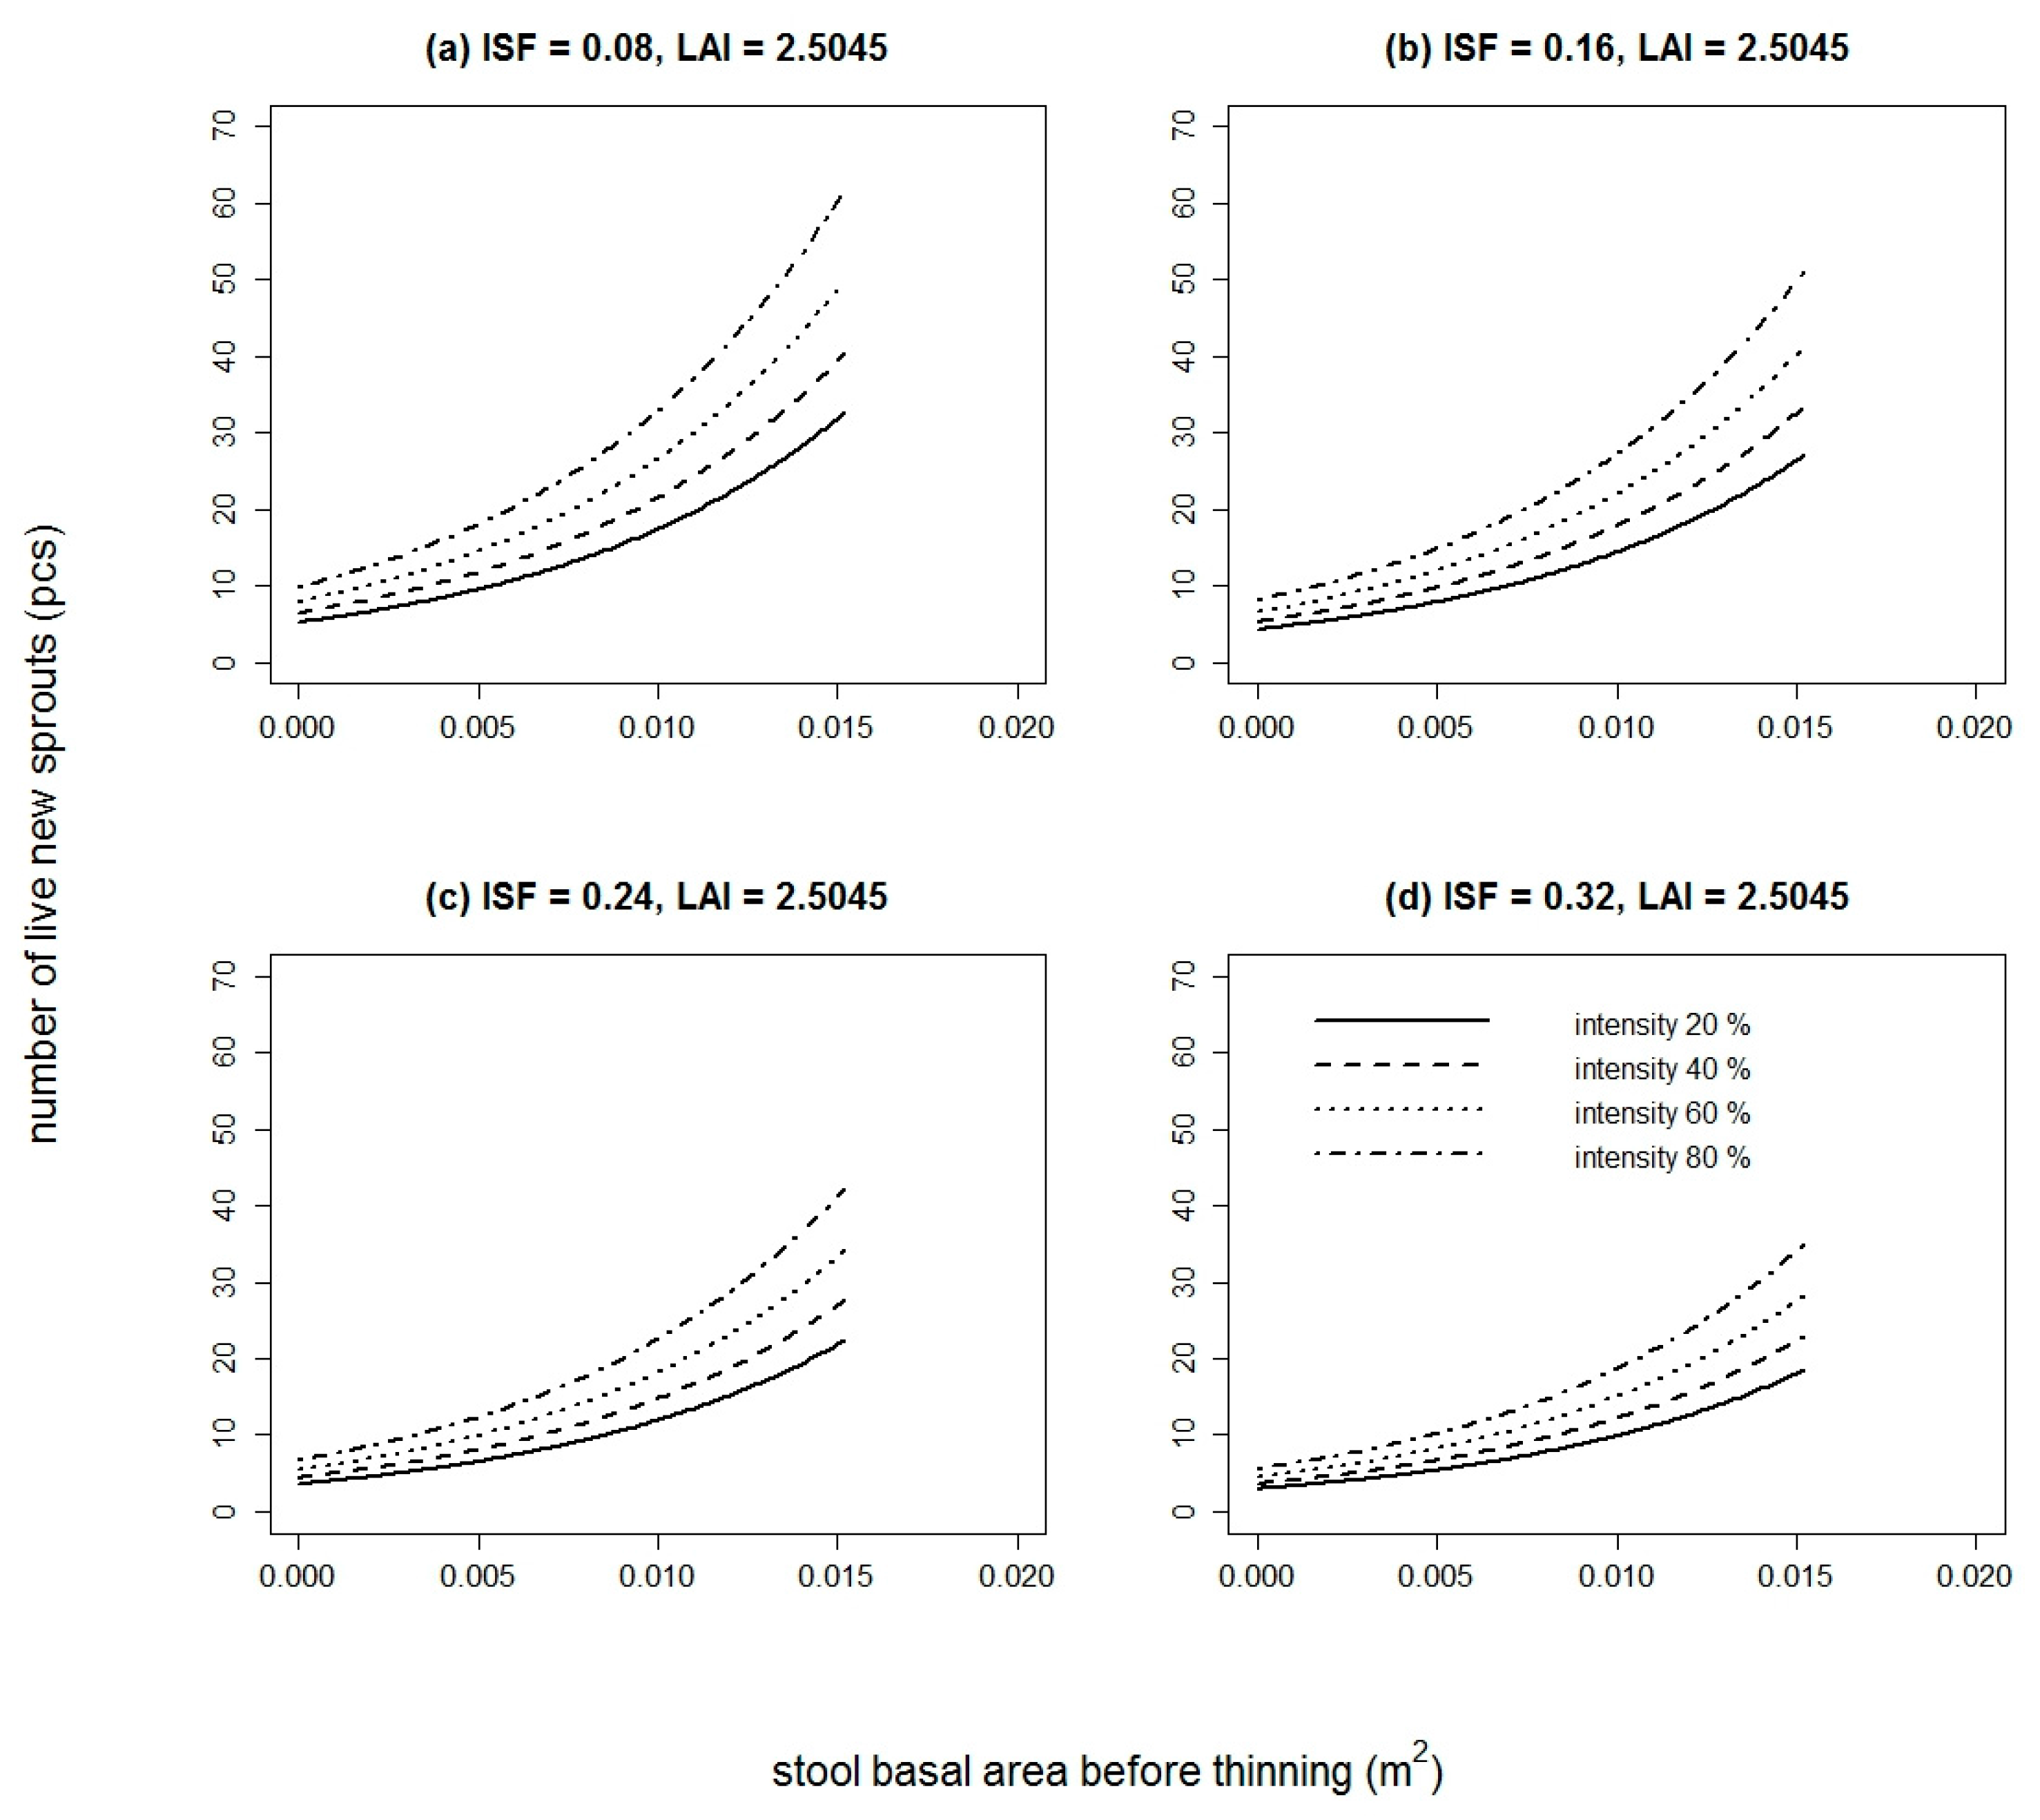
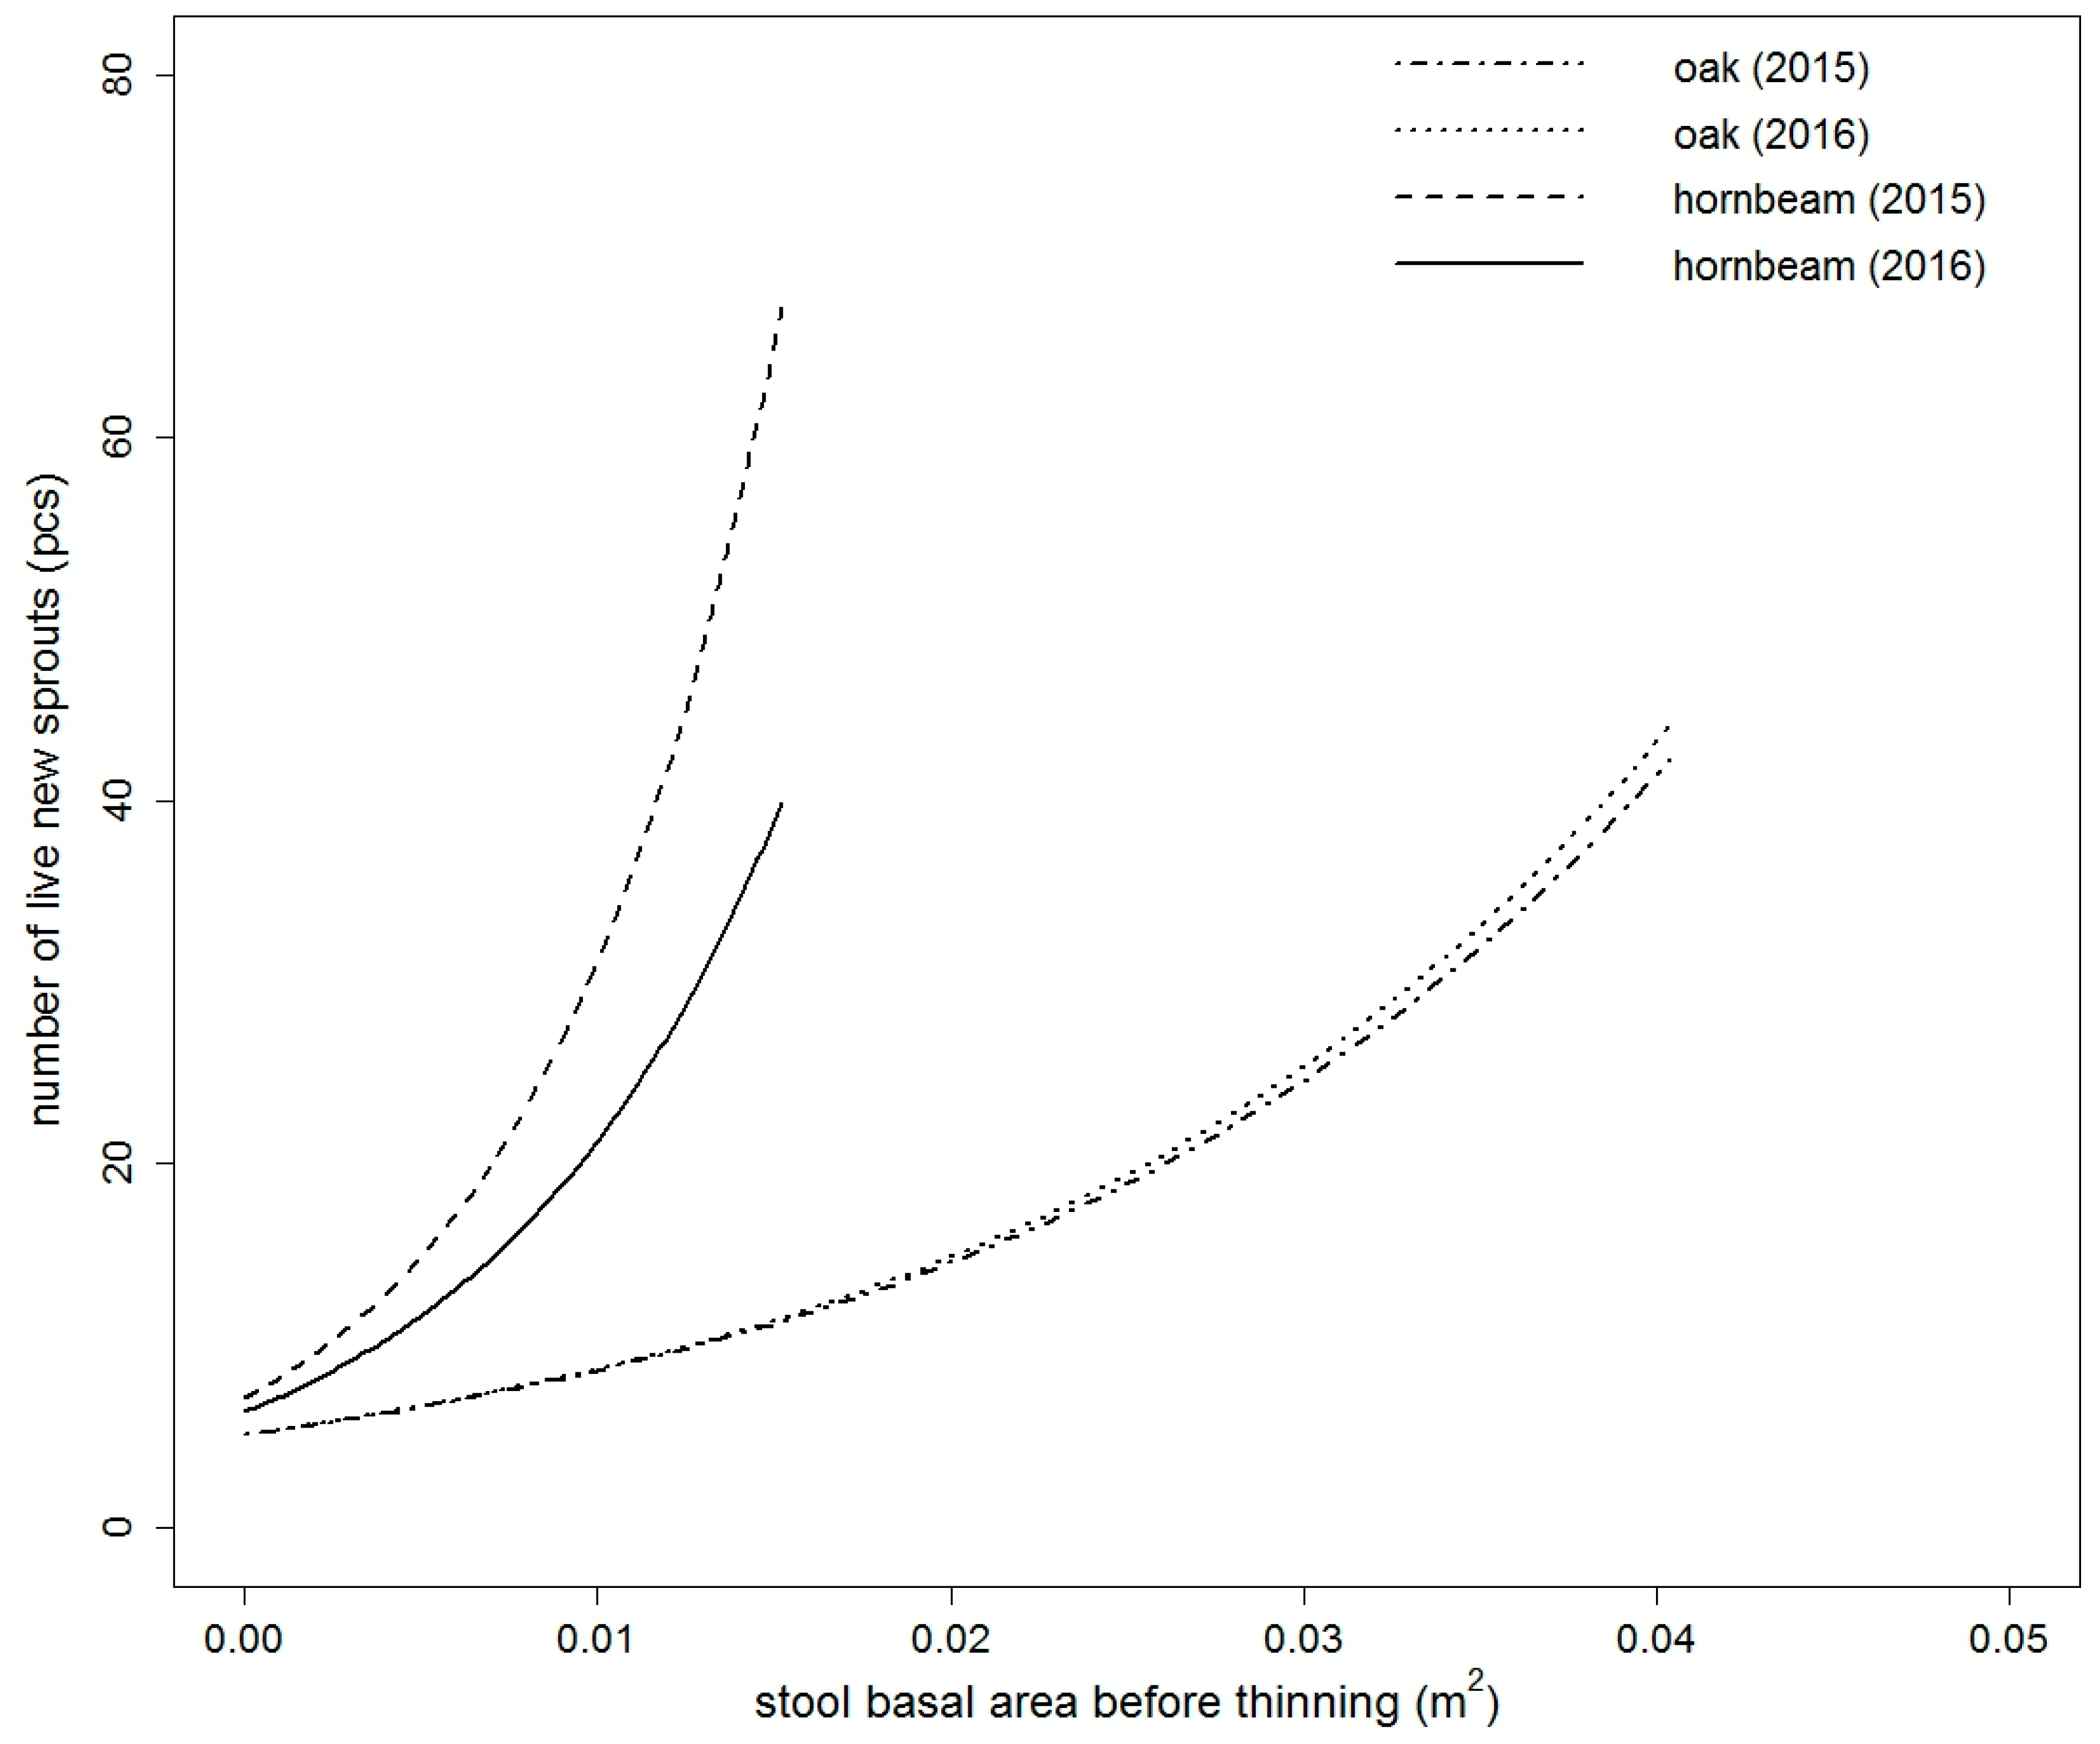
The number of live new sprouts of sessile oak was significantly influenced by all tested variables in 2015 (Table S1). In 2016, only DSF and TSF were not significant (Table S1). The best model in both years was based on BAbt and It. The goodness of fit characteristics of the best models are presented in Table 3. The model parameters are listed in Table 4. Very similar results were obtained for European hornbeam. In both studied years, all tested variables were statistically significant (Table S2). The best selected models again contained a combination of independent variables. For European hornbeam in both years, BAbt and It were statistically significant, and in comparison to sessile oak, the model was improved by including LAI in the year 2015 (pseudo R2 higher by 0.0014) and LAI and ISF in the year 2016 (pseudo R2 higher by 0.0351). The goodness of fit characteristics of selected models are shown in Table 3. The estimates of the best model parameters are listed in Table 4. From the modelled curves in Figure 1 and Figure 2, it is evident that with increasing BAbt and It, the fitted number of live new sprouts increased for both studied species. LAI and ISF had a negative influence on the number of live new European hornbeam sprouts, while BAbt and It positively affected the number of live new European hornbeam sprouts (Table 4, Figure 2). When we compare the fitted values of both studied species from Figure 3, we notice that the number of sessile oak sprouts was similar in both studied years, but the number of European hornbeam sprouts was different between the years 2015 and 2016 due to the higher mortality of European hornbeam sprouts. The number of live new European hornbeam sprouts was significantly higher than the number of sessile oak sprouts (with the same BAbt and It) (Figure 3).
3.3. Dead New Sprouts
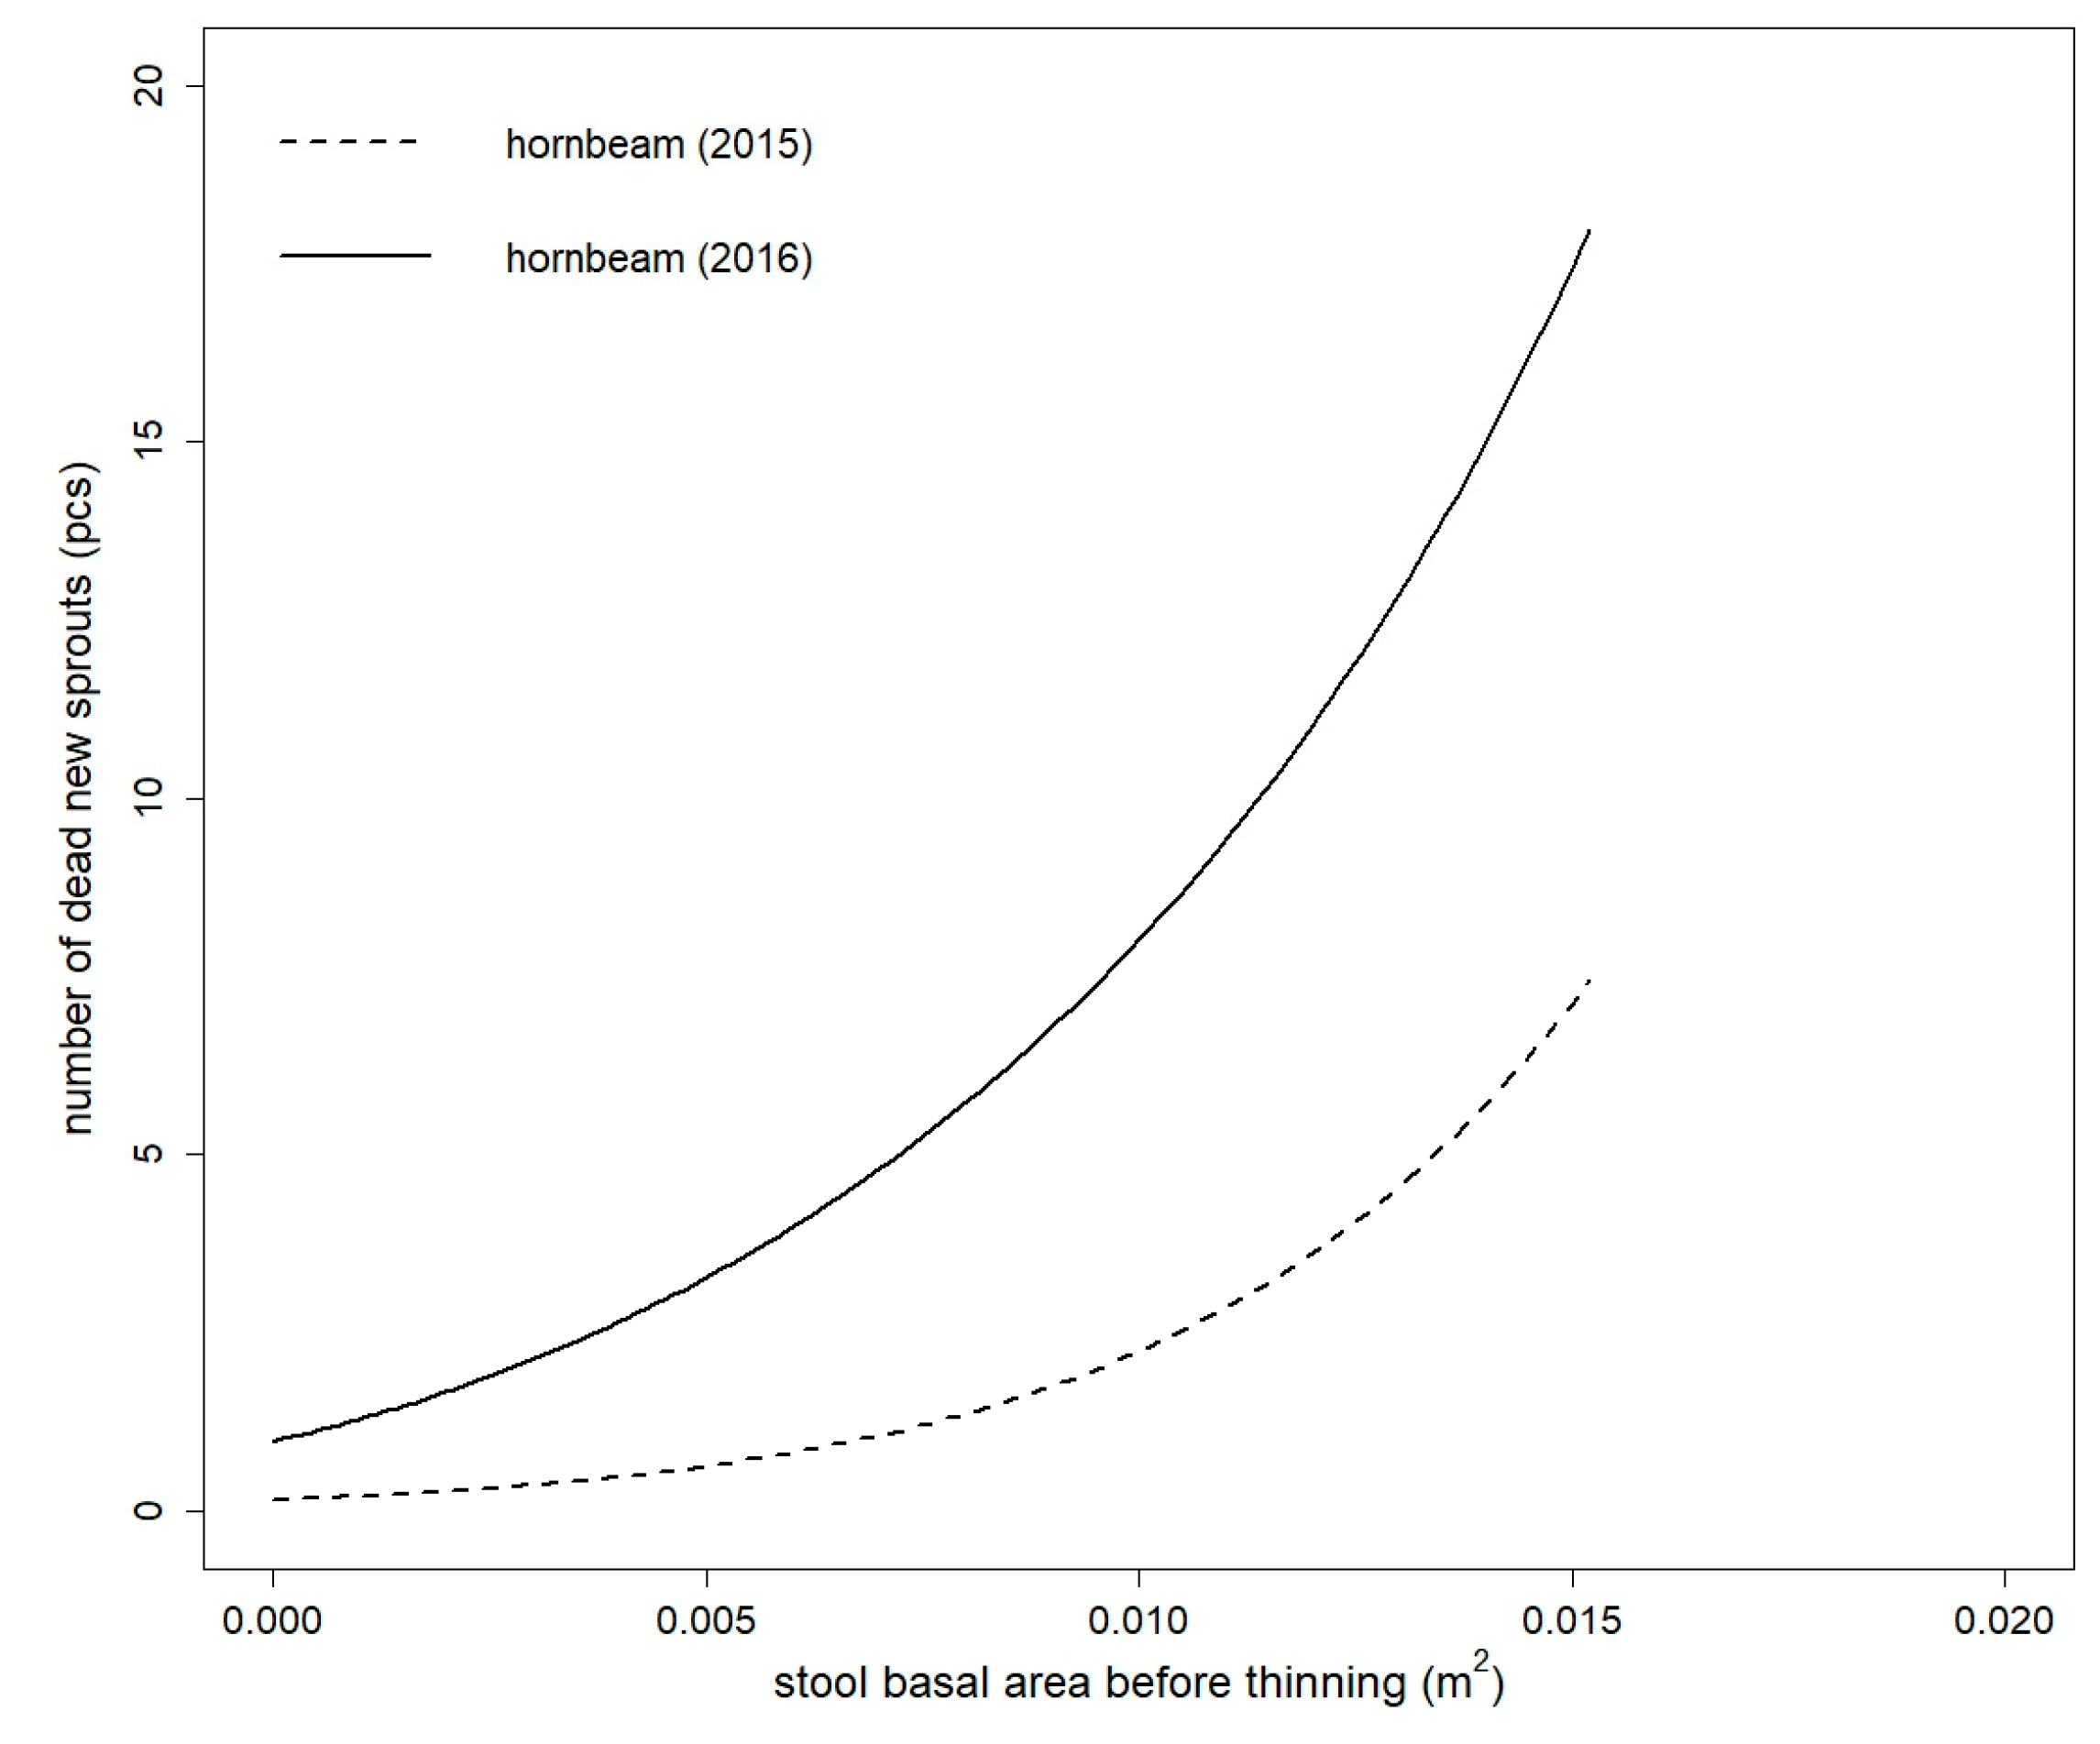
None of the tested independent variables were statistically significant for the number of dead new sprouts of sessile oak model in both studied years (all tested models had values of p > 0.05). The number of dead new sprouts of European hornbeam was influenced by BAbt, BAt, BAat, and It in both studied years and in 2015, and GF and OP were also statistically significant (Table S3). The best model for European hornbeam in 2015 was fitted by BAbt in combination with It as explanatory variables (Table 5). The false zeros part of the model was only influenced by BAbt. The European hornbeam model in 2016 only had BAbt (without the intercept in the false zeros part of the model) as an independent variable. The parameter estimates for the selected final models are shown in Table 6. The number of dead European hornbeam sprouts increased between 2015 and 2016 (Figure 4).
3.4. Height of New Sprouts
The height of the new sprouts model differed in statistically significant variables between the two species (Table S4). For sessile oak, all biometric variables (BAbt, BAat, BAt, It, LAI) were statistically significant. Of the variables representing light conditions, only GF, OP, and ISF were significant. Of the biometric variables, the height of new sprouts was best explained by BAt. ISF had the greatest influence of the light characteristics. From all tested combinations, according to our evaluation criteria, the best model was based on BAbt and ISF (without an intercept).
The height of the sessile oak sprouts increased with higher BAbt and ISF values. The goodness of fit characteristics of the selected model are shown in Table 7, and the model-estimated parameters are listed in Table 8. For European hornbeam, the height of new sprouts was significantly influenced by GF, OP, ISF, DSF, TSF, and LAI (Table S4). Neither of the European hornbeam models explained more than 10% of the height variability of new sprouts. According to the goodness of fit characteristics, the best European hornbeam model was based on LAI (Table 7). The estimates of the model parameters are shown in Table 8; according to the estimates, the height of the European hornbeam sprouts decreased with increasing LAI. The mean heights of the European hornbeam and sessile oak sprouts (Table 2) were significantly different (t value = 3.0213, df = 152.2195, p value = 0.0029).
4. Discussion
4.1. Probability of Stump Sprouting
Data are scarce concerning the re-sprouting probability in the selection system (selective thinning)-managed coppices. Conversely, there are much more data available on the probability of re-sprouting in forests managed by clearcutting [24,25,26,27,28] or by alternatives to clearcutting, including thinning, partial harvesting methods, and site-preparation activities [29,30,31,32].
We evaluated the probability of re-sprouting of newly established sessile oak and European hornbeam selective coppices in Drahanská vrchovina in the southeast region of the Czech Republic. For both tree species, re-sprouting was essentially 100% (resp. 96.4% for sessile oak in 2015) two years after selective thinning. We could not confirm the influence of the tested variables on the re-sprouting probability of the studied species. We assume that this can be explained by a small range of stump diameters (in selective low thinning, many thin sprouts are harvested), as in the study [33].
4.2. Live New Sprouts
In traditionally managed coppices (clearcut management) of Quercus petraea, Carpinus betulus, and Tilia cordata Mill., the number of new sprouts per stool depends on the stump diameter and species [30]. The relationship between tree size and the number of sprouts has been described in other species (Quercus pubescens Willd. or Castanea sativa Mill.) [34,35].
Similar results have been found in selective coppicing. The number of surviving sprouts per stool was significantly correlated with age and stool size after the partial thinning of sprouts in a holm oak coppice [36,37]. Taller trees have a more developed root system and therefore more sprouts per stump in European aspen and birch selective coppicing [6].
Our results indicate that the effects of the stool basal area (equivalent to diameter) before thinning, intensity of thinning, LAI, and light conditions (ISF) under the canopy on the initial development of sprouts (number of new live sprouts per stool) were statistically significant. With an increasing size of the root system (expressed by the stool basal area before thinning), sessile oak and European hornbeam increased the number of sprouts per stool. The increasing thinning intensity resulted in a higher number of new sprouts. The number of new sprouts depended on the thinning intensity and had different patterns in the two species. For example, in 2016 at a lower thinning intensity (20%), the number of live sprouts of European hornbeam (16) in thin stools (with BAbt 0.01 m2) was more than three times higher than that of sessile oak (5). With increasing stool BAbt, the difference in the number increased. At an intensity of approximately 80%, the number of European hornbeam sprouts (98) (on stools with BAbt = 0.02 m2) was nearly four times higher than that of sessile oak (27). These results are valid for European hornbeam stools with mean values of LAI (2.5045) and ISF (0.1313).
The difference in the number of new sprouts between European hornbeam and sessile oak is perhaps because some tree species allocate more resources to the roots than to the sprouts [38]. Another reason for the different numbers of new sprouts could be the different demands of both tree species for ambient light. Our results confirmed a higher tolerance of European hornbeam to shade; with increasing diffuse radiation (ISF), the number of new European hornbeam sprouts decreased. In this method of regeneration (re-sprouting under the canopy), it is necessary to consider the differential intolerance of the species to shade (especially in sessile oak, even though it had a nearly 100% success rate) because many of the potential stands for such restoration in Central Europe are dominated or co-dominated by sessile oak [30]. If we wish to conserve more light-demanding species, we will need to open the canopy at relatively short intervals. Otherwise, more shade-tolerant species (European hornbeam) will predominate in the lower tree layer.
4.3. Dead New Sprouts
Within-stool sprout mortality can be generally attributed to a declining root:sprout ratio, resulting in increasingly longer periods for roots and sprouts to restore functional balance following periods of sprout elongation and expansion [39]. As documented in several coppice yield studies, the mortality curve has an exponential trend and declines rapidly during the life cycle of a coppice [34,37]. On the other hand, mortality can gradually increase after a disturbance, as documented in holm oak, where mortality was low after the first year of disturbance and then rapidly increased (42–56%) in the second year [37]. A 75% mortality rate for young sprouts that were higher than 1 m at four years of age is documented in a Castanea sativa coppice [34]. This finding is in accordance with the behaviour of European hornbeam in our study, in which the mortality had an increasing trend within the first two years of observation. Increasing mortality can be attributed to increasing competition and interference between sprouts [40,41,42,43]. The initial advantage of numerous sprouts is rapidly lost by increasing crowding, which induces self-thinning at a very young stage [41,44] that may also be supported by our results of European hornbeam.
The thinning method may have a significant impact on the growth and survival of sprouts. Single-tree selection significantly reduced stump sprout survival 10 years after harvesting in upland oak species compared with group selection and clearcutting [45]. For plantations of cherry bark oak and water oak, heavy silvicultural thinning treatments resulted in greater sprout survival than light thinning treatments [44,46,47].
In addition, the mortality of young sprouts can be affected by their distribution around the stump. Sprouts distributed unevenly around the stump cannot maintain the complete parent root system, so the survival and growth of the sprouts are significantly lower than those of stumps with evenly distributed sprouts [48]. This effect, when considered in survival analysis, could explain a large amount of data variance in future research.
4.4. Height of New Sprouts
In general, the tree canopy is opened after harvest, and tree crowns start to expand rapidly [49]. The greatest height increment of oaks is commonly observed in the first season after thinning [44].
Seedling height of a generative origin has been well studied [50,51,52], but for sprouts of vegetative origin, there are fewer studies.
The heights of sprouts of European aspen and birch were higher in traditional coppices than in selective coppices [6]. This may be a consequence of the lower light intensity in the residual stand and higher competition for available water and nutrients. According to our results, European hornbeam was only influenced by LAI. The height of new sprouts decreased with increasing LAI. We believe that the reason for this is related to the retained sprouts, which reduce the growth rate of the newer sprouts. In sprouts that developed under the light overstory, a decrease in average height was observed. Thus, there is evidence that canopy closure may have caused the reduced growth [31,44,45,53]. However, several studies claim that shading does not affect the total height, but does affect the crown surface [54]. For sessile oak, the height model of new sprouts was related to BAbt in combination with ISF. This model explained more than 31% of the height variability of new sprouts. The height of new sprouts was greater with increasing BAbt. New sprout height and maximum sprout diameter were correlated with the basal area and height of the retained stool [55]. New sprout height is supported by non-structural carbohydrates (starch is released from the lignotuber) and nutrients [8,10]. Selective thinning also influenced the height and diameter growth of retained sprouts of Mediterranean oaks (Quercus ilex and Quercus cerris) [56].
5. Conclusions
The present study describes the growth of new sprouts in an oak-hornbeam selective coppice after low thinning. Our aim was to find the relations between the sprouting probability, number, and height of new sprouts of sessile oak and European hornbeam and stool biometric characteristics (BAbt, BAt, BAat, LAI), thinning intensity, and light conditions, and to compare the results of the two species. All stumps of both species sprouted two years after selective thinning, and the sprouting probability did not depend on any of the tested variables. The number of live new sprouts models for both species (for both studied years) was significantly influenced by BAbt and It. European hornbeam models were influenced by LAI in both years and by ISF in 2016. The fitted number of live new sprouts was higher for European hornbeam. The number of dead new sprouts of sessile oak was not influenced by any of the tested variables in either of the studied years. The number of dead new sprouts of European hornbeam depended on BAbt (in 2016) and on BAbt and It (in 2015). The height of the new sprouts of sessile oak depended on ISF and BAbt. The height of European hornbeam was only influenced by LAI in the best-fitted model. The mean height of European hornbeam was significantly higher than the mean height of sessile oak.
At comparable sites and for the examined tree species, the forest manager can obtain a realistic picture of the probability of re-sprouting, the number of new live and dead sprouts, and the expected heights of the sprouts with respect to the thinning intensities.
Supplementary Materials
The following are available online at www.mdpi.com/1999-4907/8/9/308/s1, Table S1: The goodness of fit characteristics of the number of live new sessile oak sprouts model, Table S2: The goodness of fit characteristics of the number of live new European hornbeam sprouts model, Table S3: The goodness of fit characteristics of the number of dead new sprouts model, Table S4: The goodness of fit characteristics of the new sprouts height models.
Acknowledgments
Supported by the project “Coppice as a biological and production alternative for future in the Czech Republic”, Cost Action FP 1301 (No. LD15117) and by the Specific University Research Fund of the FFWT Mendel University in Brno, project No. 2017006.
Author Contributions
J.K., M.K. and R.K. conceived and designed the experiments; J.K., R.K., M.K, B.F. and Z.A. performed the experiments; Z.A. and K.D. analyzed the data; All authors wrote the paper.
Conflicts of Interest
The authors declare no conflict of interest. The founding sponsors had no role in the design of the study; in the collection, analyses, or interpretation of data; in the writing of the manuscript, and in the decision to publish the results.
References
- Rackham, O. Ancient woodlands: Modern threats. New Phytol. 2008, 180, 571–586. [Google Scholar] [CrossRef] [PubMed]
- Müllerová, J.; Hédl, R.; Szabó, P. Coppice abandonment and its implications for species diversity in forest vegetation. For. Ecol. Manag. 2015, 343, 88–100. [Google Scholar] [CrossRef] [PubMed]
- Stojanović, M.; Szatniewska, J.; Kyselová, I.; Pokorný, R.; Čater, M. Transpiration and water potential of young Quercus petraea (M.) Liebl. coppice sprouts and seedlings during favourable and drought conditions. J. For. Sci. 2017, 63, 313–323. [Google Scholar] [CrossRef]
- Nielsen, A.B.; Møller, F. Is coppice a potential for urban forestry? The social perspective. Urban For. Urban Gree. 2008, 7, 129–138. [Google Scholar] [CrossRef]
- Stajic, B.; Zlatanov, T.; Velichkov, I.; Dubravac, T.; Trajkov, P. Past and recent coppice forest management in some regions of South Eastern Europe. Silva Balc. 2009, 10, 9–19. [Google Scholar]
- Rydberg, D. Initial sprouting, growth and mortality of European aspen and birch after selective coppicing in central Sweden. For. Ecol. Manag. 2000, 130, 27–35. [Google Scholar] [CrossRef]
- Coppini, M.; Hermanin, L. Restoration of selective beech coppices: A case study in the Apennines (Italy). For. Ecol. Manag. 2007, 249, 18–27. [Google Scholar] [CrossRef]
- Quevedo, L.; Arnan, X.; Rodrigo, A. Selective thinning of Arbutus unedo coppices following fire: Effects on growth at the individual and plot level. For. Ecol. Manag. 2013, 292, 56–63. [Google Scholar] [CrossRef]
- Cotillas, M.; Sabaté, S.; Gracia, C.; Espelta, J.M. Growth response of mixed Mediterranean oak coppices to rainfall reduction. Could selective thinning have any influence on it? For. Ecol. Manag. 2009, 258, 1677–1683. [Google Scholar] [CrossRef]
- López, B.C.; Gracia, C.A.; Sabaté, S.; Keenan, T. Assessing the resilience of Mediterranean holm oaks to disturbances using selective thinning. Acta Oecol. 2009, 35, 849–854. [Google Scholar] [CrossRef]
- Rodríguez-Calcerrada, J.; Pérez-Ramos, I.M.; Ourcival, J.-M.; Limousin, J.-M.; Joffre, R.; Rambal, S. Is selective thinning an adequate practice for adapting Quercus ilex coppices to climate change? Ann. For. Sci. 2011, 68, 575–585. [Google Scholar] [CrossRef]
- Kerr, G.; Haufe, J. Thinning Practice—A Silvicultural Guide, 1st ed.; Forestry Commission: Edinburgh, UK, 2011; p. 54.
- Průša, E. Silviculture Based on Forest Ecosystem Classification, 1st ed.; Lesnická Práce: Kostelec nad Černými lesy, Czech Republic, 2001; p. 590. (In Czech) [Google Scholar]
- Oliver, C.D.; Larson, B.C. Forest Stand Dynamics, 1st ed.; Wiley & Sons: New York, NY, USA, 1996; p. 544. [Google Scholar]
- Cameron, A.D. Importance of early selective thinning in the development of long-term stand stability and improved log quality: A review. Forestry 2002, 75, 25–35. [Google Scholar] [CrossRef]
- Annighöfer, P.; Beckschäfer, P.; Vor, T.; Ammer, C. Regeneration Patterns of European Oak Species (Quercus petraea (Matt.) Liebl., Quercus robur L.) in Dependence of Environment and Neighborhood. PLoS ONE 2015, 10, 1–16. [Google Scholar] [CrossRef] [PubMed]
- Chytrý, M. Vegetation of the Czech Republic: Diversity, ecology, history and dynamics. Preslia 2012, 84, 427–504. [Google Scholar]
- Loftsgaarden, P.O.; Andrews, P.L. Constructing and Testing Logistic Regression Models for Binary Data: Application to National Fire Danger Rating System; General technical report INT-286; USDA, Forest Service, Intermountain research station: Ogden, Utah, USA, 1992; p. 36.
- Zuur, A.F.; Ieno, E.N.; Walker, N.J.; Savaliev, A.A.; Smith, G.M. Mixed Effects Models and Extensions in Ecology with R; Springer: New York, NY, USA, 2009; p. 574. [Google Scholar]
- Akaike, H. Information theory and an extension of the maximum likelihood principle. In Proceedings 2nd International Symposium on Information Theory, Budapest, Hungary, 2–8 September 1973; Petrov, B.N., Csaki, F., Eds.; Akademiai Kiado: Budapest, Hungary, 1973; pp. 268–281. [Google Scholar]
- Nagelkerke, N.J.D. A note on a general definition of the coefficient of determination. Biometrika 1991, 78, 691–692. [Google Scholar] [CrossRef]
- Burnham, K.P.; Anderson, D.R. Model Selection and Inference: A Practical Information-Theoretic Approach; Springer: New York, NY, USA, 1998; p. 353. [Google Scholar]
- R Core Team. R: A Language and Environment for Statistical Computing; R Foundation for Statistical Computing: Vienna, Austria, 2017; Available online: http://www.R-project.org/ (accessed on 25 April 2017).
- Sands, B.A.; Abrams, M.D. Effects of Stump Diameter on Sprout Number and Size for Three Oak Species in a Pennsylvania Clearcut. North. J. Appl. For. 2009, 26, 122–125. [Google Scholar]
- Weigel, D.R.; Peng, C.Y.J. Predicting stump sprouting and competitive success of five oak species in southern Indiana. Can. J. For. Res. 2002, 32, 703–712. [Google Scholar] [CrossRef]
- Weigel, D.R.; Dey, D.C.; Peng, C.Y.J. Stump sprout dominance probabilities of five oak species in southern Indiana 15 years after clearcut harvesting. In Proceedings of the 13th Biennial Southern Silvicultural Research Conference, Memphis, TN, USA, 28 February–4 March 2005; Connor, K.F., Ed.; U.S. Department of Agriculture, Forest Service, Southern Research Station: Asheville, NC, USA, 2006; pp. 551–558. [Google Scholar]
- Weigel, D.R.; Dey, D.C.; Peng, C.Y.J. Stump sprout dominance probabilities of five oak species in southern Indiana 20 years after clearcut harvesting. In Proceedings of the 17th Central Hardwood Forest Conference, Lexington, KY, USA, 5–7 April 2010; Fei, S., Lhotka, J.M., Stringer, J.W., Gottschalk, K.W., Gary, W., Eds.; U.S. Department of Agriculture, Forest Service, Northern Research Station: Newton Square, PA, USA, 2011; pp. 10–22. [Google Scholar]
- Šplíchalová, M.; Adamec, Z.; Kadavý, J.; Kneifl, M. Probability model of sessile oak (Quercus petraea (Matt.) Liebl.) stump sprouting in the Czech Republic. Eur. J. For. Res. 2012, 131, 1611–1618. [Google Scholar] [CrossRef]
- Atwood, C.; Fox, T.; Loftis, D. Effects of alternative silviculture on stump sprouting in the southern Appalachians. For. Ecol. Manag. 2009, 257, 1305–1313. [Google Scholar] [CrossRef]
- Matula, R.; Svátek, M.; Kůrová, J.; Úradníček, L.; Kadavý, J.; Kneifl, M. The sprouting ability of the main tree species in Central European coppices: implications for coppice restoration. Eur. J. For. Res. 2012, 131, 1501–1511. [Google Scholar] [CrossRef]
- Keyser, T.L.; Zarnoch, S.J. Stump sprout dynamics in response to reductions in stand density for nine upland hardwood species in the southern Appalachian Mountains. For. Ecol. Manag. 2014, 319, 29–35. [Google Scholar] [CrossRef]
- Keyser, T.L.; Loftis, D.L. Stump sprouting of 19 upland hardwood species 1 year following initiation of a shelterwood with reserves silvicultural system in the southern Appalachian Mountains, USA. New For. 2015, 46, 449–464. [Google Scholar] [CrossRef]
- Pyttel, P.L.; Fischer, U.F.; Suchomel, C.; Gärtner, S.M.; Bauhus, J. The effect of harvesting on stump mortality and re-sprouting in aged oak coppice forests. For. Ecol. Manag. 2013, 289, 18–27. [Google Scholar] [CrossRef]
- Giudici, F.; Zingg, A. Sprouting ability and mortality of chestnut (Castanea sativa Mill.) after coppicing. A case study. Ann. For. Sci. 2005, 62, 513–523. [Google Scholar] [CrossRef]
- Logli, F.; Joffre, R. Individual variability as related to stand structure and soil condition in a Mediterranean oak coppice. For. Ecol. Manag. 2001, 142, 53–63. [Google Scholar] [CrossRef]
- Ducrey, M.; Boisserie, M. Natural regrowth of holm oak coppice (Quercus ilex L) following partial cuts. Ann. Sci. For. 1992, 49, 91–109. [Google Scholar] [CrossRef]
- Retana, J.; Riba, M.; Castell, C.; Espelta, J.M. Regeneration by sprouting of holm-oak (Quercus ilex) stands exploited by selection thinning. Vegetatio 1992, 99, 355–364. [Google Scholar] [CrossRef]
- Clarke, P.J.; Lawes, M.J.; Midgley, J.J. Resprouting as a key functional trait in woody plants—Challenges to developing new organizing principles. New Phytol. 2010, 188, 651–654. [Google Scholar] [CrossRef] [PubMed]
- Borchert, R. Differences in shoot growth patterns between juvenile and adult trees and their interpretation based on systems analysis of trees. Acta Hortic. 1976, 56, 123–130. [Google Scholar] [CrossRef]
- Ford, E.D.; Newbould, P.J. Stand structure and dry weight production through the sweet chestnut (Castanea sativa Mill.) coppice cycle. J. Ecol. 1970, 58, 275–296. [Google Scholar] [CrossRef]
- Johnson, P.S. Growth and structural development of red oak sprout clumps. For. Sci. 1975, 21, 413–418. [Google Scholar]
- McDonald, I.E.; Powell, G.R. Relationships between stump sprouting and parent-tree diameter in sugar maple in the 1st year following clear-cutting. Can. J. For. Res. 1983, 13, 390–394. [Google Scholar] [CrossRef]
- Ferm, A.; Kauppi, A. Coppicing as a means for increasing hardwood biomass production. Biomass 1990, 22, 107–121. [Google Scholar] [CrossRef]
- Gardiner, E.S.; Helmig, L.M. Development of water oak stump sprouts under a partial overstory. New For. 1997, 14, 55–62. [Google Scholar] [CrossRef]
- Dey, D.C.; Jensen, R.G.; Wallendorf, M.J. Single-tree harvesting reduces survival and growth of oak stump sprouts in the Missouri Ozark Highlands. In Proceedings of the 16th Central Hardwood Forest Conference, West Lafayette, IN, USA, 8–9 April 2008; Jacobs, D.F., Michler, C.H., Eds.; U.S. Department of Agriculture, Forest Service, North Central Forest Experiment Station: Newton Square, PA, USA, 2008; pp. 26–37. [Google Scholar]
- Lockhart, B.R.; Chambers, J.L. Cherry bark oak stump sprout survival and development five years following plantation thinning in the lower Mississippi alluvial valley, USA. New For. 2007, 33, 183–192. [Google Scholar] [CrossRef]
- Knapp, B.O.; Olson, M.G.; Dey, D.C. Early stump sprout development after two levels of harvest in a Midwestern Bottomland Hardwood Forest. For. Sci. 2017, 63, 377–387. [Google Scholar] [CrossRef]
- Kharitonovich, F.M. Reforestation by coppice shoots. In Field-Protecting Forest Belts, Moscow, Russia; Sorokin, I.F., Ed.; Moscow, Russia, 1937; pp. 175–239. (In Russian) [Google Scholar]
- O’Hara, K.L.; Berrill, J.-P. Dynamics of coast redwood sprout clump development in variable light environments. J. For. Res. 2010, 15, 131–139. [Google Scholar] [CrossRef]
- Finzi, A.C.; Canham, C.D. Sapling growth in response to light and nitrogen availability in a southern New England forest. For. Ecol. Manag. 2000, 131, 153–165. [Google Scholar] [CrossRef]
- Gratzer, G.; Darabant, A.; Chhetri, P.B.; Rai, P.B.; Eckmüllner, O. Interspecific variation in the response of growth, crown morphology, and survivorship to light of six tree species in the conifer belt of the Bhutan Himalayas. Can. J. For. Res. 2004, 34, 1093–1107. [Google Scholar] [CrossRef]
- Stancioiu, P.T.; O’Hara, K.L. Regeneration growth in different light environments of mixed species, multiaged, mountainous forests of Romania. Eur. J. For. Res. 2006, 125, 151–162. [Google Scholar] [CrossRef]
- Dey, D.C.; Jensen, R.G. Stump sprouting potential of oaks in Missouri Ozark forests managed by even- and uneven-aged silviculture. In Proceedings of the 2nd Missouri Ozark Forest Ecosystem Project Symposium: Post-Treatment Results of the Landscape Experiment, St. Louis, MO, USA, 17–18 October 2000; Shifley, S.R., Kabrick, J.M., Eds.; U.S. Department of Agriculture, Forest Service, North Central Forest Experiment Station: St. Paul, MN, USA, 2002; pp. 102–113. [Google Scholar]
- Gracia, M.; Retana, J. Effect of site quality and shading on sprouting patterns of holm oak coppices. For. Ecol. Manag. 2004, 188, 39–49. [Google Scholar] [CrossRef]
- Ducrey, M.; Turrel, M. Influence of cutting methods and dates on stump sprouting in Holm oak (Quercus ilex L.) coppice. Ann. For. Sci. 1992, 49, 449–464. [Google Scholar] [CrossRef]
- Espelta, J.M.; Retana, J.; Habrouk, A. Resprouting patterns after fire and response to stool cleaning of two coexisting Mediterranean oaks with contrasting leaf habits on two different sites. For. Ecol. Manag. 2003, 179, 401–414. [Google Scholar] [CrossRef]
Figure 1.
Fitted values of the number of live new sessile oak sprouts model based on the stool basal area before thinning and thinning intensity (2016).
Figure 1.
Fitted values of the number of live new sessile oak sprouts model based on the stool basal area before thinning and thinning intensity (2016).

Figure 2.
Fitted values of the number of live new European hornbeam sprouts model based on the stool basal area before thinning, thinning intensity, indirect site factor, and leaf area index (2016) (for the purpose of this figure, the mean value of LAI for European hornbeam stools is used).
Figure 2.
Fitted values of the number of live new European hornbeam sprouts model based on the stool basal area before thinning, thinning intensity, indirect site factor, and leaf area index (2016) (for the purpose of this figure, the mean value of LAI for European hornbeam stools is used).

Figure 3.
Comparison of fitted values of the live new sprouts model of sessile oak and European hornbeam in both studied years. Models are based on the stool basal area before thinning and thinning intensity (for both species) and indirect site factor and leaf area index (only for European hornbeam) (for the purpose of this figure, thinning intensity = 50% for both species and both years, ISF = 0.1313 for only European hornbeam in both years, LAI = 2.5045 for only European hornbeam in year 2016).

Figure 4.
Comparison of fitted values of dead new sprouts model of European hornbeam in both studied years. Models are based on the stool basal area before thinning (for both years) and thinning intensity (only for year 2015) (for the purpose of this figure, thinning intensity = 48.8586%—mean value for European hornbeam).


Table 1.
Basic characteristics of selected variables measured at stool level.
| Variable | Species | Mean Value | Standard Deviation | Minimum Value | Maximum Value |
|---|---|---|---|---|---|
| BAbt (m2) | O | 0.0050 | 0.0055 | 0.0005 | 0.0404 |
| H | 0.0050 | 0.0030 | 0.0008 | 0.0152 | |
| BAt (m2) | O | 0.0024 | 0.0033 | 0.0002 | 0.0243 |
| H | 0.0025 | 0.0018 | 0.0002 | 0.0082 | |
| BAat (m2) | O | 0.0025 | 0.0025 | 0.0003 | 0.0161 |
| H | 0.0025 | 0.0015 | 0.0002 | 0.0092 | |
| It (%) | O | 46.9289 | 15.7934 | 6.1305 | 80.3030 |
| H | 48.8586 | 14.1870 | 15.0495 | 82.9964 | |
| GF (%) | O | 11.3858 | 3.4163 | 3.3400 | 20.8100 |
| H | 8.5797 | 2.8654 | 4.3900 | 18.0800 | |
| OP (%) | O | 12.2251 | 3.6223 | 3.6200 | 22.3400 |
| H | 9.3228 | 3.1226 | 4.8500 | 19.3700 | |
| LAI (m2/m2) | O | 2.2394 | 0.3539 | 1.3500 | 3.2100 |
| H | 2.5045 | 0.2652 | 1.7500 | 3.0300 | |
| DSF | O | 0.2003 | 0.1239 | 0.0345 | 0.5898 |
| H | 0.1550 | 0.0993 | 0.0494 | 0.6307 | |
| ISF | O | 0.1622 | 0.0503 | 0.0516 | 0.3014 |
| H | 0.1313 | 0.0468 | 0.0641 | 0.3192 | |
| TSF | O | 0.1953 | 0.1124 | 0.0367 | 0.5492 |
| H | 0.1519 | 0.0906 | 0.0561 | 0.5857 |
BAbt—stool basal area before thinning, BAt—basal area of thinning, BAat—stool basal area after thinning, It—intensity of thinning, GF—gap fraction, OP—openness, LAI—leaf area index, DSF—direct site factor, ISF—indirect site factor, TSF—total site factor, O—sessile oak, H—European hornbeam.
Table 2.
Basic parameters of new sprouts.
| Variable | Year | Species | Mean Value | Standard Deviation | Minimum Value | Maximum Value |
|---|---|---|---|---|---|---|
| height of new sprouts (cm) | 2016 | O | 47.44 | 25.40 | 7.00 | 140.00 |
| H | 57.44 | 21.33 | 20.00 | 138.00 | ||
| number of live new sprouts (pcs/stool) | 2015 | O | 7.17 | 8.47 | 0 | 49 |
| H | 17.26 | 16.70 | 1 | 108 | ||
| 2016 | O | 7.21 | 8.89 | 1 | 50 | |
| H | 13.36 | 11.30 | 0 | 82 | ||
| number of dead new sprouts (pcs/stool) | 2015 | O | 0.36 | 0.72 | 0 | 4 |
| H | 0.93 | 2.35 | 0 | 15 | ||
| 2016 | O | 1.66 | 1.94 | 0 | 9 | |
| H | 3.76 | 4.65 | 0 | 30 |
O—sessile oak, H—European hornbeam.
Table 3.
The goodness of fit characteristics of the number of live new sprouts model for both species.
Table 3.
The goodness of fit characteristics of the number of live new sprouts model for both species.
| Species | Year | Predictor | χ2 (DF) | p | ps. R2 | AIC |
|---|---|---|---|---|---|---|
| O | 2015 | BAbt + It | 219.20 (3) | <0.0001 | 0.9265 | 626.5 |
| 2016 | BAbt + It | 223.21 (3) | <0.0001 | 0.9299 | 657.0 | |
| H | 2015 | BAbt + It + LAI | 781.71 (4) | <0.0001 | 0.9964 | 1488.6 |
| 2016 | BAbt + It + LAI + ISF | 528.52 (5) | <0.0001 | 0.9768 | 1129.3 |
χ2—likelihood ratio χ2 test value, DF—degree of freedom, ps. R2—pseudo R2, AIC—Akaike information criterion, BAbt—stool basal area before thinning, It—intensity of thinning, LAI—leaf area index, ISF—indirect site factor, O—sessile oak, H—European hornbeam.
Table 4.
The estimation of parameters for the number of best live new sprouts models.
| Species (year) | Predictor | Parameter | Estimation | SE | z | p |
|---|---|---|---|---|---|---|
| sessile oak (2015) | BAbt + It | β0 | 0.5819 | 0.1583 | 3.676 | 0.0002 |
| β1 | 52.2106 | 3.8415 | 13.591 | <0.0001 | ||
| b2 | 0.0211 | 0.0029 | 7.114 | <0.0001 | ||
| sessile oak (2016) | BAbt + It | β0 | 0.6266 | 0.1569 | 3.993 | <0.0001 |
| β1 | 53.2652 | 3.7962 | 14.031 | <0.0001 | ||
| β2 | 0.0202 | 0.0029 | 6.848 | <0.0001 | ||
| European hornbeam (2015) | BAbt + It + LAI | β0 | 2.7737 | 0.2463 | 11.261 | <0.0001 |
| β1 | 147.5858 | 5.8988 | 25.020 | <0.0001 | ||
| β2 | 0.0116 | 0.0017 | 6.739 | <0.0001 | ||
| β3 | −0.5539 | 0.0834 | −6.644 | <0.0001 | ||
| European hornbeam (2016) | BAbt + It + LAI + ISF | β0 | 5.2030 | 0.5453 | 9.542 | <0.0001 |
| β1 | 120.4584 | 7.0269 | 17.142 | <0.0001 | ||
| β2 | 0.0106 | 0.0020 | 5.378 | <0.0001 | ||
| β3 | −1.4214 | 0.1748 | −8.131 | <0.0001 | ||
| β4 | −2.3678 | 0.9455 | −2.504 | 0.0123 |
z—z-test value; SE—standard error; β0, β1, β2, β3, β4—model parameters; BAbt—stool basal area before thinning; It—intensity of thinning; LAI—leaf area index; ISF—indirect site factor.
Table 5.
The goodness of fit characteristics of the number of dead new sprouts model.
| Species | Year | Predictor | χ2 (DF) | p | ps. R2 | AIC |
|---|---|---|---|---|---|---|
| European hornbeam | 2015 | BAbt + It | 53.42 (3) | <0.0001 | 0.3411 | 337.3 |
| 2016 | BAbt | 128.42 (1) | <0.0001 | 0.6045 | 717.8 |
χ2—likelihood ratio χ2 test value, DF—degrees of freedom, ps. R2—pseudo R2, AIC—Akaike information criterion, BAbt—stool basal area before thinning, It—intensity of thinning.
Table 6.
The parameter estimates for the best model fit of the number of dead new sprouts.
| Species (year) | Predictor | Parameter | Estimation | SE | z | p |
|---|---|---|---|---|---|---|
| European hornbeam (2015) | BAbt + It | β0 | −1.1881 | 0.5304 | −2.240 | 0.0251 |
| β1 | 174.6932 | 27.6850 | 6.310 | <0.0001 | ||
| β2 | 0.0193 | 0.0083 | 2.336 | 0.0195 | ||
| γ0 | 1.3417 | 0.4788 | 2.802 | 0.0051 | ||
| γ1 | −134.7950 | 69.8329 | −2.041 | 0.0412 | ||
| γ2 | ----- | ----- | ----- | ----- | ||
| European hornbeam (2016) | BAbt | β0 | 0.6750 | 0.1017 | 6.637 | <0.0001 |
| β1 | 146.5458 | 12.8754 | 11.382 | <0.0001 | ||
| γ0 | ----- | ----- | ----- | ----- | ||
| γ1 | −280.8806 | 48.6000 | −5.780 | <0.0001 |
z—z-test value; SE—standard error; β0, β1, β2, γ1, γ2—model parameters; BAbt—stool basal area before thinning; It—intensity of thinning.
Table 7.
The goodness of fit characteristics of the new sprouts height models.
| Species | Predictor | F (DF) | p | R2 | AIC |
|---|---|---|---|---|---|
| sessile oak | ISF + BAbt | 230.862 (2, 82) | <0.0001 | 0.3166 | 514.4 |
| European hornbeam | LAI | 14.133 (1, 137) | 0.0003 | 0.0935 | 840.1 |
F—F test value, DF—degrees of freedom, R2—coefficient of determination, AIC—Akaike information criterion, ISF—indirect site factor, BAbt—stool basal area before thinning, LAI—leaf area index.
Table 8.
The estimated parameters of the new sprouts height models.
| Species | Predictor | Parameter | Estimation | SE | t | p |
|---|---|---|---|---|---|---|
| sessile oak | ISF + BAbt | β0 | --- | --- | --- | --- |
| β1 | 223.339 | 18.046 | 12.376 | <0.0001 | ||
| β2 | 2097.330 | 413.649 | 5.070 | <0.0001 | ||
| European hornbeam | LAI | β0 | 119.124 | 16.499 | 7.220 | <0.0001 |
| β1 | −24.600 | 6.544 | −3.759 | 0.0003 |
SE—standard error; t—t test value; β0, β1, β2—model parameters; ISF—indirect site factor; BAbt—stool basal area before thinning; LAI—leaf area index.
© 2017 by the authors. Licensee MDPI, Basel, Switzerland. This article is an open access article distributed under the terms and conditions of the Creative Commons Attribution (CC BY) license (http://creativecommons.org/licenses/by/4.0/).
Share and Cite
MDPI and ACS Style
Adamec, Z.; Kadavý, J.; Fedorová, B.; Knott, R.; Kneifl, M.; Drápela, K. Development of Sessile Oak and European Hornbeam Sprouts after Thinning. Forests 2017, 8, 308. https://doi.org/10.3390/f8090308
AMA Style
Adamec Z, Kadavý J, Fedorová B, Knott R, Kneifl M, Drápela K. Development of Sessile Oak and European Hornbeam Sprouts after Thinning. Forests. 2017; 8(9):308. https://doi.org/10.3390/f8090308
Chicago/Turabian StyleAdamec, Zdeněk, Jan Kadavý, Barbora Fedorová, Robert Knott, Michal Kneifl, and Karel Drápela. 2017. "Development of Sessile Oak and European Hornbeam Sprouts after Thinning" Forests 8, no. 9: 308. https://doi.org/10.3390/f8090308
Note that from the first issue of 2016, this journal uses article numbers instead of page numbers. See further details here.