Development of Northern White-Cedar (Thuja occidentalis L.) Plantations within and outside Deer Yards


1
Centre d’Étude de la Forêt (Centre for Forest Research), Département des Sciences du Bois et de la Forêt, Université Laval, 2405 de la Terrasse, Québec, QC G1V 0A6, Canada
2
Centre d’Étude de la Forêt et Chaire de Recherche sur la Forêt Habitée, Département de Biologie, Chimie et Géographie, Université du Québec à Rimouski, 300 Allée des Ursulines, P.O. Box 3300, Rimouski, QC G5L 3A1, Canada
*
Author to whom correspondence should be addressed.
Forests 2017, 8(9), 326; https://doi.org/10.3390/f8090326
Submission received: 6 August 2017
/
Revised: 29 August 2017
/
Accepted: 30 August 2017
/
Published: 1 September 2017
Abstract
:Regional surveys done over the last decades show a clear decline in abundance of Northern white-cedar (Thuja occidentalis L.) throughout its range. A lack of seed trees, difficulties in the establishment of natural regeneration and high browsing pressure caused by increasing deer populations have been identified as plausible causes. Current silvicultural strategies for cedar restoration recommend partial cutting to promote and release natural regeneration, but there is also a need to restore the species in areas where it became absent. Yet, little attention has been given to cedar plantations. This study provides a first characterisation of the effects of competition, silvicultural treatments and deer, moose and hare browsing on planted cedar growth, survival, and stem form. Pure and mixed cedar plantations aged 5–27 years located in Eastern Québec were sampled. Both inside and outside deer yards, planted cedars showed high survival rates and were generally subject to low browsing pressure, but 45% were forked. Cedars showed high growth rates and strong reaction to stand opening. Results suggest that at reduced competition levels, a 9-year browser exclusion could be sufficient to establish safe-from-browsing cedar stands of >3 m in height.
1. Introduction
Northern white-cedar (Thuja occidentalis L., hereafter cedar) is of considerable ecologic value, in part due to its high longevity and shade tolerance [1]. As it offers palatable winter food, cedar is an important source of winter browse for herbivores such as deer (Odocoileus virginianus Zimmerman; hereafter deer), snowshoe hare (Lepus americanus Erxleben; hereafter hare) and moose (Alces alces Gray) [1,2]. Cedar also provides browse and protective cover during winter, when snow hampers deer movement, and is as such an important element of deer wintering areas (hereafter deer yards), which are essential to maintain deer populations at the northern limit of their range [3,4]. Deer yard management therefore aims at creating or maintaining winter cover and food by creating mixed and heterogeneous forests, promoting natural regeneration and partial cutting, and excluding cedar harvesting in order to conserve existing cedar stands [5]. Cedar also has considerable economic value, with current annual harvests averaging 275,000 to 350,000 m3 over its range [6]. Its naturally rot-resistant wood is used for value added products such as shingles and outdoor furniture [6].
A substantial decline in cedar abundance was observed in most areas across all of its natural range since the beginning of the 20th century [7,8,9,10], a phenomenon likely linked to silvicultural practices [6]. Cedar is often found as a minor component of mixed species stands and its silvics are distinct from its typical neighbors. Forest management tends to focus on other species at the expense of cedar [6] and to limit the amount of large woody debris, which has been linked with improved seed germination and seedling survival [11,12]. Deer browsing is also recognized as one of the limiting factors for cedar regeneration [7,13,14,15,16]. Following the exclusion of their main predators, deer populations are thought to have reached unprecedented levels [17,18,19], in some cases reaching overabundance [20]. As a result, browsing pressure can have considerable impacts on cedar regeneration, especially in deer yards [3,15,21]. Snowshoe hare also uses cedar as winter feed when deciduous leaves become scarce [22], and is therefore recognized as an obstacle to cedar regeneration, although to a lesser extent than deer [23]. Moose is also known to use cedar as winter feed, but only when other food sources are insufficient [24].
Browsing can have significant impacts on growth and survival of trees, and can also induce multiple morphological changes such as forking on the main stem [25]. The impact of browsing can be exacerbated on cedar considering its low apical dominance which already contributes, even in the absence of trauma, to the development of multiple lateral branches and forks of considerable diameter relative to the main stem [26,27,28], especially under high light conditions [29]. These forks impact the commercial value of stems, as sound and straight stems of large diameters produce higher valued products and lead to less milling waste [6]. Although long-lived [1], cedar is susceptible to decay, which could be due to its low density and exacerbated by tree damage during forest operations [27]. While no differences in decay have been observed between cedars in all upper canopy positions [27], high resource availability in plantations could lead to increased growth rates and pathogen defenses, or conversely to allocation to growth instead of defensive compounds.
The growth rate and response to stand opening of natural cedar regeneration has been described under various levels of canopy closure and after various partial harvest treatments in natural stands [15,21,30,31,32,33,34]. These assessments have however not been made for cedar plantations. Yet, plantations have the potential to increase the abundance of cedar and therefore counterbalance the declining trend of cedar, to circumvent the browsing problems inherent to natural cedar regeneration near the northern limit of its range, and to provide higher growth yields.
The objective of this study was to evaluate the suitability of cedar plantations following clearcutting for wood production and cedar stand restoration. The specific objectives were (1) to provide a first characterization of planted cedar growth rate, stem form and survival rates, and (2) to evaluate the effects of competition, silvicultural treatments and browsing by deer, moose and hare on planted cedar growth and stem form. Given the small regional deer populations, below 0.5 deer/km2 [35], the influence of deer browsing on cedar plantations inside the deer yard was contrasted with that of deer browsing outside the deer yard.
2. Materials and Methods
2.1. Study Area
The study area is located on public forest land in eastern Québec (48°05′–48°17′ N, 67°58′–68°26′ W; Figure 1) in the eastern balsam fir—yellow birch bioclimatic subdomain [36]. The area is characterised by mean annual temperatures between 1.5 and 2.5 °C and mean annual precipitations between 900 and 1100 mm [36]. The studied stands are plantations established following clearcutting. The planted species on the sites include cedar, black spruce (Picea mariana Mill.), and white spruce (Picea glauca Moench). Natural tree regeneration includes white birch (Betula papyrifera Marshall), yellow birch (Betula alleghaniensis Britt.), pin cherry (Prunus pensylvanica L.f.), red maple (Acer rubrum L.), sugar maple (Acer saccharum Marshall), trembling aspen (Populus tremuloides Michx.), and balsam poplar (Populus balsamifera L.). Brush competition is also present: mountain maple (Acer spicatum Lam.), willows (Salix spp.), American mountain ash (Sorbus Americana Marshall), bitter-berry (Prunus virginiana L.), and beaked hazel (Corylus cornuta Marshall).
2.2. Experimental Design
Cedar plantations were started in the late 1980s in eastern Québec, and 614 hectares of cedar were planted on public land in the Bas-Saint-Laurent region as of 2013 [37]. Data was collected in the summer of 2015 on 22 of these plantations. The objective was to obtain a balanced sampling design inside and outside deer yards and between three age categories: Age-5 (5–8 years old), Age-15 (12–16 years old) and Age-25 (26–27 years old). However, the small number of Age-25 plantations and of Age-5 plantations within deer yards, as well as the heterogeneity between sites in terms of age, tree and shrub composition, and silvicultural treatment timing, prevented the achievement of a balanced design. Given the exploratory nature of this study, sites with few or no repetitions were still sampled in order to get a representative overall picture of cedar plantations. All sites were clear-cut, scarified, and planted with square spacing of 2 by 2 m (2500 stems per hectare) or 2.25 by 2.25 m (2000 stems per hectare) either with cedar only or with a mix of cedar and spruces. Sites were selected using Québec forest inventory maps. Age-15 and Age-25 plantations were planted at a density of 2500 stems per hectare, and Age-5 plantations at 2000 stems per hectare. Small planting stock (approx. 25 cm in height) was used in the Age-25 plantations, while large planting stock (approx. 40 cm height) was used in Age-5 and Age-15 plantations. In some cases, sparse residual cedars were maintained, and most Age-5 and Age-15 plantations were neighboring natural mature cedar patches. Mixed plantations were done by alternating species from one row to the next. All plantations were brushed and/or thinned. The selected plantations are located on mesic sites, which are common in the region [38] and where most cedar plantations were established.
Deer yards are home to small deer populations in the study area, and while their boundaries are stable on maps, their populations fluctuate through time. Site selection aimed at contrasting high deer browsing pressure inside deer yards with low deer browsing pressure outside deer yards (Table 1).
2.3. Sampling
On each site, six plots were established using a systematic grid with a random starting point; on five smaller sites, only five plots could be laid without overlap. In each plot, subplots were established. Trees of DBH (diameter at breast height) greater than 9.1 cm were diameter measured within a 400 m2 circular plot, and the height of three dominant trees was measured to determine canopy height. Five 40 m2 subplots (one central and one at each cardinal point, intersecting the 400 m2 plot boundary) and eight 4 m2 circular subplots (one in the centre of each external 40 m2 subplot and one halfway between the plot centre and the 400 m2 plot boundary at each cardinal point) were established in each plot. In the 40 m2 circular subplots, trees with a DBH of 1.0 to 9.0 cm were diameter measured, and a browsing score corresponding to the % of potentially available shoots (up to 3 m high to reflect maximum moose browsing reach [39]) that were actually browsed was given for each species following a scale from 0 to 4 (0 = no browse, 1 = 1–25%, 2 = 26–50%, 3 = 51–75%, 4 = 76–100%). The herbivore was also identified based on scars left on browsed twigs: cut (hare) or sheared (ungulate). In the 4 m2 subplots, all trees and shrubs of DBH <1 cm and taller than 10 cm were tallied by height class (10–30 cm, 31–130 cm, 131–225 cm, >225 cm, based on availability to deer browsing [40]). A visual estimate of cover (by 5% class) per species and height class was completed, and a browsing score was given for each species and each height class within the subplot. On the tallest cedar in each 40 m2 subplots (hereafter referred to as dominant cedars) and 4 m2 subplots, additional information was gathered: height, DBH, root collar diameter (D0), tree-level browsing score and herbivore, number and height class of forks on the stem, and presence of a curve at the base of the tree (deviation of at least 30° from verticality on the main stem within the first meter in height). Additionally, the dominant cedar in each central 40 m2 subplot (hereafter referred to as central tree) was selected for a detailed stem analysis. For each central tree, a disc was removed at the root collar and at each subsequent available 1 m height increment, and total height was measured. When forks were present, the stem with the greater diameter was selected for analysis. All collected discs were sanded and aged by two different observers to evaluate height growth through time. Discs collected at the root collar were scanned at high resolution and their ring widths were measured using the CooRecorder software [41]. To evaluate canopy closure, a hemispherical photograph was taken at a height of 1 m in the center of each plot early in the day under uniform sky lighting. Canopy closure (in %) was calculated using the DHPT software [42], which calculates canopy closure from hemispherical photographs using hue-enhancing methods and automatic thresholding calculations. Site characteristics such as slope, drainage, indicator species, and soil texture were evaluated to confirm that conditions were consistent between sites.
2.4. Statistical Analyses
In order to determine the most appropriate competition index (CI) for cedar diameter growth prediction, multiple linear mixed models were compared using the second-order Akaike information criterion corrected for small samples (AICc [43,44]). Nine distance-independent CI which proved satisfactory in other studies (Table 2) and the measured canopy closure were evaluated in models to determine which metric(s) to include in the growth model. Distance-dependent indices were not tested as spatial information on tree location was not collected and natural regeneration prevented inference from plantation spacing. CI were tested independently as adding them to the growth model selection would have created too many models to compare given the sample size and number of tested parameters [43]. The most appropriate CI for radial growth prediction was determined by fitting linear mixed models of root collar diameter growth as a function of each individual CI and the root collar diameter (Equation (1)). Multicollinearity between variables was tested using variance inflation factor (VIF) with a cut-off value of 3 [45]. The response variable was square-root transformed in order to meet linear mixed models assumptions.
where Diameter growth is the average annual diameter growth (in cm) at root collar over the last 3 years in order to reduce the interannual variations caused by environmental factors and climate, parameters are fixed effects, D0 is the root collar diameter of the subject tree (in cm), and is a random effect of each i site on the intercept. Average annual diameter growth was also tested for the last year and the last 5 years, with no major differences in the outcomes of the analyses.
To evaluate which measured factors had an effect on recent cedar diameter growth, multiple linear mixed models were compared using AICc, as in the CI selection process. The response variable was the average root collar diameter growth over the last 3 years. The tested independent variables were: root collar diameter (D0), hare browsing score for central tree (Hare), ungulate browsing score for central tree (Ungu), the previously selected CI, ratio of softwood basal area over the total basal area of each subplot (RATIO), plantation age (Age), and dummy variables for the presence of large planting stock size (Plant), wet microsite (Wet), curve at the base of the tree (Curve), and fork(s) below 30 cm height (Fr). Multicollinearity between variables was detected, so the Age and Plant factors were removed as other variables were deemed more influential. The null model (Equation (2)) was defined as including D0, and used the square root of diameter growth as a response variable in order to meet linear mixed models assumptions.
When using AICc for model selection, a model with an AICc weight ≥ 0.9 is supported strongly enough to justify the selection of the model [43]. In the absence of a model with an AICc weight ≥ 0.9, multimodel inference was used in order to obtain a weighted average of each parameter based on the AICc weight of each model containing the parameter [43]. Model averaging was applied to all models with an AICc weigth > 0.01 to avoid a bias away from 0 for underrepresented parameters [43]. When using model averaging, parameters which 95% confidence intervals excluded zero were considered good predictors of square-root transformed root collar diameter growth.
All statistical analyses were performed using the R statistical programming environment [46]. Linear mixed models were programmed using the lme4 package [47]. Pseudo-R2 for linear mixed models [48] were calculated using the MuMIn package [49]. Model selection and multimodel inference based on AICc were performed using the AICcmodavg package [50].
3. Results
3.1. Overview of Cedar Plantations
Seven plantation types were identified (Table 3). Age-5 plantations were free of dominant competition, except for both eight year old sites where deciduous species were starting to overgrow planted cedars. Information regarding stand history was incomplete, especially for Age-25 plantations, but all Age-15 and Age-25 plantations were brushed and/or thinned. While the timing of these silvicultural treatments was consistent within each stand type, it was not consistent from one stand type to the other (Appendix B and Appendix C). Age-15 plantations had open canopies (Table 3), and while the softwood competitors were taller than cedar, competition for light was still limited. On some Age-15 sites (sites 21 and 25), dominant cedars had attained merchantable diameter (>9 cm DBH). Age-25 sites had closed canopies (Table 3): two showed small cedars suppressed under a dominant spruce canopy, three showed cedars in an intermediate position under a dominant deciduous canopy (white birch, yellow birch, pin cherry, sugar maple), and one showed cedars in a codominant position alongside sparse balsam fir following a 2009 thinning of deciduous trees (Figure 2). Merchantable diameter was attained for 40–55% of cedars on the Age-25 plantations with deciduous cover and for 64% of cedars on the Age-25 plantation with thinned deciduous. Stem density on the Age-25 plantation with thinned deciduous is driven up by the high number of forks, while stem density on the Age-25 plantations with deciduous cover is driven down by the low survival rate on site 14.
Planted cedar survival rates exceeded 90% on all but three Age-25 plantations. Two of these plantations (sites 4 and 5) were planted with black spruce (50/50 ratio) and showed low survival within the first few years, which led to in-fill planting with spruce. On the remaining plantation (site 14), two of the six subplots were located in a poorly drained area and had low survival rates.
3.2. Forking
The proportion of forked cedar stems averages 45% for Age-5 plantations, 58% for Age-15 plantations and 26% for Age-25 plantations (Figure 3). However, within each age class, the proportion of forked stems varies substantially between sites and within stand types. 86% of all forks are located within the first 30 cm of the stem. Planted cedars are also susceptible to curving at the base of the tree, the proportion of curved stems averaging 11%.
3.3. Browsing
All plantations showed evidence of ungulate and/or hare browsing. However, browsing was generally concentrated on competitor species (shrubs and small trees such as beaked hazel, willows, mountain maple and pin cherry) on Age-5 and Age-15 plantations. Age-5 plantations generally had low abundance of competitor species, stand tending having occurred recently, and Age-15 sites had a high abundance of competitor species. Of all cedars available for browsing (>30 cm in height), 13% were browsed, and 83% of browsed cedar had <50% of available foliage consumed. One Age-5 plantation (site 23), located within the most densely populated part of the deer yard, had 29% of its cedar browsed by deer. All other Age-5 plantations showed little sign of cedar browsing, with less than 7% of cedars browsed by deer and no hare browsing. On Age-15 sites, both inside and outside the deer yard, browsing was highly variable but abundant on palatable competitive species (pin cherry, beaked hazel, mountain maple, willows) [54] and consistently sparse on cedar (Figure 4). One of the Age-15 plantations (site 26) was located in a moose rut area, itself located in a wildlife reserve with high moose populations, and showed clear signs of moose browsing, with high densities of beaked hazel systematically browsed at approx. 130 cm in height. Although fir was four times less abundant than cedar on that site, 85% of all fir was browsed, while 25% of cedar was browsed. Hare browsing on cedar was present on some Age-15 plantations, the ratio of hare-browsed cedar ranging from 0–19%. Both suppressed Age-25 plantations showed systematic hare browsing on suppressed cedar, with >40% of cedars having >50% of available foliage browsed. All other Age-15 and Age-25 plantations showed signs of light cedar browsing by hare and/or ungulates.
3.4. Competition Indices
Of the nine tested CI and the canopy closure metric, two had a lower AICc value than the null model (Table 4). The model with the lowest AICc value had an AICc weight ≥ 0.9, and BAL was therefore selected as the most reliable CI [43].
The selected CI was used to validate stand suppression. Age-15 and Age-5 sites had CI values below 1.44. The Age-25 pure cedar plantations had CI values ranging from 2.87 to 3.04, while the Age-25 mixed plantations (sites 4 and 5) had CI values between 5.01 and 5.68. This gap in CI values, as well as annual radial growth measurements, suggests that sites 4 and 5 were suppressed.
3.5. Cedar Growth
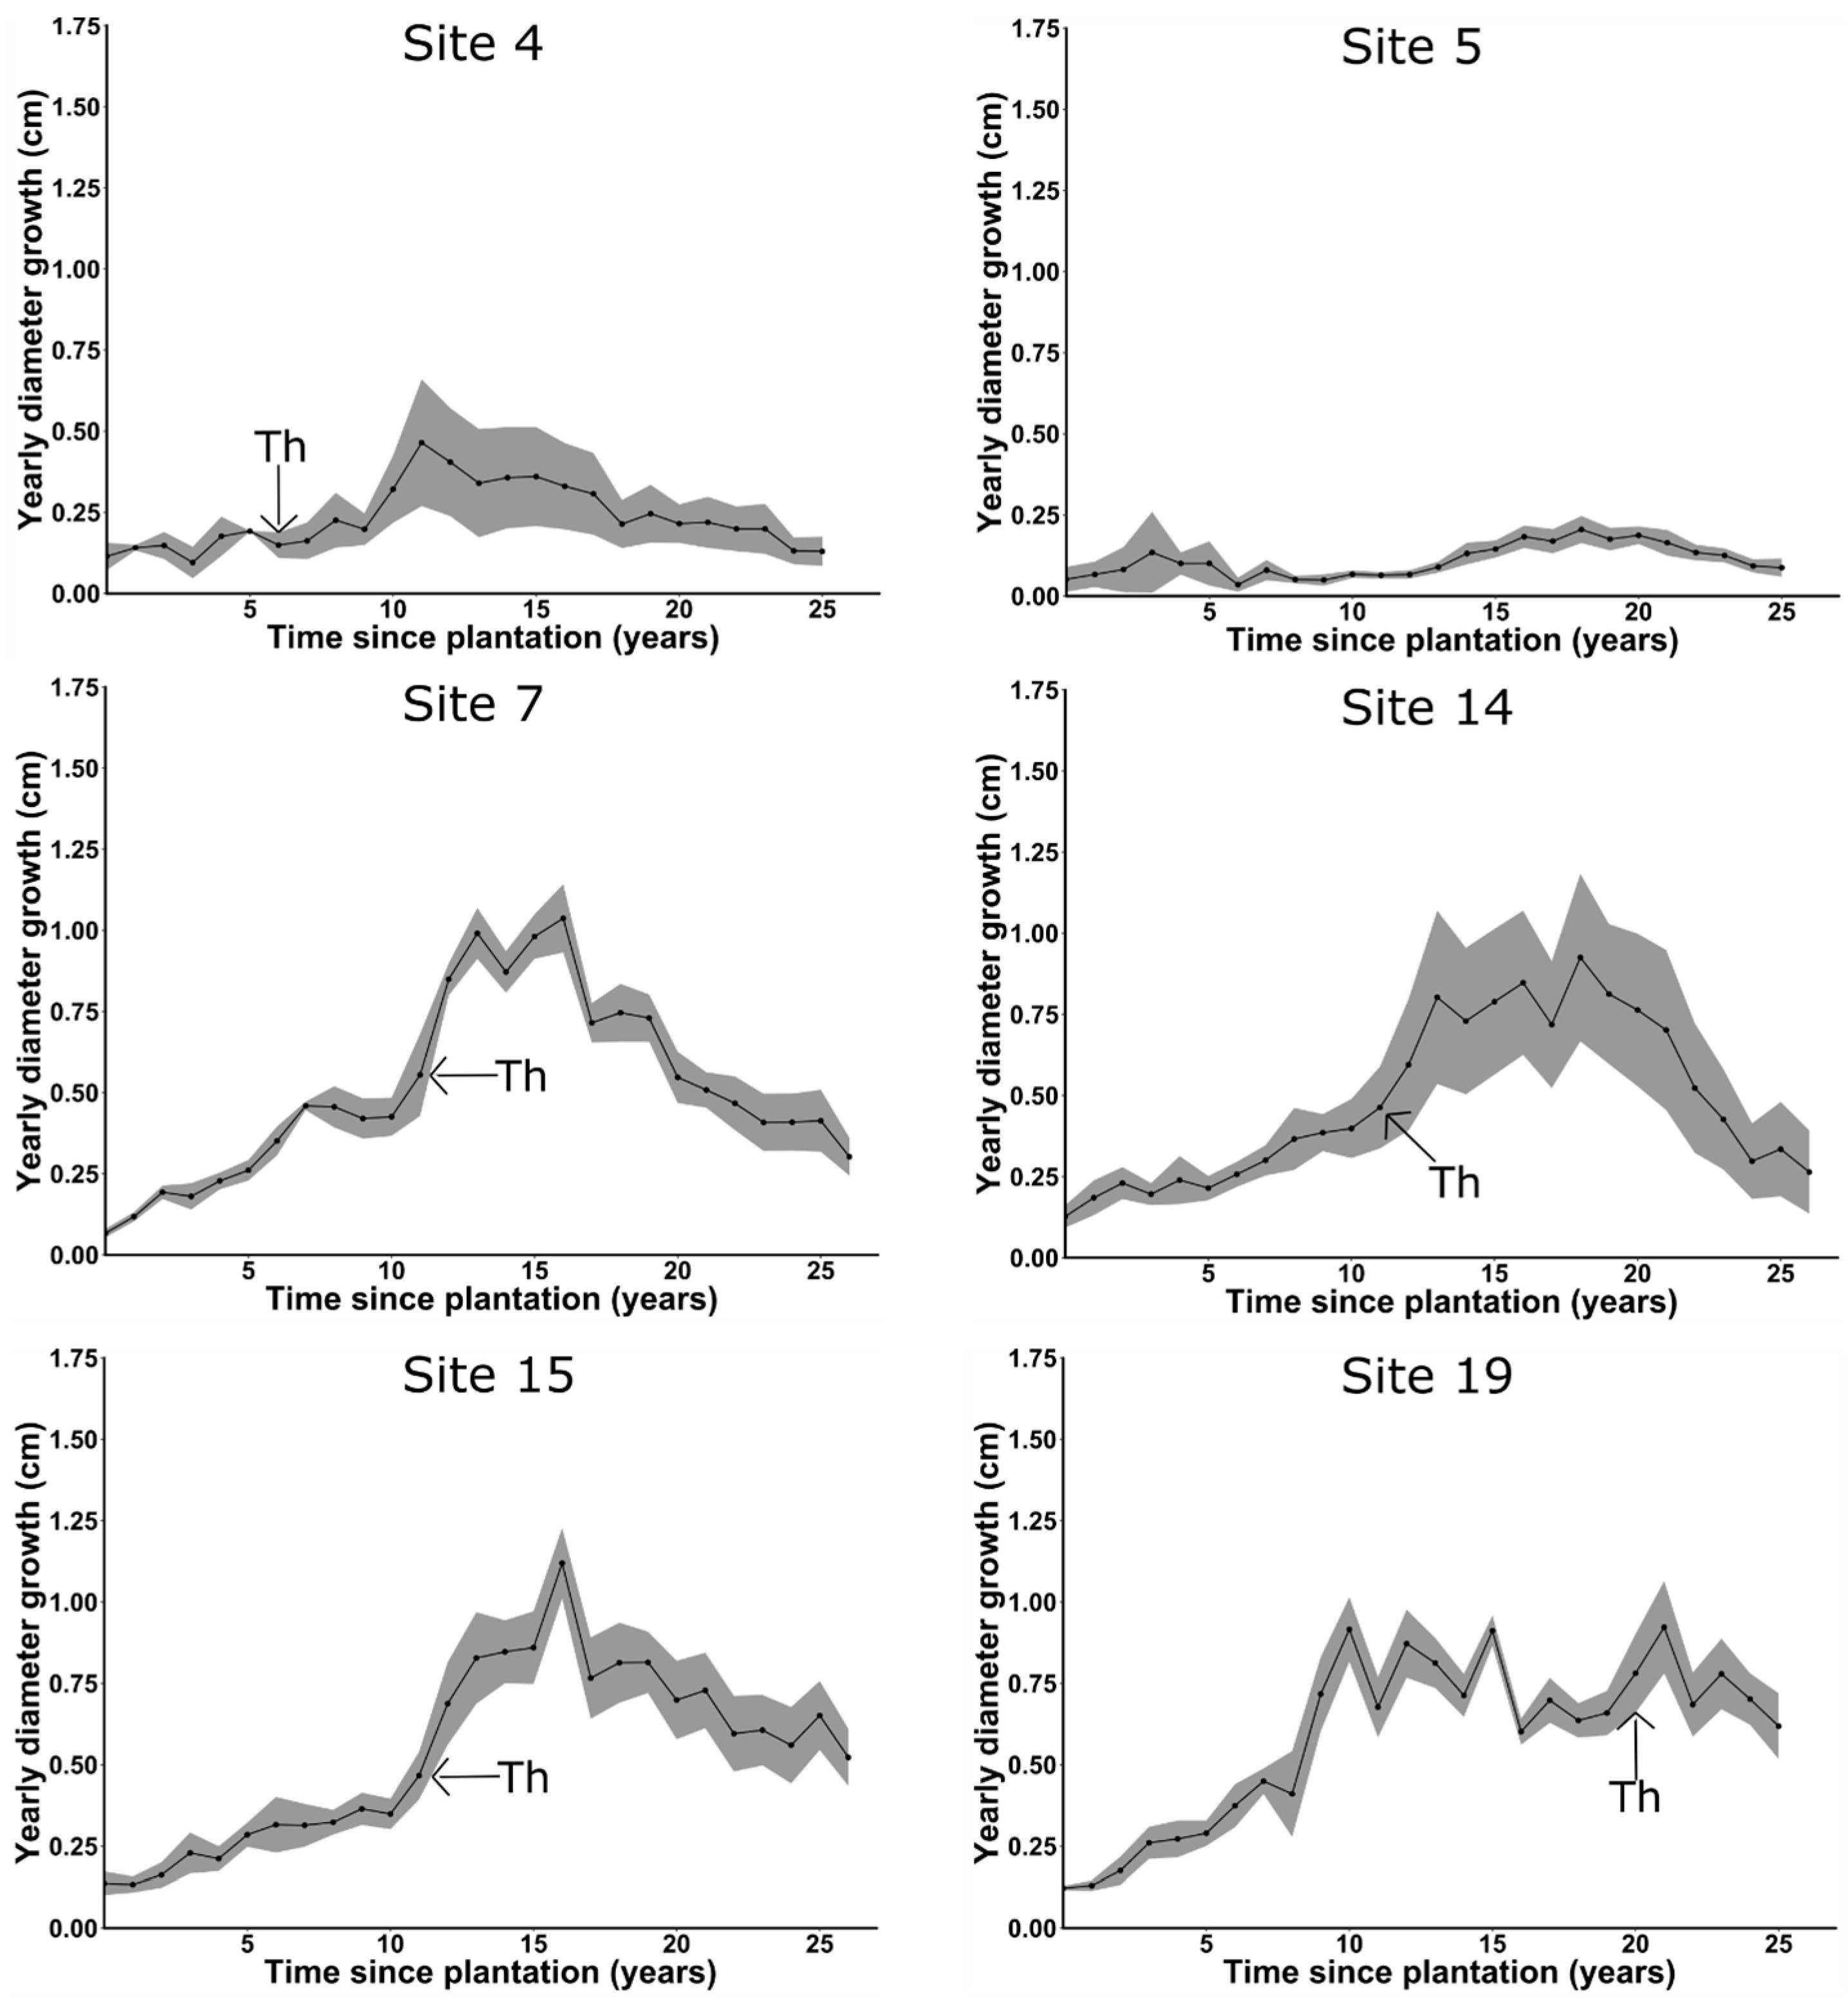
A reconstruction of age vs. height and age vs. root collar diameter growth was done for all non-suppressed plantations (Figure 5) in order to show planted cedar growth potential. Yearly cedar root collar diameter growth reached as high as 2.15 cm on cedars with no overtopping competition (site 13, Age-15). Average yearly root collar diameter growth peaked at 1.12 cm for Age-15 plantations, and at 0.69 cm for Age-25 plantations. Maximum cedar height averaged 860 cm after 26–27 years on non-suppressed Age-25 plantations, and height growth peaked at >50 cm/year for all three age categories. On suppressed sites (not shown in Figure 5 to better show the potential growth of cedar), diameter growth went as low as 0.01 cm in the case of systematically hare-browsed individuals (site 4, Age-25).
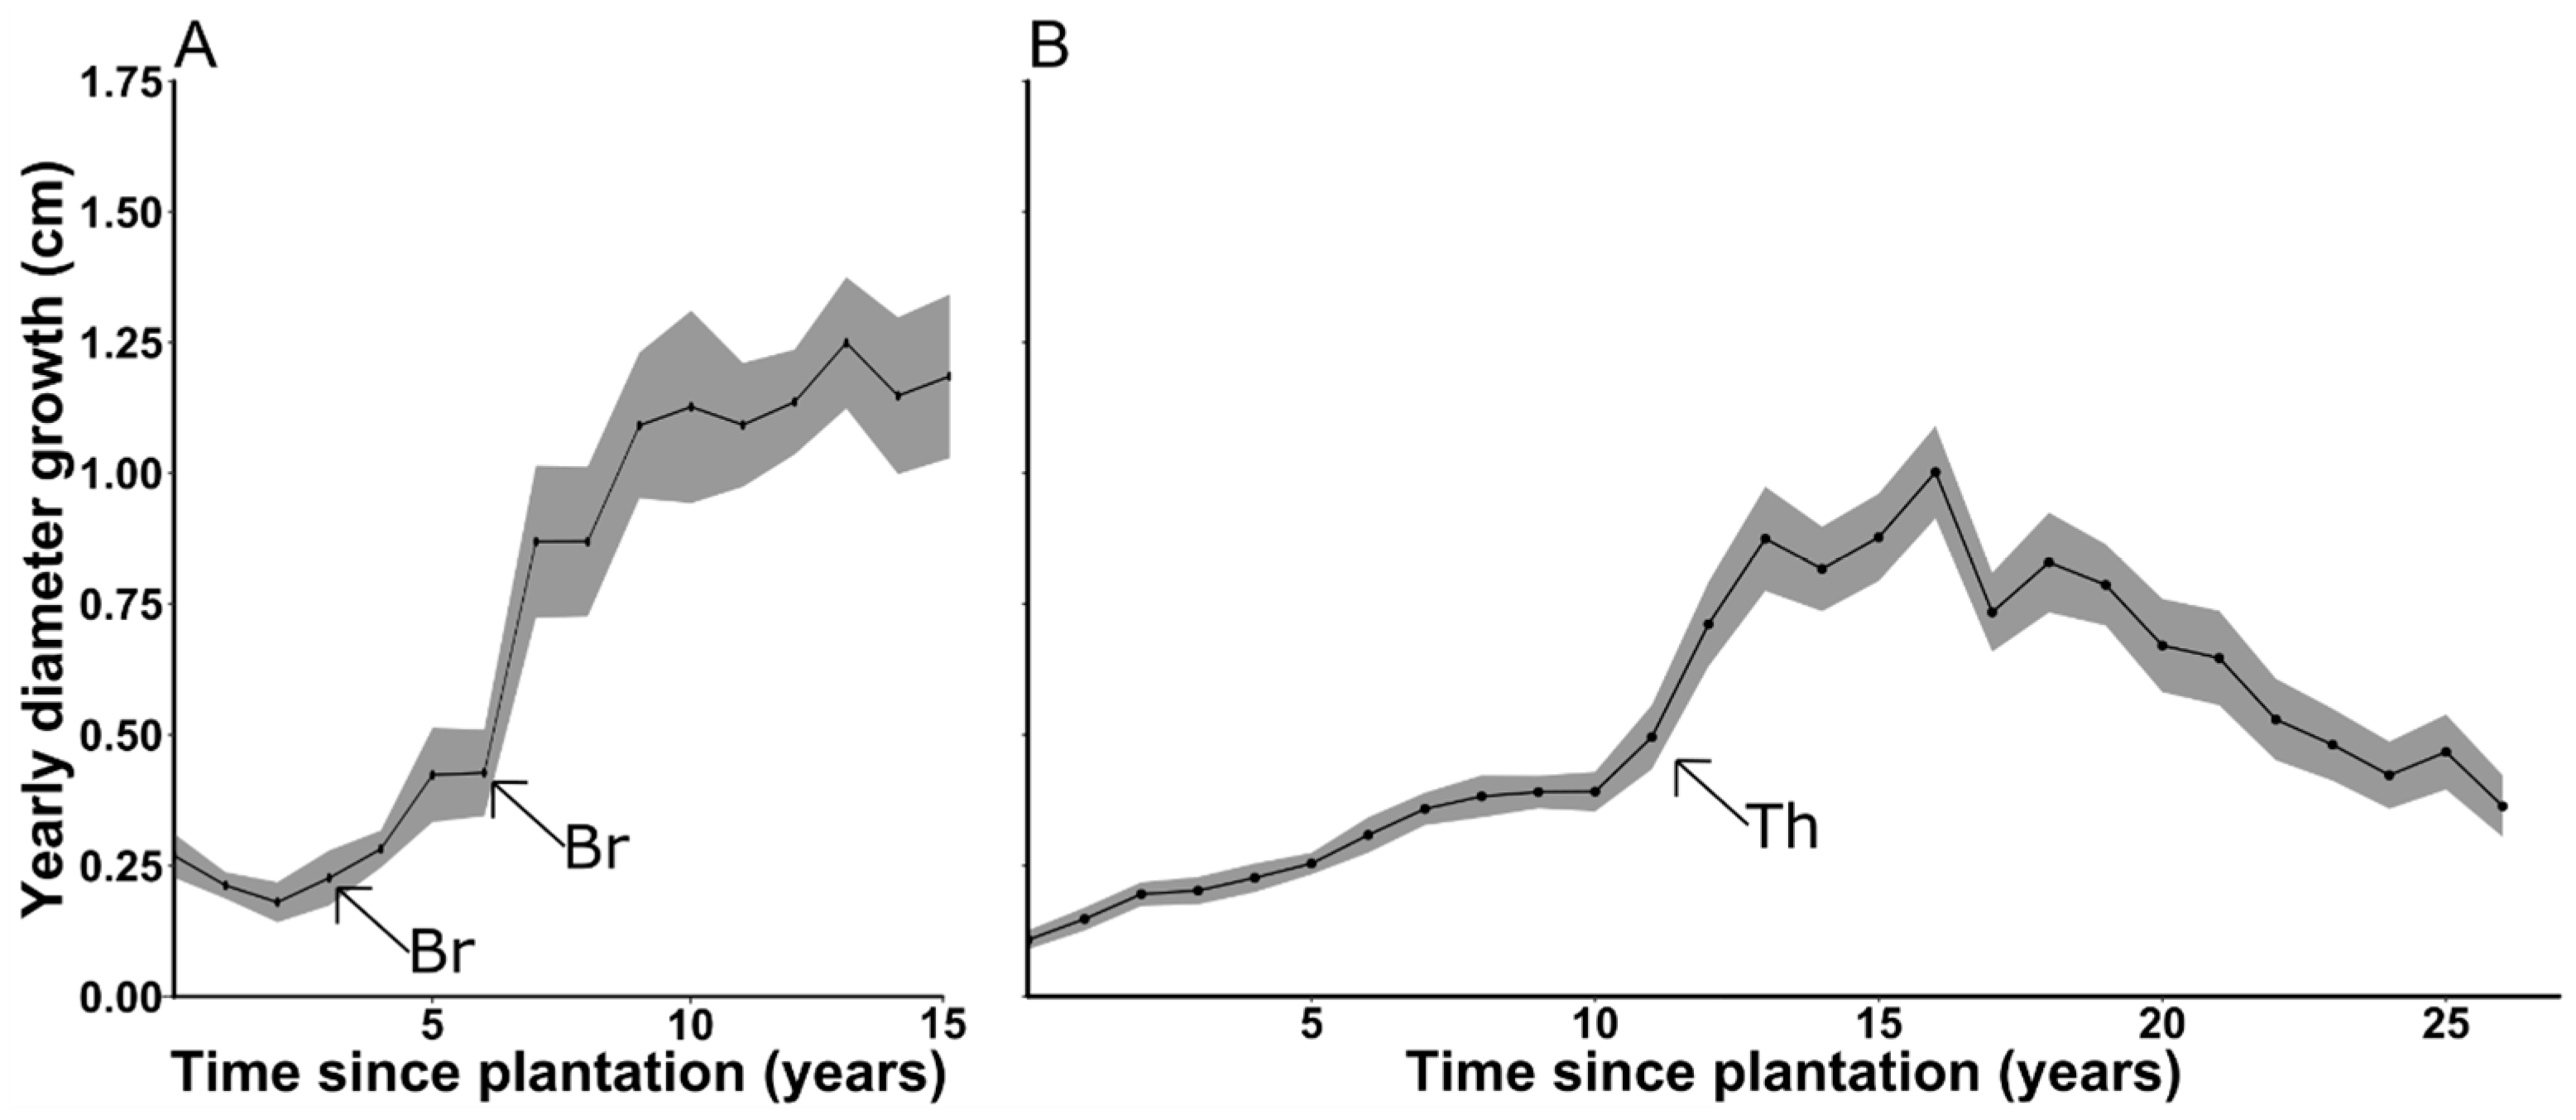
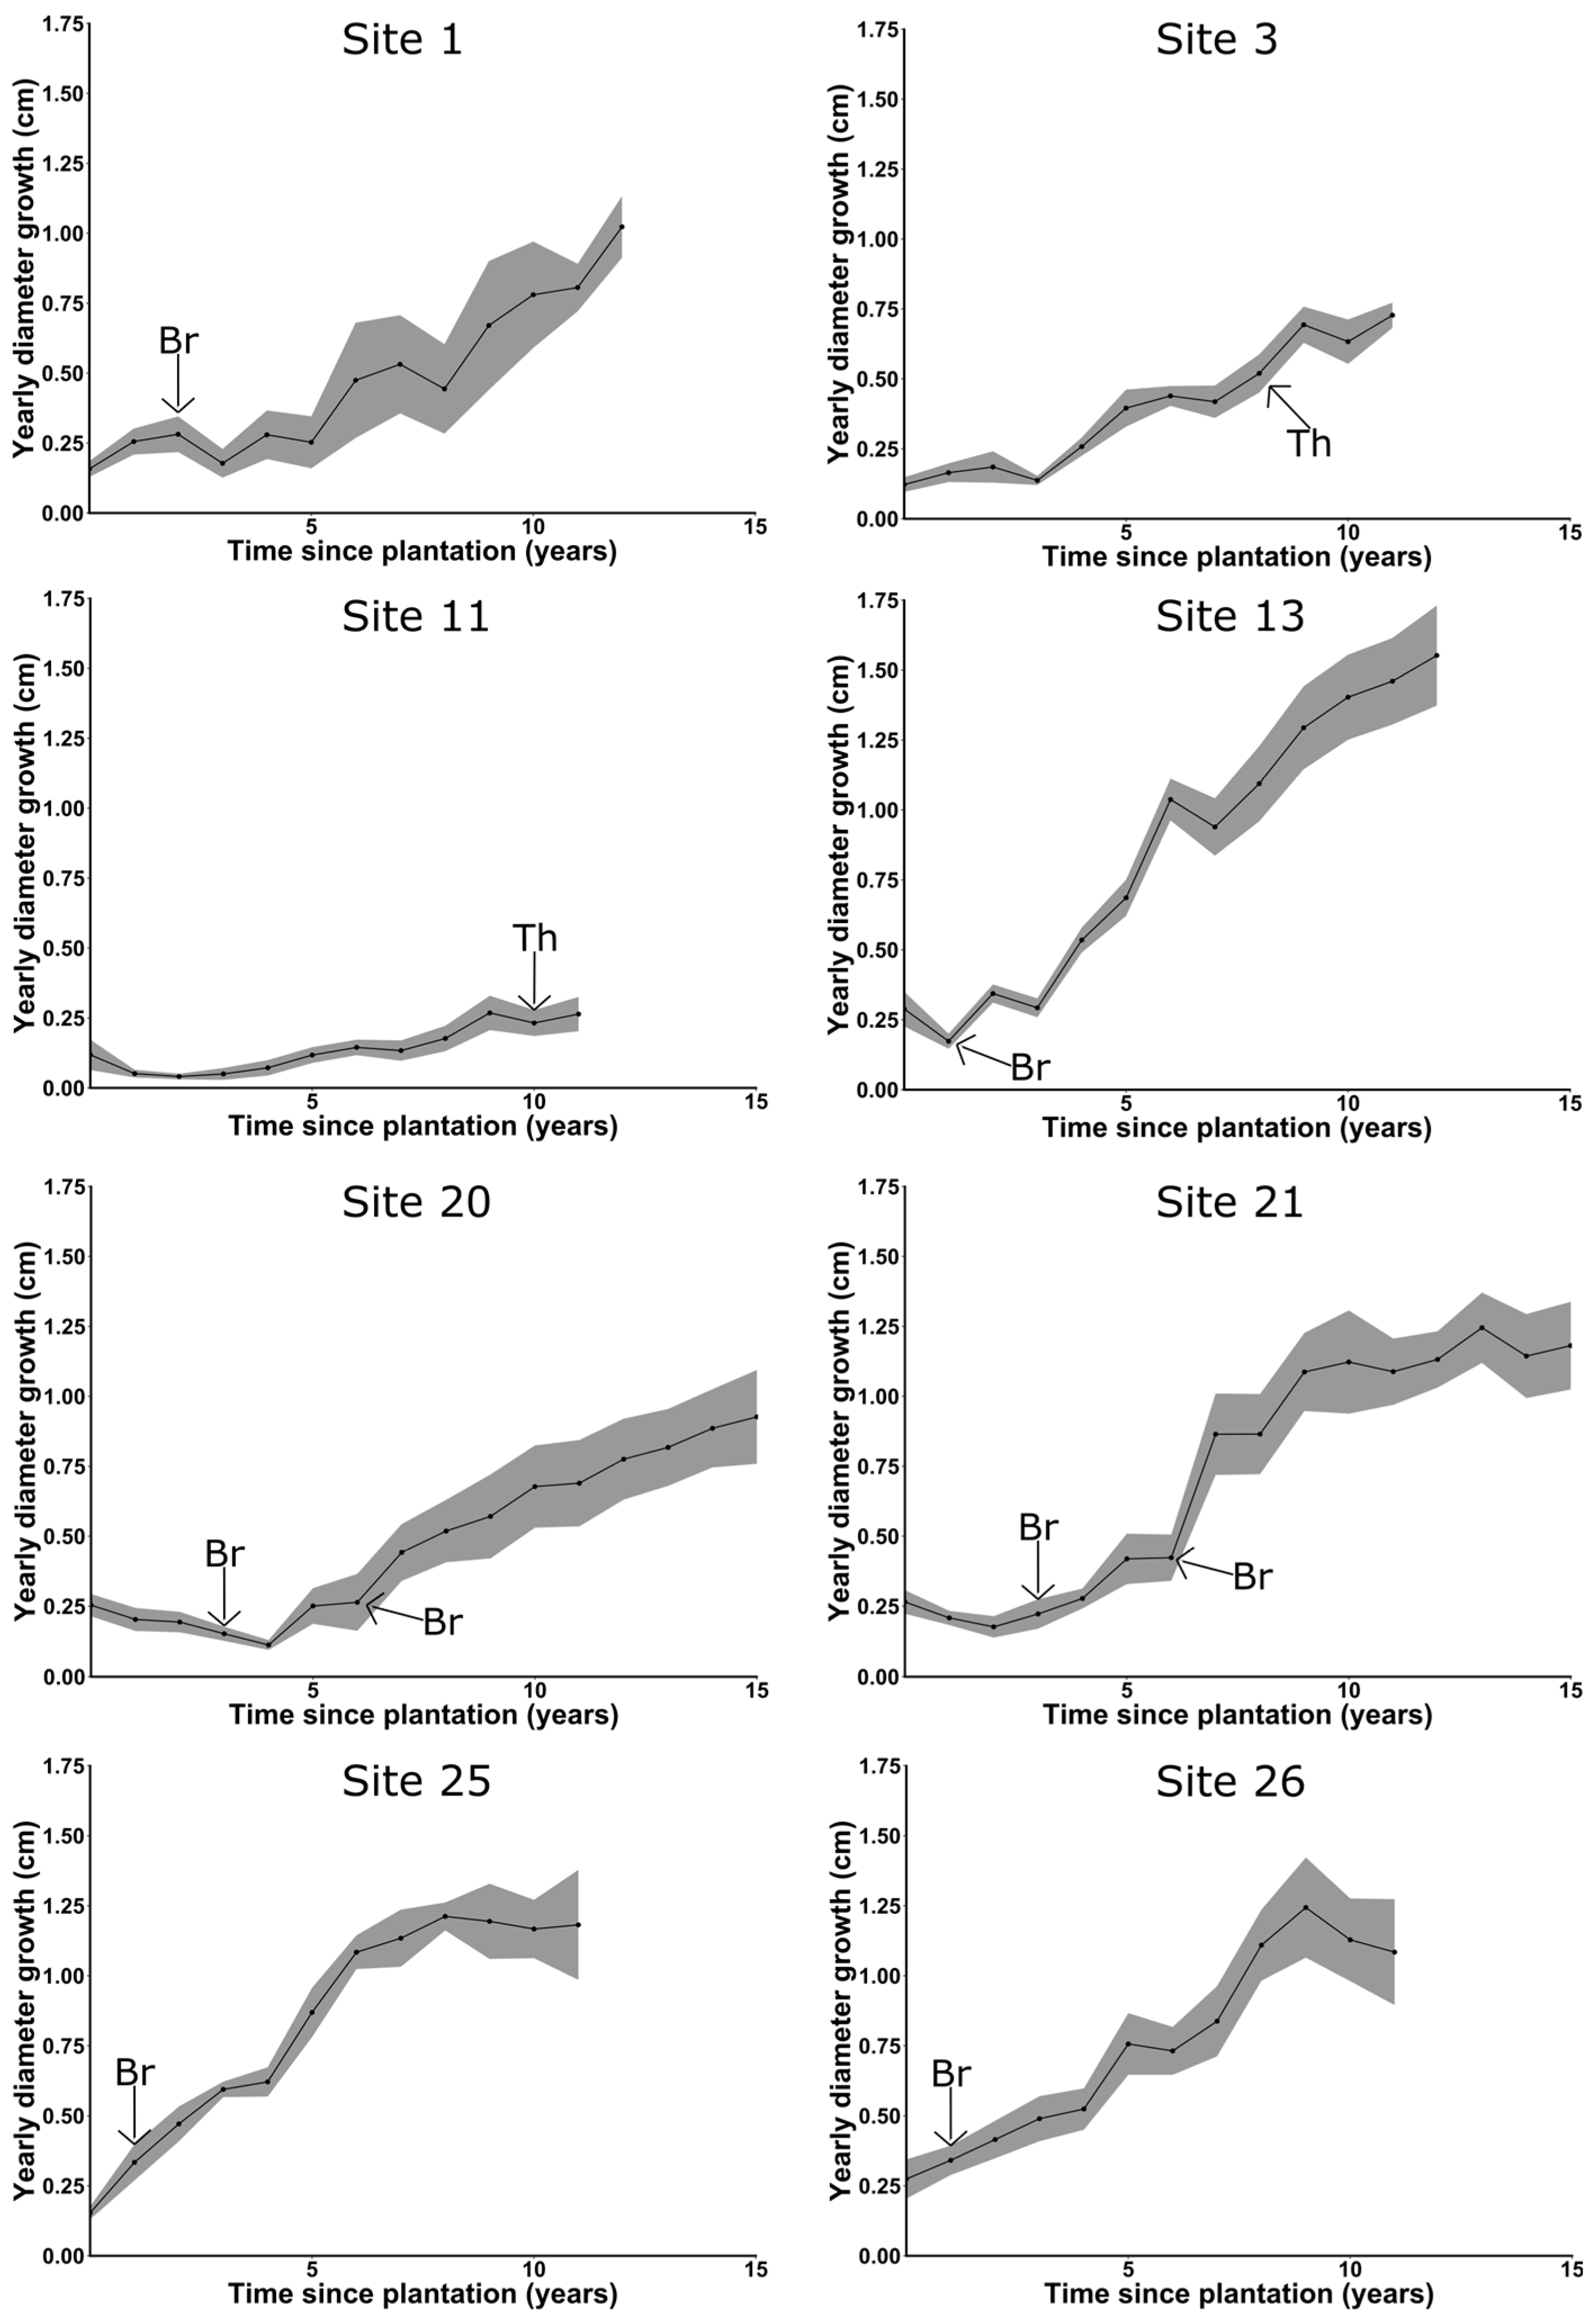
To portray cedar growth response to brushing or thinning, average root collar diameter growth as a function of time since plantation is shown for one Age-15, with fir plantation and for all Age-25, deciduous cover plantations (Figure 6). Not all sites could be regrouped on the same figure if growth releases were to be well portrayed because of inconsistencies in intervention timing between sites, and only two representative growth curves are shown for brevity (All sites are shown in Appendix A, Appendix B and Appendix C). Growth response of cedar to early brushing (1–3 years after plantation) is inconsistent in intensity between sites, but all brushed sites show a stable or decreasing growth rate just before brushing and a growth increase just after brushing. On non-suppressed Age-25 plantations, diameter growth rates doubled within 2 years following stand brushing or thinning, and were maintained for >5 years before declining.
Of the 52 tested models fitted to predict diameter growth, 12 had AICc weights > 0.01 (Table 5). All of these models contained the CI parameter, and none contained the Fr parameter. The unconditional confidence intervals (UCI) obtained with multimodel inference (Table 6) for CI and D0 excluded zero, which suggests that they contribute to explain root collar radial growth variation. The UCI obtained for Wet, Curve, RATIO, and the interactions between D0 and Hare and between D0 and Ungu included zero, which suggests that they did not contribute to root collar radial growth variation. The Fr parameter was not included in the top 12 models (Table 5), and no parameter estimate could therefore be calculated using model averaging. D0 is positively correlated with root collar radial growth, while CI is negatively correlated with root collar radial growth.
4. Discussion
To our knowledge, no previous study was conducted on cedar plantations established following clear-cutting. Results show that cedar plantations could be suitable for cedar restoration on rich sites and under low browsing pressure. Cedar growth was considerably higher than for natural cedar in other studies with low shade levels, i.e., after strip clear-cutting on rich swamps, with or without advanced regeneration [15,21]. While browsing was detected on most sites, it could not be linked to any detectable changes in growth rates. The high prevalence of forks on most sites and the lack of site history data also prevented drawing conclusions regarding a potential link between browsing and forking. Following release, planted cedar had a doubling in growth rate, and generally higher survival rates. While the reasons for the low survival of planted cedars on a small number of sites are unknown due to the lack of stand history data, possible causes include browsing, wet microsites, and the potential inability for manual brushers to see small cedar seedlings under competing vegetation.
4.1. Cedar Growth
Growth rates were highly variable between sites, and some of this variability could not be explained by the measured factors. For instance, 2-fold differences in diameter growth were observed between sites as soon as one year after planting, and can therefore not be attributed to competition. These differences could be attributed in part to planting and seedling quality, and did not seem to affect growth for subsequent years.
The analysis of growth rate through time (Figure A1, Figure A2 and Figure A3) shows that all Age-15 and Age-25 plantations were suppressed to some extent under competing vegetation at a young age. However, all but both suppressed Age-25 plantations had healthy live crowns and did not show signs of imminent mortality (>50% live crown ratios). Although the growth response to brushing of Age-15 plantations was inconsistent between sites, growth rates continued to increase more than 10 years after brushing (Figure 5A and Figure A2), likely due to the limited competition by softwood and the consequently open canopy. As Age-5 and Age-15 plantations still had open canopies, fast growing competing vegetation such as pin cherry and mountain maple could still pose a competition problem should they come back after brushing. In contrast, non-suppressed Age-25 plantations were brushed 10–11 years after planting, and while their growth rates increased slowly during the first 10 years, they doubled within 2 years after brushing. Growth rates then remained stable for the Age-25, thinned deciduous plantation, likely due to the still fairly low canopy closure level, while they stabilised and then declined after a few years for the Age-25, deciduous cover plantations (Figure 5B and Figure A3), likely due to the presence of an overtopping deciduous canopy. This growth decline suggests that non-suppressed Age-25 cedars could benefit from the thinning of their overtopping deciduous competitors, which would allow for a growth release and leave dense, nearly pure, and well-established cedar stands. This thinning intervention is not necessary for cedar survival, as cedar can survive for extended periods in a suppressed position and still react well to release [13,32,33]. However, in the context of cedar production, thinning should significantly shorten the duration of the rotation by avoiding the suppressed stage altogether.
The competition index (CI) was used to quantify the relative competition for cedar trees and was identified as a contributing factor for variations in cedar growth [51]. It was a better predictor of cedar growth than the canopy closure metric. The ratio of softwood basal area to total basal area (RATIO) was tested as a factor affecting cedar growth rates because softwood cover and browse are preferred during the winter by both deer and hare [55] and because an increase in softwood content has been linked to a decrease in diameter growth after partial cutting [33]. However, it was not identified as a contributing factor to variations in cedar growth, which can be explained in part by the high RATIO values found on most sites and by the lower influence of RATIO values on sites with open canopies.
4.2. Forking
Forking had no significant influence on cedar growth in this study on a 27-year timeframe. However, forks cause structural weaknesses, which could be problematic considering the low density and structural weakness of cedar wood [27]. Fork presence also has consequences for cedar processing, as cedar mills generally cannot process forked stems. Forks located at the base of the tree reduce the usable volume, while forks located higher on the stem could prevent a stem from meeting minimum length requirements. The impact should be smaller for shingle production as the process can use smaller sections and therefore allow for the elimination of the fork without discarding the entire log, but substantial waste nonetheless remains. Forks could also be an entryway for pathogens causing wood decay, which is thought to cause cedar to allocate more resources to defense mechanisms at the expense of growth [56].
The lack of stand history data hinders the identification of the causes of forking in the studied plantations. However, the high frequency of forked stems in all plantation types (Figure 3) is consistent with the known tendency of cedar to fork [1], except for the Age-25, deciduous cover plantations and the Age-25, mixed cedar-spruce plantations, where few forks were observed. Possible causes of forking include browsing, which breaks apical dominance [20] and causes the replacement of the damaged branch by an adjacent branch [28], damage by snow and frost, and low apical dominance [1]. However, as 86% of forks are located within the first 30 cm of height of the tree, the cause of forking is likely not ungulate browsing, as winter browsing availability starts at tree height 30–50 cm due to snow cover [40]. High light availability is a more likely cause of stem forking in this study; Logan [29] found near-consistent forking at the root collar of planted cedar, and found that cedar forking was exacerbated under full light conditions by the considerable increase in foliage and branch development. The lower prevalence of forked stems in the Age-25, deciduous cover plantations could therefore be explained in part by the presence of overtopping deciduous competition during the first years of the plantation, and in part by the use of small seedlings which would have less time to fork in the high light availability of the nursery. In this context, the presence of overtopping deciduous competition could be beneficial for cedar in terms of stem form, especially considering its shade tolerance.
All nursery stock has to meet strict criteria for plantation, and manual fork clipping can be done in some circumstances to meet these criteria. Cedar is however distinct from typically planted softwoods such as spruce and pine, notably because of its low apical dominance, its sylleptic growth [28], and its marked tendency to fork, particularly in response to trauma. Observation of cedar production at the nursery which provided cedar seedlings for the study area and of recent cedar plantations aged <2 months confirms that forking is already common at the time of planting. Future work on cedar plantations should therefore give more attention to planting stock production and planting process in order to determine the exact causes behind stem forking <30 cm.
4.3. Browsing
Although the sampling was designed to compare browsing impacts inside and outside mapped deer yards, cedar recruitment into safe-from-browsing height classes (>3 m) was not a general problem in the study area, in contrast to reports originating from areas with high deer or hare browsing pressure [21,23,55]. As the deer yard populations change considerably through time, not all plantations were located in zones with high deer density during vulnerable years. Within the yard, none of the Age-25 plantations and half of the Age-15 plantations were in contact with high deer populations as the population had gone down substantially and dispersed towards the northern end of the yard [35,57]. The remaining plantations were close to known deer populations from the plantation year onward, and were therefore more likely to have been subject to winter deer browsing. Only the two suppressed Age-25 plantations showed recruitment problems, and only one site, located inside the deer yard, had a high number of cedar stems browsed by deer. This browsing remained at a low level, and its influence on cedar growth could not be detected as only one of its central trees happened to have been browsed. Cedar was near-systematically browsed by deer on non-suppressed Age-25 sites, but the damage was limited to the first 2 m of the 6–8 m high stems, and was therefore considered non-limiting to cedar height growth. While moose populations are low over most of the natural range of cedar, they are very high in the study area, averaging 11.4 individuals/10 km2 over the region [58]. Moose browsing on cedar was however restricted to a single site and remained at a low frequency and intensity, which confirms the limited preferential browsing of cedar by moose [24]. Cedar browsing was observed on most sites and was constant within sites, but varied in prevalence and intensity between sites (Figure 4). Given the consistency of browsing within sites and the use of sites as a random effect factor in the mixed models, not identifying browsing as a factor contributing to variations in cedar growth was expected, the site effect being confounded to some extent with the browsing effect. Moreover, browsing damage can become undetectable through time and could be too recent for its impact to be detectable on cedar growth given that the sampling year was not included in the growth models in order to analyze only complete growth years.
Ungulates and hares did not generally browse on the same sites, but no differences in stand characteristics could be associated to this selection. Within deer yards, deer select their habitat based not only on browse availability and cover, but also on the characteristics of surrounding sites, connectivity, and stand shape [3]. While the little amount of deer browsing on cedar can be partly explained by the currently low deer population levels, deer could also be avoiding young cedar plantations because of their lack of winter cover, especially when located farther away from forest edges [3].
Hare browsing was more abundant than ungulate browsing in the study area, which is consistent with the fact that although hare damage is recognized as less detrimental than deer damage, the opposite can be observed locally on natural cedar regeneration [1,23]. All Age-25 plantations and Age-15 plantations with spruce or fir provide good winter cover for hare, and have abundant winter browse in the form of cedar. For instance, all cedars on both suppressed Age-25 sites with dense spruce canopies had their terminal shoots and branches systematically browsed by hare, which likely created constant resprouting and prevented the creation of sizeable forks. Planting cedar together with a faster growing softwood such as spruce could accelerate the creation of good hare winter cover, therefore increasing the vulnerability of cedar to browsing before it can reach a safe-from-browsing height.
Both inside and outside the deer yard, ungulates appeared to have preferentially browsed fir over cedar, and preferentially browsed palatable competitor species (beaked hazel, willows, yellow and white birch, mountain maple and pin cherry) over cedar. This browsing decreased competition, and could therefore be a factor contributing to the high cedar growth rates observed in this study [19]. The species associated with cedar could also influence the susceptibility of cedar to browsing: the presence of a palatable neighbour could increase detection and damage by herbivores (associative susceptibility [59,60]), or concentrate browsing on these palatable neighbours, therefore decreasing browsing on cedar (neighbour contrast defense [61]); on the other hand, the presence of unpalatable neighbours could decrease detection and damage by herbivores (associative resistance [59,60]), or redirect browsing towards cedar (neighbour contrast susceptibility [61]). In this study, the homogeneity of species communities within age categories prevented further statistical analysis, palatable competitive species being abundant and systematically browsed on all sites with open canopy. However, the ratio of unbrowsed cedar remained constant within deer yard while the ratio of unbrowsed competitive species declined within deer yard, which suggests neighbour contrast defense and/or associative resistance. The indirect effects that browsing on competing vegetation has on cedar could therefore have a considerable influence on cedar regeneration and development, and should be further investigated in a more controlled experiment.
4.4. Management Implications
Some authors suggest that cedar becomes safe from browsing once it reaches 2 m in height [7]. However, considering the high browsing pressure in some areas and the effective winter browsing reach of deer and hare, a more conservative minimum safe height to avoid overbrowsing can be fixed at 3 m, height at which the top third of the tree is generally safe from browsing [21]. This safe-from-browsing height does not take moose into account as moose browsing on cedar appears less preferential and is generally not recognized as a problem for tall cedar recruitment [24], as was observed in this study. Results show that a safe-from-browsing height of 3 m can be reached within 13 years, on average, for non-suppressed sites and under low browsing pressure, and within 9 years on sites where overtopping competition was never present (Figure 5). This suggests that under similar growing conditions and with proper timing of silvicultural treatments, a 10-year browser exclusion would be sufficient to obtain a safe-from-browsing planted cedar stand.
This study drew a first portrait of cedar plantation development, and direct growth rate comparisons with other studies are therefore imperfect. However, given the ability of cedar to produce advanced regeneration because of its high shade tolerance and layering potential [1] and its ability to react well to stand openings even after a long suppression period [13,32,33], the comparison is deemed pertinent to assess the full growth potential of the species. Maximum height growth rate for short cedars (<200 cm) under full light conditions was more than double the maximum height growth rate observed under a 25–36% canopy transmittance on sites of lower fertility in Québec [34]. Similarly, maximum height growth rate for tall cedars (>200 cm) was more than double that of mature even-aged cedar stands on rich and wet sites in Vermont [31]. On rich swamps in Michigan, cedars remained vulnerable to browsing for 20–40 years following strip clear-cutting in cedar stands in the absence of competition and deer browsing [15,21], while cedars reached 2 m after an average of 36 years under partial shade and lower fertility in Québec [34], and after 30–50 years under shade and high fertility in Minnesota [7]. Old stems harvested in Maine on fertile sites were found to reach 1 m in as little as 4 years and 4 m in as little as 19 years [32].
This study confirms previous findings suggesting that cedar can be, under the right conditions, a productive softwood species [34,56]. While cedar is shade tolerant and often starts growing in the shade as advanced regeneration [32], it can reach considerable growth rates under low browsing pressure and competition. The growth rates measured in this study, twice as high as previously reported, suggest that cedar could be regenerated by taking advantage of much narrower windows of opportunity than previously thought. Such was seemingly the case in the deer yard evaluated in this study, where most of the plantations were able to reach safe-from-browsing heights with no detectable growth suppression from browsing.
The much lower proportion of forked stems in the Age-25, deciduous cover plantations suggests that in the presence of deciduous competition, delaying brushing operations until cedars are well established could, while reducing initial growth rates, lead to less forking. Species such as pin cherry, white birch and mountain maple could contribute, to a certain extent, to the development of cedars with stem forms that are more suitable for processing. The presence of overtopping deciduous competition could also lead to a complementary use of resources [62]. For example, spatial complementarity in tree crowns between cedar and its competitors could optimize light-use efficiency at the stand level and even lead to stem biomass overyielding [63]. Avoiding cedar plantations contiguous to forests providing good winter cover could also contribute to a decreased likelihood of browsing, as could avoiding brushing operations to leave a barrier in the form of competitor species. Browsing on competitor species could also have a positive impact on cedar growth by reducing light and resource competition.
While the recruitment of natural regeneration to height classes above browsing levels can be problematic in the presence of high deer or hare populations, this study shows that cedar plantations established after clearcutting can reach considerable growth rates in the absence of high browsing pressure and competition, and remain vulnerable to browsing for as little as 9 years. Moreover, although deer populations were small in the study area, the low browsing pressure observed on cedar plantations located within deer yards is promising for cedar regeneration through plantation and through the release of advanced regeneration following harvesting operations. As a large part of the cedar harvest comes from natural mixed stands with cedar as a minor component [34], cedar plantations are not a panacea against cedar decline. However, this study shows that cedar plantations could contribute to alleviate the pressure on natural cedar stands by producing cedar with a much higher yield than natural stands. By increasing the abundance of cedar through plantations, the pressure on natural cedar stands should decline. Considering the long-standing decline in cedar, cedar plantations could also contribute to the restoration of the species, especially in areas where little or no cedar remains, and thus to the conservation of native biodiversity on a landscape level [64] and to long-term deer yard quality [3,4].
5. Conclusions
Scientific knowledge of cedar is still limited, and more research is needed on the longer term productivity of cedar plantations, as well as on the quality of planted cedar products. The fast growth of cedar in plantations could influence its rot resistance and lead to inferior structural properties, but could provide wood with less heart rot given its increased growth rate and resource availability. Given that planted cedars show overall high proportions of forked stems with high variability between sites and that little is known on the factors leading to fork development in both natural and planted cedars, attention should also be given to improving our understanding of cedar fork development.
Considering that shaded cedars seem to form less forks than cedars growing in full light, mixed plantations or plantations with retention of natural regeneration could be considered for cedar production, and future research could focus on the potential complementarity between cedar and other commercial species.
This study suggests that the presence of a managed deer yard does not automatically indicate high deer browsing pressure on cedar. Variations in deer abundance through time, contraction of deer population within deer yard, deer displacement within or outside the recognized deer yard, as well as browse availability, species associations, cover, connectivity, and the characteristics of surrounding sites can influence deer browsing pressure within deer yards. However, deer yard boundaries and the guideline to avoid cedar harvesting both remain stable through time. While this strategy protects existing cedar, it does not guarantee cedar regeneration and the preservation of deer yard quality through time. Windows of opportunity during which deer populations are lower in certain areas of the deer yard could be seen as good opportunities to improve cedar regeneration thanks to lower browsing pressure. The possibility to relax the no-cedar-harvest guideline could also be investigated in order to determine its potential to improve cedar regeneration and therefore guarantee the long term presence of cedar in deer yards.
Acknowledgments
This study was funded by the Fonds de recherche du Québec—Nature et technologies (FRQNT). The authors thank Luc Gagnon—MFFP, Direction de la gestion des forêts du Bas-Saint-Laurent—for providing data, Jérôme Laliberté for help conducting field work, and Catherine Larouche and Martin Barrette—MFFP , Direction de la recherche forestière—as well as three anonymous reviewers, for comments that greatly improved the manuscript.
Author Contributions
All authors designed the experiment. Olivier Villemaire-Côté collected and analysed the data and wrote the paper, with significant contributions from Jean-Claude Ruel and considerable input from Luc Sirois.
Conflicts of Interest
The authors declare no conflict of interest.
Appendix A
Figure A1.
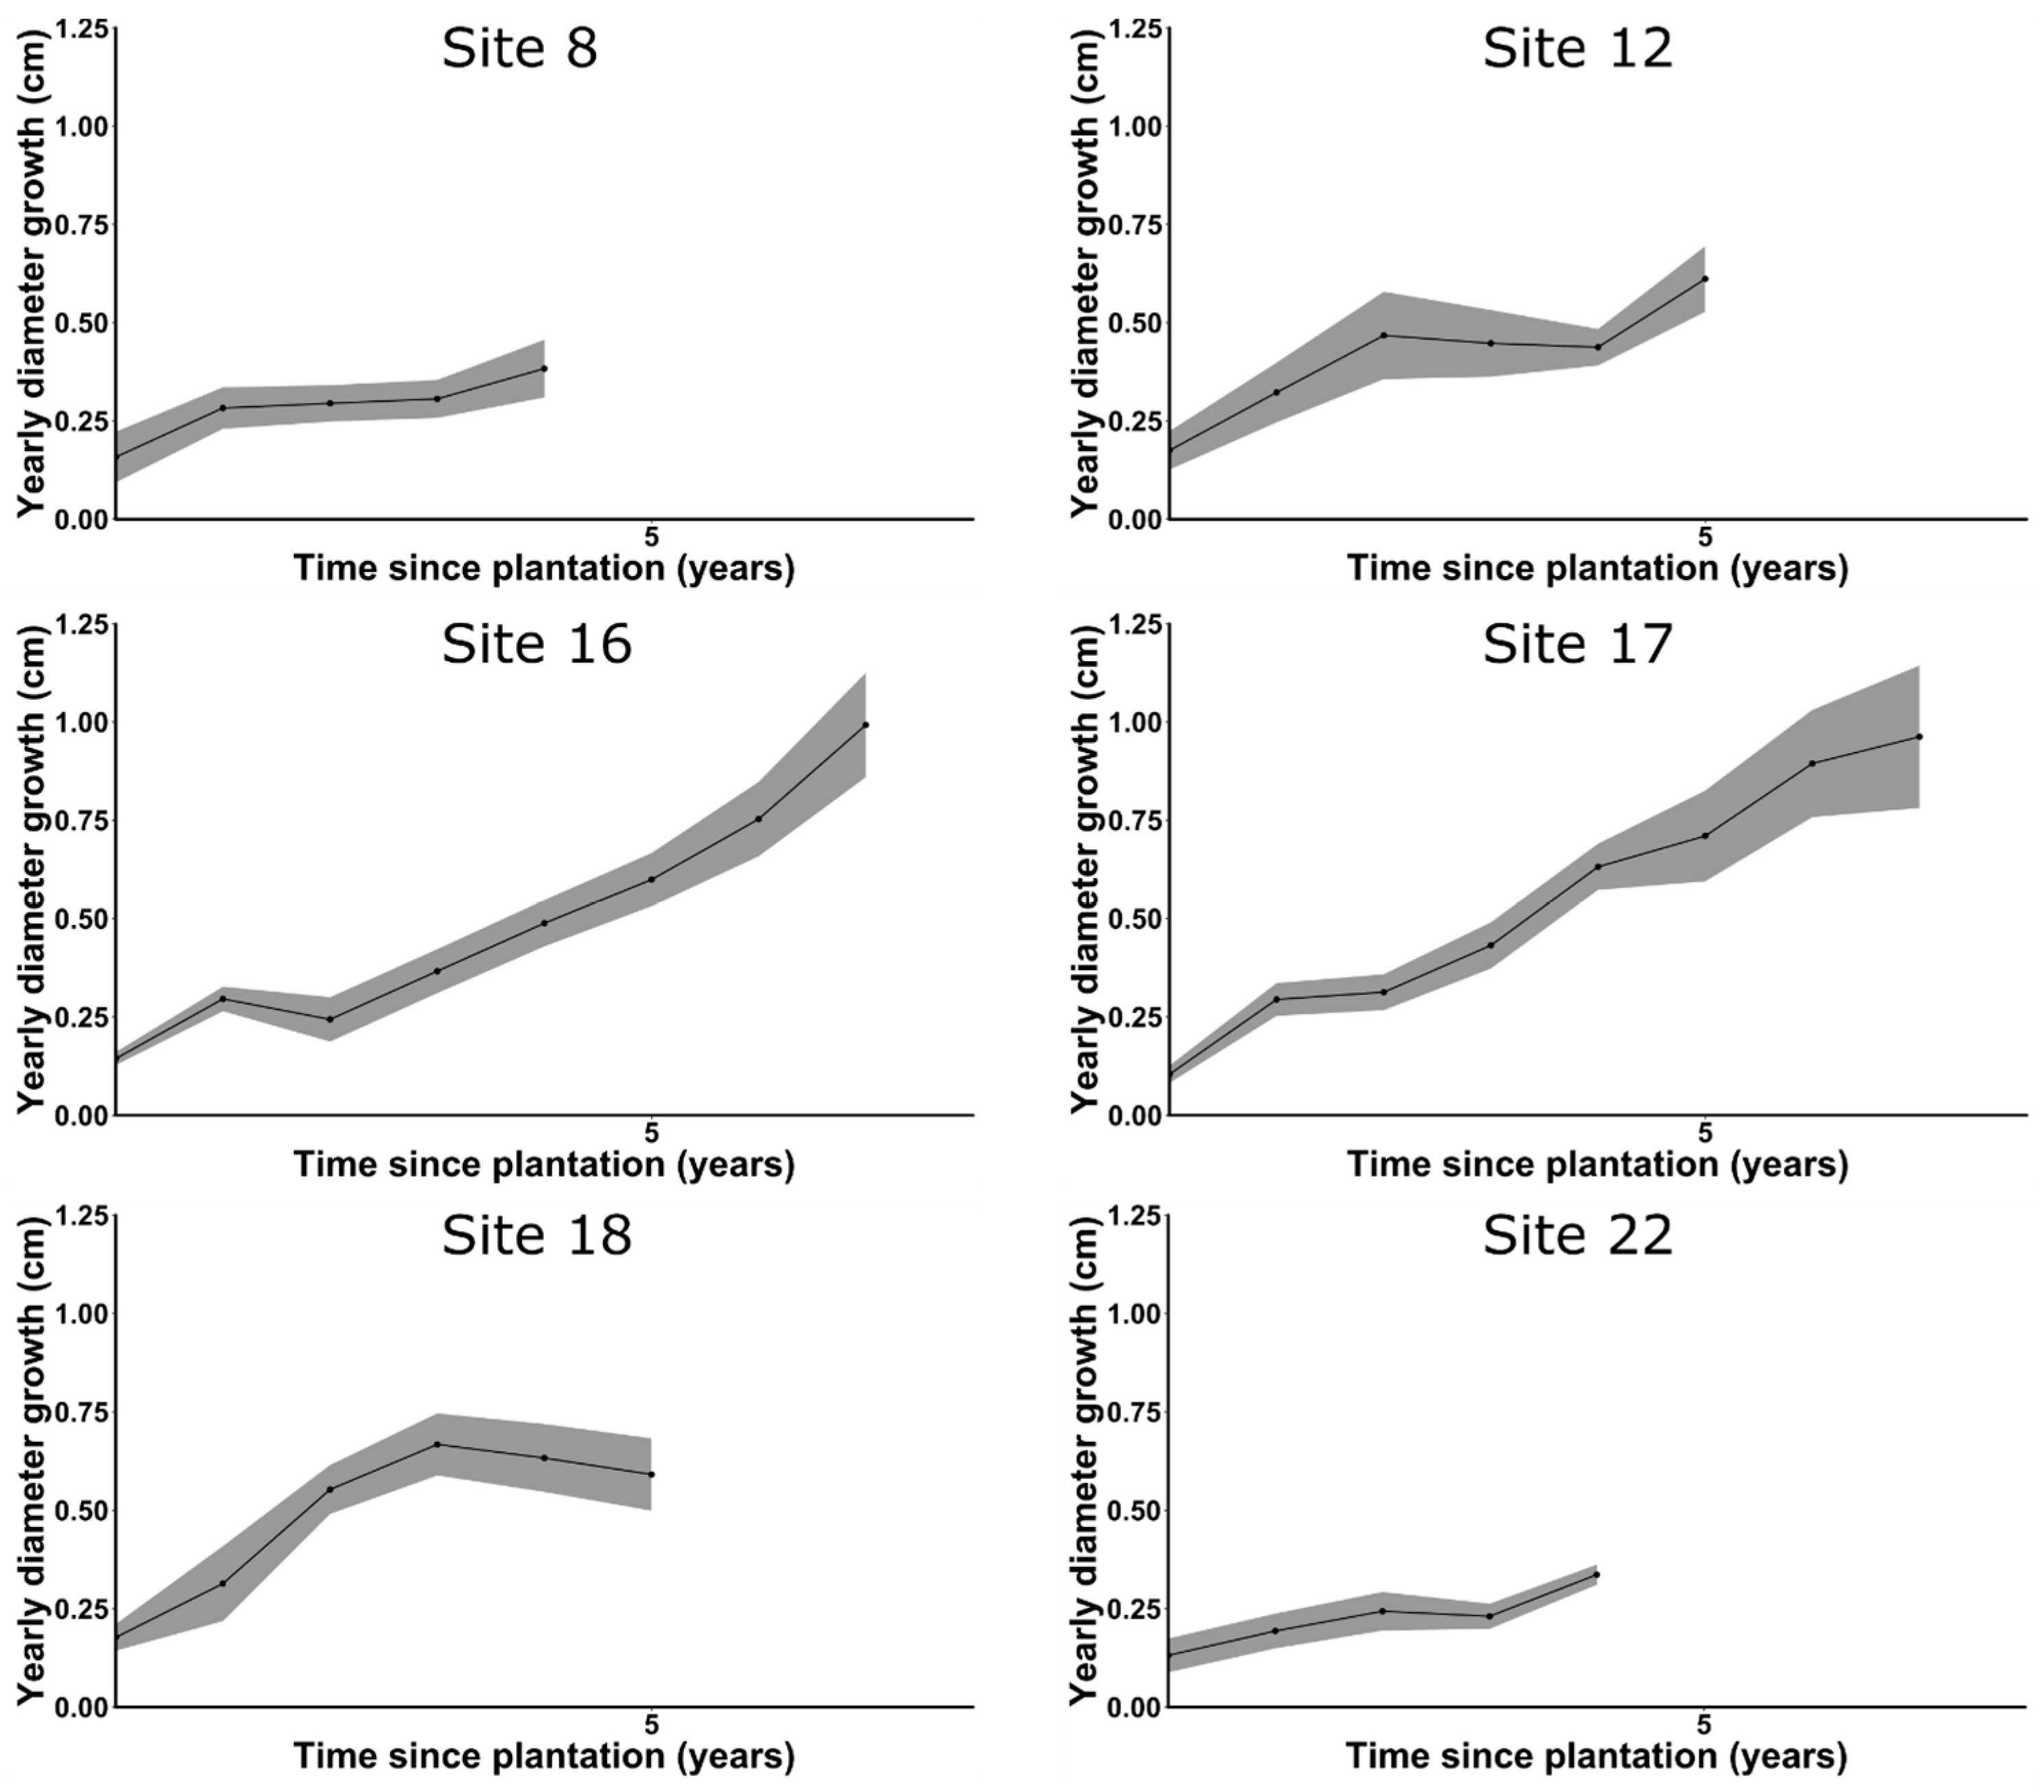
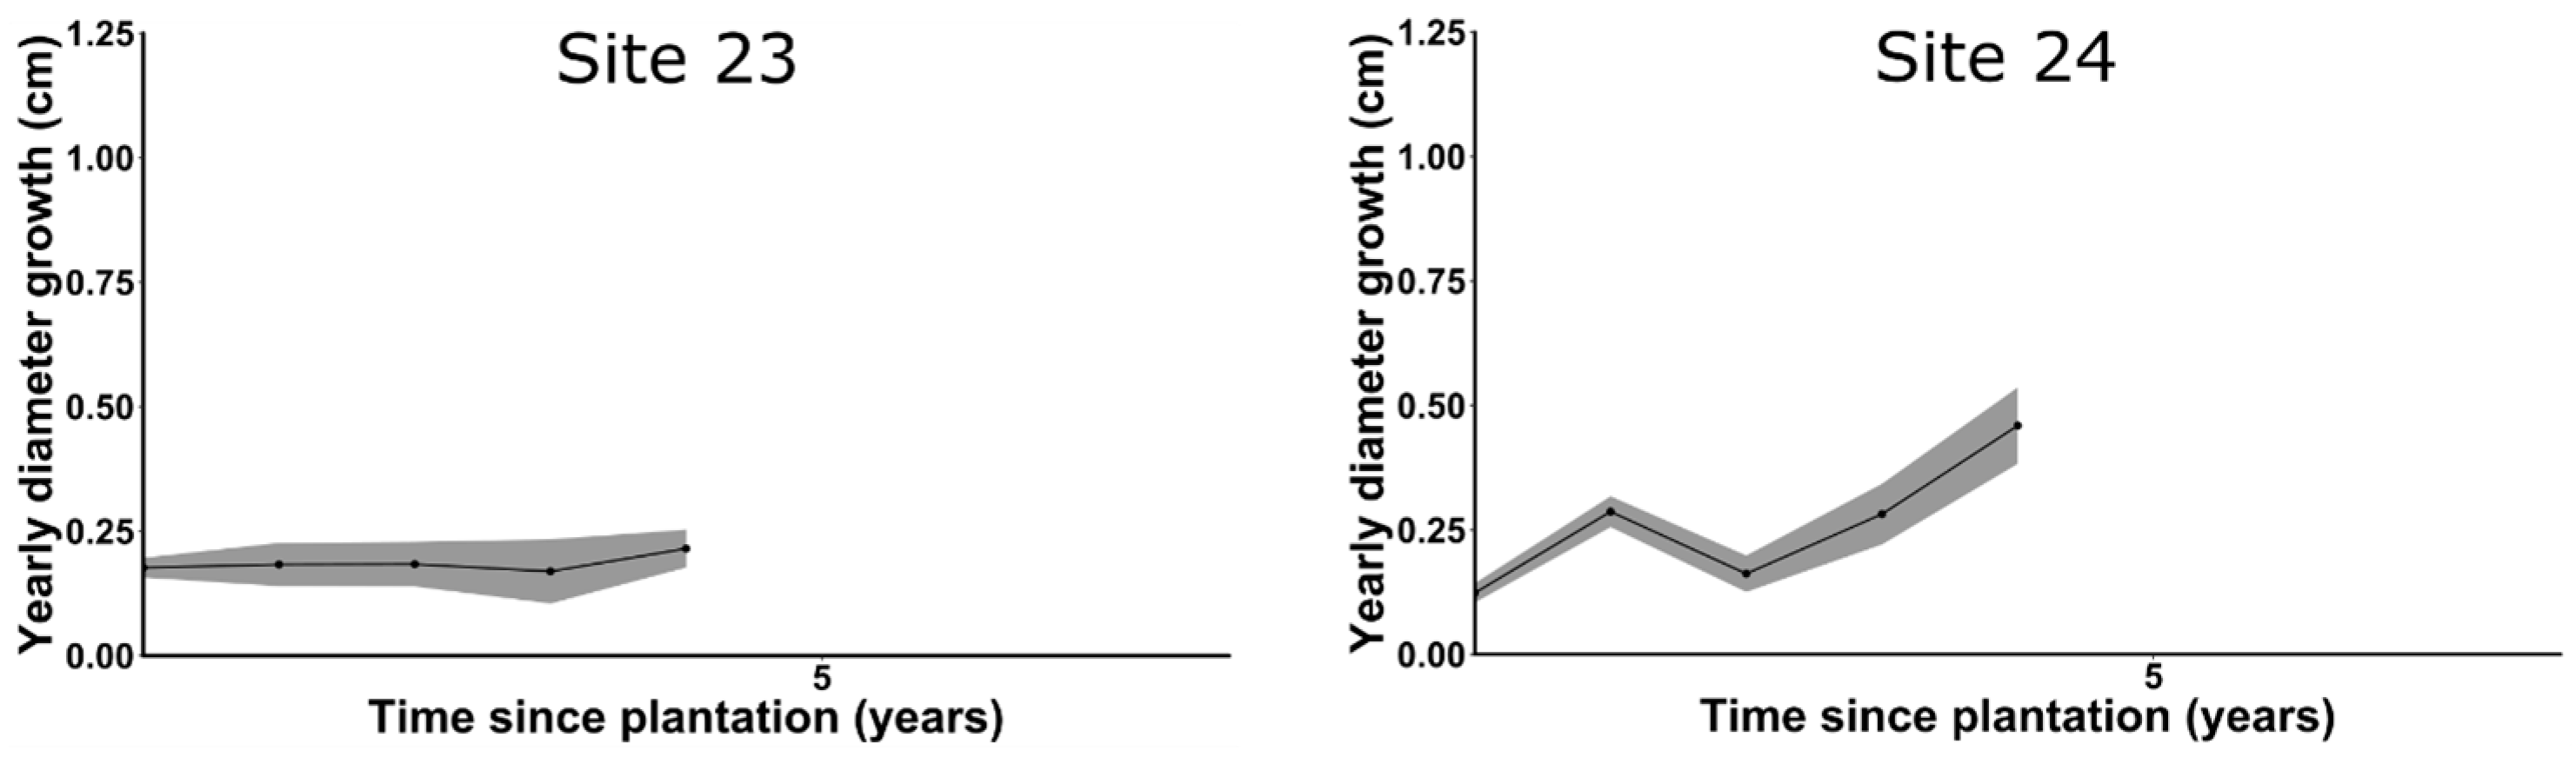
Root collar diameter growth (cm) as a function of time since plantation (years) for all Age-5 plantations. Mechanical brushing occurs at year 1 for all sites. Ribbons show standard error.
Figure A1.
Root collar diameter growth (cm) as a function of time since plantation (years) for all Age-5 plantations. Mechanical brushing occurs at year 1 for all sites. Ribbons show standard error.


Appendix B
Figure A2.
Root collar diameter growth (cm) as a function of time since plantation (years) for all Age-15 plantations. Mechanical brushing (Br) and thinning (Th) interventions are identified with arrows. Ribbons show standard error.
Figure A2.
Root collar diameter growth (cm) as a function of time since plantation (years) for all Age-15 plantations. Mechanical brushing (Br) and thinning (Th) interventions are identified with arrows. Ribbons show standard error.

Appendix C
Figure A3.
Root collar diameter growth (cm) as a function of time since plantation (years) for all Age-25 plantations. Thinning interventions (Th) are identified with arrows. Ribbons show standard error.
Figure A3.
Root collar diameter growth (cm) as a function of time since plantation (years) for all Age-25 plantations. Thinning interventions (Th) are identified with arrows. Ribbons show standard error.

References
- Johnston, W.M. Thuja occidentalis L.—Northern white-cedar. In Silvics of North America; United States Department of Agriculture: Washington, DC, USA, 1990; pp. 580–589. [Google Scholar]
- Ullrey, D.E.; Youatt, W.G.; Johnson, H.E.; Fay, L.D.; Brent, B.E.; Kemp, K.E. Digestibility of Cedar and Balsam Fir Browse for the White-Tailed Deer. J. Wildl. Manag. 1968, 32, 162–171. [Google Scholar] [CrossRef]
- Morrison, S.F.; Forbes, G.J.; Young, S.J.; Lusk, S. Within-yard habitat use by white-tailed deer at varying winter severity. For. Ecol. Manag. 2003, 172, 173–182. [Google Scholar] [CrossRef]
- Dumont, A.; Ouellet, J.P.; Crête, M.; Huot, J. Winter foraging strategy of white-tailed deer at the northern limit of its range. Ecoscience 2005, 12, 476–484. [Google Scholar] [CrossRef]
- Hébert, F.; Hénault, M.; Lamoureux, J.; Bélanger, M.; Vachon, M.; Dumont, A. Guide d’aménagement des ravages de cerfs de Virginie, 4th ed.; Ministère des Ressources Naturelles et Ministère du Développement Durable: Ville de Québec, QC, Canada, 2013.
- Boulfroy, E.; Forget, E.; Hofmeyer, P.V.; Kenefic, L.S.; Larouche, C.; Lessard, G.; Lussier, J.M.; Pinto, F.; Ruel, J.C.; Weiskittel, A. Silvicultural Guide for Northern White-Cedar (Eastern White Cedar); U.S. Department of Agriculture: Washington, DC, USA, 2012.
- Cornett, M.W.; Frelich, L.E.; Puettmann, K.J.; Reich, P.B. Conservation implications of browsing by Odocoileus virginianus in remnant upland Thuja occidentalis forests. Biol. Conserv. 2000, 93, 359–369. [Google Scholar] [CrossRef]
- Dupuis, S.; Arseneault, D.; Sirois, L. Change from pre-settlement to present-day forest composition reconstructed from early land survey records in eastern Québec, Canada. J. Veg. Sci. 2011, 22, 564–575. [Google Scholar] [CrossRef]
- Hofmeyer, P.V.; Kenefic, L.S.; Seymour, R.S. Northern White Cedar Ecology and Silviculture in the Northeastern United States and Southeastern Canada: A Synthesis of Knowledge. North. J. Appl. For. 2009, 26, 21–27. [Google Scholar]
- Danneyrolles, V.; Dupuis, S.; Arseneault, D.; Terrail, R.; Leroyer, M.; Römer, A.; Fortin, G.; Boucher, Y.; Ruel, J.-C. Eastern white cedar long-term dynamics in eastern Canada: Implications for restoration in the context of ecosystem-based management. For. Ecol. Manag. 2017, 400, 502–510. [Google Scholar] [CrossRef]
- Cornett, M.W.; Reich, P.B.; Puettmann, K.J. Canopy feedbacks and microtopography regulate conifer seedling distribution in two Minnesota conifer-deciduous forests. Ecoscience 1997, 4, 353–364. [Google Scholar] [CrossRef]
- Simard, M.J.; Bergeron, Y.; Sirois, L. Substrate and litterfall effects on conifer seedling survivorship in southern boreal stands of Canada. Can. J. For. Res. 2003, 33, 672–681. [Google Scholar] [CrossRef]
- Heitzman, E.; Pregitzer, K.S.; Miller, R.O. Origin and early development of northern white-cedar stands in northern Michigan. Can. J. For. Res. 1997, 27, 1953–1961. [Google Scholar] [CrossRef]
- Rooney, T.P.; Solheim, S.L.; Waller, D.M. Factors affecting the regeneration of northern white cedar in lowland forests of the Upper Great Lakes region, USA. For. Ecol. Manag. 2002, 163, 119–130. [Google Scholar] [CrossRef]
- Verme, L.J.; Johnston, W.M. Regeneration of Northern White Cedar Deeryards in Upper Michigan. J. Wildl. Manag. 1986, 50, 307–313. [Google Scholar] [CrossRef]
- White, M.A. Long-term effects of deer browsing: Composition, structure and productivity in a northeastern Minnesota old-growth forest. For. Ecol. Manag. 2012, 269, 222–228. [Google Scholar] [CrossRef]
- Knox, M.W. Historical Changes in the Abundance and Distribution of Deer in Virginia. In The Science of Overabundance; Smithsonian Institution Scholarly Press: Washington, DC, USA; Chantilly, VA, USA; New York, NY, USA, 1997; pp. 27–36. [Google Scholar]
- McCabe, T.R.; McCabe, R.E. Recounting whitetails past. In The Science of Overabundance; Smithsonian Institution Scholarly Press: Washington, DC, USA; Chantilly, VA, USA; New York, NY, USA, 1997; pp. 11–26. [Google Scholar]
- Rooney, T.P.; Waller, D.M. Direct and indirect effects of white-tailed deer in forest ecosystems. For. Ecol. Manag. 2003, 181, 165–176. [Google Scholar] [CrossRef]
- Côté, S.D.; Rooney, T.P.; Tremblay, J.P.; Dussault, C.; Waller, D.M. Ecological Impacts of deer Overabundance. Annu. Rev. Ecol. Evol. Syst. 2004, 35, 113–147. [Google Scholar] [CrossRef]
- Heitzman, E.; Pregitzer, K.S.; Miller, R.O.; Lanasa, M.; Zuidema, M. Establishment and development of northern white-cedar following strip clearcutting. For. Ecol. Manag. 1999, 123, 97–104. [Google Scholar] [CrossRef]
- Gauthier, I.; Bastien, H.; Lefort, S. État de Situation des Principales Espèces de petit Gibier Exploitées au Québec; Direction de l'expertise sur la faune et ses habitats, Ministère des ressources naturelles et de la faune: Ville de Québec, QC, Canada, 2008.
- Johnston, W.M. Balsam Fir Dominant Species under Rethinned Northern White-Cedar; U.S. Department of Agriculture: Washington, DC, USA, 1972.
- Peek, J.M.; Urich, D.L.; Mackie, R.J. Moose Habitat Selection and Relationships to Forest Management in Northeastern Minnesota. Wildl. Monogr. 1976, 48, 3–65. [Google Scholar]
- Danell, K.; Bergström, R.; Edenius, L. Effects of Large Mammalian Browsers on Architecture, Biomass, and Nutrients of Woody Plants. J. Mammal. 1994, 75, 833–844. [Google Scholar] [CrossRef]
- Ishii, H.T.; Ford, E.D.; Kennedy, M.C. Physiological and ecological implications of adaptive reiteration as a mechanism for crown maintenance and longevity. Tree Physiol. 2007, 27, 455–462. [Google Scholar] [CrossRef] [PubMed]
- Hofmeyer, P.V.; Seymour, R.S.; Kenefic, L.S. Influence of Soil Site Class on Growth and Decay of Northern White Cedar and Two Associates in Maine. North. J. Appl. For. 2009, 26, 68–75. [Google Scholar]
- Briand, C.H.; Posluszny, U.; Larson, W. Differential axis architecture in Thuja occidentalis (eastern white cedar). Can. J. Bot. 1992, 340–348. [Google Scholar] [CrossRef]
- Logan, K.T. Growth of Tree Seedlings as Affected by Light Intensity: Black Spruce, White Spruce, Balsam Fir, and Eastern White Cedar; Canadian Forest Service: Laurentian Hills, ON, Canada, 1969.
- Cornett, M.W.; Reich, P.B.; Puettmann, K.J.; Frelich, L.E. Seedbed and moisture availability determine safe sites for early Thuja occidentalis. Am. J. Bot. 2000, 87, 1807–1814. [Google Scholar] [CrossRef] [PubMed]
- Hannah, P.R. Stand structures and height growth patterns in northern white cedar stands on wet sites in Vermont. North. J. Appl. For. 2004, 21, 173–179. [Google Scholar]
- Hofmeyer, P.V.; Kenefic, L.S.; Seymour, R.S. Historical Stem Development of Northern White Cedar (Thuja occidentalis L.) in Maine. North. J. Appl. For. 2010, 27, 92–96. [Google Scholar]
- Ruel, J.C.; Lussier, J.M.; Morissette, S.; Ricodeau, N. Growth Response of Northern White-Cedar (Thuja occidentalis) to Natural Disturbances and Partial Cuts in Mixedwood Stands of Quebec, Canada. Forests 2014, 5, 1194–1211. [Google Scholar] [CrossRef]
- Larouche, C.; Ruel, J.C. Development of Northern White-Cedar Regeneration Following Partial Cutting, with and without Deer Browsing. Forests 2015, 6, 344–359. [Google Scholar] [CrossRef]
- Huot, M.; Lebel, F. Plan de gestion du cerf de Virginie au Québec 2010–2017; Ministère des Ressources naturelles et de la Faune, Secteur Faune Québec: Ville de Québec, QC, Canada, 2012.
- Saucier, J.-P.; Grondin, P.; Robitaille, A.; Gosselin, J.; Morneau, C.; Richard, P.; Brisson, J.; Sirois, L.; Leduc, A.; Morin, H.; et al. Écologie forestière. In Manuel de foresterie, 2nd ed.; Ordre des ingénieurs forestiers du Québec: Ville de Québec, QC, Canada, 2009; pp. 165–316. [Google Scholar]
- Gagnon, L.; St-Hilaire, G.; Rioux, M. Sommaire du Plan d’aménagement forestier intégré tactique—Région du Bas-Saint-Laurent-UA 011-51; Ministère des Ressources Naturelles, Direction générale du Bas-Saint-Laurent: Rimouski, QC, Canada, 2014.
- Cyr, G. Guide des stations forestières de la région écologique 4f—Collines des moyennes Appalaches; Ministère des Ressources Naturelles, Direction des Inventaires Forestiers, Division de la Classification Écologique et Productivité des Stations: Ville de Québec, QC, Canada, 2014.
- Muiruri, E.W.; Milligan, H.T.; Morath, S.; Koricheva, J. Moose browsing alters tree diversity effects on birch growth and insect herbivory. Funct. Ecol. 2015, 29, 724–735. [Google Scholar] [CrossRef]
- Saunders, M.R.; Puettmann, K.J. Use of vegetational characteristics and browsing patterns to predict deer damage in eastern white pine (Pinus strobus) plantations. North. J. Appl. For. 1999, 16, 96–102. [Google Scholar]
- Larsson, L. CooRecorder Program of the CDendropackage Version 8.1; Cybis Elektronik: Saltsjöbaden, Sweden, 2016. [Google Scholar]
- Loffredo, N.; Sun, X.; Onda, Y. DHPT 1.0: New software for automatic analysis of canopy closure from under-exposed and over-exposed digital hemispherical photographs. Comput. Electron. Agric. 2016, 125, 39–47. [Google Scholar] [CrossRef]
- Burnham, K.P.; Anderson, D.R. Model Selection and Multimodel Inference: A Practical Information-Theoretic Approach, 2nd ed.; Springer: Berlin, Germany, 2002; Volume 172. [Google Scholar]
- Mazerolle, M.J. Improving data analysis in herpetology: Using Akaike’s Information Criterion (AIC) to assess the strength of biological hypotheses. Amphibia-Reptilia 2006, 27, 169–180. [Google Scholar] [CrossRef]
- Zuur, A.F.; Ieno, E.N.; Elphick, C.S. A protocol for data exploration to avoid common statistical problems. Methods Ecol. Evol. 2010, 1, 3–14. [Google Scholar] [CrossRef]
- R Core Team. R: A Language and Environment for Statistical Computing; R Foundation for Statistical Computing: Vienna, Austria, 2016. [Google Scholar]
- Bates, D.; Maechler, M.; Bolker, B. Fitting Linear Mixed-Effects Models Using lme4. J. Stat. Softw. 2015, 67. [Google Scholar] [CrossRef]
- Nakagawa, S.; Schielzeth, H. A general and simple method for obtaining R2 from generalized linear mixed-effects models. Methods Ecol. Evol. 2013, 4, 133–142. [Google Scholar] [CrossRef]
- Barton, K. MuMIn: Multi-Model Inference. R Package Version 1.15.6. Available online: https://cran.r-project.org/web/packages/MuMIn/MuMIn.pdf (accessed online 7 January 2016).
- Mazerolle, M.J. AICcmodavg: Model Selection and Multimodel Inference Based on (Q)AIC(c). R Package Version 2.1-0. Available online: https://cran.r-project.org/web/packages/AICcmodavg/AICcmodavg.pdf (accessed online 20 June 2017).
- Tomé, M.; Burkhart, H.E. Distance-Dependent Competition Measures for Predicting Growth of Individual Trees. For. Sci. 1989, 35, 816–831. [Google Scholar]
- Kiernan, D.H.; Bevilacqua, E.; Nyland, R.D. Individual-tree diameter growth model for sugar maple trees in uneven-aged northern hardwood stands under selection system. For. Ecol. Manag. 2009, 256, 1579–1586. [Google Scholar] [CrossRef]
- Wykoff, W.R. A basal area increment model for individual conifers in the northern Rocky Mountains. For. Sci. 1990, 36, 1077–1104. [Google Scholar]
- Boulet, B. Synthèse des connaissances sur l’écologie des espèces concurrentes. In Le Guide sylvicole du Québec, tome 1: Les fondements biologiques de la sylviculture; Ministère des Forêts, de la Faune et des Parcs: Ville de Québec, QC, Canada, 2013; pp. 242–275. [Google Scholar]
- Forester, J.D.; Anderson, D.P.; Turner, M.G. Landscape and Local Factors Affecting Northern White Cedar (Thuja occidentalis) Recruitment in The Chequamegon-Nicolet National Forest, Wisconsin (U.S.A.). Am. Midl. Nat. 2008, 160, 438–453. [Google Scholar] [CrossRef]
- Hofmeyer, P.V.; Seymour, R.S.; Kenefic, L.S. Production ecology of Thuja occidentalis. Can. J. For. Res. 2010, 40, 1155–1164. [Google Scholar] [CrossRef]
- Bélanger, M.; Hélie, C. Plan d’aménagement du ravage du Canton Varin, plan d’intervention 2006–2010; Ministère des Ressources naturelles et de la Faune, Secteur Faune Québec et Secteur Forêt Québec, Direction Générale du Bas-Saint-Laurent: Rimouski, QC, Canada, 2006.
- Lefort, S.; Massé, S. Plan de gestion de l’orignal au Québec 2012–2019; Ministère des Forêts, de la Faune et des Parcs: Ville de Québec, QC, Canada, 2015.
- Barbosa, P.; Hines, J.; Kaplan, I.; Martinson, H.; Szczepaniec, A.; Szendrei, Z. Associational Resistance and Associational Susceptibility: Having Right or Wrong Neighbors. Annu. Rev. Ecol. Evol. Syst. 2009, 40, 1–20. [Google Scholar] [CrossRef]
- Smit, C.; Ouden, J.D.; Müller-Schärer, H. Unpalatable Plants Facilitate Tree Sapling Survival in Wooded Pastures. J. Appl. Ecol. 2006, 43, 305–312. [Google Scholar] [CrossRef]
- Alm Bergvall, U.; Rautio, P.; Kesti, K.; Tuomi, J.; Leimar, O. Associational effects of plant defences in relation to within- and between-patch food choice by a mammalian herbivore: Neighbour contrast susceptibility and defence. Oecologia 2006, 147, 253–260. [Google Scholar] [CrossRef] [PubMed]
- Paquette, A.; Messier, C. The role of plantations in managing the world’s forests in the Anthropocene. Front. Ecol. Environ. 2010, 8, 27–34. [Google Scholar] [CrossRef] [Green Version]
- Williams, L.J.; Paquette, A.; Cavender-Bares, J.; Messier, C.; Reich, P.B. Spatial complementarity in tree crowns explains overyielding in species mixtures. Nat. Ecol. Evol. 2017, 1, 63. [Google Scholar] [CrossRef] [PubMed]
- Brockerhoff, E.G.; Jactel, H.; Parrotta, J.A.; Quine, C.P.; Sayer, J. Plantation forests and biodiversity: Oxymoron or opportunity? Biodivers. Conserv. 2008, 17, 925–951. [Google Scholar] [CrossRef]
Figure 1.
Study area and sites location in Bas-Saint-Laurent, Québec, Canada.
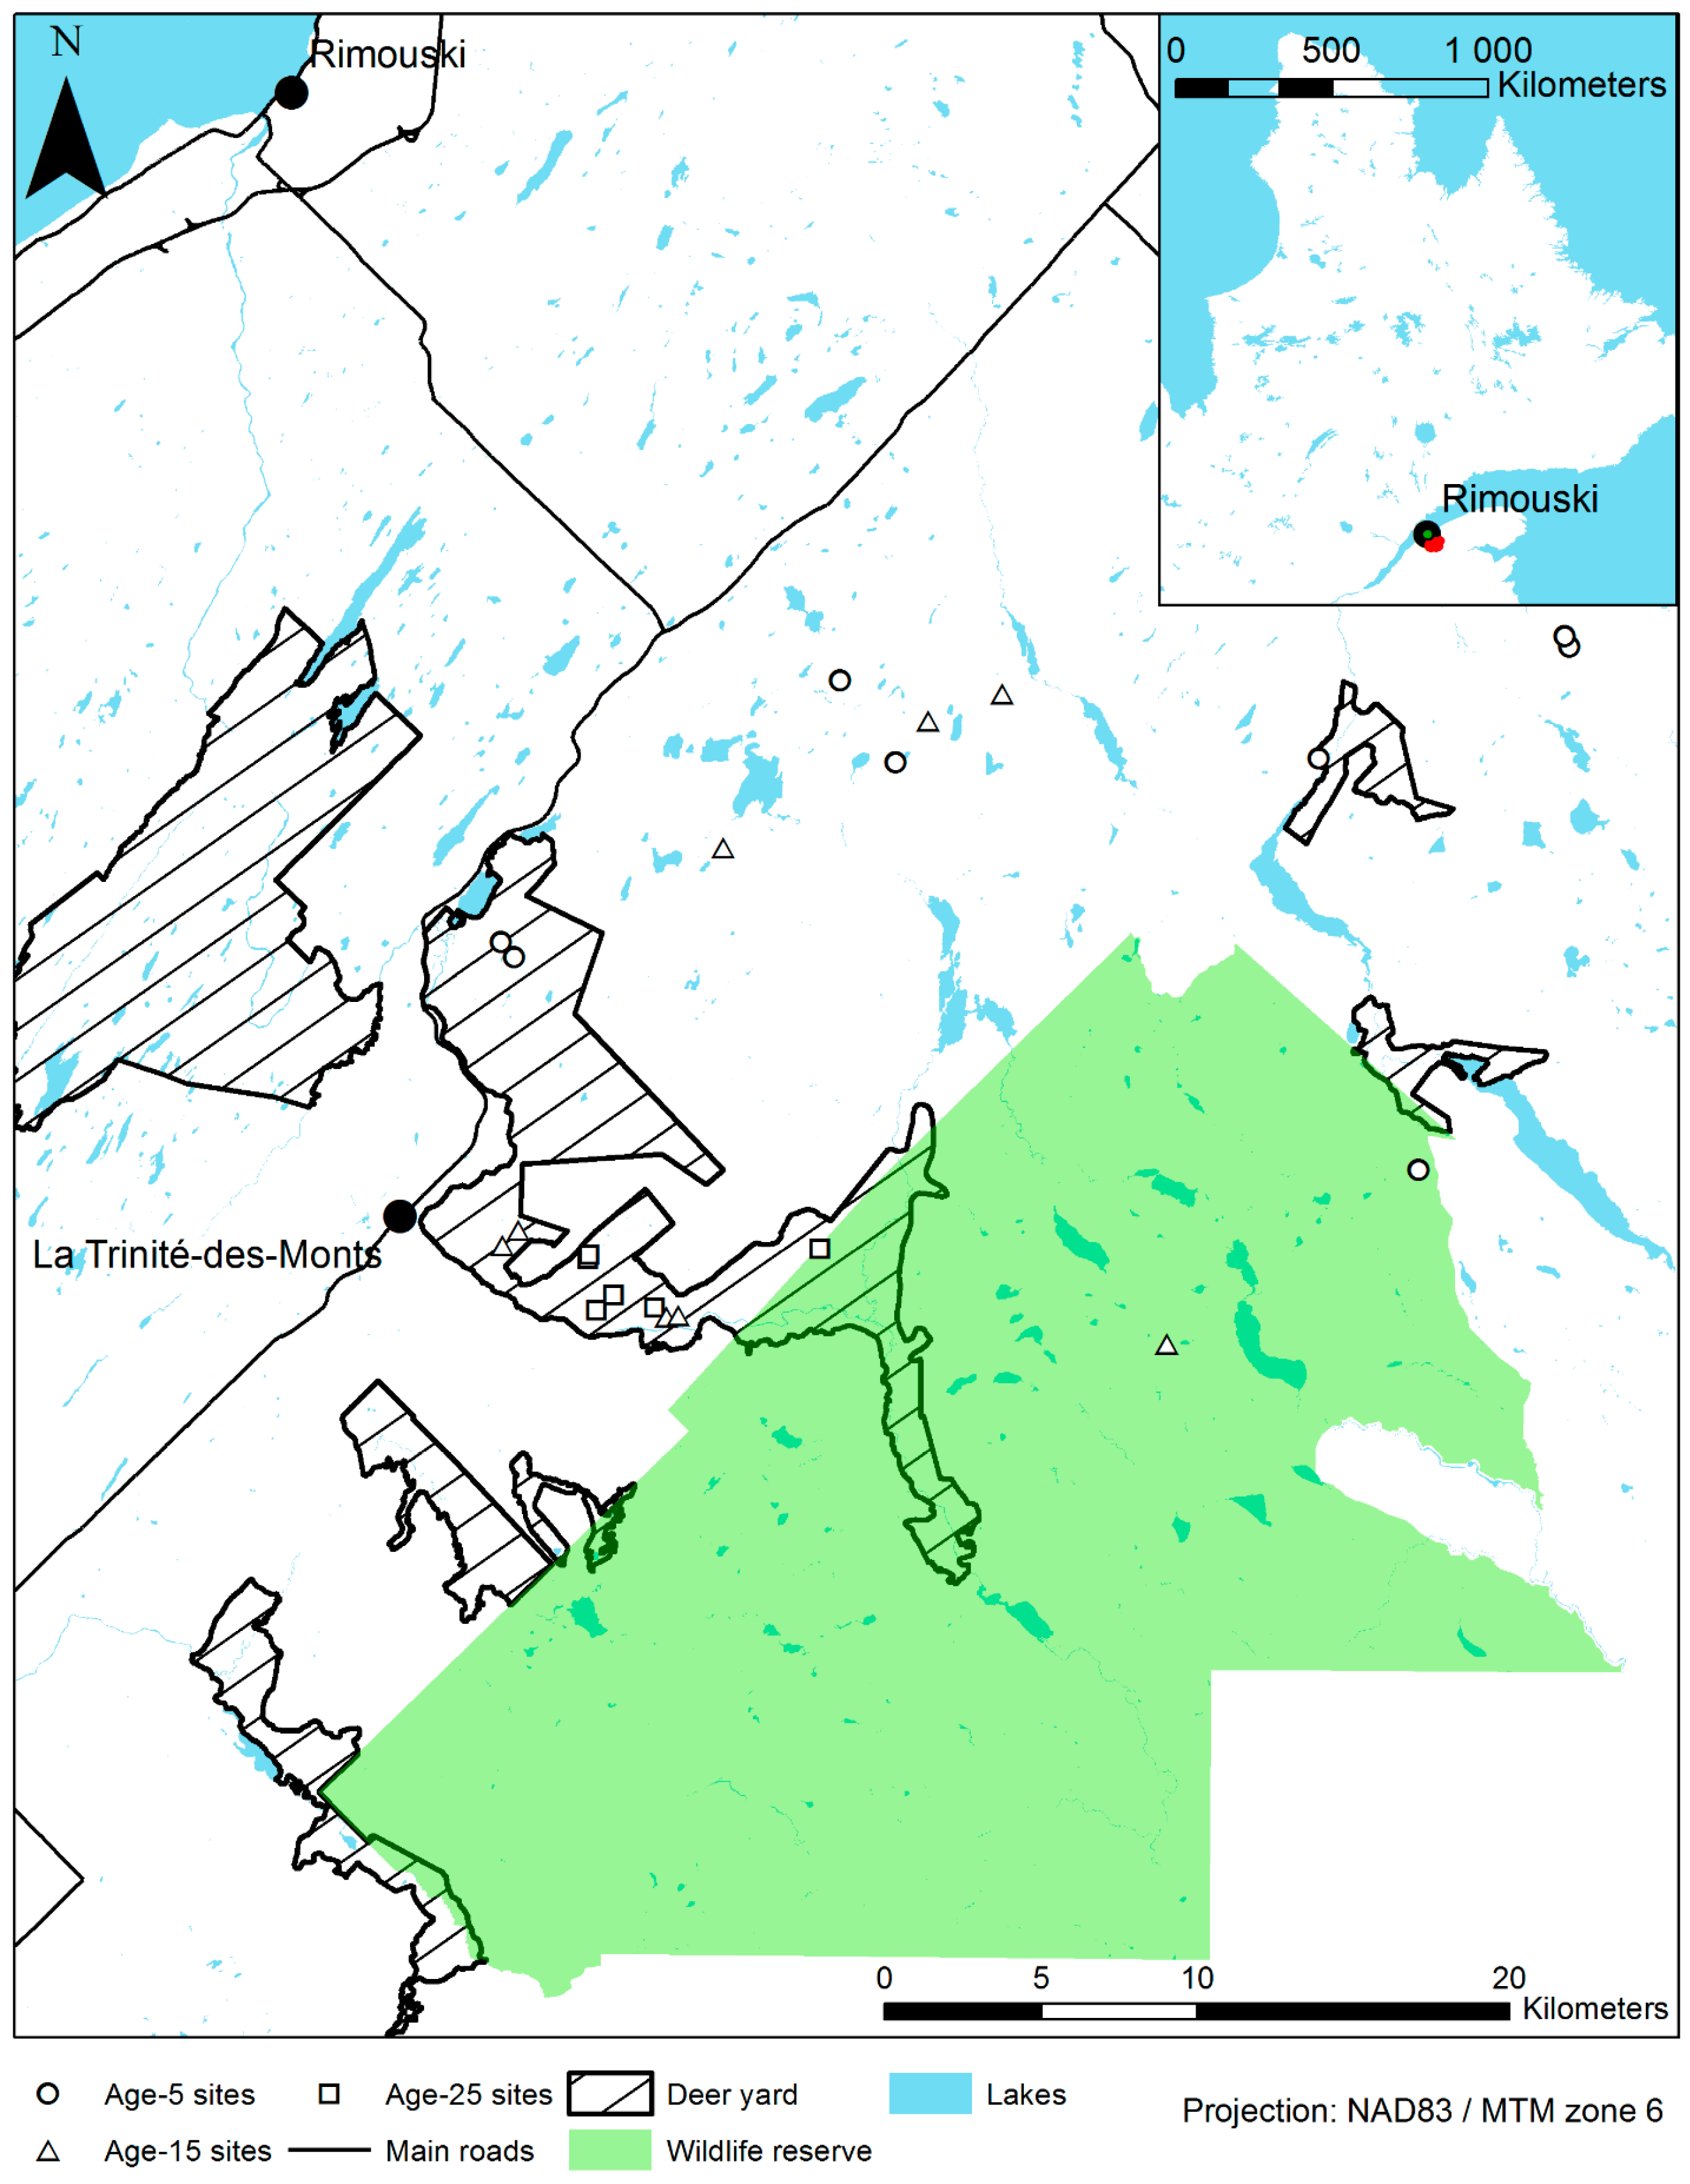
Figure 2.
DBH class—numbers show class centre—distribution for Age-25 with deciduous cover (A), Age-25 with thinned deciduous (B), and Age-25 with mixed cedar-spruce (C).
Figure 2.
DBH class—numbers show class centre—distribution for Age-25 with deciduous cover (A), Age-25 with thinned deciduous (B), and Age-25 with mixed cedar-spruce (C).
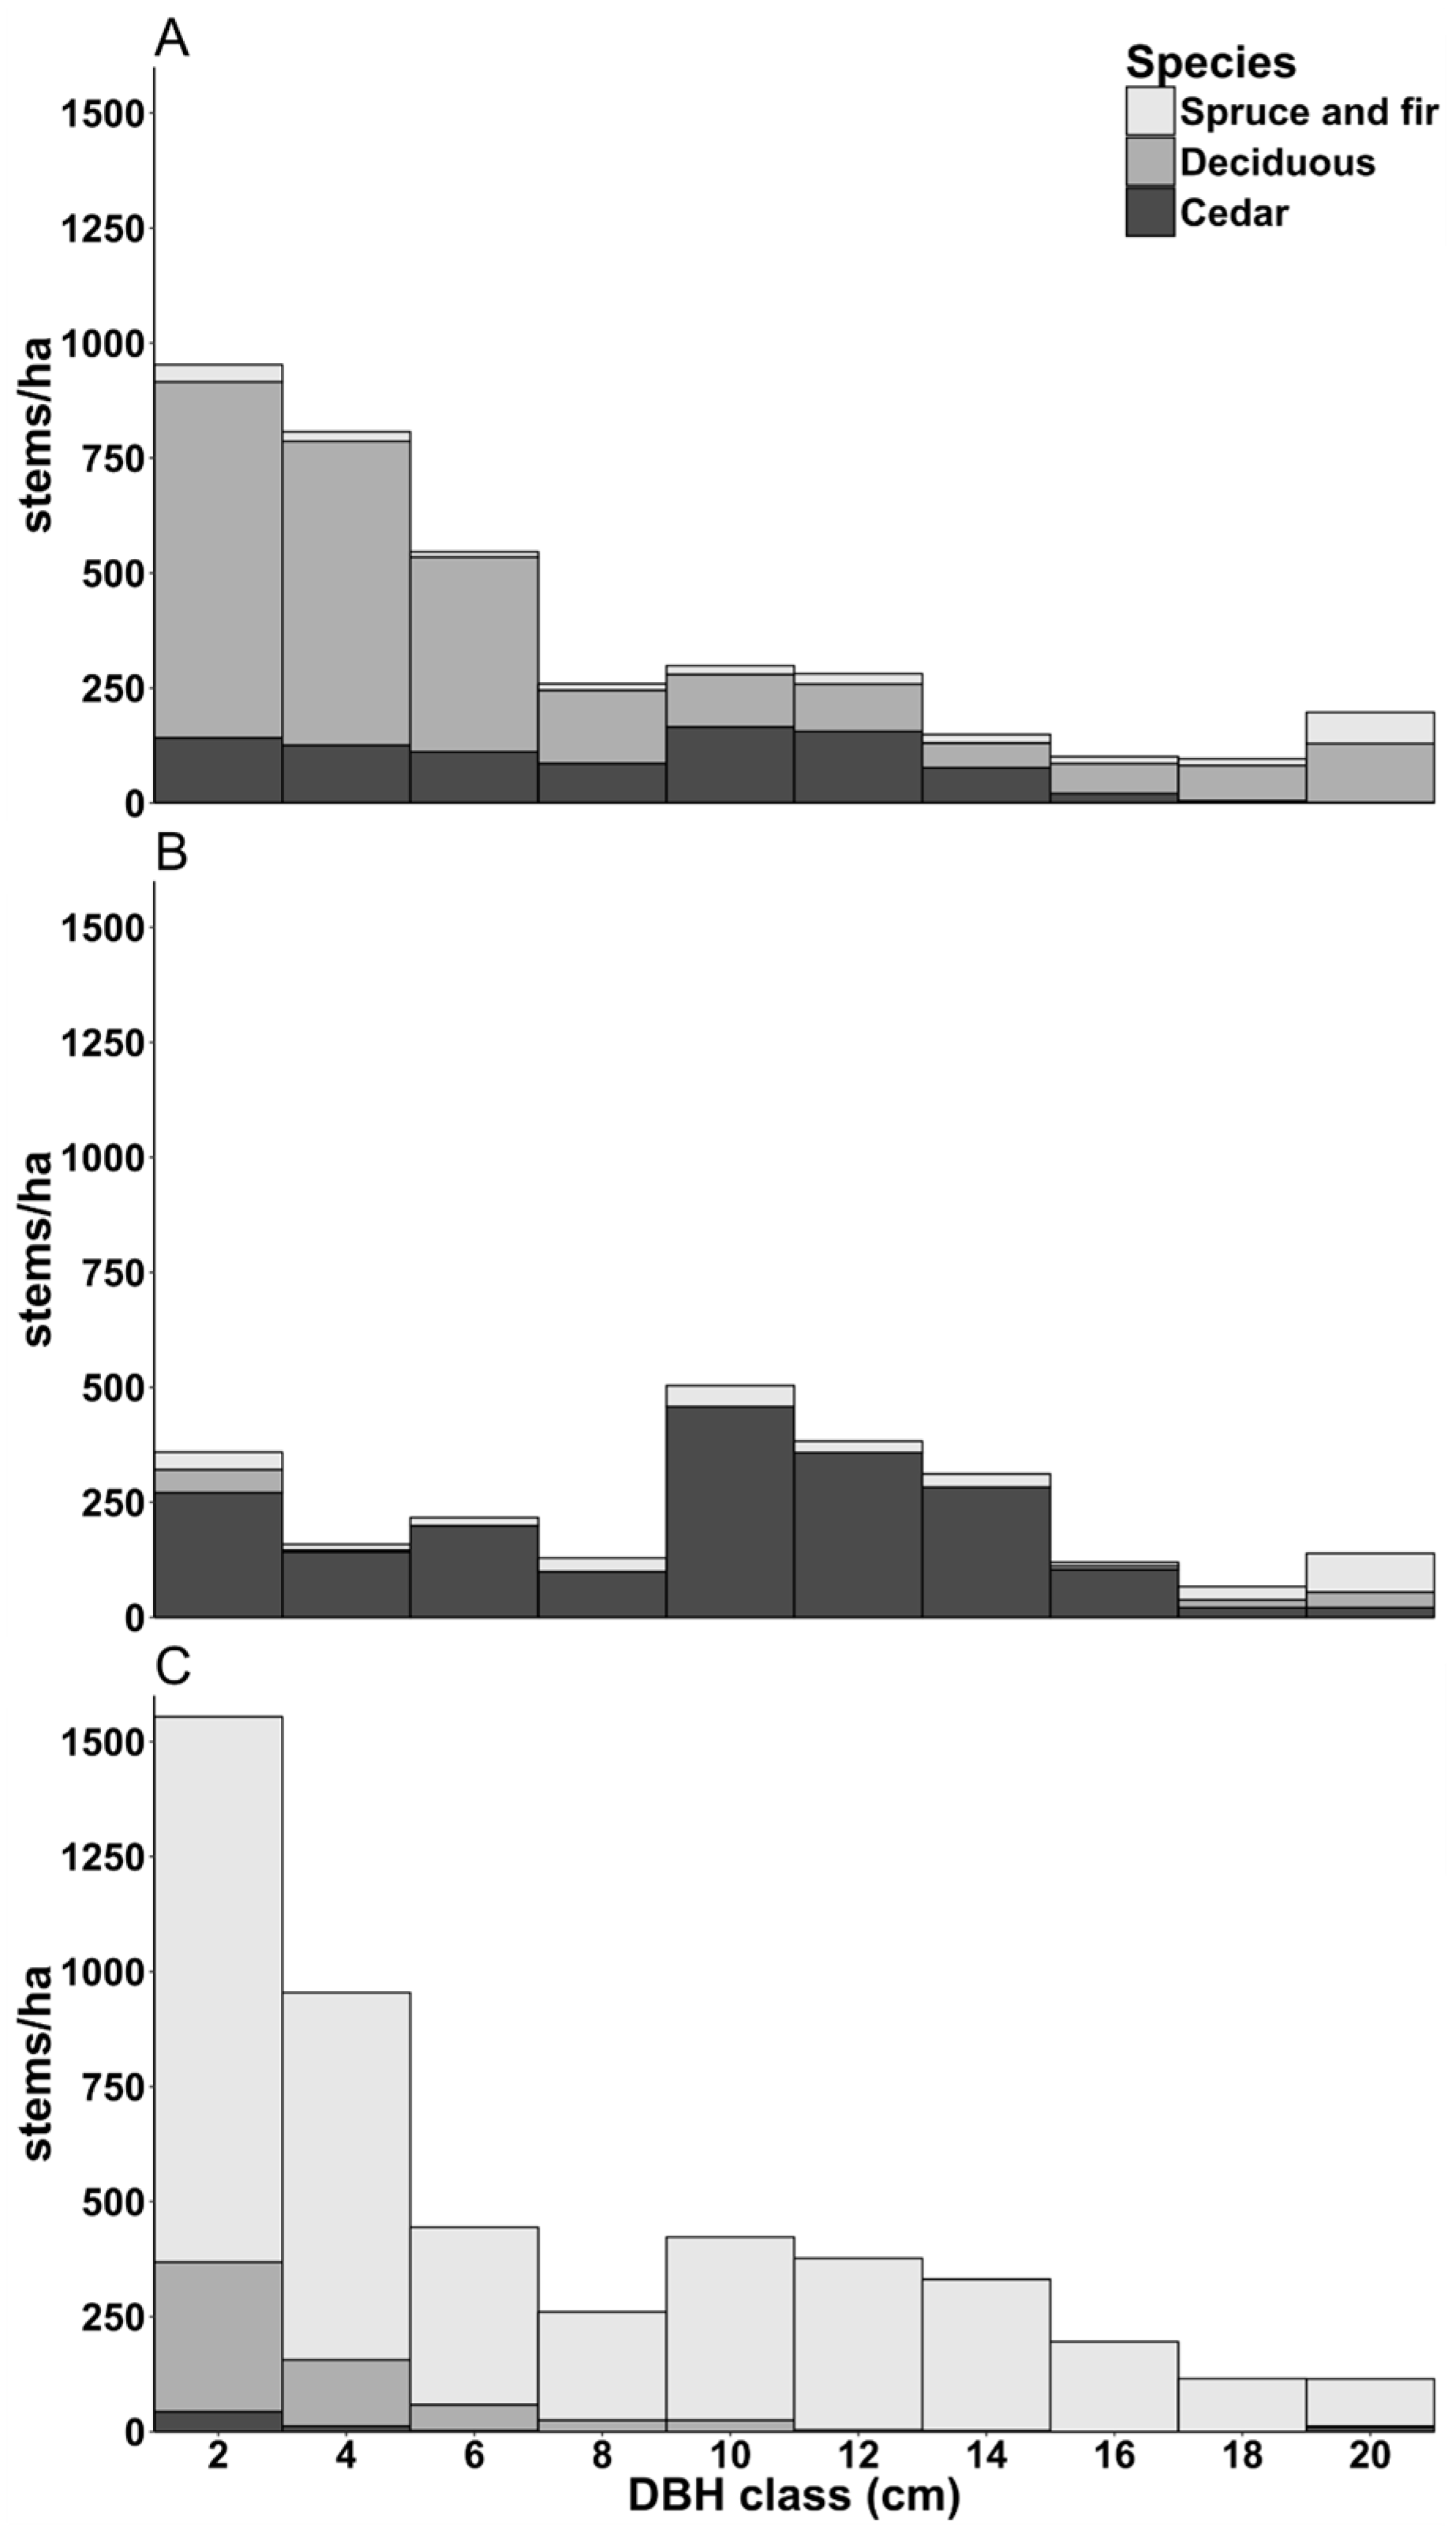
Figure 3.
Proportions of forked dominant cedars according to fork height, site number, and age group.
Figure 3.
Proportions of forked dominant cedars according to fork height, site number, and age group.
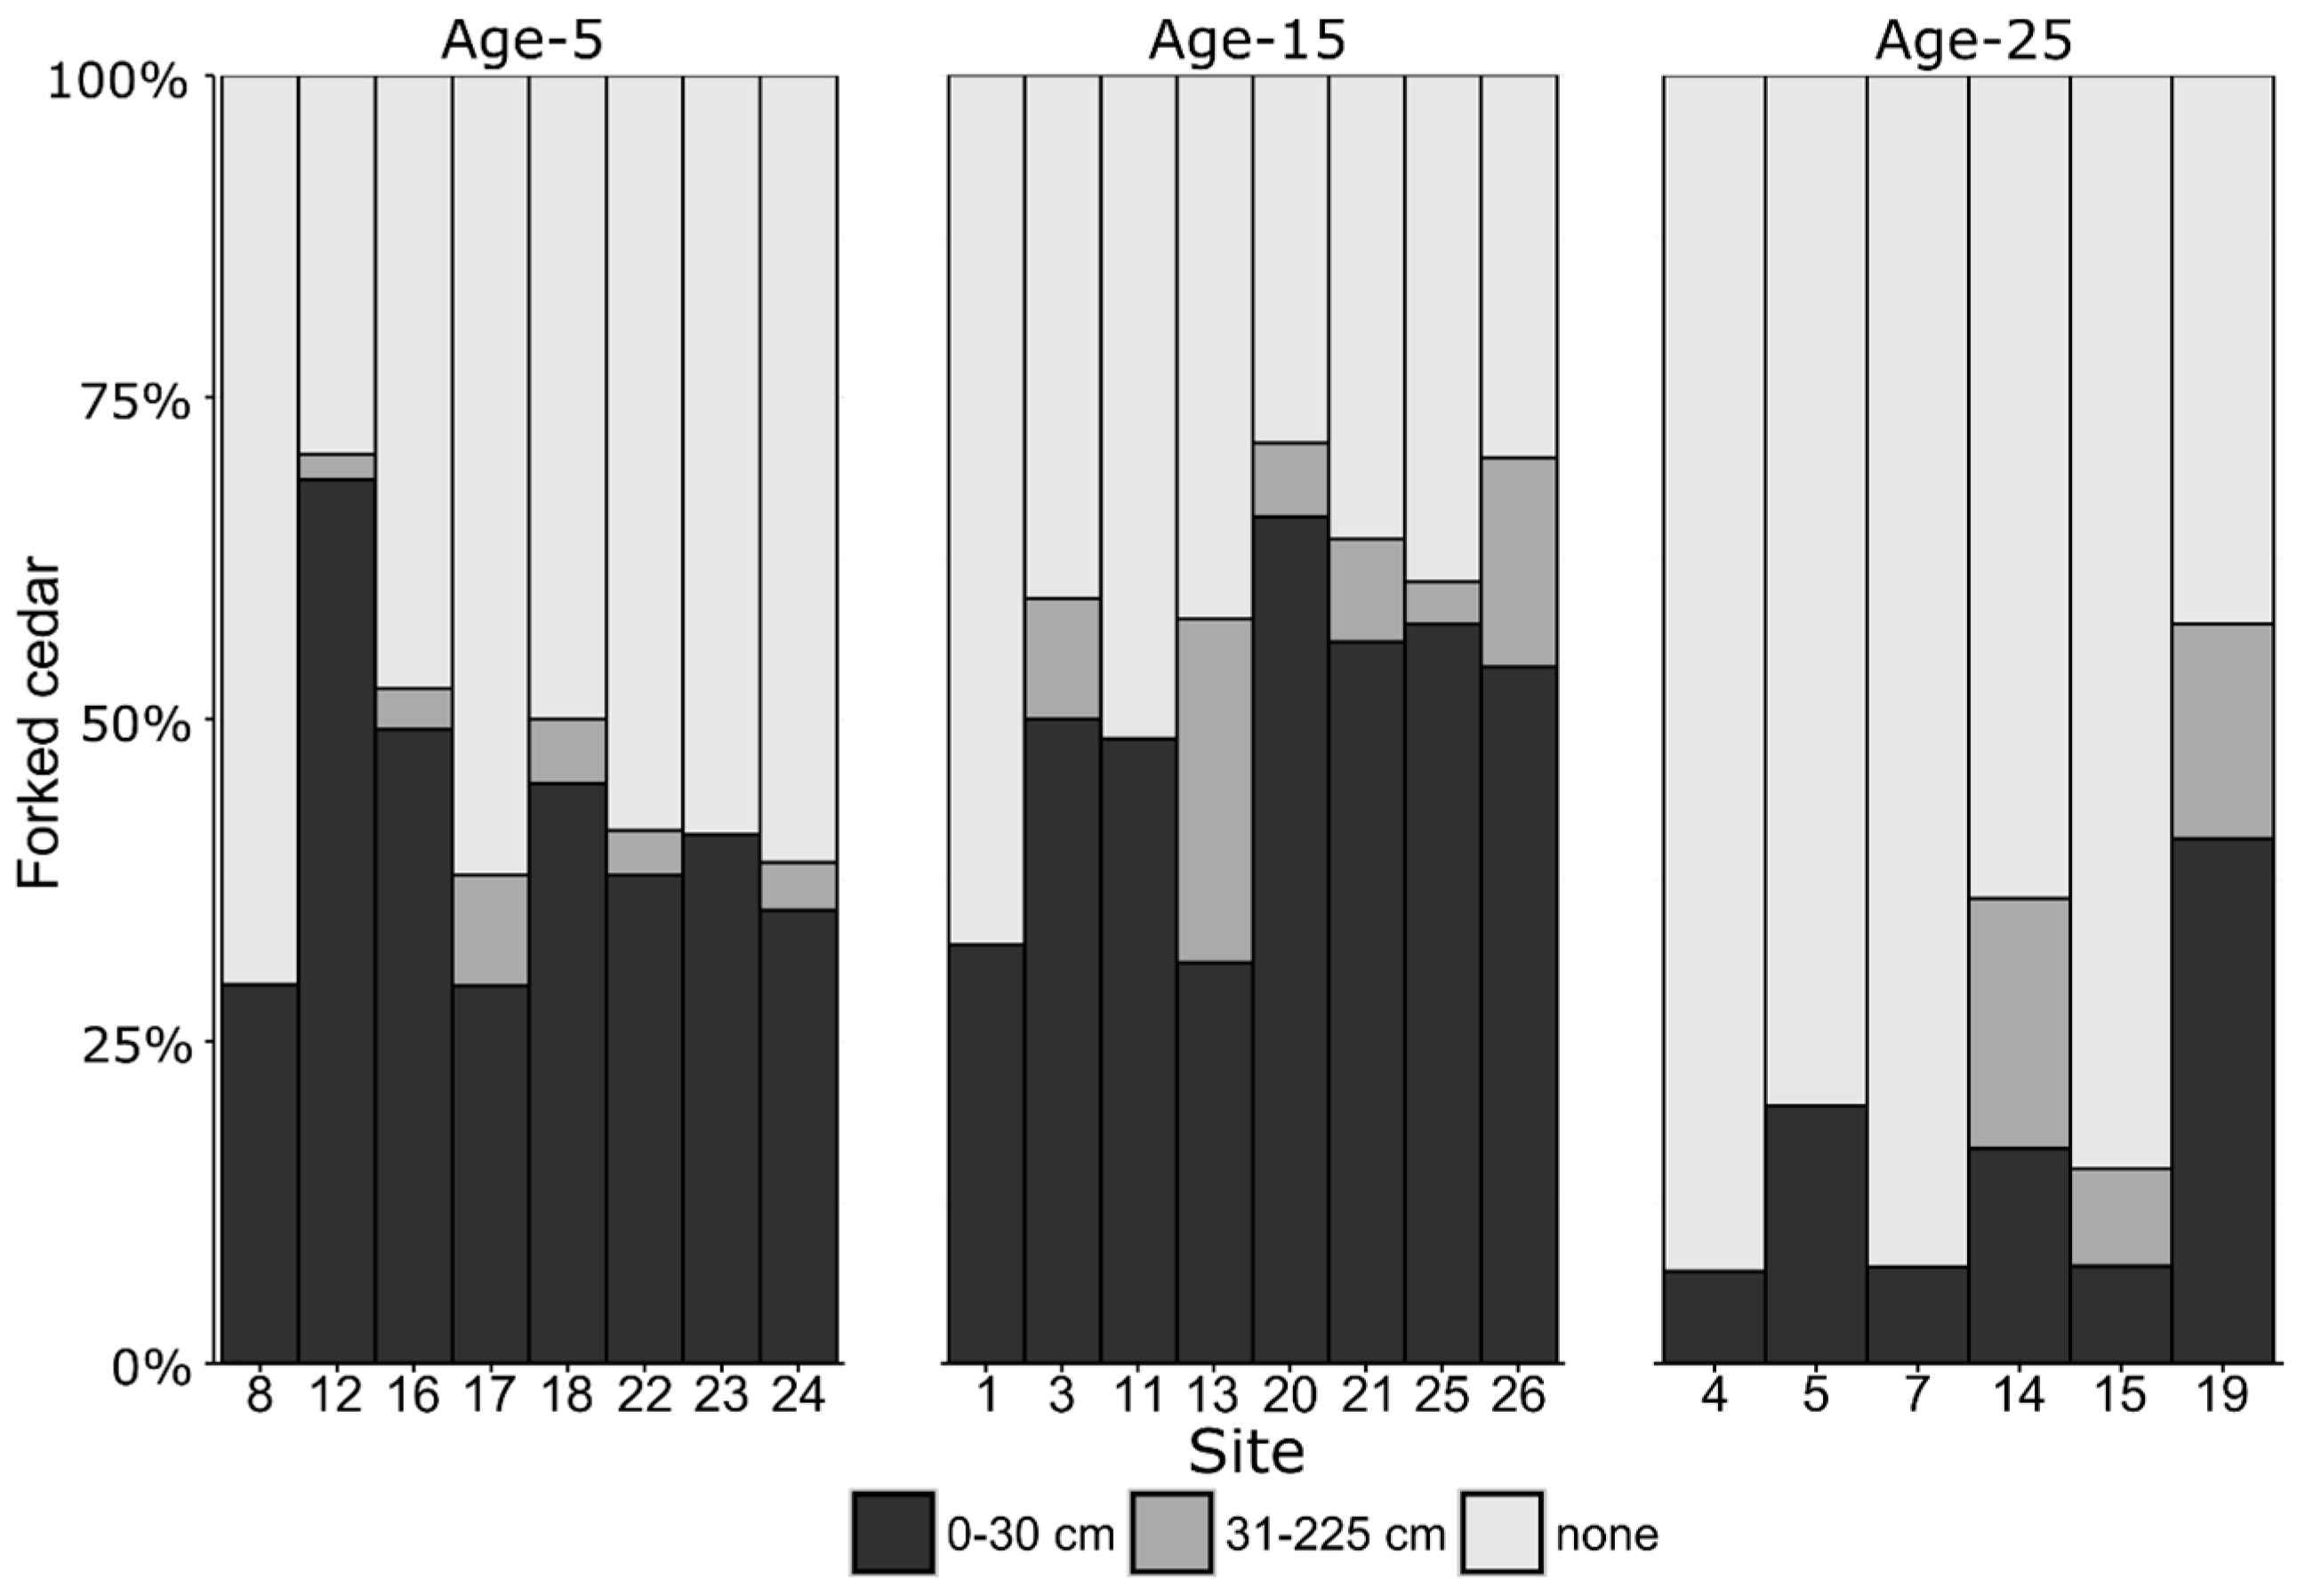
Figure 4.
Distribution of stems (%) among browsing score categories, outside and inside deer yard, for cedar and four selected highly abundant and highly palatable species, pin cherry (Prunus p.), beaked hazel (Corylus c.), mountain maple (Acer s.), and willows (Salix spp.). Error bars show maxima and minima.
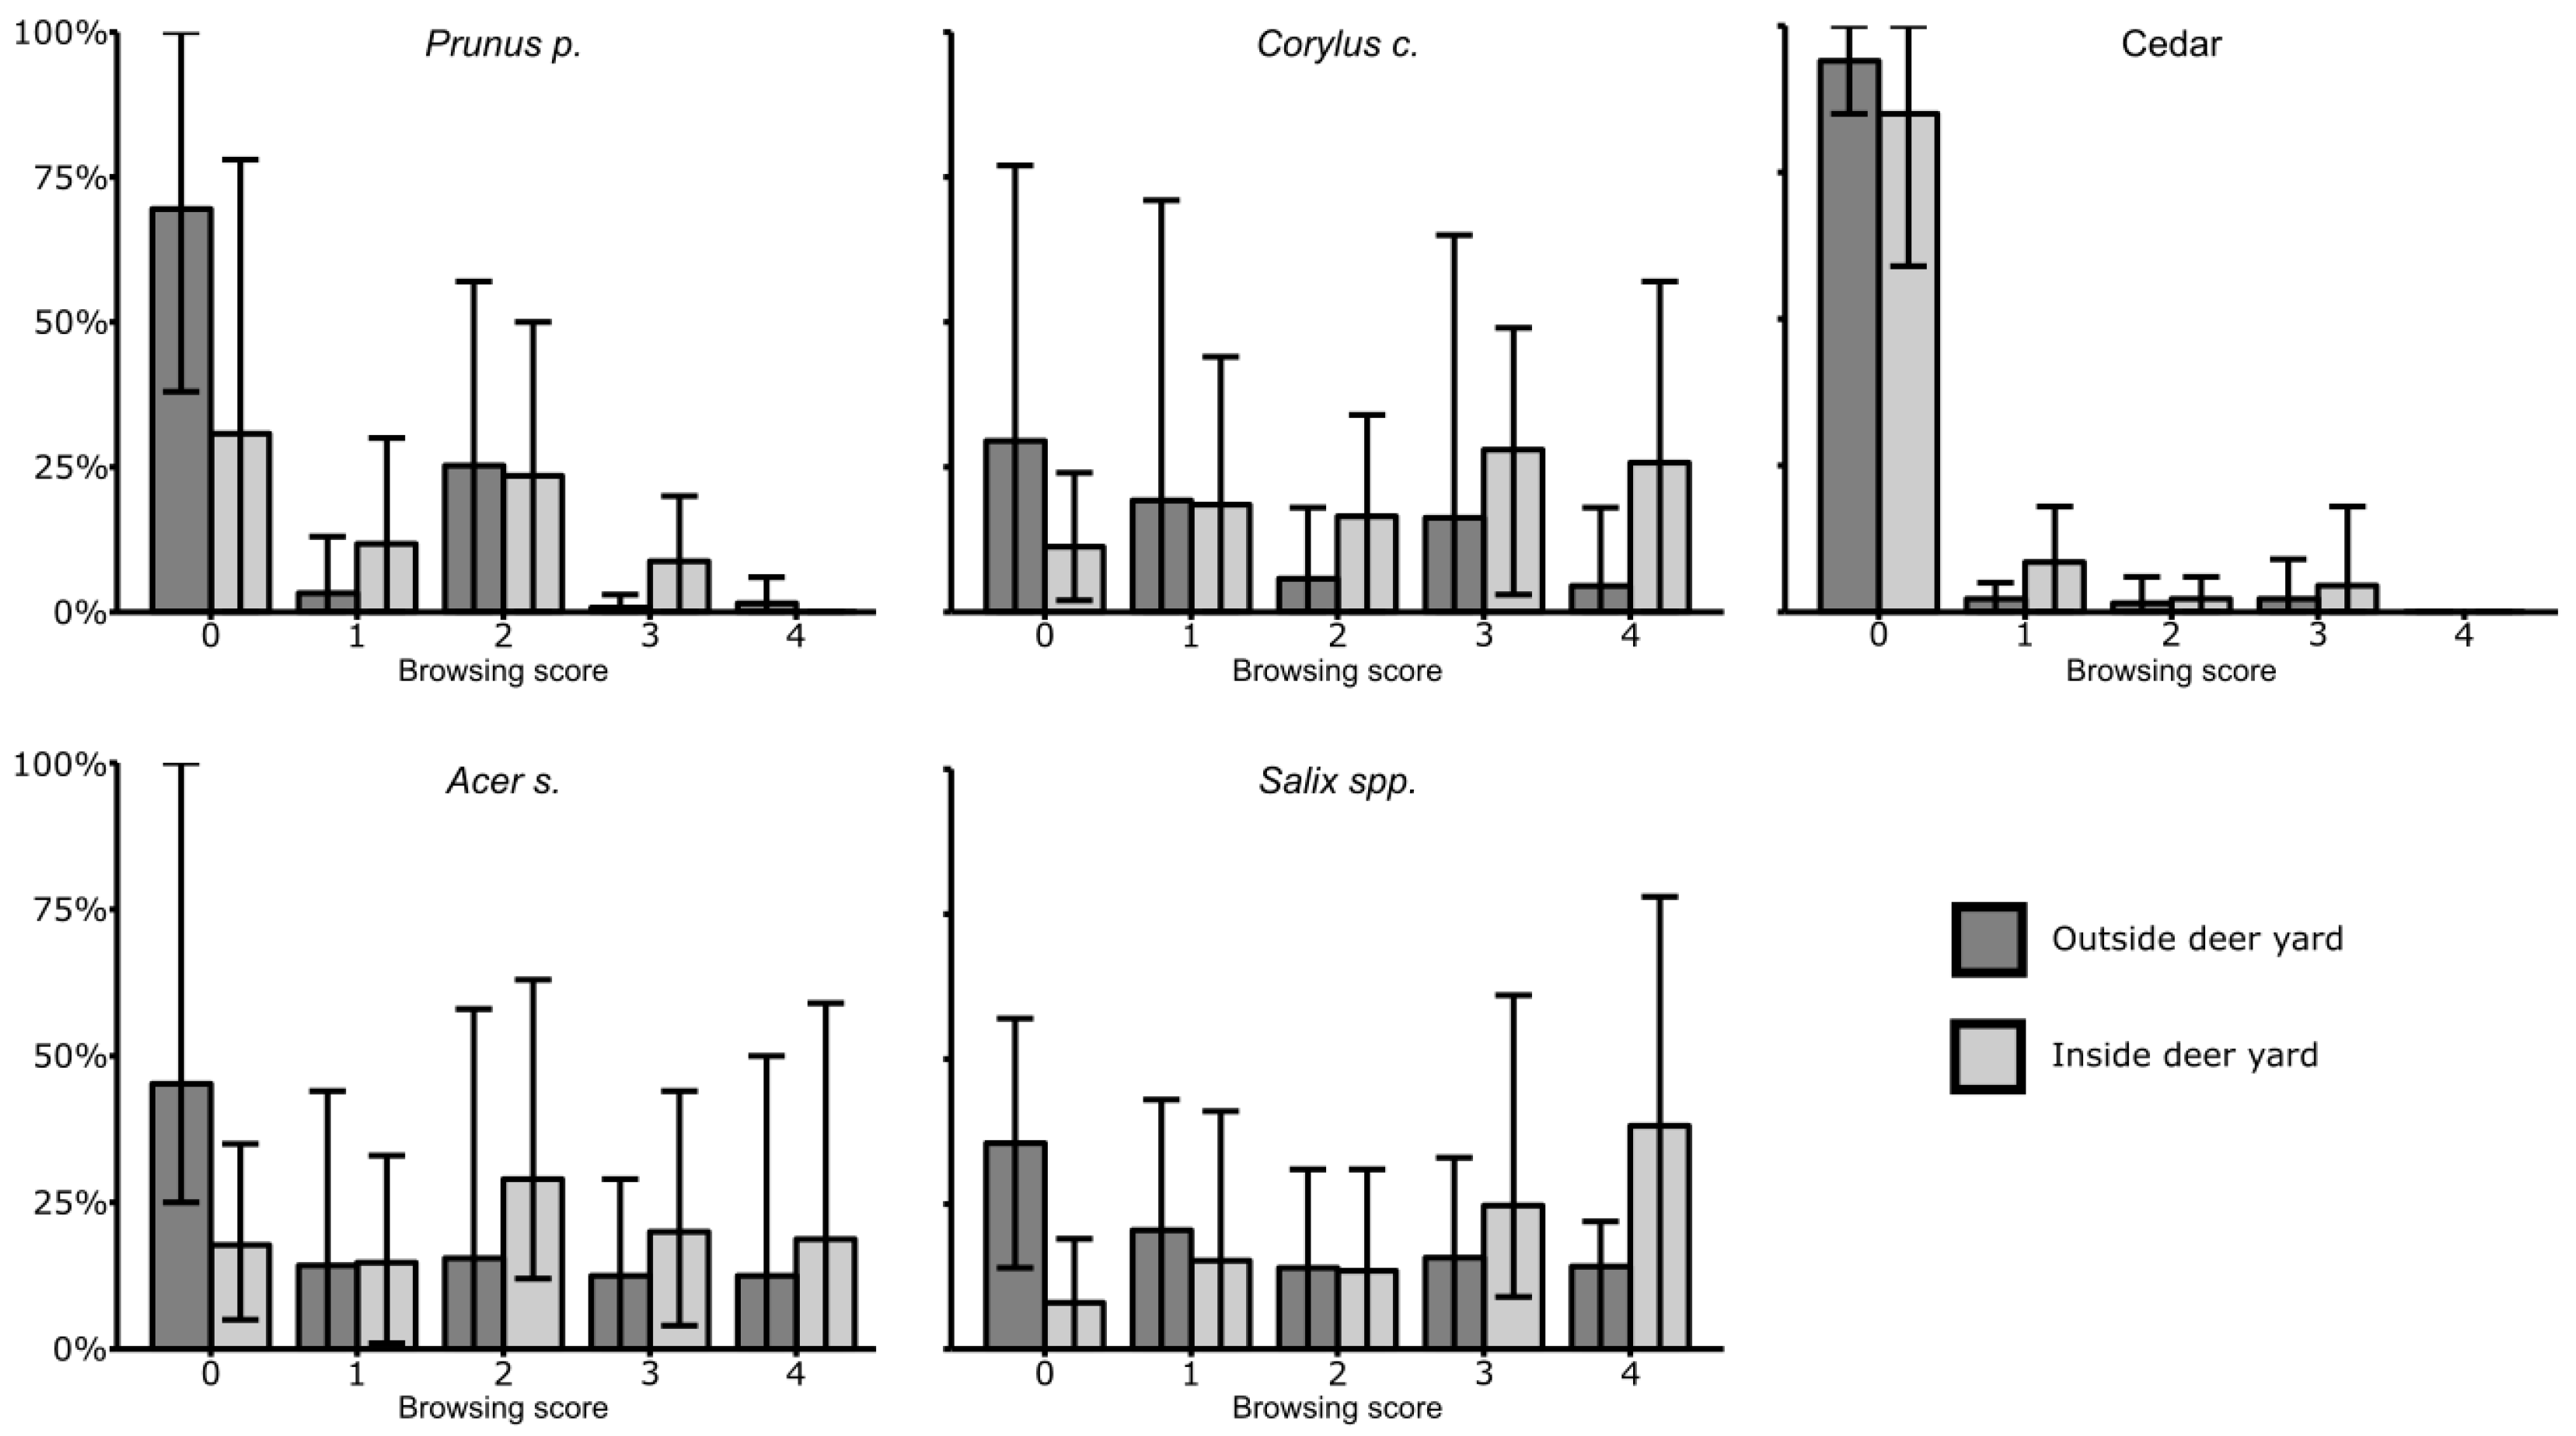
Figure 5.
(A) Average dominant cedar height (m) and (B) root collar diameter growth as a function of time since plantation (years) for non-suppressed cedar plantations. Error bars and ribbon show standard errors.
Figure 5.
(A) Average dominant cedar height (m) and (B) root collar diameter growth as a function of time since plantation (years) for non-suppressed cedar plantations. Error bars and ribbon show standard errors.
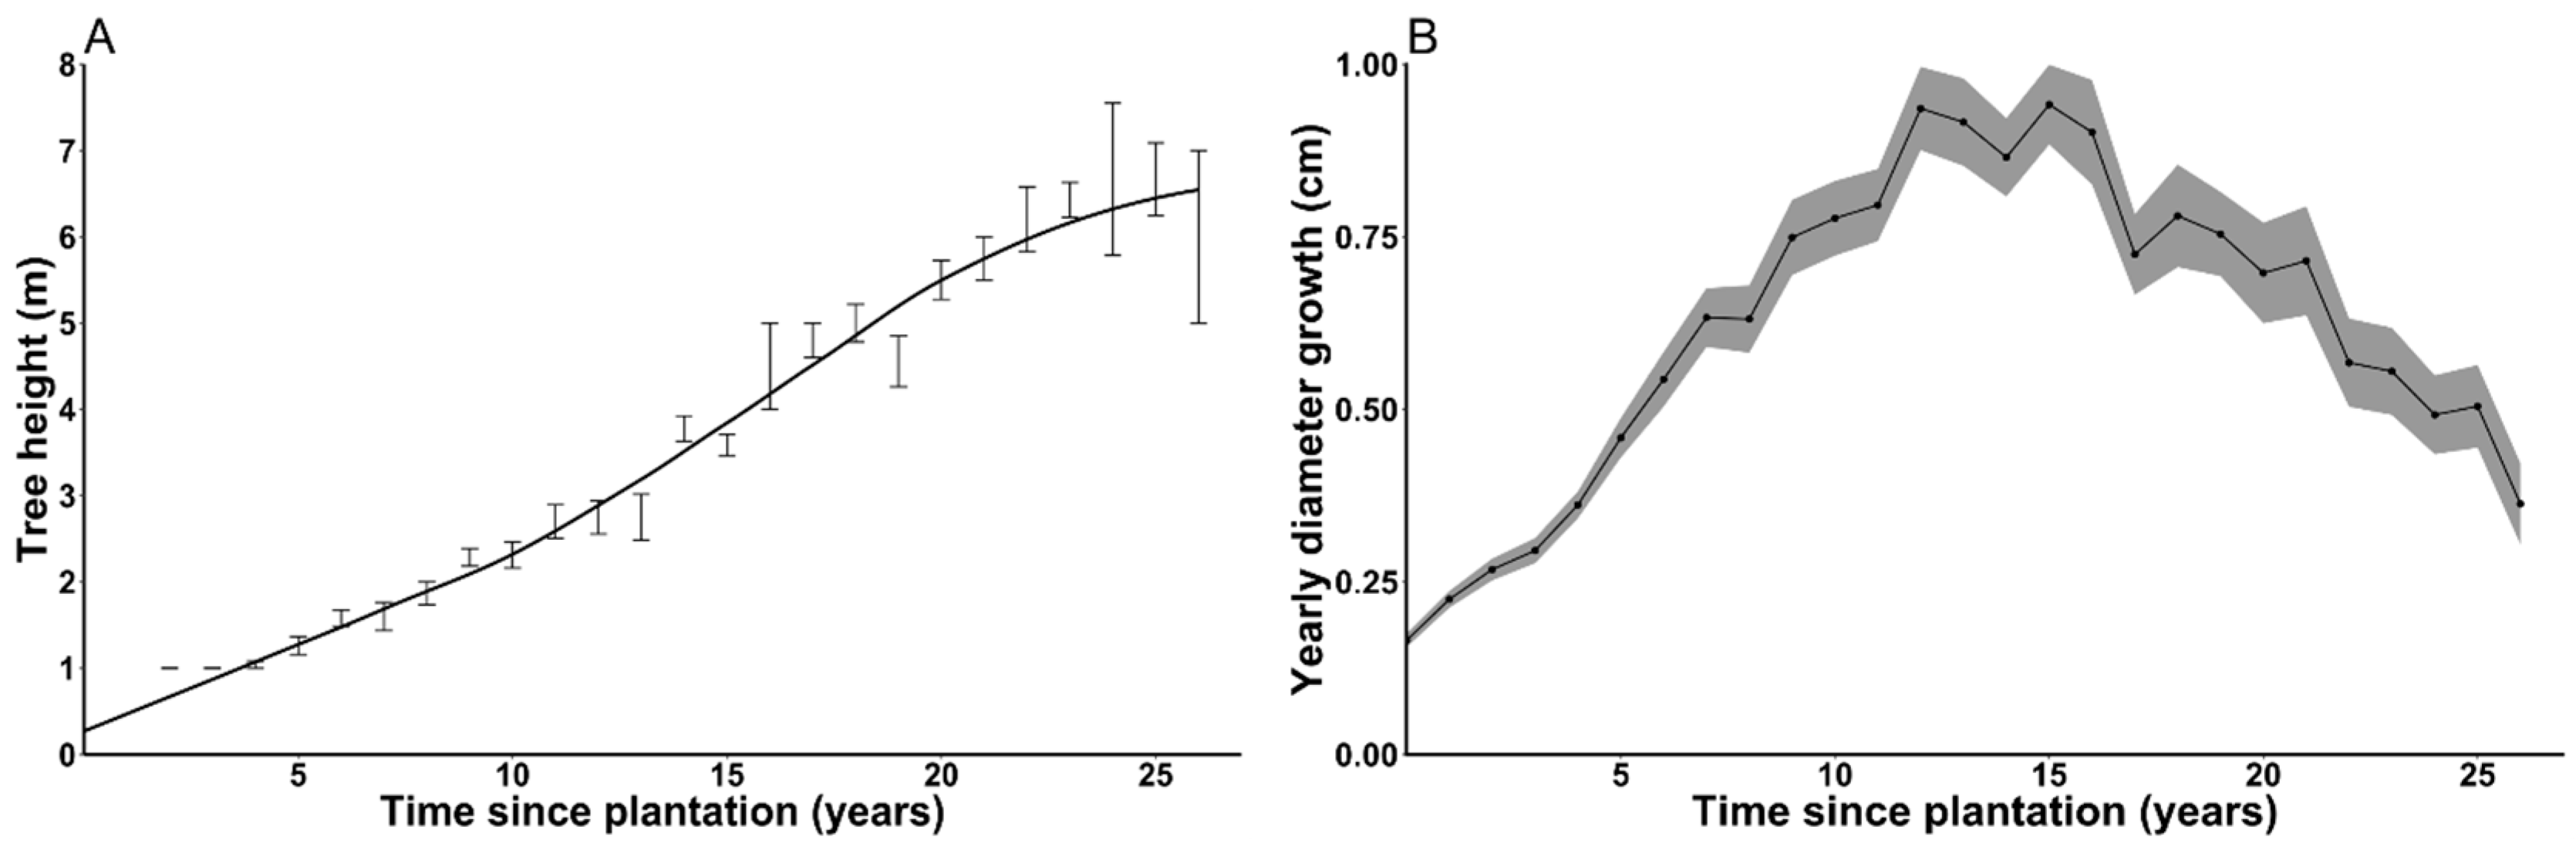
Figure 6.
Root collar diameter growth (cm) as a function of time since plantation (years) for (A) site 21 (Age-15, with fir) and for (B) Age-25, deciduous cover plantations. Mechanical brushing (Br) and thinning (Th) interventions are identified with arrows. Ribbons show standard error.
Figure 6.
Root collar diameter growth (cm) as a function of time since plantation (years) for (A) site 21 (Age-15, with fir) and for (B) Age-25, deciduous cover plantations. Mechanical brushing (Br) and thinning (Th) interventions are identified with arrows. Ribbons show standard error.

Table 1.
Number of plantations inside and outside deer yards. No Age-25 cedar plantations were found outside deer yards.
Table 1.
Number of plantations inside and outside deer yards. No Age-25 cedar plantations were found outside deer yards.
| Inside Deer Yard | Outside Deer Yard | |
|---|---|---|
| Age-5 | 3 | 5 |
| Age-15 | 4 | 4 |
| Age-25 | 6 | 0 |
Table 2.
Tested distance-independent competition indices.
| Index Name | Index Formula | Reference |
|---|---|---|
| DIq | [51] | |
| DIqdom | [51] | |
| DImax | [51] | |
| BIq | [51] | |
| BIqdom | [51] | |
| BImax | [51] | |
| BAPBA | [52] | |
| BAL | [53] | |
| BAB | [52] | |
| Canopy Closure | From hemispheric photographs |
where ds is the subject tree DBH, dq is the quadratic mean DBH of the stand, ddom is the quadratic mean DBH of the 100 dominant trees/ha, dmax is the maximum stand DBH, gs is the subject tree basal area (BA), gq is the quadratic mean BA for all trees in the stand, gdom is the quadratic mean BA of the 100 dominant trees/ha, gmax is the BA of the maximum DBH in the stand, gc is competitor tree BA where all trees in the plot, both of smaller and larger diameter, are competitor trees, and dc is competitor DBH.
Table 3.
Site information. Values are averages ± standard deviation. The n value shows the number of samples used to calculate height and root collar diameter averages.
Table 3.
Site information. Values are averages ± standard deviation. The n value shows the number of samples used to calculate height and root collar diameter averages.
| Site | Cedar Plantation Type | Deer Yard | Age | n | Dominant Tree Height (cm) | Root Collar Diameter (cm) | Competition Height (m) | Canopy Closure (%) |
|---|---|---|---|---|---|---|---|---|
| 7 | Age-25, deciduous cover, pure cedar planted | Inside | 27 | 30 | 661 ± 145 | 14.85 ± 4.46 | 11.7 ± 2.9 | 92 ± 5.1 |
| 15 | Inside | 27 | 30 | 652 ± 170 | 15.09 ± 4.62 | 13.2 ± 2.0 | 95 ± 0.0 | |
| 14 | Inside | 27 | 26 | 499 ± 223 | 12.05 ± 6.12 | 13.6 ± 2.5 | 95 ± 0.0 | |
| 19 | Age-25, thinned deciduous cover, pure cedar planted | Inside | 26 | 30 | 646 ± 116 | 18.39 ± 4.89 | 12.7 ± 0.9 | 77 ± 13.3 |
| 4 | Age-25, mixed cedar-spruce planted | Inside | 26 | 18 | 232 ± 116 | 4.58 ± 2.15 | 11.2 ± 2.1 | 95 ± 0.0 |
| 5 | Inside | 26 | 9 | 96 ± 63 | 2.24 ± 2.07 | 10.6 ± 2.1 | 87 ± 5.1 | |
| 13 | Age-15, pure cedar planted, no fir | Outside | 13 | 29 | 330 ± 63 | 6.36 ± 1.32 | N/A | 18 ± 5.2 |
| 1 | Outside | 13 | 26 | 285 ± 59 | 7.29 ± 2.62 | N/A | 27 ± 14.7 | |
| 21 | Age-15, pure cedar planted, with fir | Inside | 16 | 29 | 437 ± 47 | 12.01 ± 2.01 | 8.7 ± 2.6 | 36 ± 20.4 |
| 20 | Inside | 16 | 23 | 308 ± 113 | 7.82 ± 3.74 | 9.1 ± 2.3 | 53 ± 9.8 | |
| 25 | Outside | 12 | 30 | 415 ± 53 | 11.17 ± 2.48 | 5.8 ± 0.6 | 32 ± 15.1 | |
| 26 | Outside | 12 | 27 | 283 ± 63 | 9.12 ± 2.17 | 5.4 ± 0.7 | 18 ± 8.2 | |
| 11 | Age-15, mixed cedar-spruce planted | Inside | 14 | 19 | 150 ± 74 | 2.78 ± 1.49 | 6.7 ± 0.7 | 41 ± 11.4 |
| 3 | Inside | 12 | 24 | 272 ± 91 | 5.81 ± 2.61 | 6.8 ± 1.0 | 50 ± 0.0 | |
| 17 | Age-5, pure cedar planted | Outside | 8 | 29 | 299 ± 37 | 6.36 ± 1.32 | 4.2 ± 0.5 | 22 ± 20.4 |
| 16 | Outside | 8 | 30 | 279 ± 27 | 6.75 ± 1.60 | 3.3 ± 0.4 | 8 ± 5.2 | |
| 18 | Outside | 6 | 30 | 184 ± 30 | 4.59 ± 0.85 | N/A | N/A | |
| 12 | Outside | 6 | 25 | 181 ± 26 | 4.52 ± 0.87 | N/A | N/A | |
| 22 | Inside | 5 | 24 | 167 ± 22 | 3.26 ± 0.68 | N/A | N/A | |
| 24 | Inside | 5 | 25 | 122 ± 27 | 2.52 ± 0.66 | N/A | N/A | |
| 8 | Outside | 5 | 23 | 117 ± 30 | 2.74 ± 0.71 | N/A | N/A | |
| 23 | Inside | 5 | 30 | 76 ± 16 | 1.86 ± 0.42 | N/A | N/A |
Table 4.
Results of competition index selection based on AICc. ∆AICc is compared to the model with the lowest AICc.
Table 4.
Results of competition index selection based on AICc. ∆AICc is compared to the model with the lowest AICc.
| Model | AICc | ∆AICc | AICc Weight | Marginal Pseudo R2 |
|---|---|---|---|---|
| D0 (null model) | −128.81 | 19.05 | 0.00 | 0.41 |
| D0 + BAL | −147.86 | 0 | 0.99 | 0.59 |
| D0 + Canopy Closure | −133.35 | 14.51 | 0.01 | 0.46 |
| D0 + DIq | −127.14 | 20.72 | 0.00 | 0.42 |
| D0 + DIqdom | −127.11 | 20.75 | 0.00 | 0.42 |
| D0 + BIq | −127.10 | 20.76 | 0.00 | 0.42 |
| D0 + BImax | −126.83 | 21.03 | 0.00 | 0.40 |
| D0 + BIqdom | −126.81 | 21.04 | 0.00 | 0.41 |
| D0 + BAPBA | −126.65 | 21.21 | 0.00 | 0.40 |
| D0 + BAB | −126.64 | 21.22 | 0.00 | 0.40 |
| D0 + DImax | −126.64 | 21.22 | 0.00 | 0.41 |
Table 5.
Results of model selection for diameter growth prediction using AICc. The K value shows the number of parameters in the model. Only models with an AICc weight > 0.01 are shown for concision.
Table 5.
Results of model selection for diameter growth prediction using AICc. The K value shows the number of parameters in the model. Only models with an AICc weight > 0.01 are shown for concision.
| Model | K | AICc | ∆AICc | AICc Weight | Cumulative AICc Weight | Marginal Pseudo R2 |
|---|---|---|---|---|---|---|
| D0 + Wet + Curve + CI | 7 | −148.70 | 0.00 | 0.20 | 0.20 | 0.60 |
| D0 + Wet + CI | 6 | −148.03 | 0.67 | 0.14 | 0.34 | 0.58 |
| D0 + Wet + Curve + CI + RATIO | 8 | −147.98 | 0.72 | 0.14 | 0.47 | 0.62 |
| D0 + CI | 5 | −147.86 | 0.84 | 0.13 | 0.60 | 0.59 |
| D0 + Wet + CI + RATIO | 7 | −147.36 | 1.34 | 0.10 | 0.70 | 0.61 |
| D0 + Curve + CI | 6 | −146.81 | 1.90 | 0.08 | 0.78 | 0.60 |
| D0 + CI + RATIO | 6 | −146.70 | 2.00 | 0.07 | 0.85 | 0.61 |
| D0 + Curve + CI + RATIO | 7 | −145.50 | 3.20 | 0.04 | 0.89 | 0.62 |
| D0Hare + D0Ungu + Wet + Curve + CI | 11 | −144.30 | 4.40 | 0.02 | 0.91 | 0.64 |
| D0Hare + D0Ungu + Wet + CI | 10 | −143.64 | 5.06 | 0.02 | 0.93 | 0.63 |
| D0Hare + D0Ungu + CI | 9 | −143.50 | 5.20 | 0.01 | 0.94 | 0.63 |
| D0Hare + D0Ungu + Wet + Curve + CI + RATIO | 12 | −143.13 | 5.57 | 0.01 | 0.96 | 0.66 |
Table 6.
Model averaged parameter estimates and 95% confidence intervals. Shaded lines show parameters that contribute to root collar radial growth variation according to model averaging.
Table 6.
Model averaged parameter estimates and 95% confidence intervals. Shaded lines show parameters that contribute to root collar radial growth variation according to model averaging.
| Parameter | Estimate | Lower UCI | Upper UCI |
|---|---|---|---|
| Curve | 0.06 | −0.02 | 0.15 |
| CI | −0.08 | −0.11 | −0.06 |
| Wet | −0.12 | −0.24 | 0.01 |
| Fr | NA | NA | NA |
| RATIO | 0.06 | −0.03 | 0.15 |
| D0Hare | 0.00 | −0.01 | 0.00 |
| D0Ungu | 0.00 | −0.01 | 0.01 |
| D0 | 0.04 | 0.03 | 0.04 |
© 2017 by the authors. Licensee MDPI, Basel, Switzerland. This article is an open access article distributed under the terms and conditions of the Creative Commons Attribution (CC BY) license (http://creativecommons.org/licenses/by/4.0/).
Share and Cite
MDPI and ACS Style
Villemaire-Côté, O.; Ruel, J.-C.; Sirois, L. Development of Northern White-Cedar (Thuja occidentalis L.) Plantations within and outside Deer Yards. Forests 2017, 8, 326. https://doi.org/10.3390/f8090326
AMA Style
Villemaire-Côté O, Ruel J-C, Sirois L. Development of Northern White-Cedar (Thuja occidentalis L.) Plantations within and outside Deer Yards. Forests. 2017; 8(9):326. https://doi.org/10.3390/f8090326
Chicago/Turabian StyleVillemaire-Côté, Olivier, Jean-Claude Ruel, and Luc Sirois. 2017. "Development of Northern White-Cedar (Thuja occidentalis L.) Plantations within and outside Deer Yards" Forests 8, no. 9: 326. https://doi.org/10.3390/f8090326
Note that from the first issue of 2016, this journal uses article numbers instead of page numbers. See further details here.