Differentiating Structural and Compositional Attributes across Successional Stages in Chilean Temperate Rainforests

1
Instituto de Bosques y Sociedad, Facultad de Ciencias Forestales y Recursos Naturales, Universidad Austral de Chile, Casilla 567, Valdivia 5090000, Chile
2
Laboratorio de Biometría, Departamento de Ciencias Forestales, Universidad de La Frontera, Casilla 54-D, Temuco 4780000, Chile
*
Author to whom correspondence should be addressed.
Forests 2017, 8(9), 329; https://doi.org/10.3390/f8090329
Submission received: 30 June 2017
/
Revised: 19 August 2017
/
Accepted: 22 August 2017
/
Published: 6 September 2017
(This article belongs to the Special Issue Old Growth Temperate and Boreal Forests: Processes, Functions, and Dynamics)
Abstract
:The landscape in the lowlands of south-central Chile is dominated by agricultural lands and forestry plantations of exotic species. Natural forests are restricted to successional forests, while old-growth forests are nearly absent. The lack of old-growth forests may deprive society from some ecosystem services. Both successional and old forests differ in their ecological functions and in the ecosystem services they can provide. To promote old-growth characteristics in successional forests, it becomes necessary to know which compositional and structural attributes differentiate forests along succession. We aim at identifying the differential attributes among successional and old-growth forests in the lowlands in the northern portion of the Valdivian Rainforests. We analyzed 19 variables in seven different forests and found statistically significant differences in 13 of them. A subset of these variables illustrated major patterns that differentiate successional stages, of which a few could be more easily controlled through management. The latter include lowering tree densities (from >3000 to <1500 trees per hectare), increasing volume of large trees, especially of shade-tolerant species, and structural heterogeneity (a Gini coefficient >0.7 represents older forests). While successional forest show a rapid recovery, forest managers would need to focus in controlling these attributes to increase their old-growth characteristics.
1. Introduction
Old-growth forests are essential for providing important ecosystems services such as carbon sequestration, regulation of hydrological and nutrient cycles, habitat for sustaining biodiversity, and provision of cultural values [1,2]. In spite of past and current human pressures upon forest ecosystems, 23% of the remaining forests of the world can be considered old-growth without or with minimum signs of human-driven disturbances [2]. The massive and continuous loss of old-growth forests due to human pressure for firewood, fiber and timber, in addition to land-use changes, especially for agriculture [3], carries with it great challenges for the provision of ecosystem services from remnant forest ecosystems. However, while old-growth forests are disappearing at rapid rates in many regions, second-growth forests are increasing, and the latter may represent the forests of the future [4].
Following the designation given for old-growth temperate forests in Chile [5] and elsewhere [6,7,8], these forests contain trees >200 years old, with complex vertical structure and null or scarce logging traces and therefore those without trees of these ages are considered successional forests. Temperate old-growth forests have some unique characteristics [9]. Many of their main characteristics are dependent on large-sized trees [10]. Some of their common characteristics include the presence of old trees (>200 and some older than 500 years), uneven-aged structures, a rich vertical structure, high values of basal area (>80 m2 ha−1), high levels of live and dead biomass with variable decomposition classes (around 100 Mg ha−1, or more), frequent occurrence of canopy gaps, a diverse understory, dominance of late-successional tree species, and many species of lianas and epiphytes [5,9,10,11,12,13,14]. In comparison, secondary forests have homogeneous tree canopies dominated by one or a few pioneer tree species, trees of relatively small sizes (heights and diameters) that confer low stand volumes or biomass, scarce coarse woody debris and snags, and poor understories in terms of species diversity and cover [6,7,15,16,17,18].
Currently, Chile has 4.3 million ha of old-growth forests, out of a total of 13.6 million ha of native forests [19]. Within the division of temperate rainforests in Chile [20,21] these old-growth forests are mainly concentrated in the southernmost part of the country, within the region of the North Patagonian and Magellanic Temperate Rainforests, and are very scarce within the region of the Valdivian Temperate Rainforests (37°45′ to 43°30′ S Lat.). The Valdivian Temperate Rainforests are located in a region with high human population and multiple threats, including conversion to agriculture and timber plantations, and the intensive logging of commercially valuable tree species, along with related wildfires, which have accounted for the loss of an estimated 60 percent of forest cover, and the degradation of the majority of remaining forests [22]. Within the region of Valdivian Temperate Rainforests, the estimated area of old-growth forests is approximately 550 thousand ha [19], mostly restricted to both the Andean and Coastal ranges, and scarce in the lowlands of the Intermediate Depression. In this scenario, there is a major need to identify structural and compositional attributes of old-growth forests in regions that still hold these types of forests. In addition to learning which attributes determine the ecological functions and eventually ecosystem services of old-growth forests, this knowledge in structure and composition could allow modifications in silvicultural treatments [23] in second-growth forests in order to manipulate these forests to attain more rapidly these old-growth attributes, i.e., provide more old-growth characteristics of these successional forests.
These remnant old-growth forests have been poorly studied [24,25], in contrast with second-growth forests that are pervasive in the disturbed landscape of this region [15,16,17]. In this study, we aimed to determine the differential attributes in the structure and composition between old- and second-growth forests in the lowlands of south-central Chile in the northern portion of the Valdivian Temperate Rainforest. Our objective were to (a) determine which compositional and structural variables are most distinctive between successional (60–150 year) and old-growth (>250 year) forests; and (b) discuss which differential variables are more feasible to manage to create old-growth characteristics in successional forests. This would serve to better focus efforts of restoration of old-growth attributes in secondary forests, or guide transformation of even- to uneven-aged silviculture, thus making management efforts more efficient.
2. Materials and Methods
2.1. Study Sites
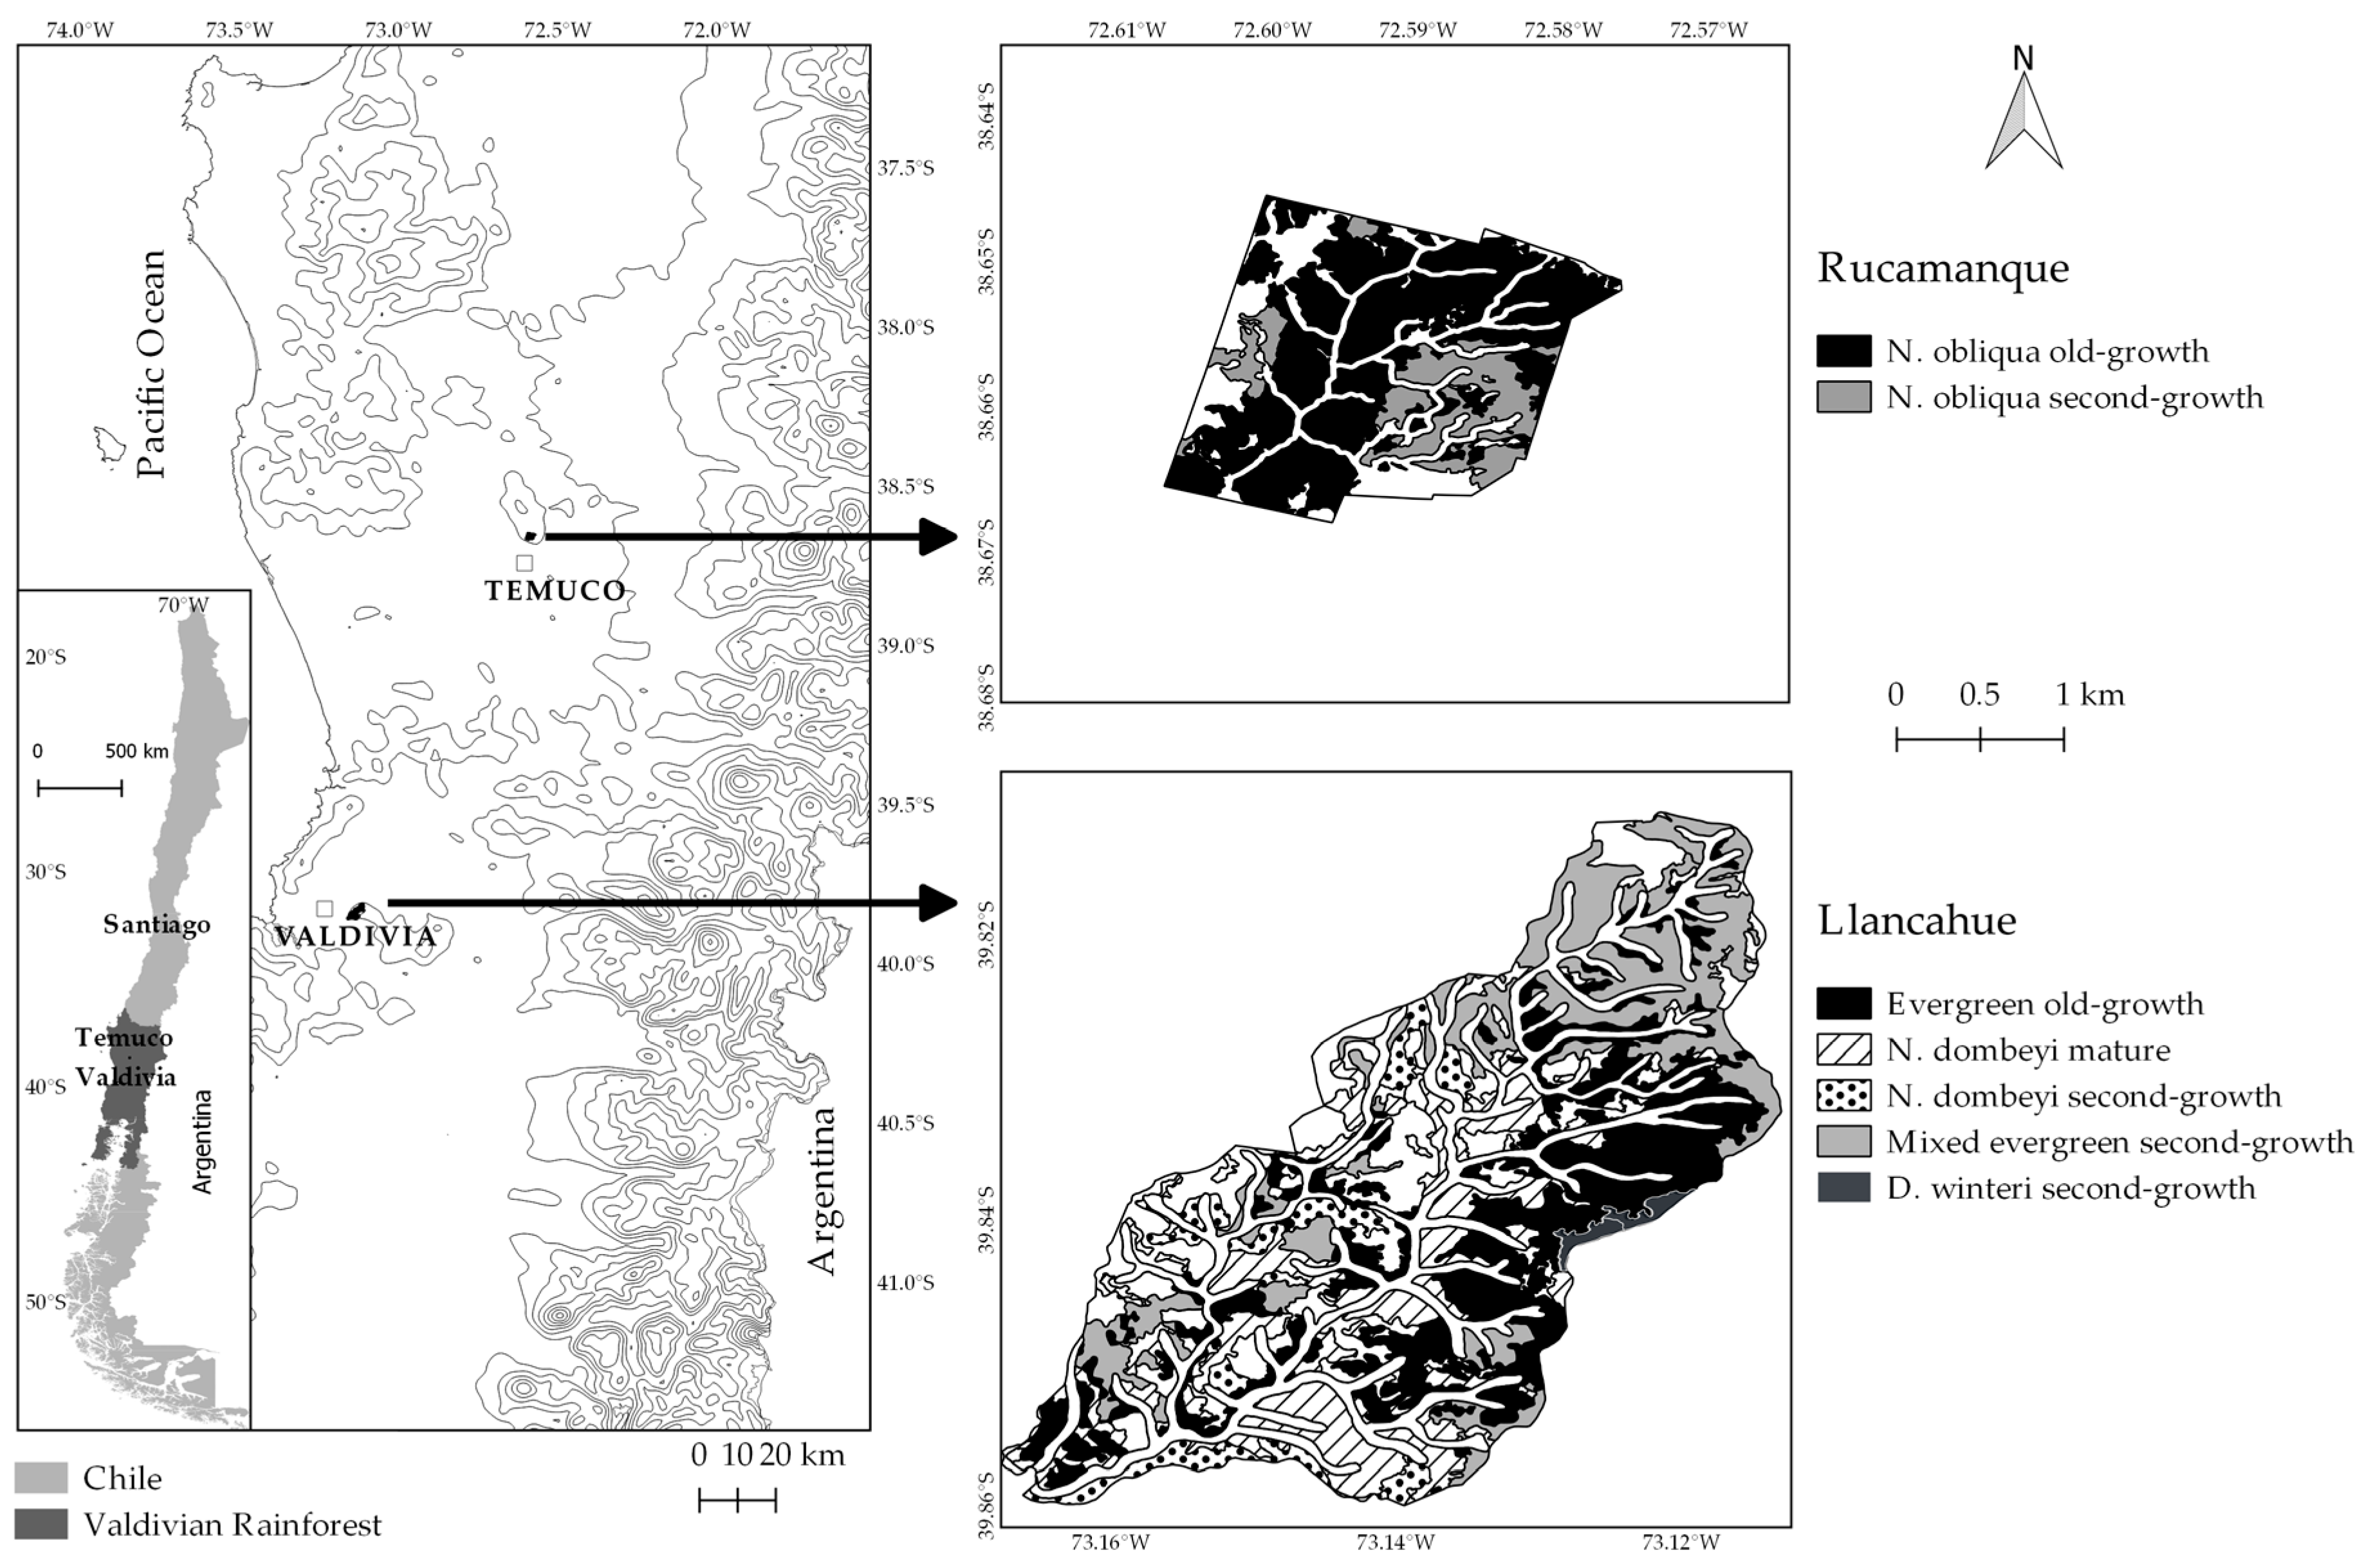
We focus in the Valdivian Temperate Rainforests [20] at low- to mid-elevations in the Coastal Range of south-central Chile. The sampled forests were located in Rucamanque (38°66′ S, 72°59′ W), a 435-ha property administered by the Universidad de la Frontera, and in Llancahue (39°84′ S, 73°14′ W), a 1270-ha property administered and managed by the Universidad Austral de Chile.
The study sites are located between 300 and 450 m a.s.l. in elevation [21,26] (Figure 1). At this latitudinal range and elevation, there is a transition between two Chilean forest types, the Evergreen and the Roble-Rauli-Coihue forest types (sensu [15]). Environmental characteristics are homogeneous within this region. In terms of climate, both locations have average annual temperatures close to 12 °C and a rainy temperate climate (2300 mm in Llancahue and 1300 mm in Rucamanque), with declining rainfall during spring and summer and usually a dry spell during summer [27]. Soils between the two sites were very similar (Palehumult soil type, [28,29]), with medium depth and texture, and composed of ancient volcanic ashes.
We define old-growth forests as stands containing trees >200 years old, following the designation given for old-growth temperate forests in Chile [5] and elsewhere [6,7,8]. This study included two old-growth and five successional forests (Figure 1 and Table 1). The old-growth forests have trees >250 years old [26,30]; their dynamics are dominated by the occurrence of gaps (tree-fall gap dynamics), with little evidence of human-caused disturbances. These old-growth forests (EgOg and NoOg; Table 1) were dominated by the same canopy species (Aextoxicon punctatum, Eucryphia cordifolia and Laureliopsis philippiana) but the one in Rucamanque also had some emergent Nothofagus obliqua trees. The successional forests (Table 1) included four second-growth forests that were established following human-caused fires, with ages between 60 and 100 years [26,31,32]. The MESg was a mixture of several hardwood evergreen species, including some short-lived pioneer species of the Proteaceae family, but among successional canopy species was dominated by E. cordifolia, L. philippiana and D. winteri. The other three second-growth forests were dominated (i.e., at least 50% of the basal area in one species), respectively, by Drimys winteri (DwSg), Nothofagus dombeyi (NdSg), and Nothofagus obliqua (NoSg), but all were also mixtures and had common late-successional tree canopy species such as E. cordifolia, L. philippiana, A. punctatum and D. winteri (Table 1). The MESg and DwSg forests were mostly established between 1940 and 1970 (they were on average close to 60 years old), and NoSg and NdSg forests were mostly established between 1910 and 1940 (they were on average 90 years old; [32]). The remaining successional forest (NdM) was also dominated by N. dombeyi and was also originated by human-caused fires as observed in the field. We did not have age records of this forest, but it is neighboring the NdSg forest (Figure 1), so it shares the same site characteristics, and the dominant trees are larger and taller, suggesting that this forest is older than the second-growth and younger than the old-growth forests (see [6] for a similar classification of young, mature and old-growth forests). It also shared similar tree species with the other sampled forests in this study (Table 2). Overall, if no large-scale disturbances interrupt the successional pathway of these successional forests, they should converge into the typical low- to mid-elevation old-growth forests of the Coastal Range of south-central Chile, i.e., forests dominated by E. cordifolia, L. philippiana, A. punctatum.
2.2. Measurements
In each of the seven types of forests (Figure 1), we randomly established three 900 m2 (30 × 30 m) sample plots. In each plot, live trees with a diameter at breast height (dbh) at least 5 cm were recorded, and several variables were measured, such as dbh, species, and crown class (emergent, dominant, codominant, intermediate and overtopped). Standing dead trees at least 20 cm in dbh were also measured for dbh and height [33], and all logs laying on the forest floor at least one meter in length and 10 cm diameter at its smallest end (coarse woody debris or CWD) were recorded for their diameter, length and decomposition class (sensu [11]). Regeneration was assessed by systematically establishing 32 subplots of 2 m2 within each plot, in which tree species seedlings (<2 m in height) were counted and vegetation cover estimated for each vascular species (5–200 cm in height) using the Braun-Blanquet classification with the following seven-point scale: (5) cover from 75.1 to 100.0%, (4) cover from 50.1 to 75.0%, (3) cover from 25.1 to 50.0%, (2) cover from 10.1 to 25.0%, (1) cover from 1.1 to 10.0%, (+) cover up to 1.0%, (r) one specimen per plot [34]. We selected 19 variables to represent structural and compositional attributes (Table 2; [1,5,6,9,15,35,36,37,38,39]). These variables were measured, or estimated, for each sampling plot. To determine both basal area and richness by tree species’ shade tolerance, we used Donoso [15]. Midtolerant species are those with intermediate tolerance to shade.
2.3. Data Analyses
Height and volume of each tree were estimated for each plot by equations proposed by Salas and Real [40] and Salas [41], respectively. To estimate the volume of each piece of coarse woody debris, we used the Smalian formula, which estimates volume by using the length and cross sections at each end of the log [42]. Dry biomass was obtained by multiplying the volume of each piece by the wood specific density (g cm−3). We used a mean wood density of 0.51 g cm−3 for decay class I (range 0.47–0.53 g cm−3), 0.29 g cm−3 for decay class II (range 0.27–0.36 g cm−3), and 0.24 g cm−3 for decay class III (range 0.19–0.28 g cm−3 [11]. We computed stand variables (e.g., basal area, gross volume, and dominant tree height) by plot. Dominant tree height was computed by the U-estimator method proposed by García and Batho [43], which is not affected by plot size. In addition to traditional stand variables, we also computed different indices at the plot level, as described in the following paragraphs.
The Gini coefficient (GC) is a ratio index of structural heterogeneity constructed from the basal area of individuals of a stand [37] and is computed as follows:
where is the rank of each tree in ascending order, is the total number of trees and corresponds to the basal area of the -tree. The coefficient has a minimum value of zero, when all trees are of equal size and a maximum of one when all trees are of different size [37].
The Shannon diversity index () was calculated from the mean cover under each category (r, +, 1, 2, 3, 4, 5) of the Braun Blanquet classification. Cover values used in each category were 0.1% (r), 0.5% (+), 5% (1), 17.5% (2), 37.5% (3), 62.5% (4), 87.5% (5) [44], and the index was computed as follows:
where is the total number of species of the plot (richness), is the mean cover for the ith-species in a plot and is the sum of mean covers for all species.
Each of the 19 variables was compared among all forests. Before making any comparison, we evaluated the homoscedasticity assumption with Levene’s test. Variables that met this assumption were compared with analysis of variance (ANOVA), while those that did not were compared with the non-parametric Kruskal Wallis test, thus avoiding variable transformations and allowing for direct inference of results. To detect homogeneous groups (forest types without significant statistical differences), we used the Bonferroni test (α = 0.05). All the data analyses explained above were carried out using the R software [45].
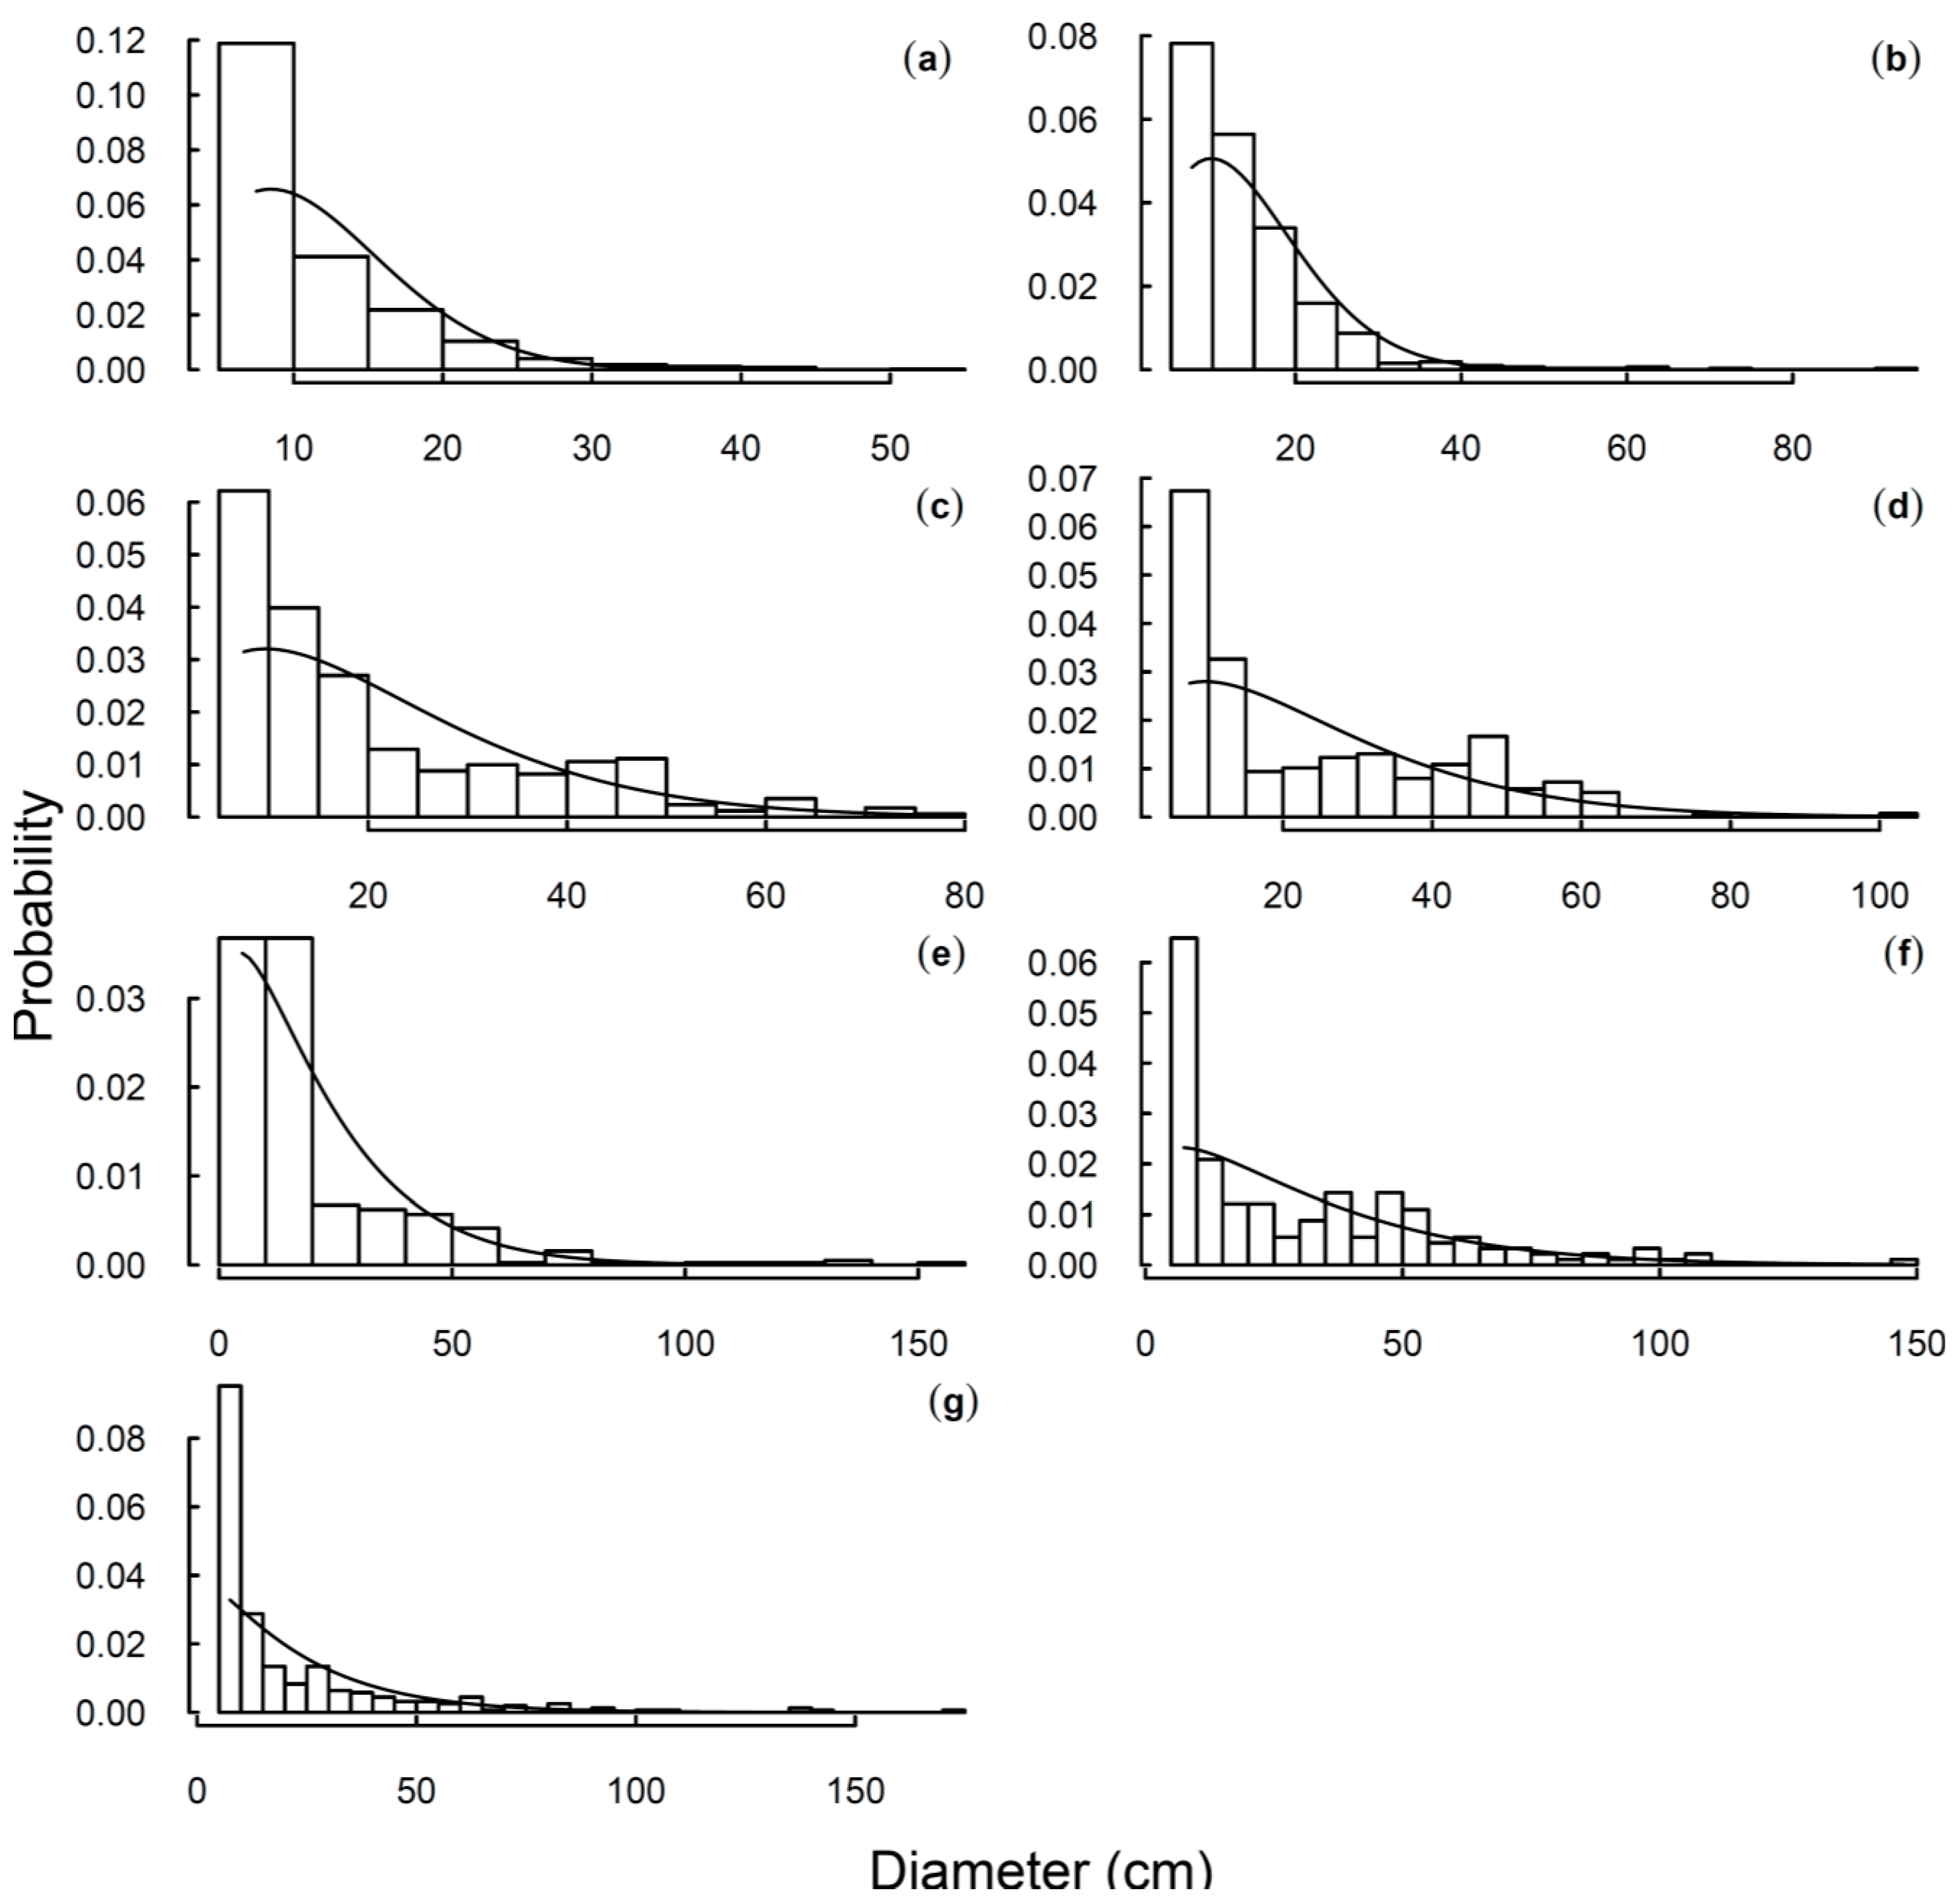
We also plotted the diameter distribution of each forest by functional groups according to shade tolerance. Furthermore, we fitted the Weibull probability density function to represent the shape of thediameter distribution of each type of forest. The model was fitted using the maximum likelihood method. The observed relative frequency of diameters (i.e., histogram) and the fitted Weibull modelsare shown in Appendix A.
3. Results
From all the studied variables, 13 had significant differences between forest types (Table 3). The variables that had no significant differences among forests were coarse woody debris, both basal area and density of snags, and species richness for all species, shade-intolerant species and mid-tolerant species. Although these variables showed some patterns across these forests in different successional stages, they usually had a high variability (e.g., coarse woody debris).
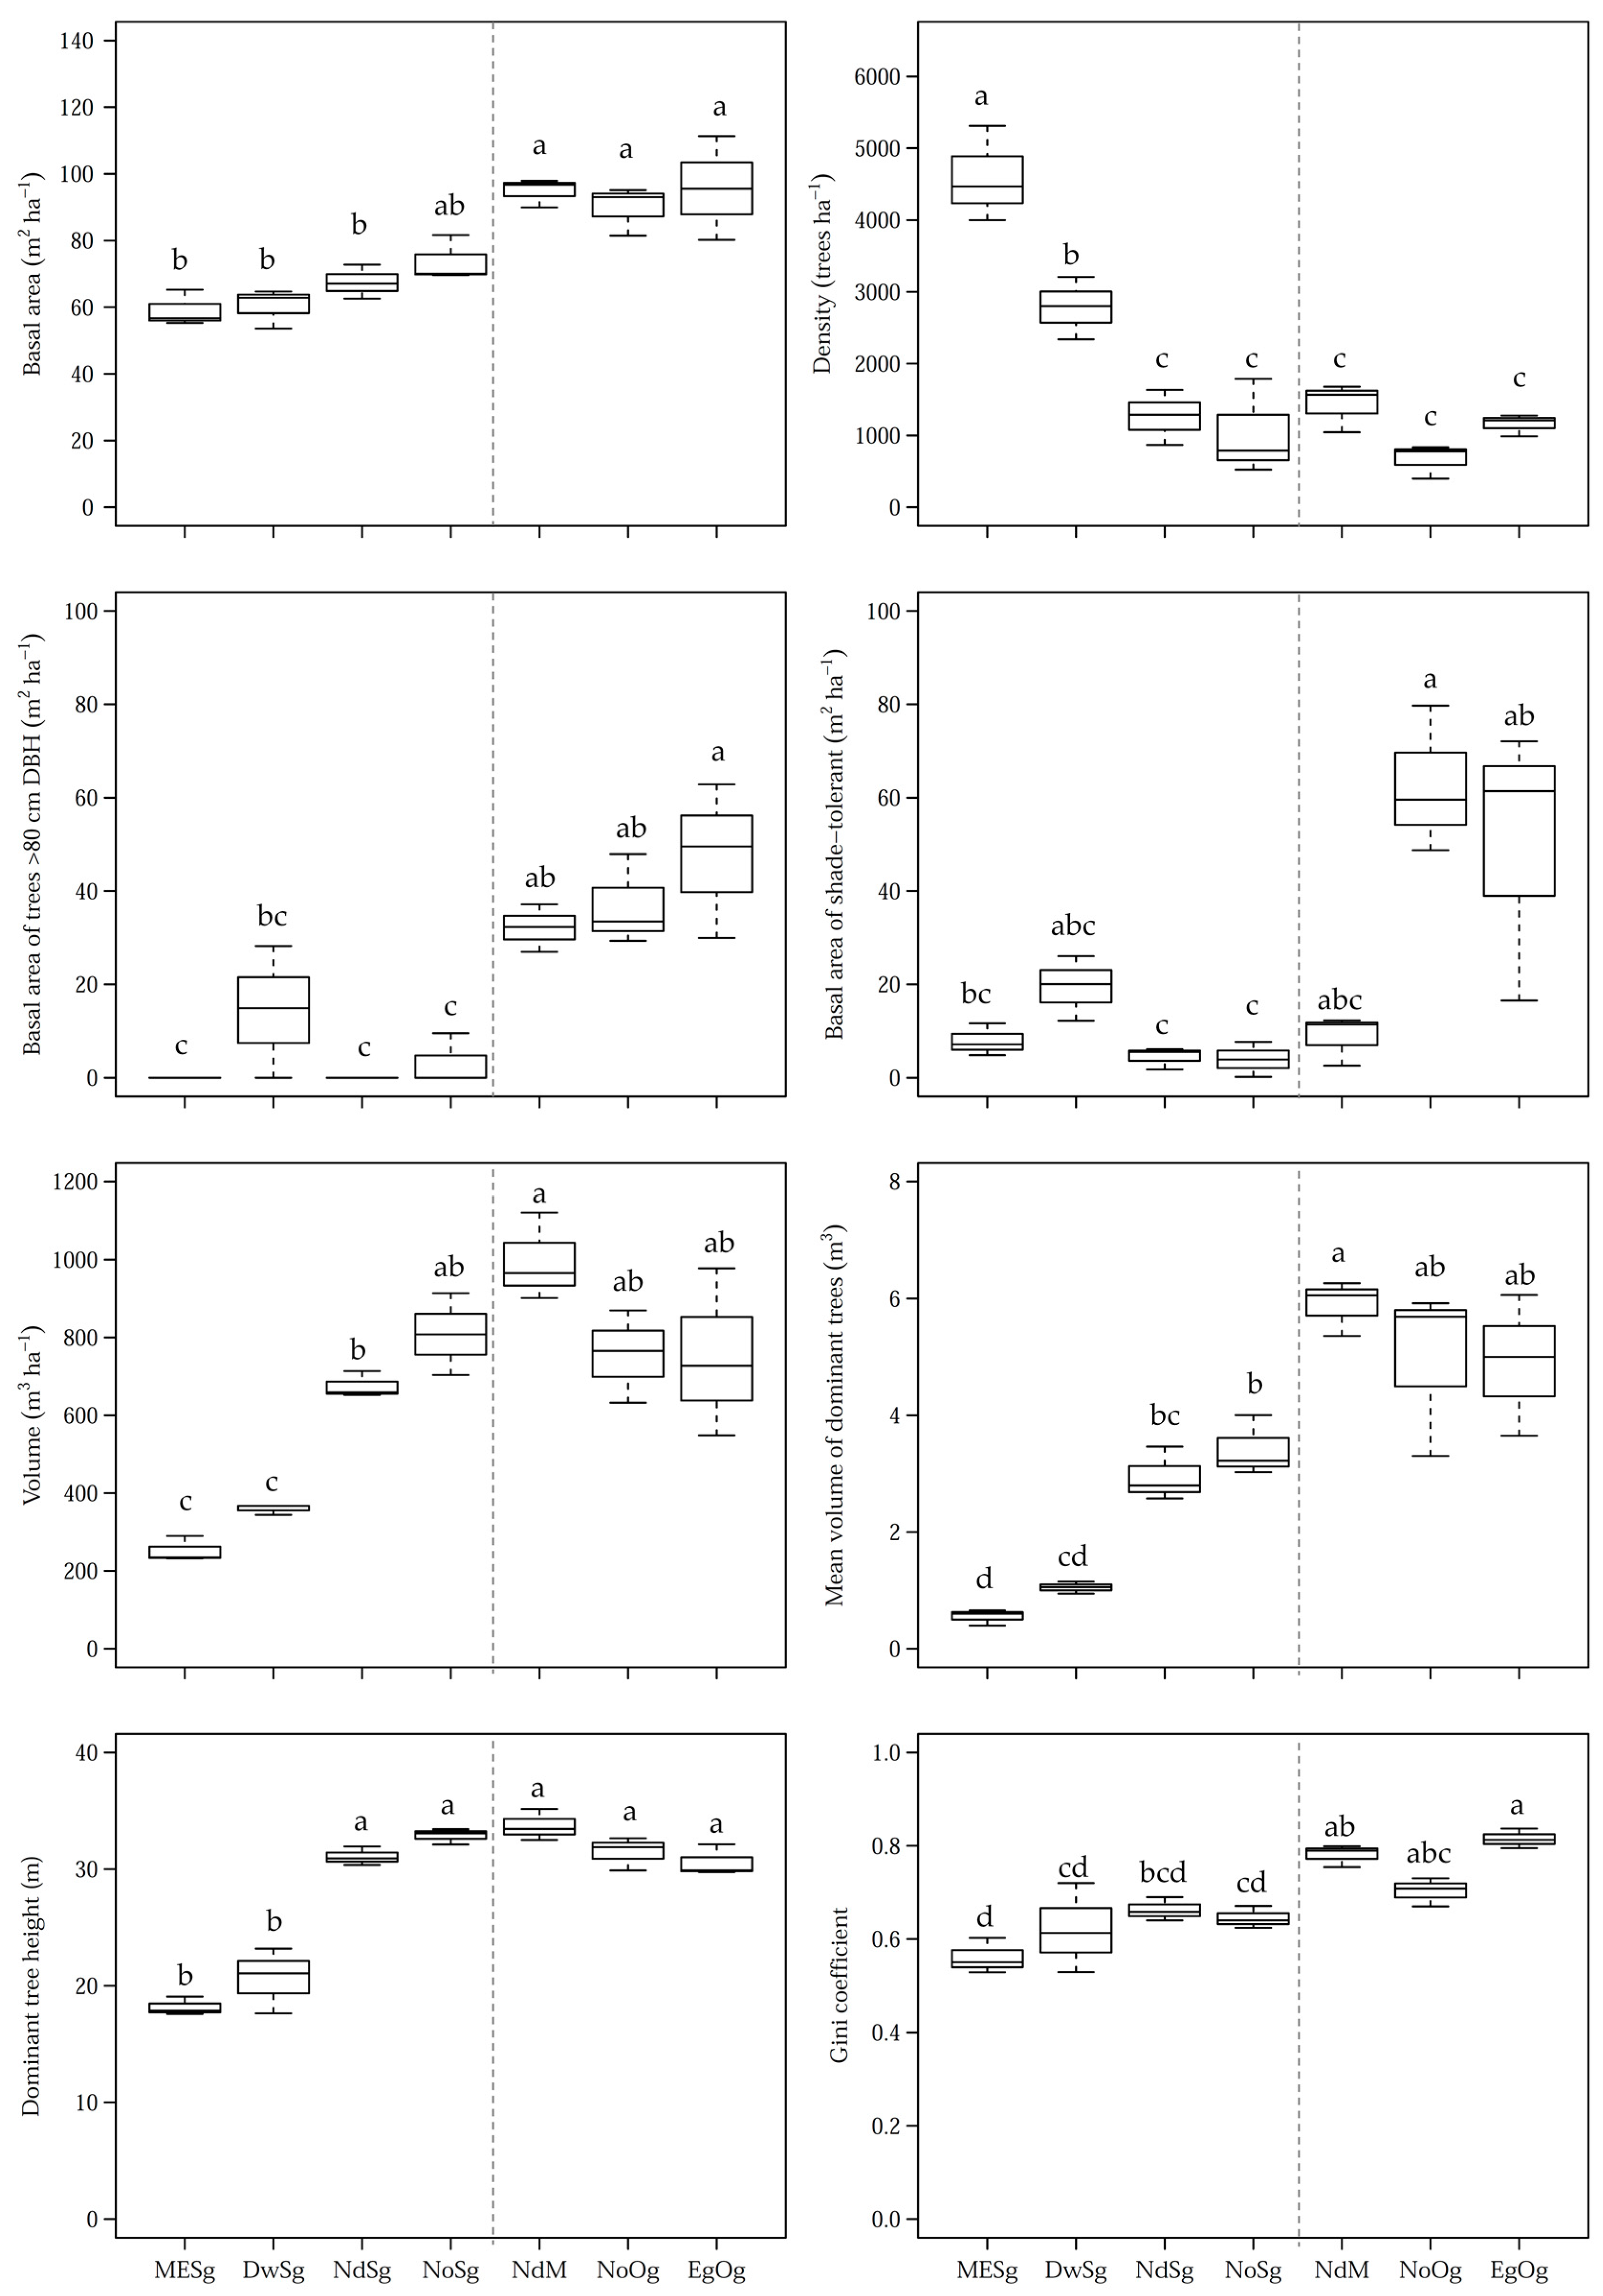
Three major patterns were observed in terms of differences among forests (Table 3). This included differences between the older and the youngest forests, between the two youngest forests (MEsg and DwSg) and the rest, and between the two Nothofagus-dominated second-growth forests (NdSg and NoSg) and the rest. Four very distinctive variables differentiated mature (NdM) and old-growth forests (NoOg and EgOg) with the four second-growth forests: basal area, basal area of trees >80 cm, mean volume of dominant trees and the Gini coefficient. All these variables had significantly larger values in older forests in more advanced successional stages. Total basal area ranged from 90 to 96 m2 ha−1 in the these forests, compared to 59–74 m2 ha−1 in the rest, while the basal area of trees >80 cm (which also have large volumes) was 32–47 m2 ha−1 in the these forests and nearly absent in the youngest forests, except for DwSg that had legacy trees (this is a 60-year-old forest that has trees of late-successional species >80 cm which belong to the previous forest since they could have not reached their sizes since the time of disturbance). A 0.7 value in the Gini coefficient differentiated older and younger forests.
There were three variables that clearly differentiated MESg and DwSg from the rest: tree density, total volume, and dominant tree height. Significantly greater tree densities where observed in these two early successional forests (close to 3000 trees per ha and more), compared to the rest, which had similar tree densities (<1500 trees per ha). The high tree densities in early successional stages are associated with trees of low stature and low basal areas and volumes.
Two variables related to shade tolerance of trees reflected a difference between the two Nothofagus second-growth forests (NoSg and NdSg), and the mature forest (NdM), from the rest. These three forests had a significantly higher basal area in shade-intolerant species and very low value in shade-tolerant species.
The other four variables in which significant differences were observed amongst forests but without a clear pattern were basal area of mid-tolerant species, richness of shade tolerant and of vascular species, and the Shannon diversity index.
Boxplots illustrate the distribution, some statistics and differences among forests for some major distinctive variables discussed above (Figure 2). Several successional patterns are illustrated in these graphs, especially the reverse relationship between basal area and tree density through successional forests (Figure 2), the high basal area and mean volume in large trees especially of shade-tolerant species, and the increasing structural heterogeneity of more advanced successional forests (Gini coefficient). In addition, an interesting pattern can be observed for total volume and the mean value of dominant trees and dominant tree height, all of which increase from the early-successional to the mature forest (NdM), where they peak, and then have a modest decline in the old-growth forests.
Finally, the diameter distribution of the seven forests showed some expected patterns in terms of the relative participation of their shape and the different groups of shade tolerance through succession (Figure 3). All forests had a negative exponential shape for all species (Appendix A). The second-growth forests had a rotated-S diameter distribution [46], which was the result of the composite diameter distribution of trees in the different shade-tolerance groups. The mature NdM and the old-growth NoOg forests had a rotated-S diameter [46], where in the NdM forest, a bump in intermediate diameter was shown by shade-intolerant species, while in the NoOg forest by shade-tolerant species. The old-growth EgOg had a reverse-J diameter distribution. In general, only the two old-growth forests were clearly dominated by shade-tolerant species, while the other forests had a mixture of shade tolerances amongst tree species.
4. Discussion and Conclusions
4.1. Causes and Patterns in the Differences between Second and Old-Growth Forests
We studied seven different types of Valdivian Temperate Rainforests that included second-growth forests ranging from 60–100 years of age to old-growth forests >250 years old in a region where forest composition tends to converge in some common late-successional species (see Section 2.1). The most striking differences occurred between the two youngest second-growth forests (EgSg and DwSg, aged approximately 60 years old) and the two old-growth forests, which differed in the majority of the variables compared (Table 3 and Figure 2), except in diversity and richness, and variables associated with dead wood (coarse woody debris and snags. Between these extremes were the two second-growth Nothofagus forests (NdSg and NoSg, approximately 100 years old) and the mature forest (NdM, age not known but estimated >100 and <200 years; see Section 2.1). They were very similar in tree density (low), basal area of shade-tolerant trees (low) and dominant tree height (the tallest, not different from that in old-growth forests), but the mature forest had significantly greater total basal area and volume in large trees, suggesting the peak in biomass depicted by Bormann and Likens [47] for forests that are in a transition to the old-growth stage but still retain a high proportion of large pioneer trees. The three older forests also differed from the second-growth forests in having a significantly higher Gini coefficient, reflecting greater structural heterogeneity (a value of 0.7 appears to be a threshold).
The four second-growth forests evaluated in this study represent two of the stages proposed by Oliver and Larson [48] in stand development. The two youngest forests (MeSg and D. DwSg) can be considered in the “stem exclusion” stage with very high tree densities that promote density-dependent mortality and reduce chances for tree regeneration and understory development (sensu [48]). The two Nothofagus-dominated secondary forests (NoSg and NdSg) can be considered in the “understory reinitiation” stage (sensu [48]), with larger trees and basal areas and lower tree densities, but still similar heterogeneity. The great differences among these two successional stages, as expressed in this study), are the result of differences in few decades since establishment, in growth rates of dominant species (Nothofagus species are among the fastest in Chile, [15,16,49,50]), and also in the type and magnitude of the disturbance that generated these forests [32], which, for example, determined the differences in species composition. In general, second-growth forests in the stem exclusion stage of stand development will have less commonalities with structural characteristics of old-growth forests than when comparing forests in the understory reinitiation stage of stand development with old-growth forests, but there may be exceptions, such as with dead wood. Compositional differences, however, are not clear at all, since these second-growth stands have the same late-successional tree species and similar richness and diversity among them and with older forests.
Among the variables that did not show significant differences among stands were coarse woody debris and basal area of snags. This was not expected (we expected more in the old-growth forests), but this type of result has been reported before. For example, [51] mentioned that on the west coast of the USA, in forests <150 years old there was a poor relationship between coarse woody debris and age. A recent study in Chile [52] determined that Andean post-fire second-growth forests <70 years old with habitat legacies (e.g., coarse woody debris and snags) can reach a structural complexity as high as undisturbed plots. The type and magnitude of the disturbance, as well as time since disturbance, are major factors in controlling the dead wood legacies in the new forest stands [51], and thus changes in coarse woody debris through succession seem to be variable, unless second-growth forests are established in abandoned lands with no tree legacies.
Overall, structural rather than compositional differences are more likely to occur among successional and old-growth these Valdivian Temperate Rainforests.
4.2. Implications for Management and Old-Growth Restoration
Landscapes that host large human populations and dynamic agricultural and forestry activities have seen great transformations. Old-growth forests in these landscapes have been converted to other land uses or have been degraded. The overall result is that the lack of these types of forests deprives local societies of the ecological, aesthetic and cultural values that may be associated with these old-growth forests [53,54,55]. This is the case of low-elevation lands in south-central Chile (<500 m a.s.l), which at present have few remnants of the old-growth forests that used to cover these lands [21,56]. The most reachable option to recover old-growth characteristics in these landscapes is through managing the dominant forest types, which are second-growth forests. Although these forests may be highly variable, depending on the factors discussed above, the priority to improve old-growth characteristics in these young forests will be to increase the proportion of large trees and standing biomass, which will be associated with more heterogeneous structures. Since all the studied second-growth forests included a mixture of pioneer and late-successional shade-tolerant species, special priority should be given to promoting the growth of these late-successional species. Overall, the focus of managing second-growth forests to increase old-growth characteristics should be in promoting structural changes. A different scenario would exist for second-growth forests established in abandoned lands that were previously used in agriculture or for cattle, in which case the land will be colonized mostly by pioneer tree species, and the promotion to regenerate late-successional species would also become a priority.
Naturally, the time frame for young forests to achieve most old-growth attributes is long, i.e., at least one century or more, but this depends on the origin of these secondary forests that determine their species composition and structural variability. However, achieving old-growth forest functions and services can be attained through promoting old-growth characteristics in young forests [9,23]. Silviculture for restoration of old-growth characteristics should be promoted for some second-growth forests in these landscapes [18,21,57,58]. It is necessary to envision which changes in these characteristics or attributes must be promoted to eventually provide ecosystem services that are associated with old-growth forests. This study suggests that among the nine most distinctive variables between successional and old growth forests, controlling a few could aid in increasing old-growth characteristics in successional forests. These include lowering tree densities (from >3000 to <1500 trees per hectare) and increasing basal area and volume in large trees, especially of shade-tolerant species, and structural heterogeneity (a Gini coefficient >0.7 represents older forests). Silviculture is a traditional science that provides systems and techniques to do this. As stated by [59], some tools that have traditionally been associated with forestry can help restoration prescriptions succeed at a functionally meaningful ecological scale, and silviculture for restoration will be easier in some forest types than in others, regardless of the silviculturist’s efforts. As seen in this study, there may diverse second-growth forests in the lowlands of south-central Chile and elsewhere. It would be convenient to promote old-growth attributes in second-growth forests with compositional and structural attributes closer to those expected in old-growth forests, but also in forests with fast-growing tree species that could attain large sizes in shorter time frames. This combination of characteristics should be sought after to prioritize forests to be managed through restoration silviculture (e.g., restoration thinnings, variable-density thinnings; e.g., [58]).
To cope with the challenge of increasing old-growth characteristics in successional forests, silviculturists or restoration ecologists will need to create forests with greater complexity, which will increase the options for adaptation of these forests to an uncertain future [60]. Knowing the differences in structure and composition between second-growth forests (e.g., due to variable types of disturbance) and old-growth forests, as well as the causes of those differences, is the first step to advance in the goal to enhance old-growth characteristics in second-growth forests through their active management [9,23,55].
Supplementary Materials
Supplementary File 1Acknowledgments
The authors are thankful for the support of the research project FONDECYT No. 1150496 of the National Commission for Science and Technology (CONICYT) for developing the study. We are also grateful to four reviewers, who made great observations to improve preliminary versions of the current paper.
Conflicts of Interest
The authors declare no conflict of interest.
Appendix A. Fitting Results of the Weibull Probability Density Function for Tree Diameters by Type of Forest
We fitted the Weibull probability density function to represent the shape of the diameter distribution of each type of forest. The model is:
where is the random variable (in our case tree diameter), and are parameters of the model.

Table A1.
Estimated parameters of the Weibull function (Equation (A1)) by type of forest.
| Type of Forest | Parameter | |
|---|---|---|
| MESg | 1.8923 | 12.6048 |
| DwSg | 1.7698 | 15.7581 |
| NdSg | 1.4174 | 22.9813 |
| NoSg | 1.3453 | 26.2232 |
| NdM | 1.1846 | 21.5971 |
| NoOg | 1.1889 | 32.5968 |
| EgOg | 1.0794 | 22.1172 |
We fit the model using the maximum likelihood method. The observed relative frequency of diameters (i.e., histogram) and the fitted Weibull model by each type of forest are shown in Figure A1.
Figure A1.
Diameter histograms and the fitted Weibull probability density function for live trees of (a) MESg; (b) DwSg; (c) NdSg; (d) NoSg; (e) NdM; (f) NoOg; and (g) EgOg.
Figure A1.
Diameter histograms and the fitted Weibull probability density function for live trees of (a) MESg; (b) DwSg; (c) NdSg; (d) NoSg; (e) NdM; (f) NoOg; and (g) EgOg.

References
- Armesto, J.J.; Smith-Ramírez, C.; Carmona, M.; Celis-Díez, J.L.; Díaz, I.; Gaxiola, A.; Gutierrez, A.; Nuñez-Avila, M.; Pérez, C.; Rozzi, R. Old-growth temperate Rainforests of South America: Conservation, Plant–Animal Interactions, and Baseline Biogeochemical Processes. In Old-Growth Forest: Function, Fate and Value; Wirth, C., Gleixner, G., Heimann, M., Eds.; Springer: Berlin/Heidelberg, Germany, 2009; pp. 367–390. ISBN 978-3-540-92706-8. [Google Scholar]
- Wirth, C.; Gleixner, G.; Heimann, M. (Eds.) Old-Growth Forests: funtion, fate and value. In Ecological Studies; Springer: Berlin/Heidelberg, Germany, 2009; Volume 207, ISBN 978-3-540-92705-1. [Google Scholar]
- Food and Agriculture Organization (FAO). State of the World´s Forests 2016; FAO: Rome, Italy, 2016; ISBN 978-92-5-109208-8. [Google Scholar]
- Chazdon, R.L. Second Growth: The Promise of Tropical Forest Regeneration in an Age of Deforestation; University of Chicago Press: Chicago, IL, USA, 2014; ISBN 9780226118079. [Google Scholar]
- Gutiérrez, A.G.; Armesto, J.J.; Aravena, J.C.; Carmona, M.; Carrasco, N.V.; Christie, D.A.; Peña, M.P.; Pérez, C.; Huth, A. Structural and environmental characterization of old-growth temperate rainforests of northern Chiloé Island, Chile: Regional and global relevance. For. Ecol. Manag. 2009, 258, 376–388. [Google Scholar] [CrossRef]
- Spies, T.A.; Franklin, J.F. The structure of natural young, mature, and old-growth Douglas-Fir forests in Oregon and Washington. In Wildlife and Vegetation of Unmanaged Douglas-Fir Forests; Ruggiero, L.F., Aubry, K.B., Carey, A.B., Huff, M.H., Eds.; U.S. Department of Agriculture, Forest Service: Portland, OR, USA, 1991; pp. 91–109. ISBN PNW-GTR-285. [Google Scholar]
- Aiba, S.I.; Hill, D.A.; Agetsuma, N. Comparison between old-growth stands and secondary stands regenerating after clear-felling in warm-temperate forests of Yakushima, southern Japan. For. Ecol. Manag. 2001, 140, 163–175. [Google Scholar] [CrossRef]
- D’Amato, A.W.; Orwig, D.A.; Foster, D.R. The influence of successional processes and disturbance on the structure of Tsuga Canadensis forests. Ecol. Appl. 2008, 18, 1182–1199. [Google Scholar] [CrossRef] [PubMed]
- Bauhus, J.; Puettmann, K.; Messier, C. Silviculture for old-growth attributes. For. Ecol. Manag. 2009, 258, 525–537. [Google Scholar] [CrossRef] [Green Version]
- Lutz, J.A.; Larson, A.J.; Swanson, M.E.; Freund, J.A. Ecological importance of large-diameter trees in a temperate mixed-conifer forest. PLoS ONE 2012, 7. [Google Scholar] [CrossRef] [PubMed]
- Schlegel, B.C.; Donoso, P.J. Effects of forest type and stand structure on coarse woody debris in old-growth rainforests in the Valdivian Andes, south-central Chile. For. Ecol. Manag. 2008, 255, 1906–1914. [Google Scholar] [CrossRef]
- Donoso, P.J.; Lusk, C.H. Differential effects of emergent Nothofagus dombeyi on growth and basal area of canopy species in an old-growth temperate rainforest. J. Veg. Sci. 2007, 18, 675. [Google Scholar] [CrossRef]
- Carmona, M.R.; Armesto, J.J.; Aravena, J.C.; Pérez, C.A. Coarse woody debris biomass in successional and primary temperate forests in Chiloé Island, Chile. For. Ecol. Manag. 2002, 164, 265–275. [Google Scholar] [CrossRef]
- Veblen, T.T.; Donoso, C.; Schlegel, F.M.; Escobar, B. Forest Dynamics in South-Central Chile. J. Biogeogr. 1981, 8, 211–247. [Google Scholar] [CrossRef]
- Donoso, C. Bosques Templados de Chile y Argentina: Variación, Estructura y Dinámica; Editorial Universitaria: Santiago, Chile, 1993; 484p. [Google Scholar]
- Donoso, P.J.; Cabezas, C.A.; Lavanderos, A.; Donoso, C. Desarrollo de renovales de coihue común (Nothofagus dombeyi (Mirb.) Oerst.) en la Cordillera de la Costa y de los Andes de la provincia de Valdivia en sus primeros 25 años. Bosque 1999, 20, 9–23. [Google Scholar] [CrossRef]
- Lusk, C.H.; Ortega, A. Vertical structure and basal area development in second-growth Nothofagus stands in Chile. J. Appl. Ecol. 2003, 40, 639–645. [Google Scholar] [CrossRef]
- Moorman, M.; Donoso, P.J.; Moore, S.E.; Sink, S.; Frederick, D. Sustainable Protected Area Management: The Case of Llancahue, a Highly Valued Periurban Forest in Chile. J. Sustain. For. 2013, 32, 783–805. [Google Scholar] [CrossRef]
- CONAF Sistema de Información Territorial. Available online: http://sit.conaf.cl/ (accessed on 22 March 2017).
- Veblen, T.T.; Alaback, P.B. A comparative review of forest dynamics and disturbance in the temperate rainforests of North and South America. In High-Latitude Rainforests and Associated Ecosystems of the West Coast of the Americas. Climate, Hydrology, Ecology, and Conservation; Lawford, R.G., Alaback, P., Fuentes, E., Eds.; Springer: New York, NY, USA, 1995; pp. 173–215. [Google Scholar]
- Donoso, P.J.; Frêne, C.; Flores, M.; Moorman, M.C.; Oyarzún, C.E.; Zavaleta, J.C. Balancing water supply and old-growth forest conservation in the lowlands of south-central Chile through adaptive co-management. Landsc. Ecol. 2014, 29, 245–260. [Google Scholar] [CrossRef]
- Tecklin, D.; Dellasala, D.A.; Luebert, F.; Pliscoff, P. Valdivian temperate rainforests of Chile and Argentina. In Temperate and Boreal Rainforests of the World: Ecology and Conservation; Dellasala, D.A., Ed.; Island Press: Washington, DC, USA, 2010; pp. 132–153. ISBN 9781610910088. [Google Scholar]
- Franklin, J.F.; Lindenmayer, D.; Thornburgh, D.; Van Pelt, R.; Chen, J.; Spies, T.A.; Carey, A.B.; Shaw, D.C.; Berg, D.R.; Harmon, M.E.; et al. Disturbances and structural development of natural forest ecosystems with silvicultural implications, using Douglas-fir forests as an example. For. Ecol. Manag. 2002, 155, 399–423. [Google Scholar] [CrossRef]
- Donoso, P.J. Crown index: A canopy balance indicator to assess growth and regeneration in uneven-aged forest stands of the Coastal Range of Chile. Forestry 2005, 78, 337–351. [Google Scholar] [CrossRef]
- Donoso, P.J.; Nyland, R.D. Seedling density according to structure, dominance and understory cover in old-growth forest stands of the evergreen forest type in the coastal range of Chile. Rev. Chil. Hist. Nat. 2005, 78, 51–63. [Google Scholar] [CrossRef]
- Salas, C.; García, O. Modelling height development of mature Nothofagus obliqua. For. Ecol. Manag. 2006, 229, 1–6. [Google Scholar] [CrossRef]
- Hajek, E.R.; di Castri, F. Bioclimatografía de Chile; Dirección de Investigación Vice-Rectoría Académica Universidad Católica de Chile: Santiago, Chile, 1975; p. 225. [Google Scholar]
- Centro de Informaciόn de Recursos Naturales (CIREN). Estudio Agrológico de la Provincia de Valdivia—X Región; CIREN: Santiago, Chile, 1999. [Google Scholar]
- Centro de Informaciόn de Recursos Naturales (CIREN). Estudio Agrológico de la IX Región; CIREN: Santiago, Chile, 2002. [Google Scholar]
- Donoso, P.J. Establishment of the Ecological Bases for the Application of Uneven-Aged Silviculture in Chilean Evergreen Forests; University of New York: New York, NY, USA, 2002. [Google Scholar]
- Soto, D.P.; Salas, C.; Donoso, P.J.; Uteau, D. Heterogeneidad estructural y espacial de un bosque mixto dominado por Nothofagus dombeyi después de un disturbio parcial. Rev. Chil. Hist. Nat. 2010, 83, 335–347. [Google Scholar] [CrossRef]
- González, M.E.; Szejner, P.; Donoso, P.J.; Salas, C. Fire, logging and establishment patterns of second-growth forests in south-central Chile: Implications for their management and restoration. Cienc. Investig. Agrar. 2015, 42, 415–425. [Google Scholar] [CrossRef]
- Thomas, J.W.; Anderson, R.G.; Maser, C.; Bull, E.L. Snags. In Wildlife Habitatsas in Managed Forests, the Blue Montains of Oregon and Washington; USDA: Washington, DC, USA, 1979; pp. 60–77. [Google Scholar]
- Van der Maarel, E. Transformation of Cover-Abundance Values in Phytosociology and Its Effects on Community Similarity. Vegetatio 1979, 39, 97–114. [Google Scholar]
- Pabst, R.J. Methodology for developing the old-growth index. In Definition and Inventory of Old-Growth Forests on DNR-Managed State Lands; Franklin, J.F., Spies, T.A., Van Pelt, R., Eds.; Washington State Department of Natural Resources: Washington, DC, USA, 2005; p. 74. [Google Scholar]
- Mosseler, A.; Lynds, J.A.; Major, J.E. Old-growth forests of the Acadian Forest Region. Environ. Rev. 2003, 11, S47–S77. [Google Scholar] [CrossRef]
- Lexerød, N.L.; Eid, T. An evaluation of different diameter diversity indices based on criteria related to forest management planning. For. Ecol. Manag. 2006, 222, 17–28. [Google Scholar] [CrossRef]
- Steen, O.A.; Dawson, R.J.; Armleder, H.M. An old-growth index for Douglas-fir stands in portions of the Interior Douglas-fir zone, central British Columbia. BC J. Ecosyst. Manag. 2008, 9, 31–47. [Google Scholar]
- D’Amato, A.W.; Orwig, D.A.; Foster, D.R. Understory vegetation in old-growth and second-growth Tsuga canadensis forests in western Massachusetts. For. Ecol. Manag. 2009, 257, 1043–1052. [Google Scholar] [CrossRef] [Green Version]
- Salas, C.; Real, P. Biometría de los bosques naturales de Chile: estado del arte. In Silvicultura en los Bosques Nativos: Avances en la Investigación en Chile, Argentina y Nueva Zelanda; Donoso, P.J., Promis, A., Eds.; Editorial María Cuneo: Valdivia, Chile, 2013; pp. 109–151. [Google Scholar]
- Salas, C. Ajuste y validación de ecuaciones de volumen para un relicto del bosque de Roble-Laurel-Lingue. Bosque 2002, 23, 81–92. [Google Scholar]
- Husch, B.; Beers, T.W.; Kershaw, J.A. Forest Mensuration, 5th ed.; Wiley: Hoboken, NJ, USA, 2002; ISBN 978-0-471-01850-6. [Google Scholar]
- Garcia, O.; Batho, A. Top height estimation in lodgepole pine sample plots. West. J. Appl. For. 2005, 20, 64–68. [Google Scholar]
- Stefańska-Krzaczek, E. Species diversity across the successional gradient of managed Scots pine stands in oligotrophic sites (SW Poland). J. For. Sci. 2012, 58, 345–356. [Google Scholar]
- R Core Team. R: A Language and Environment for Statistical Computing 2016; R Foundation for Statistical Computing: Vienna, Austria, 2016. [Google Scholar]
- Goff, F.G.; West, D. Canopy-understory interaction effects on forest population structure. For. Sci. 1975, 21, 98–108. [Google Scholar]
- Bormann, F.H.; Likens, G.E. Pattern and Process in a Forested Ecosystem; Springer: New York, NY, USA, 1979; ISBN 978-0-387-94344-2. [Google Scholar]
- Oliver, C.; Larson, B. Forest Stand Dynamics, 1st ed.; Wiley: New York, NY, USA, 1996; ISBN 978-0471138334. [Google Scholar]
- Navarro, C.; Donoso, C.; Sandoval, V.; Gonzalez, C. Evaluación de raleos en un renoval de canelo (Drimys winteri (Forst.)) en la Cordillera de la Costa de Valdivia, Chile. Bosque 1997, 18, 51–65. [Google Scholar] [CrossRef]
- Donoso, P.J.; Soto, D.P.; Schlatter, J.E.; Büchner, C.A. Effects of early fertilization on the performance of Nothofagus dombeyi planted in the Coastal Range of south-central Chile. Cienc. Investig. Agrar. 2009, 36, 475–486. [Google Scholar] [CrossRef]
- Spies, T.A.; Franklin, J.F. Old growth and forest dynamics in the douglas-fir region of western oregon and washington usa. Nat. Areas J. 1988, 8, 190–201. [Google Scholar]
- Caviedes, J.; Ibarra, J.T. Influence of Anthropogenic Disturbances on Stand Structural Complexity in Andean Temperate Forests: Implications for Managing Key Habitat for Biodiversity. PLoS ONE 2017, 12, 1–18. [Google Scholar] [CrossRef] [PubMed]
- Franklin, J.F.; Van Pelt, R. Spatial aspects of structural complexity in Old-Growth Forests. J. For. 2004, 102, 22–28. [Google Scholar]
- Spies, T. Forest stand structure, composition, and function. In Creating a Forestry for the 21st Century: The Science of Ecosystem Management; Kohm, K., Franklin, J.F., Eds.; Island Press: New York, NY, USA, 1997; pp. 11–30. [Google Scholar]
- Lindenmayer, D.B.; Franklin, J.F. Towards Forest Sustainability; CSIRO Publishing: Clayton, Australia, 2003; ISBN 9780643100053. [Google Scholar]
- Veblen, T.T.; Ashton, D.H.; Schlegel, F.M.; Veblen, T.T.; Ashton, D.H.; Schlegel, M. Tree regeneration strategies in a lowland Nothofagus- dominated forest in south-central Chile. J. Biogeogr. 1979, 6, 329–340. [Google Scholar] [CrossRef]
- Keeton, W.S. Managing for late-successional/old-growth characteristics in northern hardwood-conifer forests. For. Ecol. Manag. 2006, 235, 129–142. [Google Scholar] [CrossRef]
- Harrington, C.A.; Roberts, S.D.; Brodie, L.C. Tree and Understory Responses to Variable- Density Thinning in Western Washington. In Balancing Ecosystem Values: Innovative Experiments for Sustainable Forestry; Peterson, C.E., Maguire, D.A., Eds.; USDA Forest Service General Technical Report PNWGTR; USDA Forest Service: Portland, OR, USA, 2010; pp. 97–106. [Google Scholar]
- Guldin, J.M. The silviculture of restoration: a historical perspective with contemporary application. In Integrated Restoration of Forested Ecosystems to Achieve Multiresource Benefits, Proceedings of the 2007 National Silviculture Workshop, Portland, OR, USA, 7–10 May 2007; DeaL, R.L., Ed.; Gen. Tech. Rep. PNW-GTR-733; U.S. Department of Agriculture, Forest Service, Pacific Northwest Research Station: Portland, OR, USA, 2008; pp. 23–35. [Google Scholar]
- Puettmann, K.J.; Coates, K.D.; Messier, C. A Critique of Silviculture: Managing for Complexity, 1st ed.; Island Press: Washington, DC, USA, 2008; ISBN 1597261467. [Google Scholar]
Figure 1.
Study site locations (Rucamanque and Llancahue) in the lowlands of south-central Chile and within the northern portion of the Valdivian Rainforests.
Figure 1.
Study site locations (Rucamanque and Llancahue) in the lowlands of south-central Chile and within the northern portion of the Valdivian Rainforests.

Figure 2.
Distribution of the most characteristic differential variables among the sampled forests. Different letters within each row represent significant differences (p-value < 0.05). The middle bar corresponds to the median. Dashed lines separate successional forests from mature and old-growth forests.

Figure 3.
Diameter distribution for each forest studied. See text for meaning of acronyms. Notice that the Y axis of the MESg and DwSg graphs differs from the rest.
Figure 3.
Diameter distribution for each forest studied. See text for meaning of acronyms. Notice that the Y axis of the MESg and DwSg graphs differs from the rest.
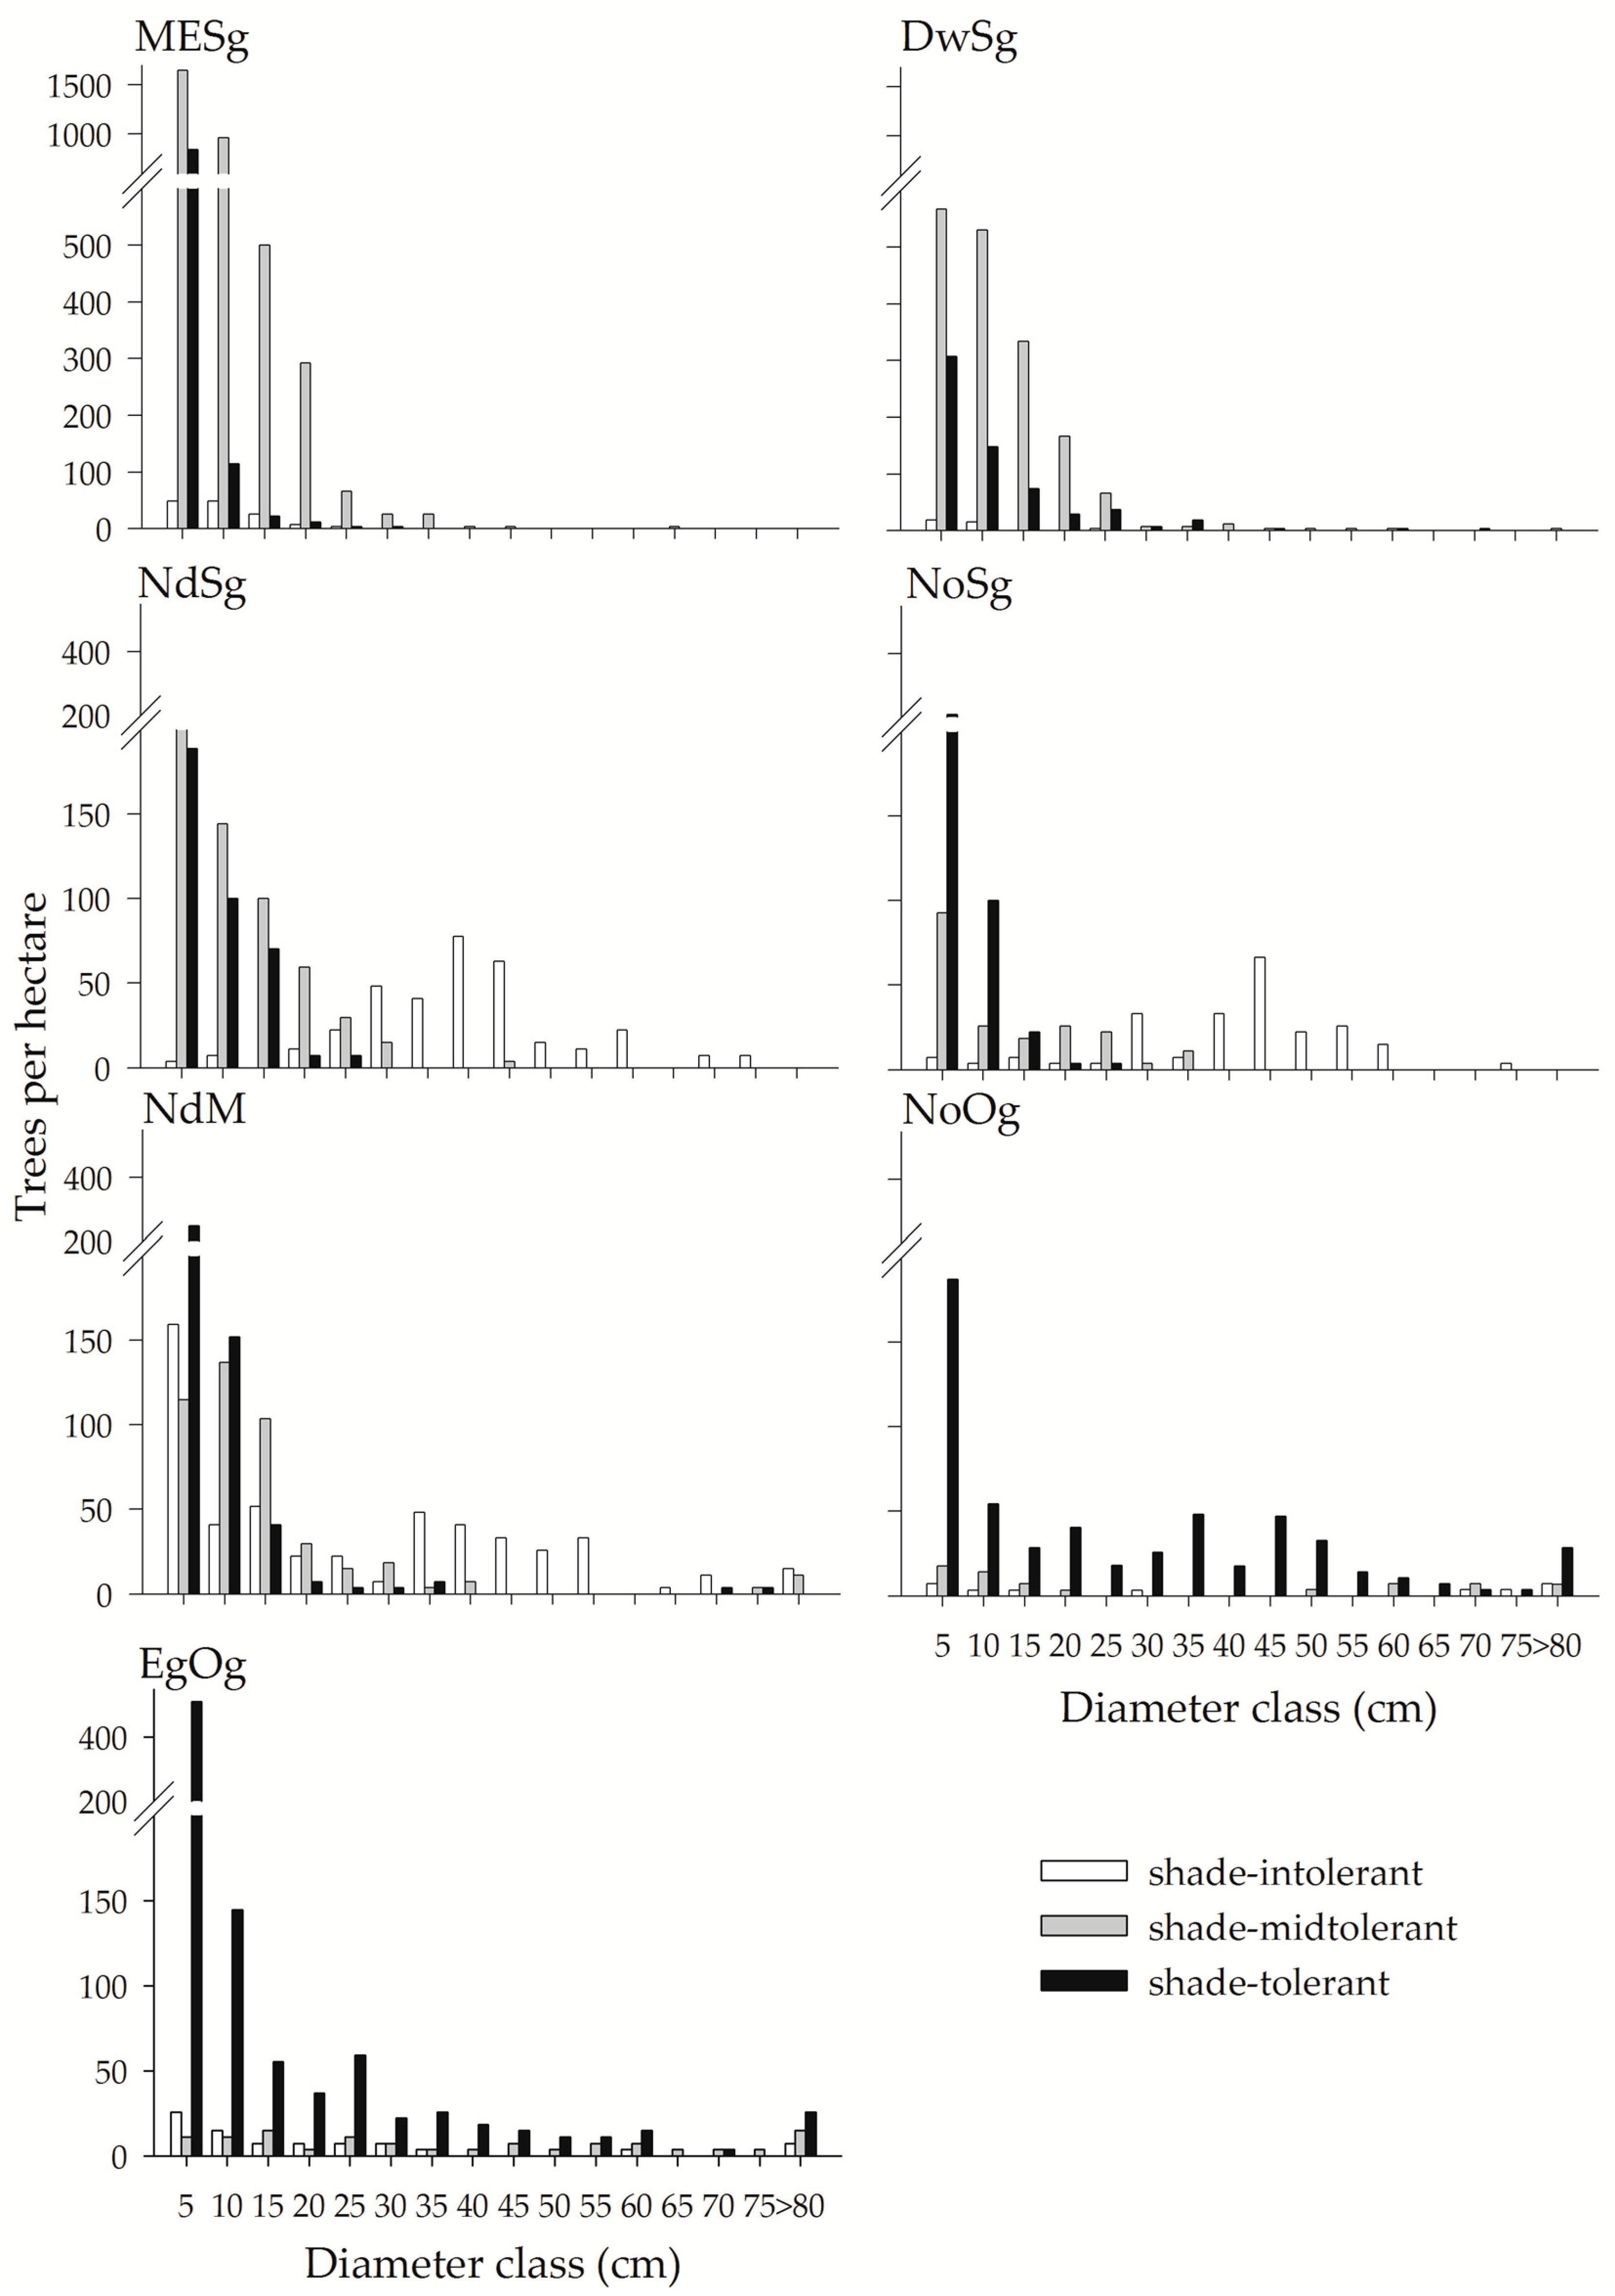
Table 1.
General description of Llancahue and Rucamanque and of the seven forests studied in them.
| Site | Area (ha) | Location | Forest Type | Code | Main Canopy Tree Species * | Total Area Per Site (ha) |
|---|---|---|---|---|---|---|
| Llancahue | 1270 | 39°84′ S 73°14′ W | Mixed evergreen second-growth | MESg | Ec, Lp, Dw | 287.4 |
| Drimys winteri second-growth | DwSg | Dw, Lp, Ec | 4.5 | |||
| Nothofagus dombeyi second-growth | NdSg | Nd, Ec, Dw | 110.4 | |||
| Nothofagus dombeyi mature | NdM | Nd, Ec, Dw | 162.7 | |||
| Evergreen old-growth | EgOg | Ec, Lp, Ap | 564.9 | |||
| Rucamanque | 435 | 38°66′ S 72°59′ W | Nothofagus obliqua second-growth | NoSg | No, Lp, Ap | 70.4 |
| Nothofagus obliqua old-growth | NoOg | No, Lp, Ap | 229.6 |
* Ec: Eucryphia cordifolia; Lp: Laureliopsis philippiana; Dw: Drimys winteri; Nd: Nothofagus dombeyi; Ap: Aextoxicon punctatum; No: Nothofagus obliqua.
Table 2.
Compositional and structural variables selected for comparisons between second- and old-growth forests of south-central Chile.
Table 2.
Compositional and structural variables selected for comparisons between second- and old-growth forests of south-central Chile.
| Variables | |
|---|---|
| Density (trees ha−1) | Coarse woody debris (CWD; Mg ha−1) |
| Basal area (m2 ha−1) | Density of snags (n ha−1) |
| Basal area of trees >80 cm d (m2 ha−1) | Basal area of snags (m2 ha−1) |
| Basal area of shade-intolerant species (m2 ha−1) | Total richness of tree species |
| Basal area of shade mid-tolerant (m2 ha−1) | Richness of shade-intolerant tree species |
| Basal area of shade-tolerant species (m2 ha−1) | Richness of shade mid-tolerant tree species |
| Volume (m3 ha−1) | Richness of shade-tolerant tree species |
| Mean volume of dominant trees (m3) | Richness of vascular species in the understory |
| Dominant tree height (m) | Shannon diversity index |
| Gini coefficient | |
Table 3.
Comparison of variables tested in second- and old-growth forests (average ± sd). Different letters within each row represent significant differences (p-value < 0.05). Density, basal area of trees >80 cm d and the Shannon diversity index were compared with ANOVA.
Table 3.
Comparison of variables tested in second- and old-growth forests (average ± sd). Different letters within each row represent significant differences (p-value < 0.05). Density, basal area of trees >80 cm d and the Shannon diversity index were compared with ANOVA.
| Variable | Type of Forest | ||||||
|---|---|---|---|---|---|---|---|
| MESg | DwSg | NdSg | NoSg | NdM | NoOg | EgOg | |
| Density (trees ha−1) | 4593 ± 543 a | 2783 ± 355 b | 1263 ± 314 c | 1033 ± 545 c | 1430 ± 276 c | 670 ± 193 c | 1159 ± 124 c |
| Basal area (m2 ha−1) | 59.1 ± 4.4 b | 60.4 ± 4.9 b | 67.5 ± 4.2 b | 73.8 ± 5.6 ab | 94.9 ± 3.5 a | 89.9 ± 6 a | 95.7 ± 12.7 a |
| Basal area of trees >80 cm d (m2 ha−1) | 0 ± 0 c | 14.4 ± 11.5 bc | 0 ± 0 c | 3.2 ± 4.5 c | 32.1 ± 4.2 ab | 36.9 ± 8 ab | 47.4 ± 13.5 a |
| Basal area of shade-intolerant species (m2 ha−1) | 2.4 ± 0.8 b | 0.8 ± 1 b | 52.3 ± 4.5 a | 63.2 ± 8.7 a | 58.6 ± 17.2 a | 11.7 ± 13 b | 6.7 ± 9.5 b |
| Basal area of mid-tolerant species (m2 ha−1) | 48.8 ± 3.1 a | 40.1 ± 11.2 ab | 10.7 ± 2.9 bc | 6.7 ± 2.5 c | 27.5 ± 9.9 abc | 15.5 ± 12.5 abc | 39 ± 25.3 abc |
| Basal area of shade-tolerant species (m2 ha−1) | 7.9 ± 2.8 bc | 19.4 ± 5.7 abc | 4.5 ± 1.9 c | 3.9 ± 3.1 c | 8.8 ± 4.4 abc | 62.7 ± 12.8 a | 50 ± 24.1 ab |
| Volume (m3 ha−1) | 252.2 ± 26.8 c | 359.6 ± 10.9 c | 675.1 ± 27.7 b | 808.8 ± 85.8 ab | 996.2 ± 92.2 a | 756 ± 97.3 ab | 751.3 ± 176.2 ab |
| Mean volume of dominant trees (m3) | 0.6 ± 0.1 d | 1 ± 0.1 cd | 2.9 ± 0.4 bc | 3.4 ± 0.4 b | 5.9 ± 0.4 a | 5 ± 1.2 ab | 4.9 ± 1 ab |
| Dominant tree height (m) | 18.2 ± 0.6 b | 20.6 ± 2.3 b | 31.1 ± 0.7 a | 32.9 ± 0.6 a | 33.7 ± 1.1 a | 31.5 ± 1.2 a | 30.6 ± 1.1 a |
| Gini coefficient | 0.56 ± 0.03 d | 0.62 ± 0.08 cd | 0.66 ± 0.02 bcd | 0.65 ± 0.02 cd | 0.78 ± 0.02 ab | 0.7 ± 0.02 abc | 0.81 ± 0.02 a |
| Coarse woody debris (Mg ha−1) | 23 ± 21.8 | 57.2 ± 21.5 | 11 ± 5.4 | 12.3 ± 2.2 | 23.6 ± 9.4 | 32 ± 3.8 | 54.4 ± 15 |
| Density of snags (trees ha−1) | 0 ± 0 | 12 ± 13 | 8 ± 13 | 7 ± 9 | 26 ± 23 | 3 ± 6 | 9 ± 8 |
| Basal area of snags (m2 ha−1) | 0 ± 0 | 6.3 ± 7.1 | 1 ± 0.7 | 4.6 ± 2.4 | 3.2 ± 2.3 | 8.8 ± 5.1 | 13.8 ± 11.4 |
| Total richness of tree species | 16 ± 1 | 10 ± 0 | 11 ± 1 | 9 ± 2 | 9 ± 0 | 8 ± 2 | 9 ± 3 |
| Richness of shade-intolerant tree species | 2 ± 0 | 1 ± 0 | 1 ± 0 | 2 ± 0 | 2 ± 0 | 1 ± 1 | 1 ± 1 |
| Richness of mid-tolerant tree species | 9 ± 0 | 5 ± 0 | 5 ± 0 | 4 ± 1 | 5 ± 0 | 4 ± 1 | 5 ± 2 |
| Richness of shade-tolerant tree species | 6 ± 1 a | 4 ± 0 abc | 4 ± 0 ab | 3 ± 0 bc | 3 ± 0 c | 3 ± 0 c | 4 ± 0 abc |
| Richness of vascular species in the understory | 18 ± 3 abc | 24 ± 5 a | 21 ± 2 ab | 10 ± 1 c | 22 ± 6 a | 11 ± 1 bc | 20 ± 2 abc |
| Shannon diversity index | 1.08 ± 0.65 b | 2.09 ± 0.48 ab | 1.77 ± 0.19 ab | 1.58 ± 0.16 ab | 2.73 ± 0.39 a | 1.73 ± 0.14 ab | 2.49 ± 0.14 a |
© 2017 by the authors. Licensee MDPI, Basel, Switzerland. This article is an open access article distributed under the terms and conditions of the Creative Commons Attribution (CC BY) license (http://creativecommons.org/licenses/by/4.0/).
Share and Cite
MDPI and ACS Style
Ponce, D.B.; Donoso, P.J.; Salas-Eljatib, C. Differentiating Structural and Compositional Attributes across Successional Stages in Chilean Temperate Rainforests. Forests 2017, 8, 329. https://doi.org/10.3390/f8090329
AMA Style
Ponce DB, Donoso PJ, Salas-Eljatib C. Differentiating Structural and Compositional Attributes across Successional Stages in Chilean Temperate Rainforests. Forests. 2017; 8(9):329. https://doi.org/10.3390/f8090329
Chicago/Turabian StylePonce, Diego B., Pablo J. Donoso, and Christian Salas-Eljatib. 2017. "Differentiating Structural and Compositional Attributes across Successional Stages in Chilean Temperate Rainforests" Forests 8, no. 9: 329. https://doi.org/10.3390/f8090329
Note that from the first issue of 2016, this journal uses article numbers instead of page numbers. See further details here.