Article

Ten Years of Monitoring Illustrates a Cascade of Effects of White Pine Blister Rust and Focuses Whitebark Pine Restoration in the Canadian Rocky and Columbia Mountains

1
Conservation Biologist, Parks Canada Agency, Jasper National Park, Jasper, AB T0E 1E0, Canada
2
Resource Manager, Alberta Environment and Parks, Calgary, AB T3L 1S4, Canada
3
Vegetation and Restoration Specialist, Parks Canada Agency, Waterton Lakes National Park, Waterton Park, AB T0K 2M0, Canada
4
Fire and Vegetation Specialist, Parks Canada Agency, Kootenay, Yoho and Lake Louise Field Unit, Radium, BC V0A 1M0, Canada
5
Fire and Vegetation Specialist, Parks Canada Agency, Banff Field Unit, Banff, AB T1L1K2, Canada
6
Scientist Emeritus, Parks Canada Agency, Waterton Lakes National Park, Waterton Park, AB T0K 2M0, Canada
7
A/Ecologist Team Lead, Parks Canada Agency, Mount Revelstoke and Glacier National Park, Revelstoke, BC V0E 2S0, Canada
*
Author to whom correspondence should be addressed.
Forests 2018, 9(3), 138; https://doi.org/10.3390/f9030138
Submission received: 30 January 2018 / Revised: 7 March 2018 / Accepted: 9 March 2018 / Published: 14 March 2018
(This article belongs to the Special Issue Ecology and Restoration of Whitebark Pine)

Abstract

:
Whitebark pine forests are declining due to infection by white pine blister rust and mountain pine beetle, combined with the effects of climate change and fire suppression. The Canadian Rocky and Columbia Mountains represent a large portion of the whitebark range; a vast area, exemplifying the need for knowledge about whitebark pine stands to target restoration. The aim of our work was to identify variables predicting live tree infection, seedling infection, canopy kill, mortality, and regeneration across this region, and present the results in spatially-explicit formats to assist land managers with restoration. Live tree and seedling infection by white pine blister rust increased over the last decade and cascading effects of the disease are intensifying, including canopy kill and mortality. We show that large diameter trees are more likely to be infected, and the highest infection rates are in southern and western areas. The conditions for seedling infection are more strongly influenced by fine-scale climatic conditions than for trees. Areas with low regeneration are: (1) the dry east slopes where live tree infection is low; and (2) where live tree infection rates are high, suggesting that canopy kill and mortality are influencing regeneration. Results highlight where to target restoration and coordinate across boundaries.

1. Introduction

Current white pine blister rust (Cronartium ribicola J.C. Fisch) infection and mountain pine beetle (Dendroctonus ponderosae Hopk.) impacts, combined with the effects of climate change and fire suppression, have placed whitebark pine (Pinus albicaulis Engelm.) in an endangered status in Canada, and as a candidate species for listing under the United States Endangered Species Act [1,2]. Whitebark pine is considered a keystone species in high-elevation forests in western Canada and the USA [3]. The seeds are an important food source for many animals [4] and whitebark pine delivers numerous ecosystem services including stabilizing the snowpack and runoff, and influencing treeline vegetation patterns [5,6,7]. Canada is home to 56% of the global range for the species. While recovery planning is underway, restoration actions are in the early stages [8]. Additional research on the effectiveness of early restoration efforts and strategies across the species’ range will accelerate science-based management and recovery of the species. The range-wide restoration strategy for whitebark pine [9], recovery strategy for whitebark pine in Canada [8] and recovery plan for Alberta [10] highlight principles and possible actions to guide restoration. These include thinning competing tree species, collecting putatively blister rust-resistant seeds, screening seed stock for natural resistance, planting rust-resistant seedlings, and using prescribed fire to emulate the natural disturbance regimes that benefit whitebark pine regeneration [9].
To support restoration action, spatially-explicit results and maps depicting whitebark pine stand conditions are required to identify restoration potential and set priorities for action at the scale of the Canadian Rocky and Columbia Mountains [9]. We present monitoring data from whitebark pine stands surveyed across the Canadian Rocky and Columbia Mountains over three visits between 2003 and 2014. The study builds on previous work completed by Smith et al. [11,12], who reported on the incidence of disease and mortality for these plots from 2003 to 2009. We examine how spatial, temporal, and climate variables influence patterns of white pine blister rust infection and mortality for trees (>1.3 m in height) and seedlings, with the goal of informing restoration planning for this region. Specifically, we sought to: (1) identify variables predicting live tree infection, seedling infection, canopy kill (i.e., severity of infection), mortality, and regeneration across this large region; and (2) present the results in spatially-explicit formats to assist land managers when setting priorities, targeting actions for areas to increase the likelihood of success, and coordinating restoration actions across boundaries.
We focused on blister rust because it is the most widespread threat across the whitebark pine range in Canada [13,14]. Mountain pine beetle-infested trees and beetle-killed trees were included in the scope of our study. Although mountain pine beetle was only patchily encountered in our study area, and has been declining in most of the study area, it has been expanding into more northern, high elevation forests [15]. Mountain pine beetle has documented interactions with blister rust, preferentially attacking rust infected trees [16,17]. Canopy kill indicates both the severity of the blister rust infection and represents a loss in seed production when cone-bearing branches are killed by blister rust. We expect natural regeneration to decline as a result of canopy kill, and blister rust and beetle-caused mortality [18]. We examined natural regeneration to better understand the relationships between regeneration and blister rust infection in the region, and to identify areas that may benefit from restoration treatment by thinning or prescribed fire, and/or seedling planting. The study is an important opportunity to examine stand conditions across an area with widely varying climatic and topographic conditions over a ten-year period, in order to understand how whitebark pine responds to mountain pine beetle and blister rust. For example, live tree infection, mortality, canopy kill, and regeneration may vary across different stages of an epidemic and may depend on other measurable variables (e.g., climatic conditions) [11]. Understanding the trajectory of a disease over time and across a large region is key for restoration action.

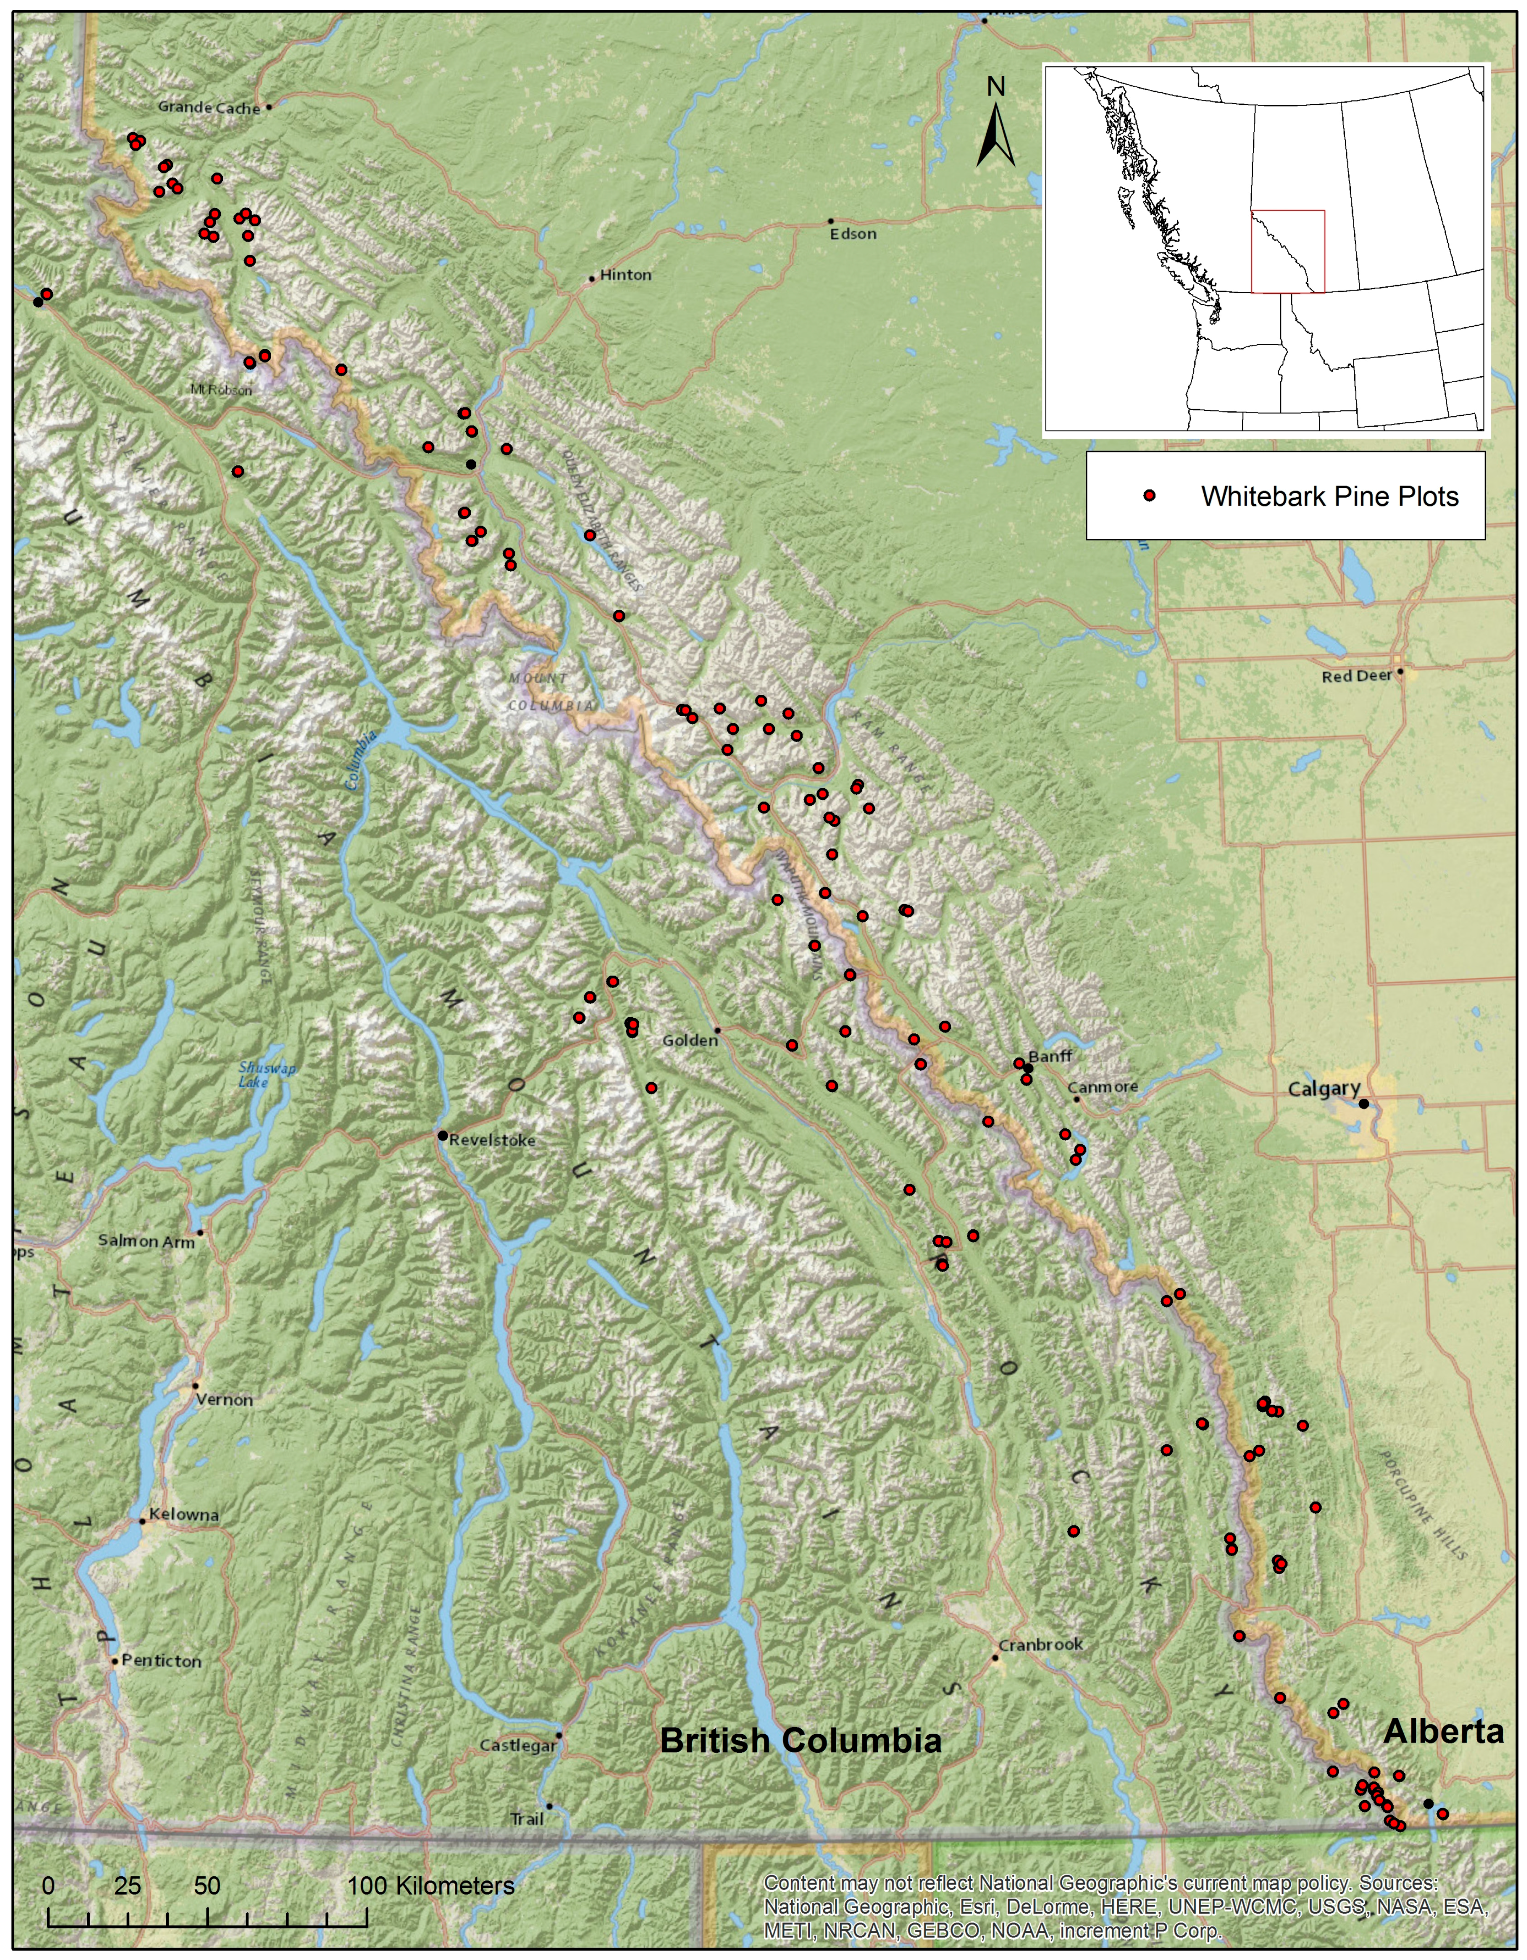
2. Study Area and Methods

The total study area is approximately 92,000 km2 and spans over four degrees of latitude from the United States—Canada border in the south to the Willmore Wilderness Park in the north (Figure 1). The study area encompasses national parks, numerous provincial parks, and a mix of private and public provincial lands along the continental divide in Alberta and British Columbia in the Canadian Rocky and Columbia Mountains. The landscape is highly variable with whitebark pine stands ranging in elevation from 1300 m to 2370 m. The lower-elevation eastern slopes are dominated by stream networks, generally more open canopies with lower precipitation in summer and winter. High elevation mountain areas include rock, glaciers, complex steep topography with varying aspects, slopes, and moisture regimes, particularly between areas east and west of the continental divide. Forest types at the study sites are primarily dominated by whitebark pine and include subalpine fir (Abies lasiocarpa (Hooker) Nuttall), Engelmann spruce (Picea engelmannii Engelmann), and lodgepole pine (Pinus contorta Douglas ex Loudon), with limber pine (Pinus flexilis E. James) co-occurring with whitebark pine in the Waterton Lakes National Park area.
Methods for establishing plots and assessing whitebark pine health were those recommended by Tomback et al. [19] and used in Smith et al. [11,12]. A 10 m wide belt transect was extended to a variable distance that attempted to sample a minimum of 50 whitebark pine trees >1.3 m, with a minimum of 10 trees that were living or recently dead. In 2009, most plots were shortened to 50 m to align with refinements to Tomback et al. [19]. Field crews were trained to recognize blister rust symptoms in whitebark pine, worked in teams of two to three people, and surveys occurred between the time of snow melt and mid-August, before aecia fade. Within each plot, all whitebark pine trees (>1.3 m in height) were marked with numbered aluminum tags. Plots were surveyed over repeat visits between 2003 and 2014, forming three distinct sampling periods for future analysis—2003–2007; 2008–2012; and 2014. During each visit, we recorded diameter at breast height for all trees to the nearest 0.1 cm. Living trees were visually assessed using binoculars for presence-absence of active or inactive branch and stem cankers caused by white pine blister rust (WPBR) and for mountain pine beetle infestation (beetle entry holes with pitch plugs or J-shaped galleries). Active cankers were identified by diagnostic orange-yellow aecial blisters containing aeciospores, or empty white spore sacs later in the season. Inactive WPBR cankers were identified by their spindle shape, broken bark and, because rodents feed on active blister rust cankers, the presence of gnawing or bark stripping [20]. Surveyors recorded the presence of the following symptoms of infection for each tree: roughened bark, branch flagging, topkill, swelling, oozing sap, and rodent chewing. Trees with uncertain stem or branch cankers were not included in the analysis for infection. The cause of death for all dead whitebark pine was recorded where it could be determined. The percentage of the total canopy killed (dead branches) was estimated (as a proportion of the entire canopy volume) to the nearest 10% for each tree and also summarized as an average per plot. All dead branches were considered, whether caused by blister rust, bark stripping, or mechanical damage, which are difficult to distinguish. We used canopy kill as a proxy for the severity of the infection. All live whitebark pine ≤1.3 m in the plot were considered seedlings and were placed in two size-classes (short, ≤50 cm; and tall, >50 cm), and assessed for the presence or absence of active or inactive cankers.
Spatial and temporal patterns in whitebark pine stand and tree health were analyzed using the following response variables: (1) presence and absence of white pine blister rust in live trees and seedlings; (2) tree mortality (tree status: live/dead); (3) average percent canopy kill in a plot; and (4) regeneration (count of seedlings in a plot). We selected predictor variables based on findings from previous research [11,14,21,22,23,24] and hypotheses based on our own observations in our ecosystem (Table 1). We obtained mean (1981–2010) annual and seasonal climate data for each plot location using ClimateWNA (an extension of ClimateBC) [25]. Using a geographic information system (GIS; ArcGIS 10, ESRI, Redlands, CA, USA), we calculated landscape predictor variables that we could not measure in the field. Surveyors measured diameter at breast height (cm) for all trees, except those with a krummholz form. Aspect was transformed from a circular measure to a continuous variable better suited for modelling. Cooler and wetter north–northeast orientations were assigned values close to zero, whereas hotter and dryer south–southwest orientations were closer to 1.0. Distance of the study stand to the continental divide was measured using Euclidian distance and recorded as increasingly negative and increasingly positive west and east of the divide, respectively.
All statistical analyses were performed with the software R (Version 3.1.1; [27]). We applied data exploration following Zuur et al. [28] to the final data to assess homogeneity, potential outliers, and zero-inflation, and all predictor variables were standardized prior to analysis. Spatial interdependency was assumed based on the study design given the clustering of trees within plots and repeated measures of plots over time. We used Variance Inflation Factor (VIF) analysis and Spearman’s rank correlations to test for collinearity. If VIF was higher than 3 and pair-wise correlation was p > 0.5 (or p < −0.5), we eliminated the variable considered less relevant biologically.
We used a mixed effects logistic regression (package: lme4) to model the relationships between explanatory variables and the following response variables: probability of WPBR in (1) live trees (n = 16,716) and (2) seedlings (n = 11,709), and (3) the probability of mortality (n = 22,052), all measured at the tree level. Because the response variable for canopy kill was a proportion, we used a beta regression mixed model (package: glmmADMB) to model the average proportion of tree canopy kill per plot (n = 463). We used a negative binomial mixed model (package glmmTMB) to model whitebark regeneration because counts of seedlings per plot were over-dispersed (n = 463); we included an offset to adjust for unequal plot sizes. When visual inspection suggested a non-linear relationship between the response and predictor variables, the quadratic term was included in model selection. We applied a stepwise backward regression method to select the best models using the Akaike information criterion [29], choosing the model with the fewest parameters when models were considered equivalent (ΔAIC < 2). We used data from plots measured at least two times for the disease, mortality, and canopy kill models; for regeneration, we used only data from plots measured for three visits to protect against finding year effects on regeneration due to new plots added rather than a change in regeneration.
We used standard residual plots to validate the canopy kill and seedling regeneration models and k-fold cross validation to evaluate the predictive performance of all the final regression models. Cross-validation involved randomly splitting data nested within plots into five groups of equal size, fitting each top model to data from four of the folds and using the model to predict to data from the fifth fold. We report the predictive performance of the cross-validated model using the Area Under the Curve (AUC) of the receiver-operating characteristic (ROC) plot for binary responses and the root mean square error (RMSE) for beta and negative binomial response variables. The AUC describes the overall ability of the model to correctly discriminate between two observations (e.g., disease presence and absence) and results above 0.7 and 0.9 indicate moderate and high model performance, respectively [30]. The RMSE measures the difference between predictions and observations of the test-fold datasets and models with good predictive power have a small RMSE relative to the range of the response variable.
To visualize the results for blister rust infection, mortality, canopy kill, and regeneration, we used ARCGIS 10.1 Spatial Analyst to create spatial predictions for the best fitting models. We applied the mean coefficients to each predictor of GIS layers to develop the maps and we clipped the output by elevation to eliminate predictions outside the natural elevation range for whitebark pine in our dataset. We classified the predictions in the resulting maps in 10 quantile bins to represent areas of increasing relative probabilities, and for regeneration, to represent increasing seedling counts.

3. Results

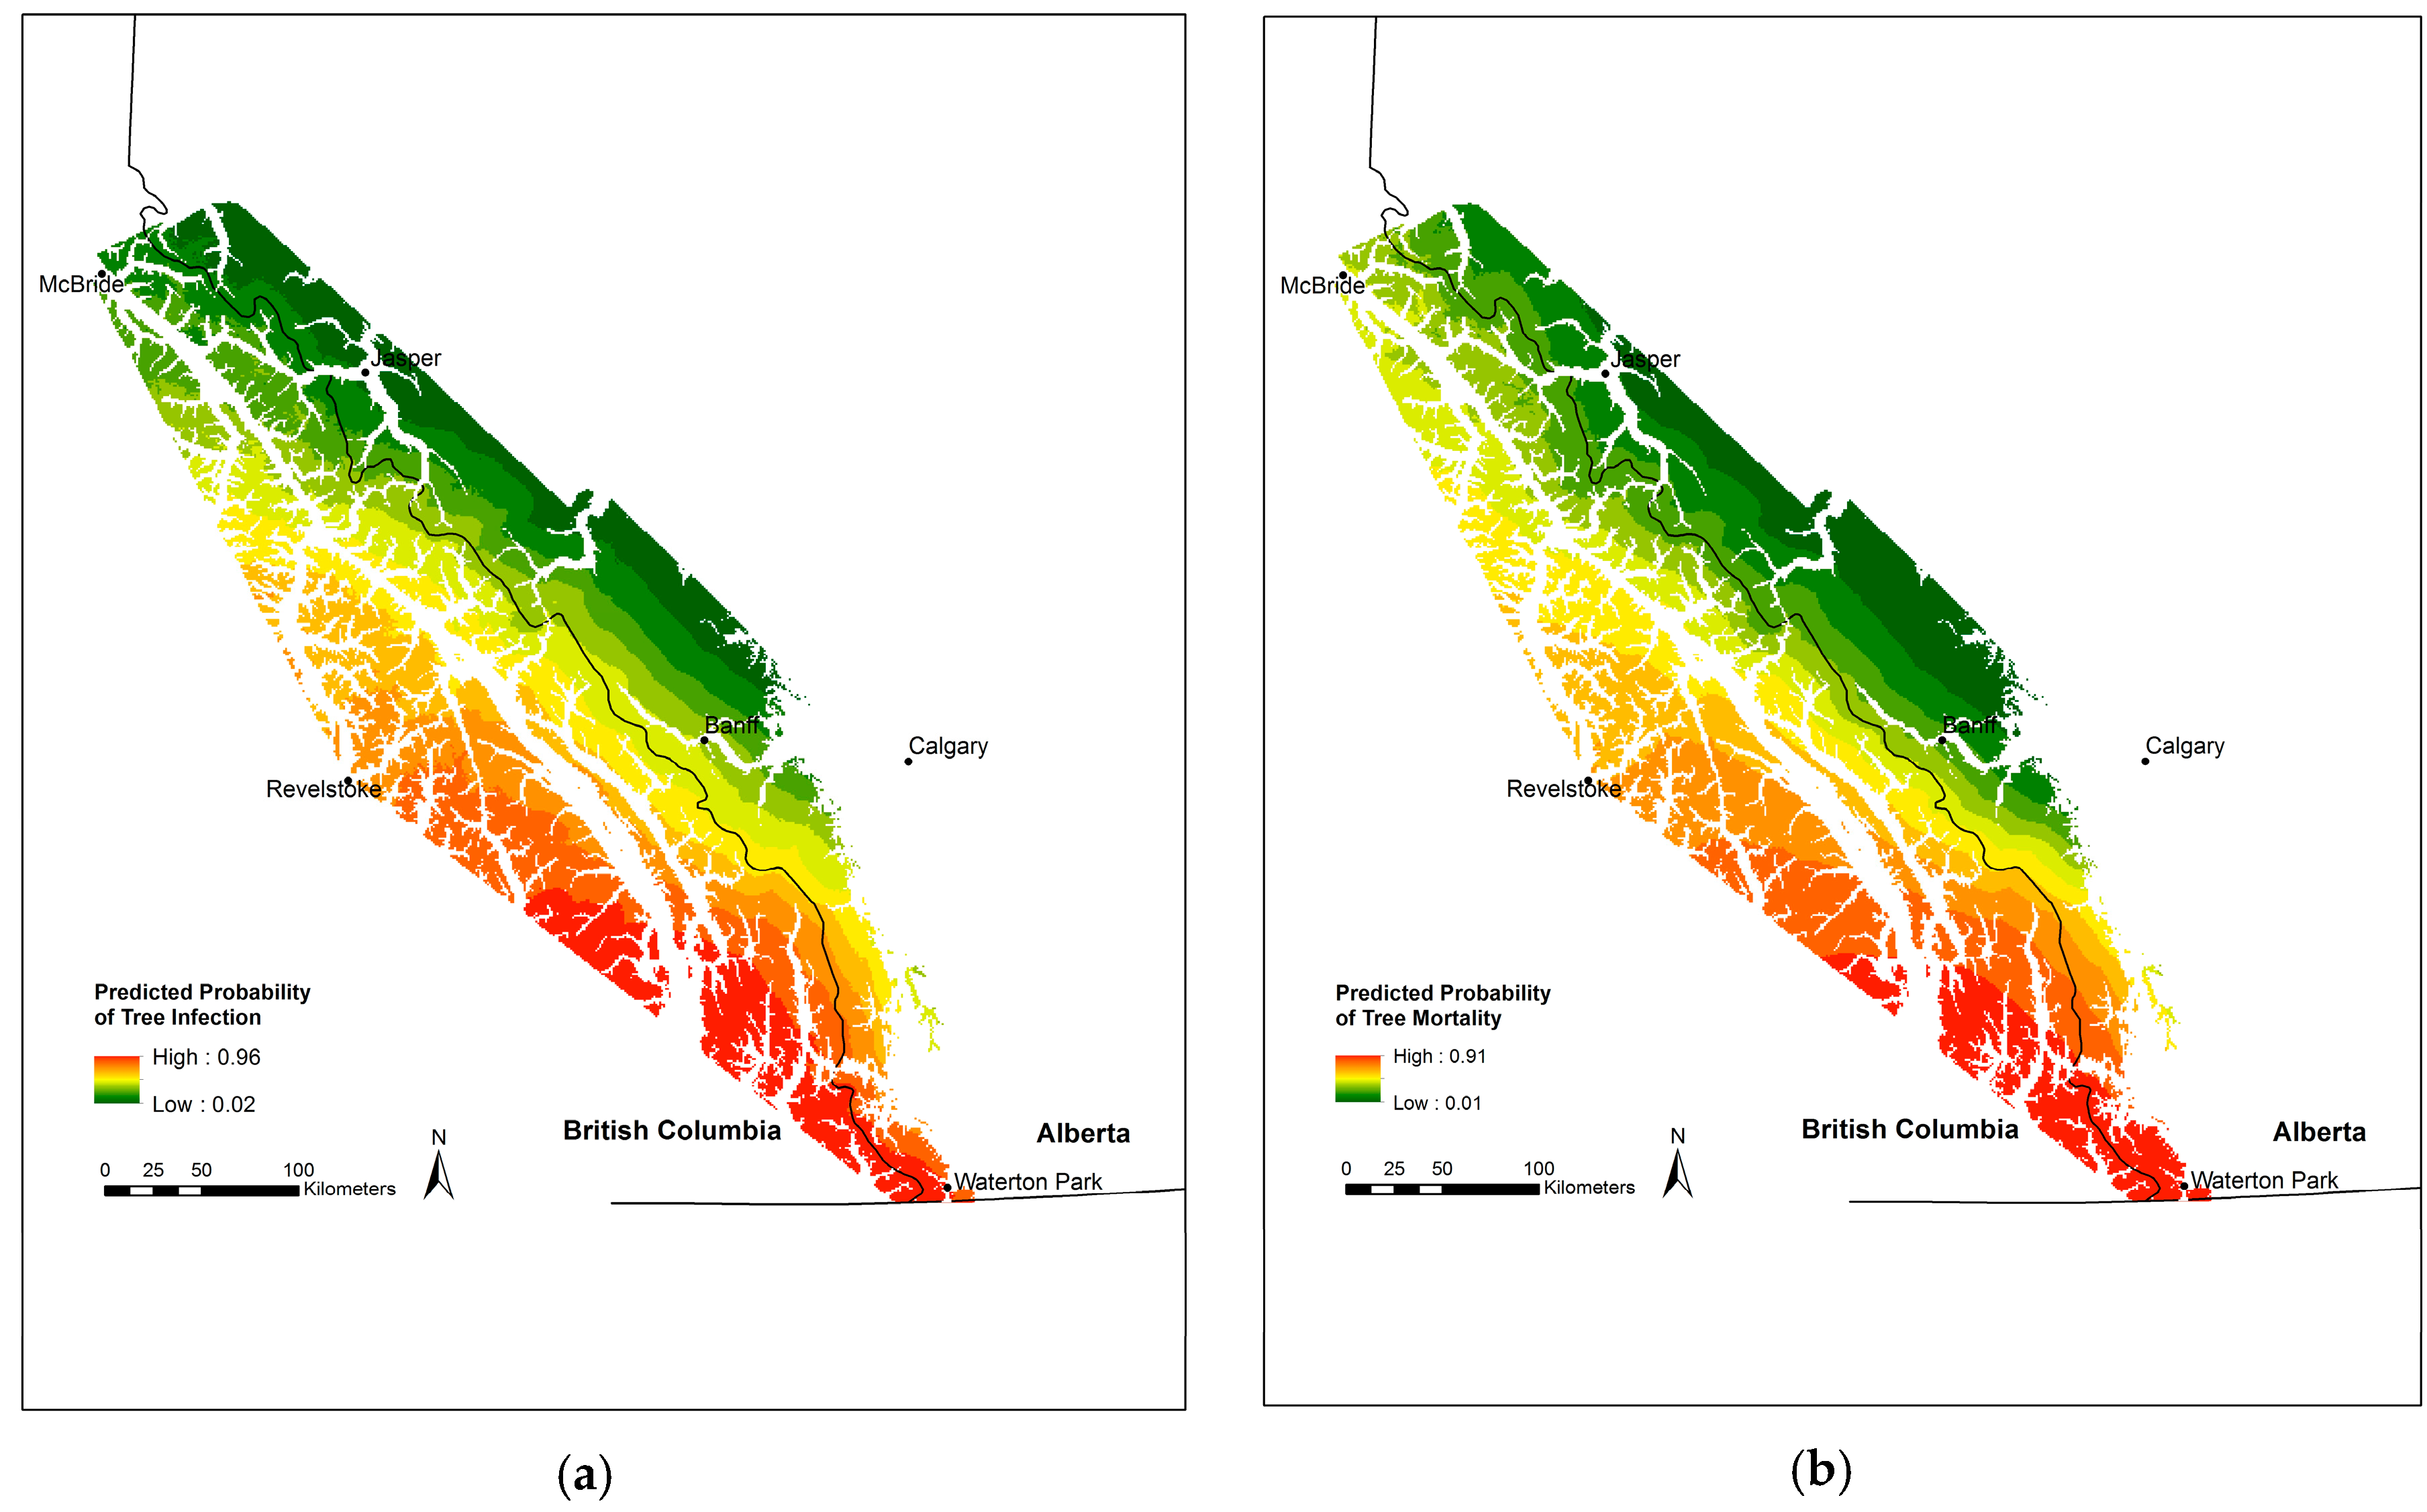
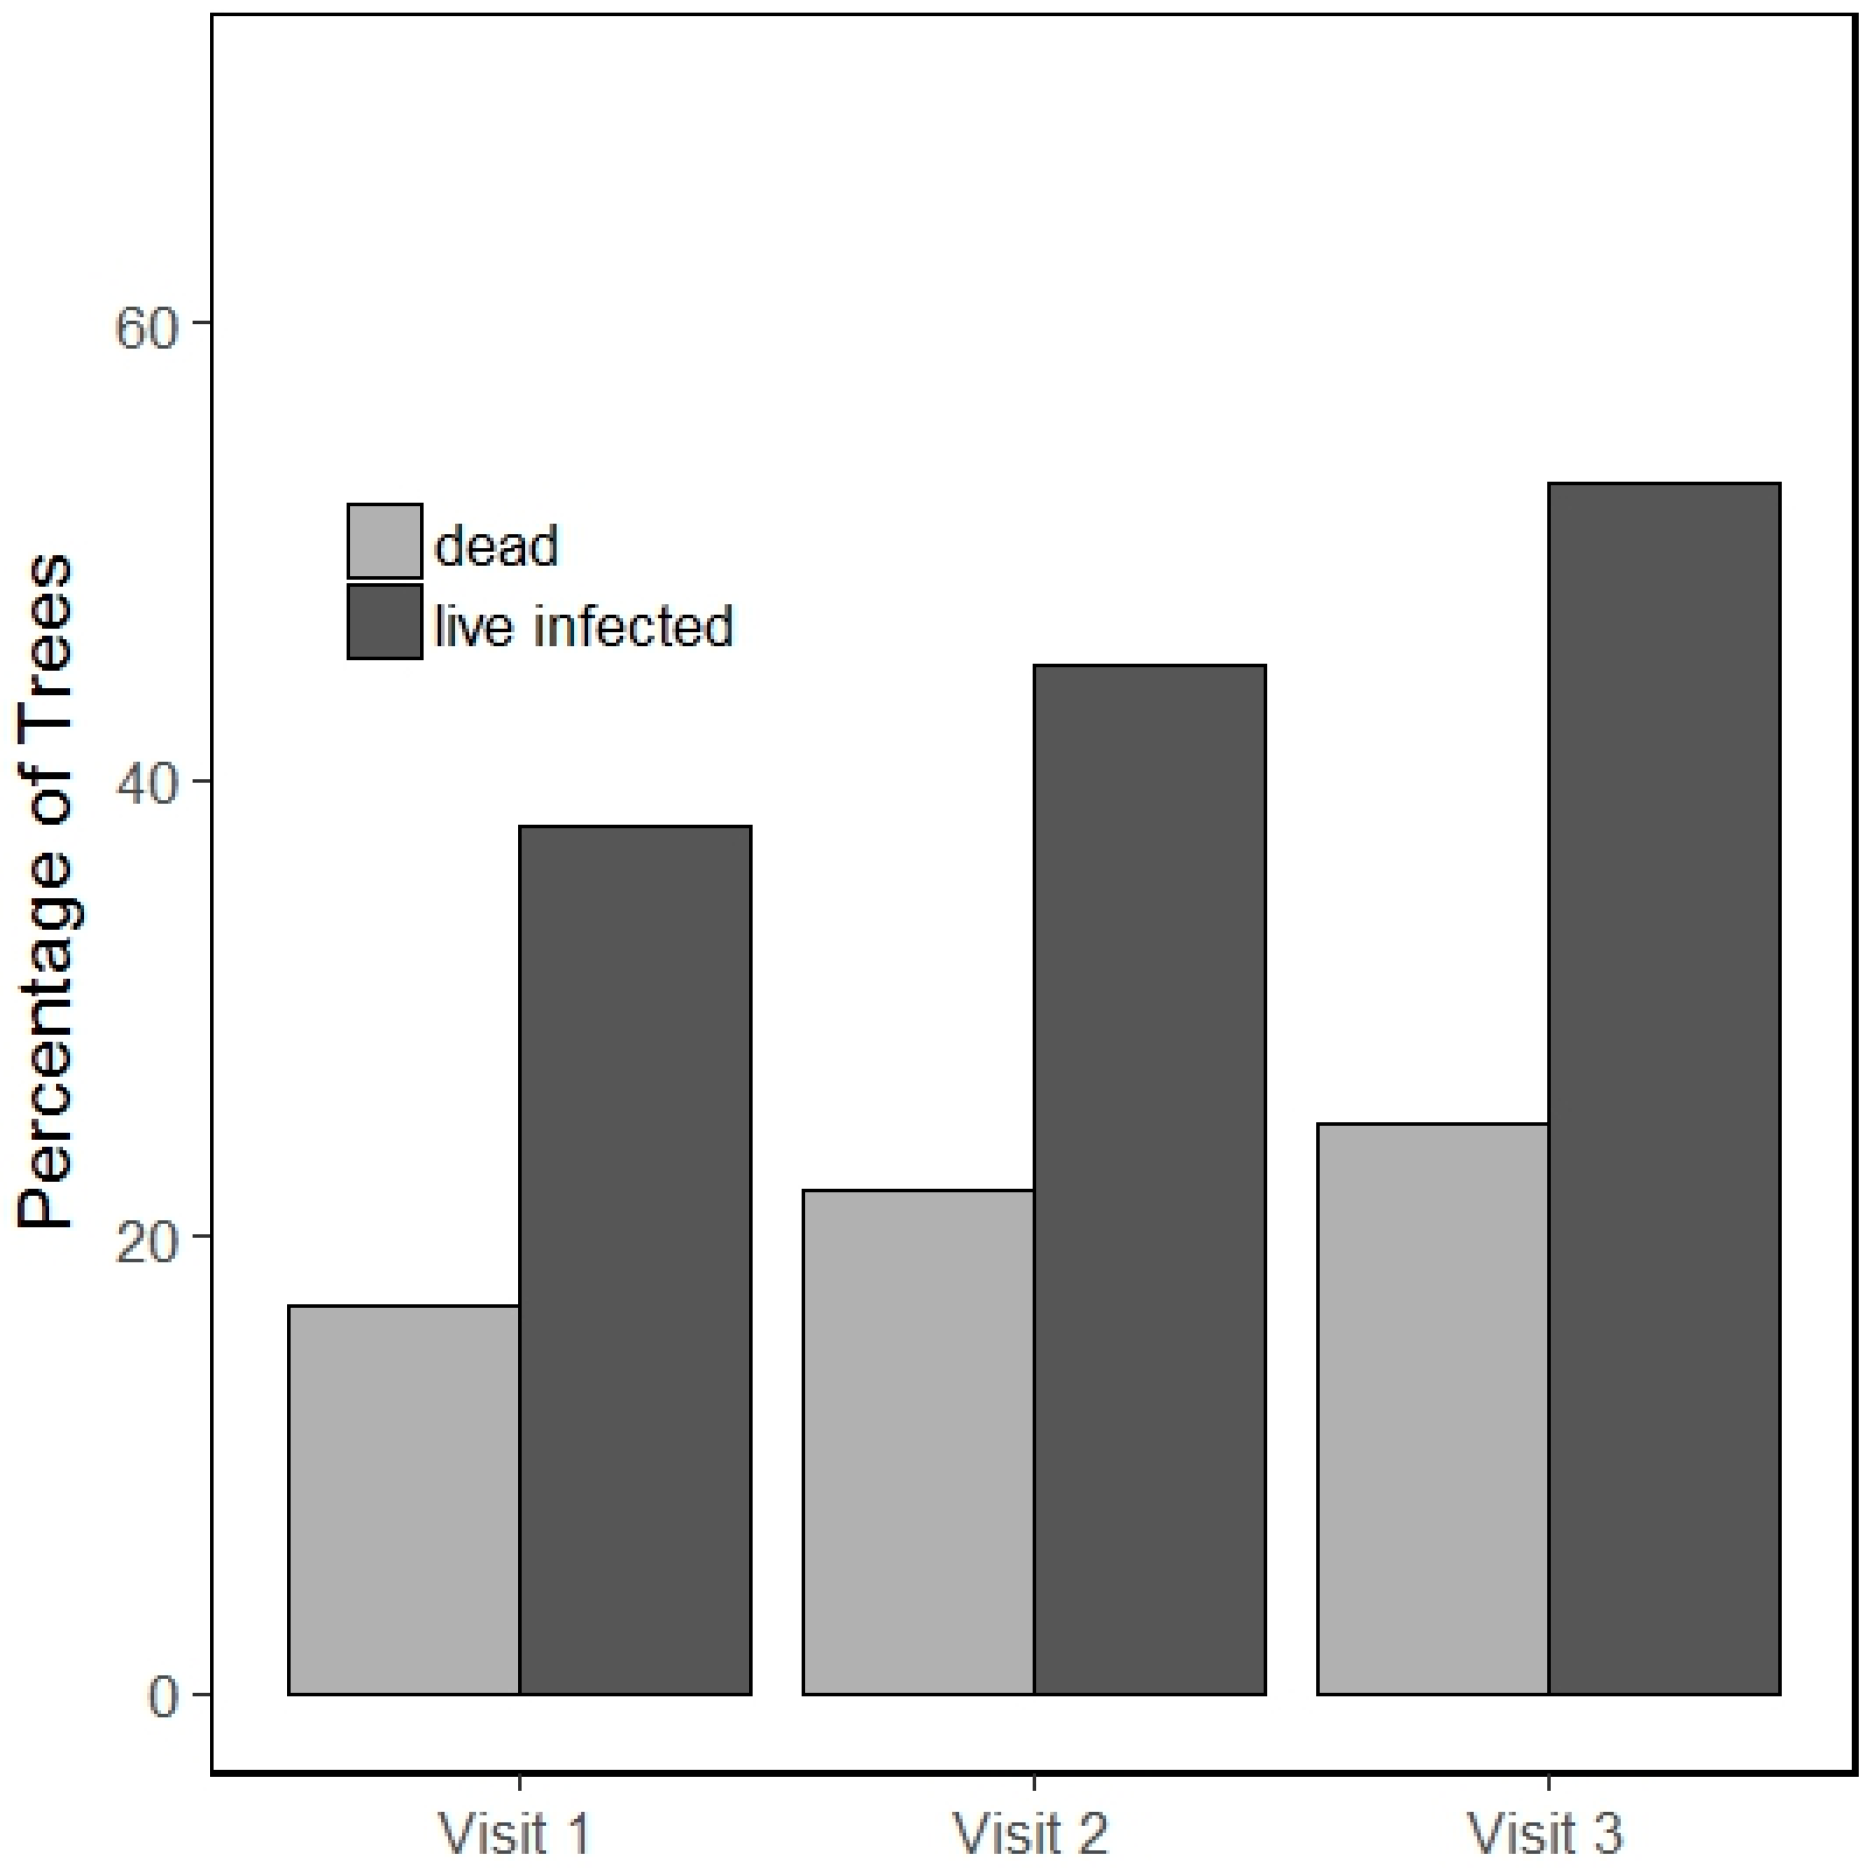
3.1. Incidence of Infection and Mortality

We sampled whitebark pine trees >1.3 m during three visit periods: (1) 2003–2007 (8385 trees), (2) 2008–2012 (7440 trees), and (3) 2014 (8000 trees). The trees were clustered in 181 permanently-marked plots; 135 plots were surveyed three times, while 24 plots had two visits and 22 plots were sampled only once. Over 84% of the trees included in our analyses were measured three times in 2003/04, 2009, and 2014. During visit 1, 84% (n = 7009) of trees were alive, while 76% (n = 5690) of trees were alive at visit 2, and 74% (n = 5886) of trees were alive at visit 3. Of these trees examined, we removed live trees with heavy lichen loads obscuring the bark from the dataset, because they could not be properly assessed for WPBR (63, 242, and 363 trees were removed for visits 1, 2, and 3, respectively).
For the 135 plots surveyed three times, 38% of living trees were infected at visit 1, 45% at visit 2, and 53% were infected at visit 3 with WPBR (had active or inactive cankers) (Figure 2). Trees that died between sampling intervals were removed from the incidence of infection calculations and were included in calculations of rates of mortality. Infection levels increased 1.5% year−1 between the first visit and the third visit (~2003 to 2014). Of the infected live trees, 20% had stem cankers in visit 1, increasing to 27% in visit 2, and 29% in visit 3. While large trees may live for many years with stem cankers, the cankers often cause canopy kill and significantly reduce cone and seed production in the tree. The largest live tree sampled exhibited an 88 cm diameter at breast height (DBH), while the mean tree DBH across the study area was 10 cm. Mortality levels increased 0.8% year−1 over the ten years between the first and third visits, from 17% at visit 1, to 22% and 25% at visits 2 and 3, respectively (Figure 2).
For dead trees in plots surveyed three times, cause of death could be determined for 25% (348 of 1376) of surveyed trees in visit 1, 32% (566 of 1750) in visit 2, and 33% (700 of 2114) in visit 3. Of the trees for which we could attribute a cause of death in visit 1, 64% (223) had definite signs of WPBR (active or inactive cankers), increasing to 75% (423) in visit 2 and 78% (544) in visit 3. Evidence of mountain pine beetle (MPB) infestation (J-shaped galleries) informed the cause of death for 35% (125), 25% (143), and 22% (152) trees in visit 1, 2, and 3, respectively.
To assess seedling blister rust infection and regeneration, we counted 1986, 1726, and 2576 short seedlings and 1521, 2048, and 1882 tall seedlings in plots over the three visits, respectively. Of the tall seedlings, 25% (388), 22% (443), and 28% (535) were infected in visit 1, visit 2, and visit 3, respectively, while approximately 7% (152, 124, 190) of short seedlings were infected during all three visits.

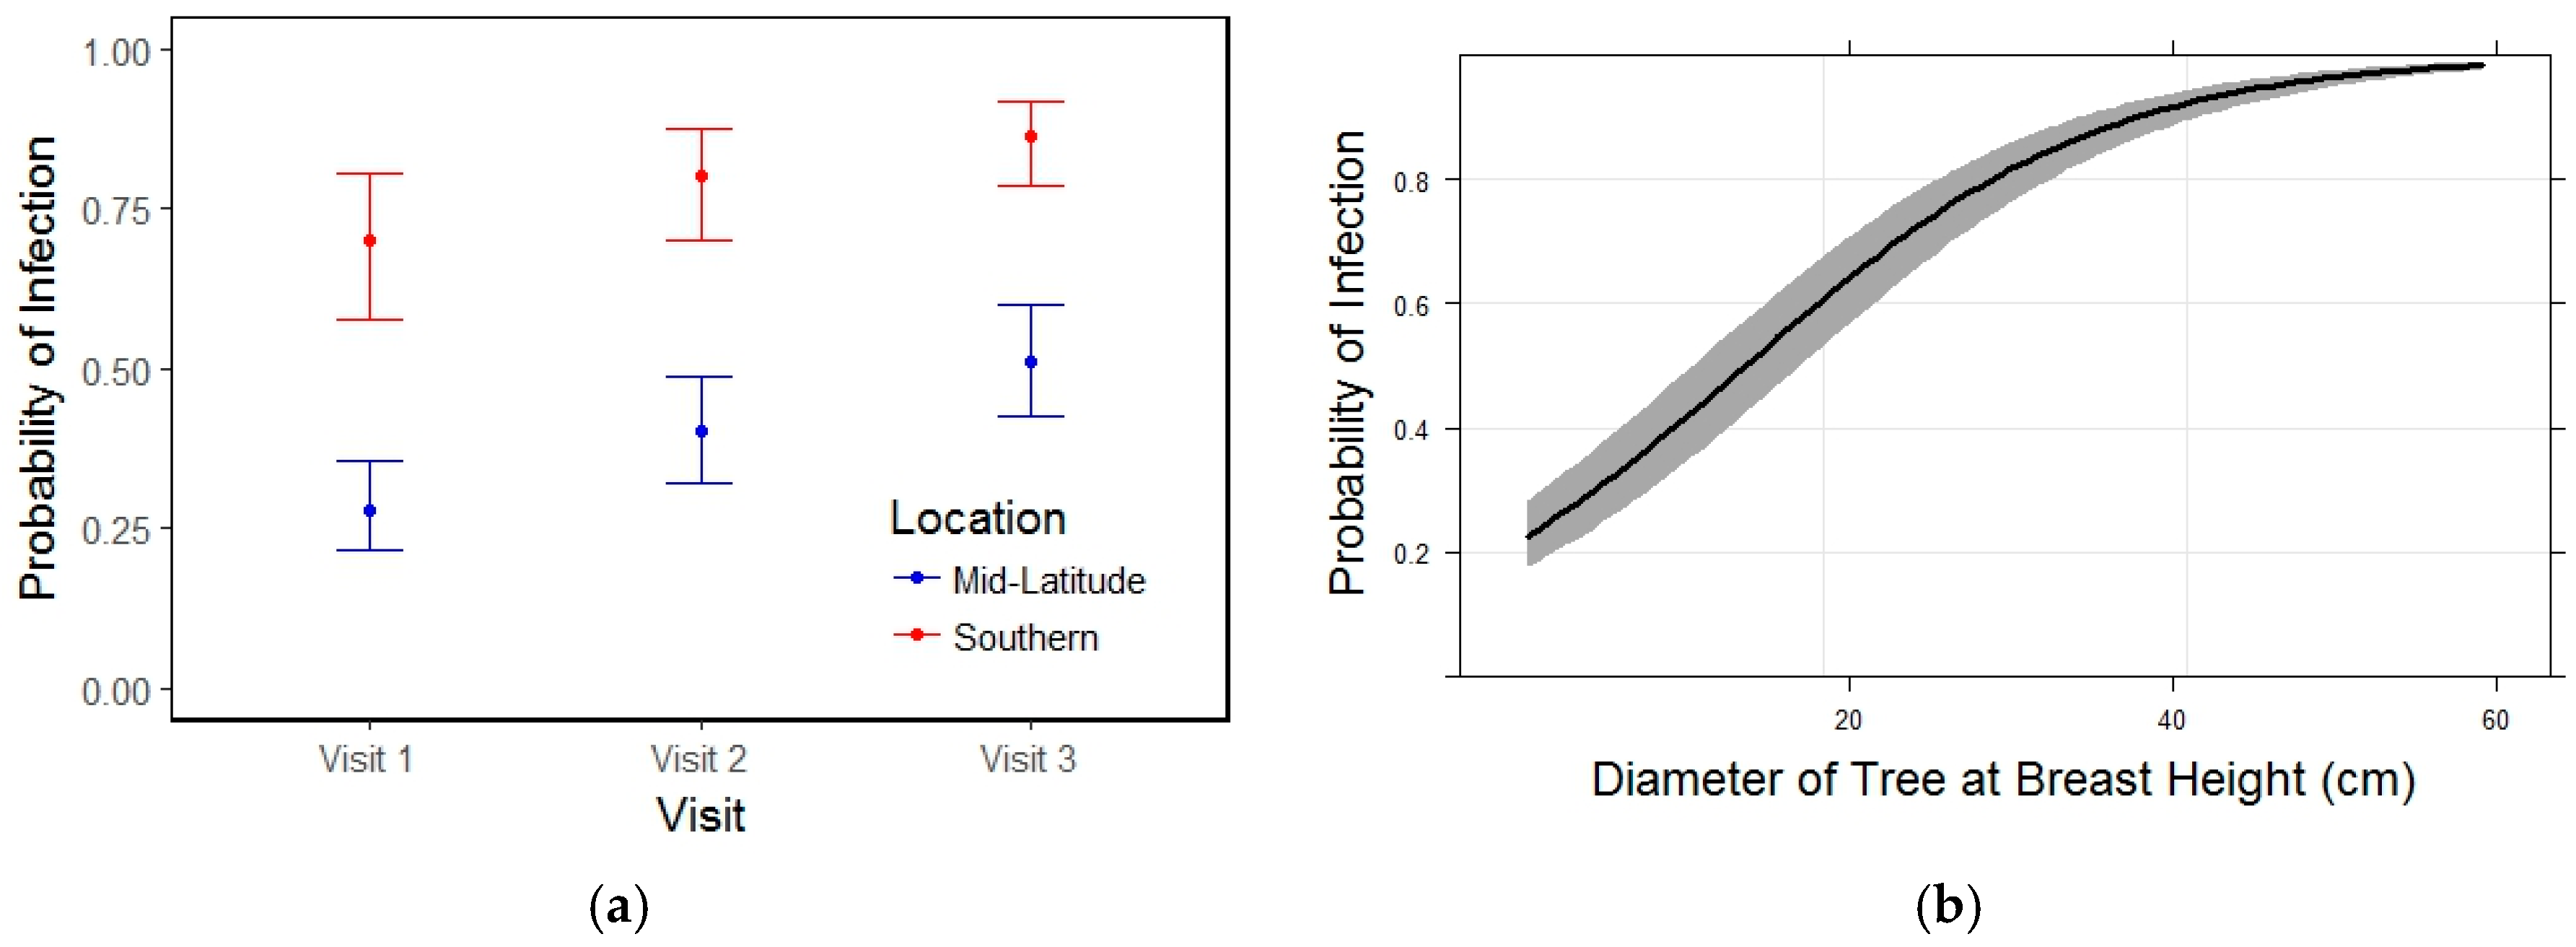
3.2. Blister Rust Infection in Live Trees

Blister rust infection in live trees has increased significantly since 2004 (Table 2, Figure 3a) and infection is more common in larger diameter trees (Table 2, Figure 3b). Tree diameter ranged from approximately 1 cm to 88 cm, and in 2014, the median tree diameter was 6 cm for healthy trees, and 11 cm for blister rust infected trees. Blister rust infection for live trees was variable across the study area. Figure 3a compares the 2014 probability of infection for a 10 cm diameter tree at a mid-latitude location (50% probability of infection) and a southern location (>80% probability of infection), at mean values for growing degree days and distance to divide. The probability of infection was higher for trees in stands located west of, or near, the continental divide, and at sites with a longer growing season (Table 2). The probability of blister rust infection map (Figure 4a) indicates that the risk of blister rust infection for a 10 cm diameter tree ranges from a high in south-east BC of 96% to a low of 2% along the northern edge of the eastern slopes. The blister rust infection model had a moderate discrimination ability within the range of the predictor variables used in the study area [31] with an average cross-validated area under the curve of 0.78 (SD = 0.02), indicating that the model can discriminate between blister rust infected and uninfected trees 78% of the time.

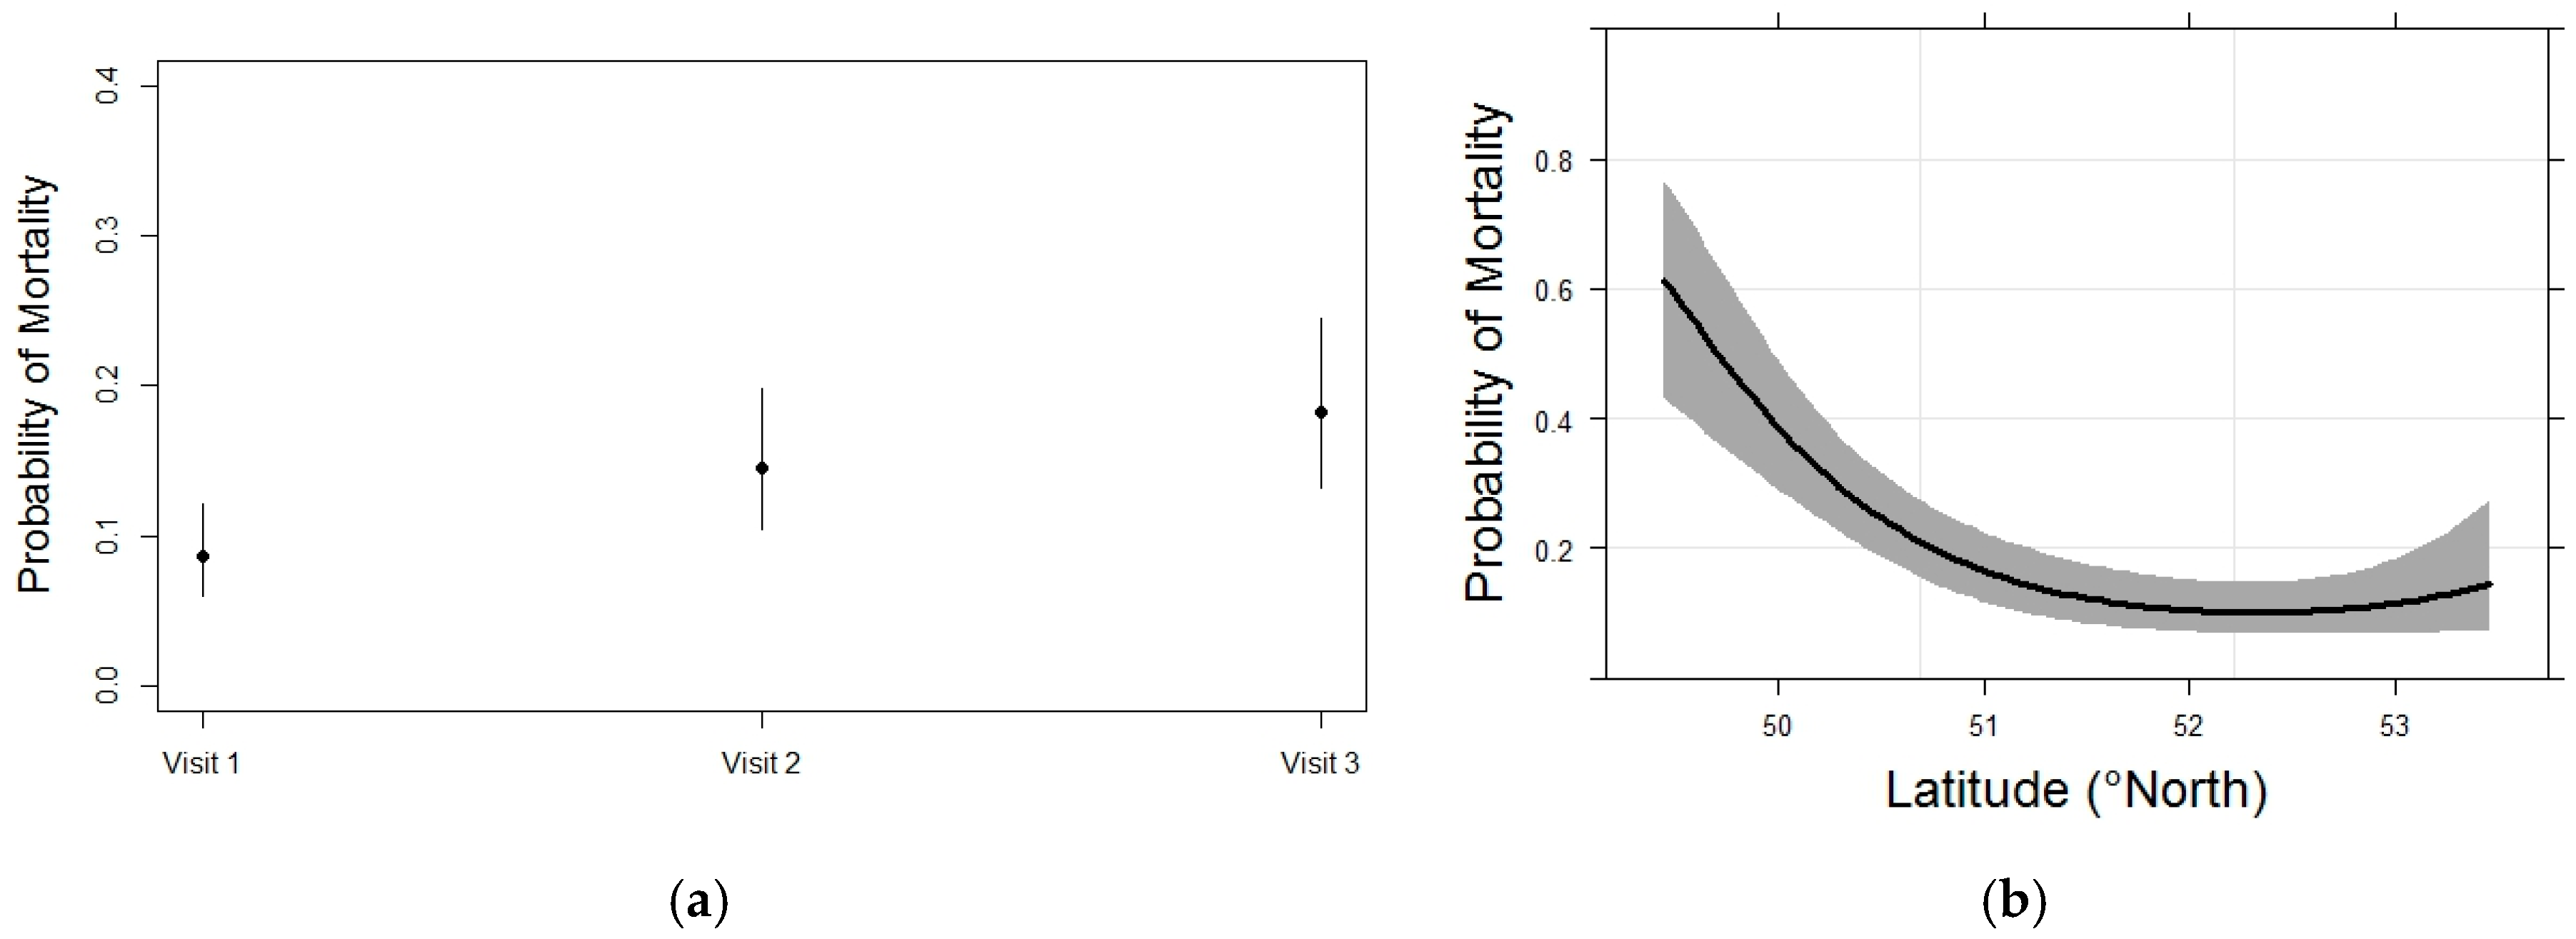
3.3. Whitebark Pine Mortality

We found that latitude, growing degree days, distance to the continental divide, and year were significant predictors of tree mortality (Table 2). Figure 5a illustrates that the probability of tree mortality has increased by approximately 10% between visit 1 and visit 3 (~10 years). Inclusion of the quadratic term for latitude indicates that mortality was highest in the southern range, declined to the mid-latitude stands in Banff National Park, and increased slightly near the northern extent of the study area in Jasper National Park (Figure 5b). The probability of mortality map demonstrates that the spatial pattern in tree mortality ranged from 91% probability of mortality in south to 1% along the east slopes (Figure 4b). The average cross-validated area under the curve of the model predicting whitebark pine mortality was 0.80 (SD = 0.06), indicating that the model can discriminate between dead and live whitebark trees 80% of the time.

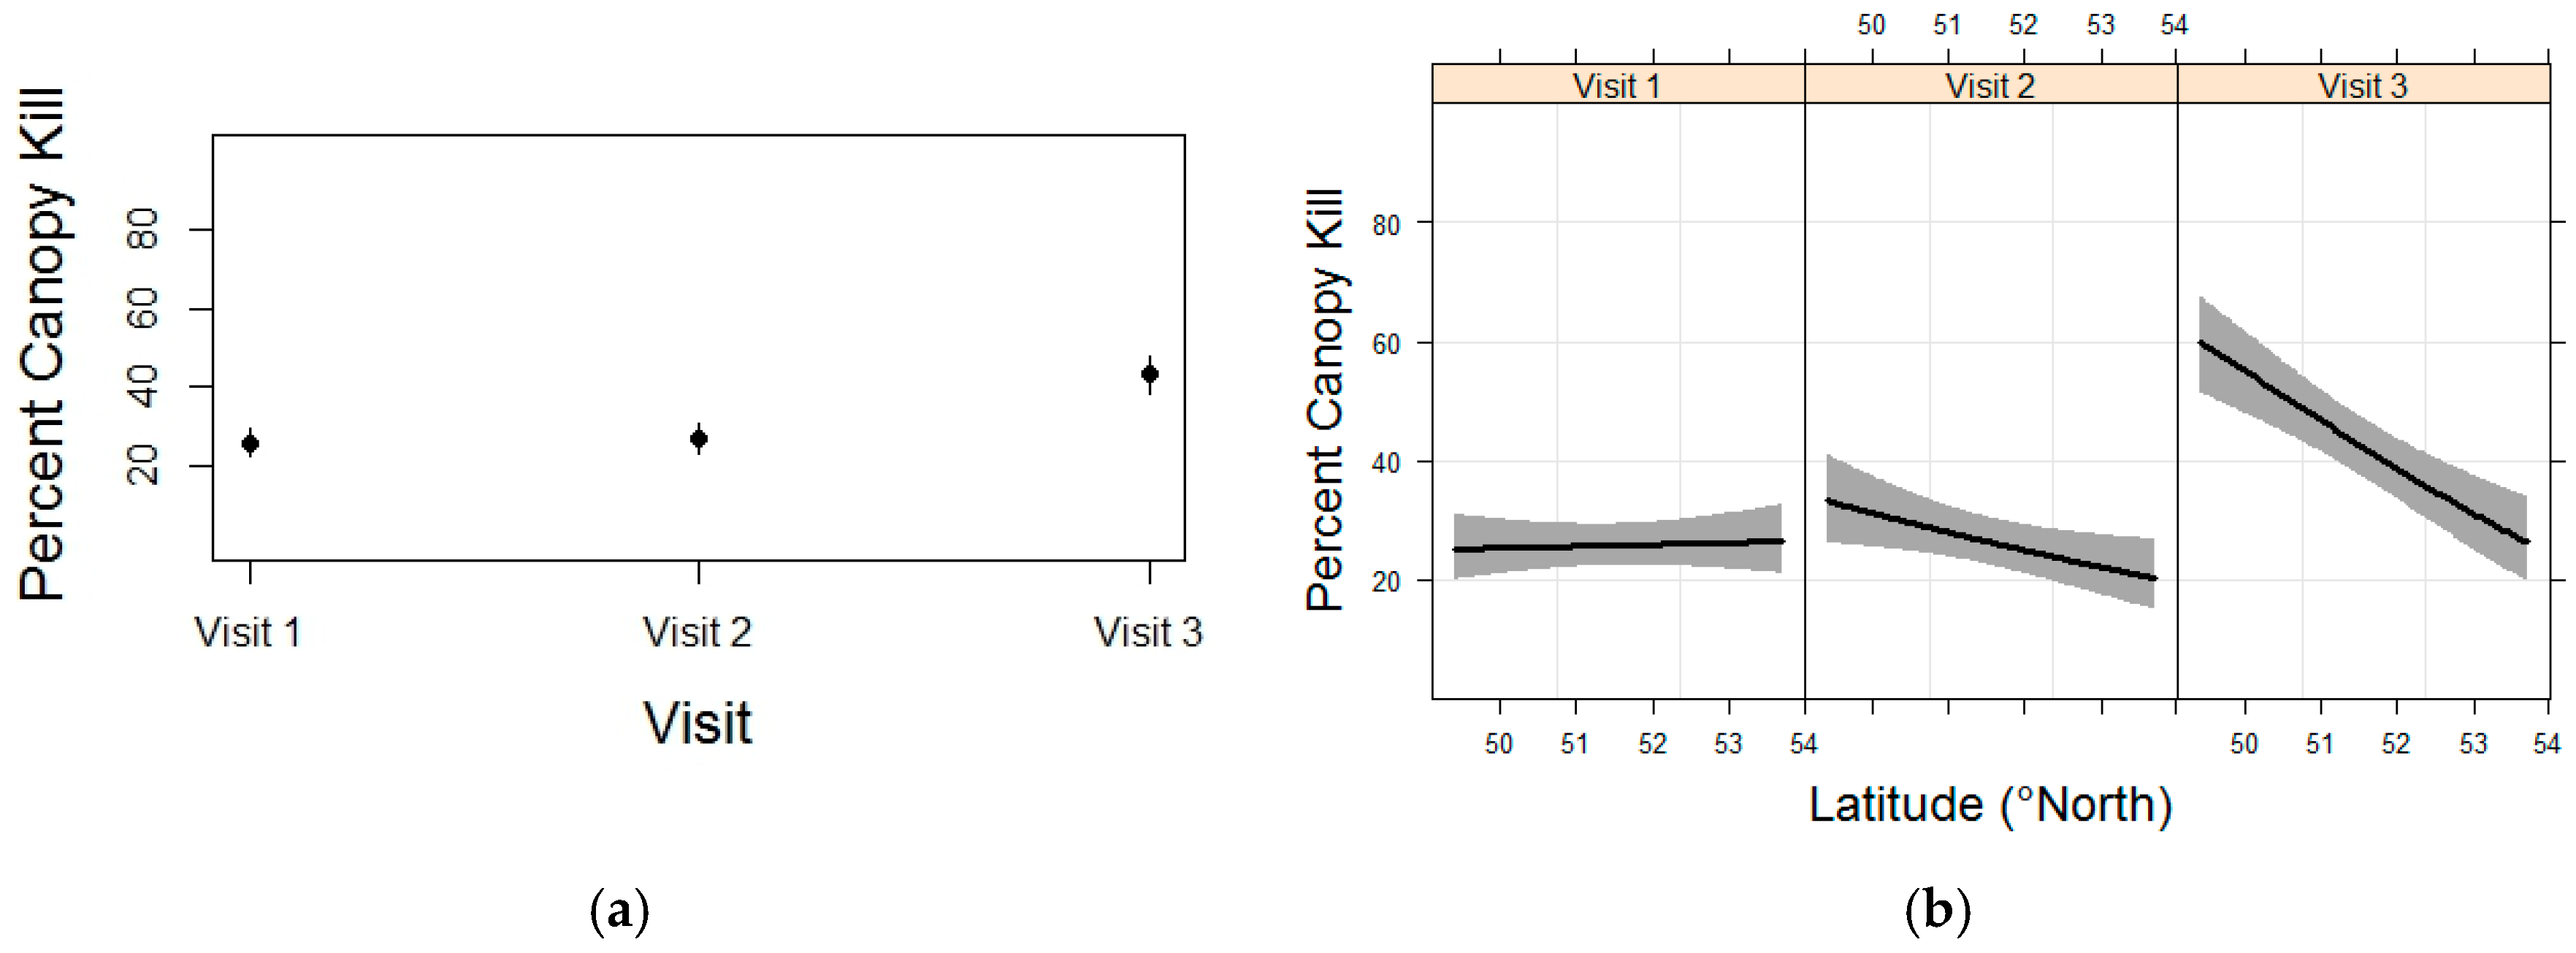
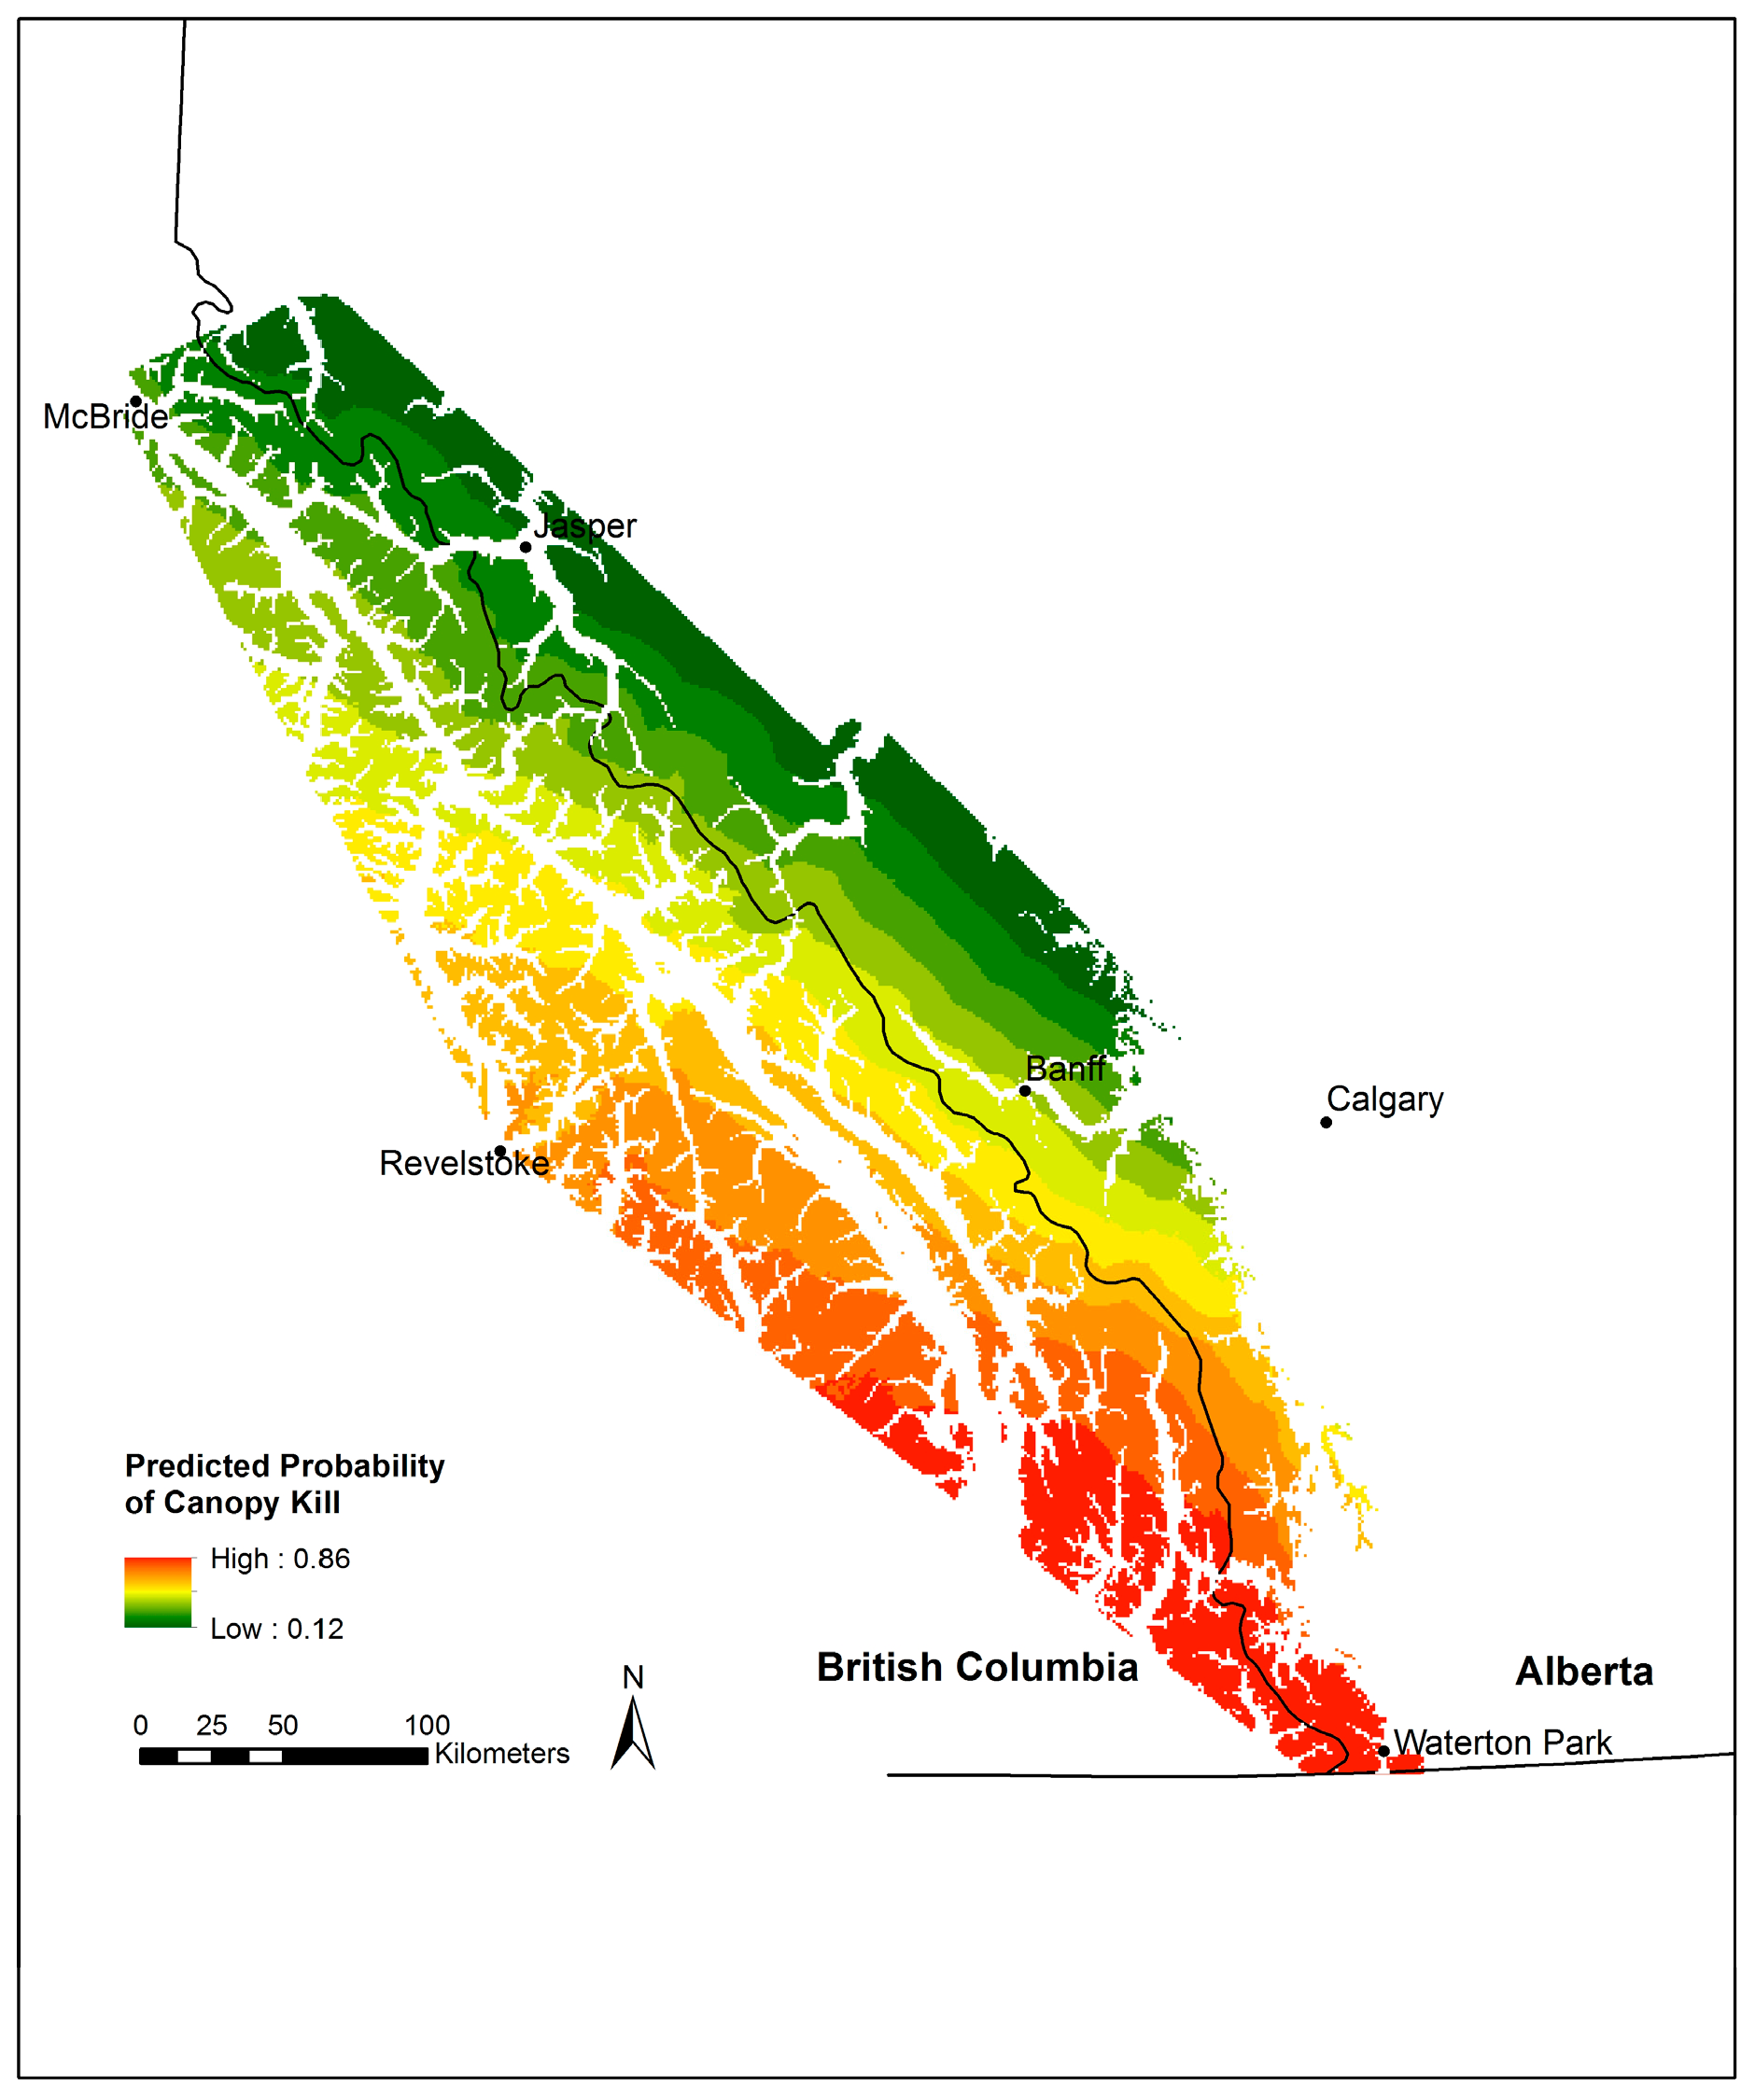
3.4. Whitebark Pine Canopy Kill

Percent average canopy kill increased over time from approximately 20% during visits 1 and 2 to 40% during visit 3 (Table 2, Figure 6a). The greatest increase in canopy kill occurred in the southern portion of the study area (Figure 6b). Canopy kill was higher west of, and near, the continental divide, and at stands with longer growing degree days (Table 2, Figure 7). We included the interaction between latitude and year based on visual inspection of the variables and standard diagnostic plots. The five-fold cross-validation indicated a good predictive performance: the root mean squared error was 0.02 (SD = 0.001), which is small relative to the range of the canopy kill response variable.

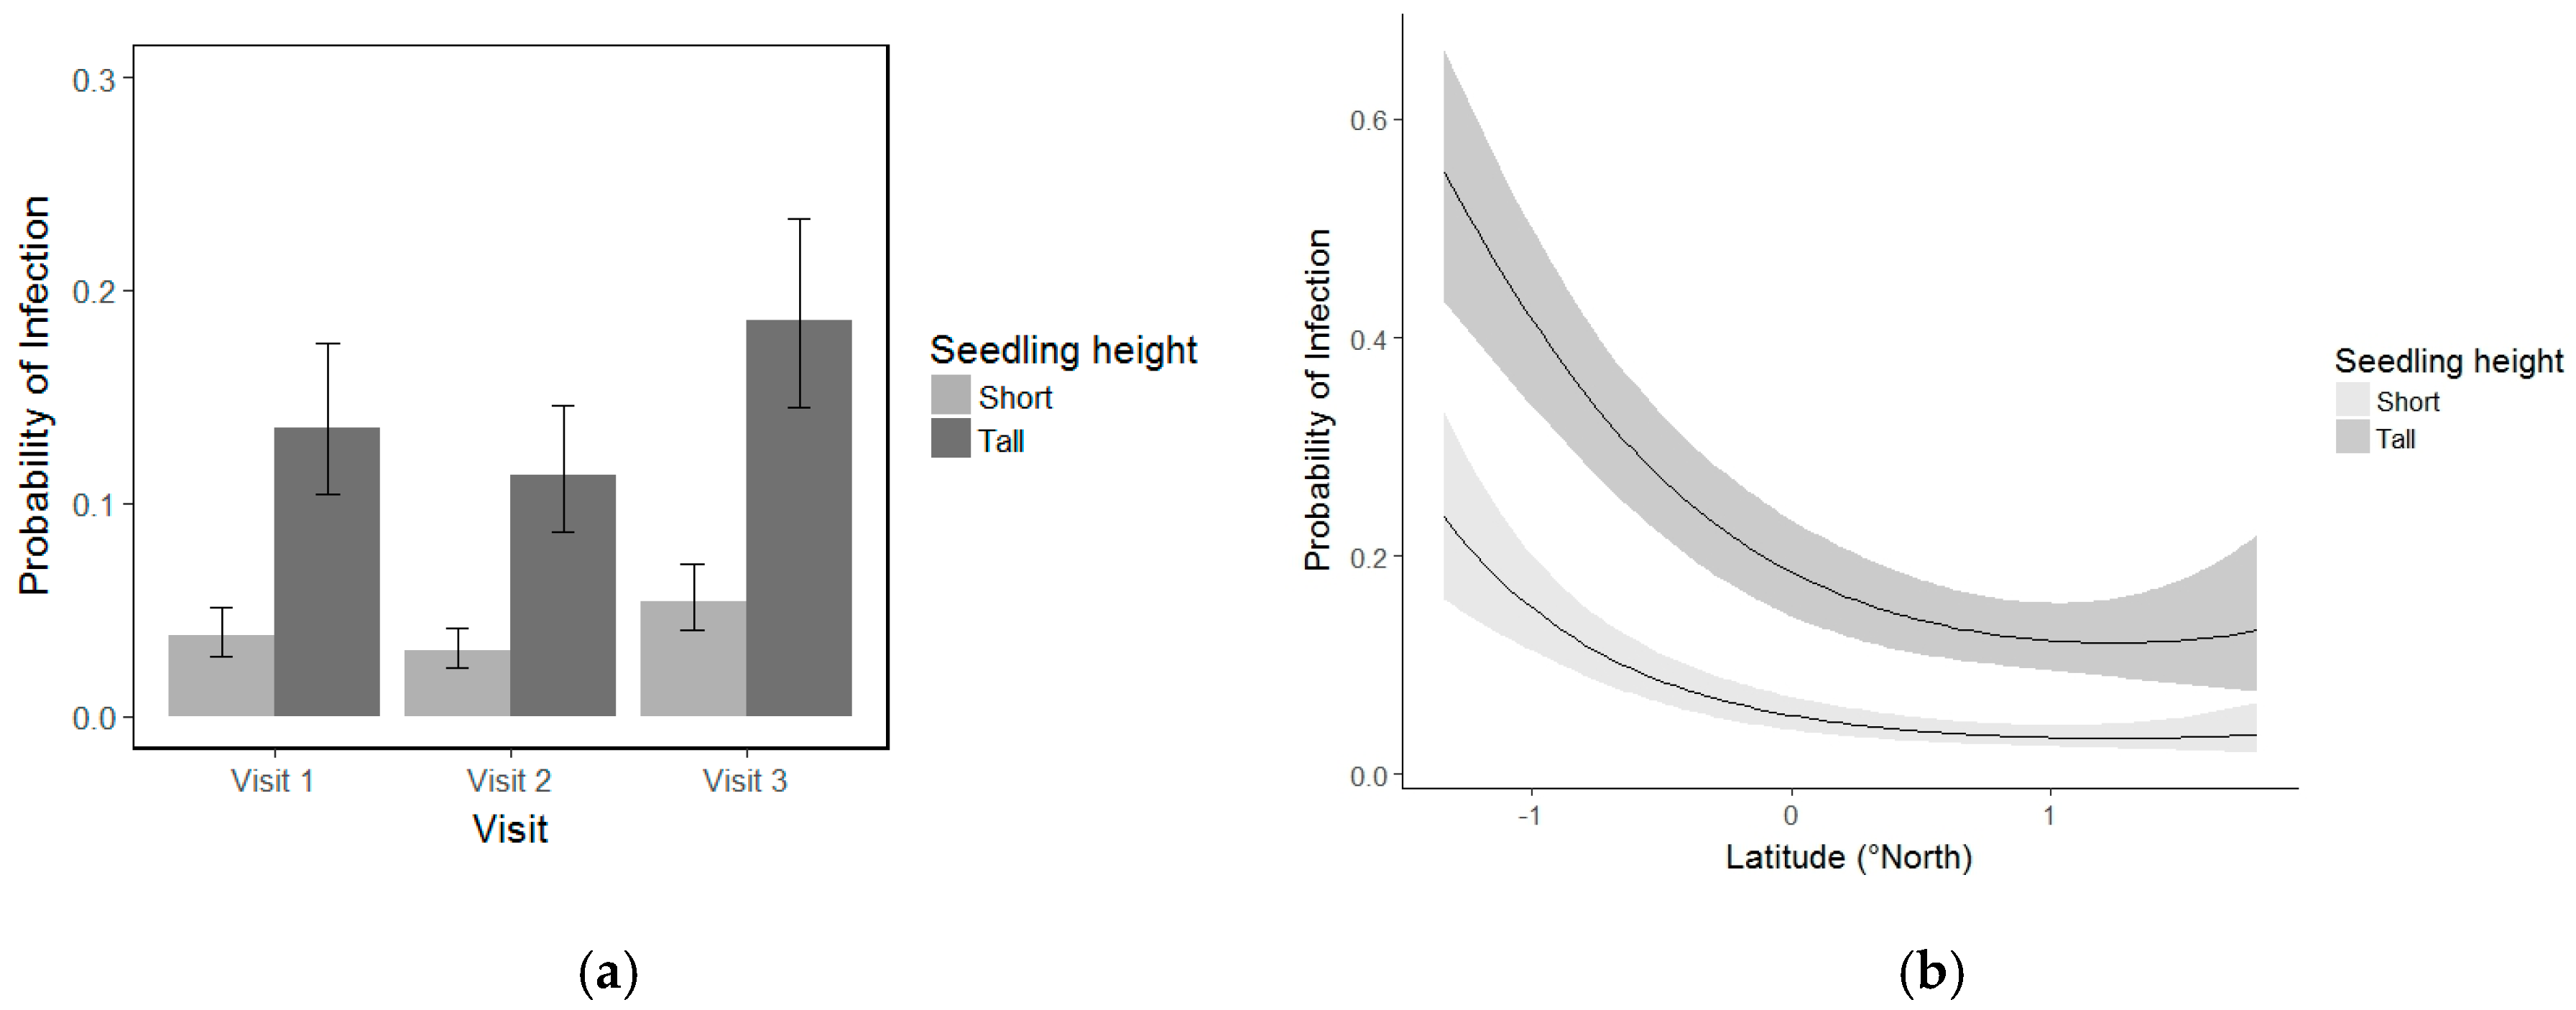
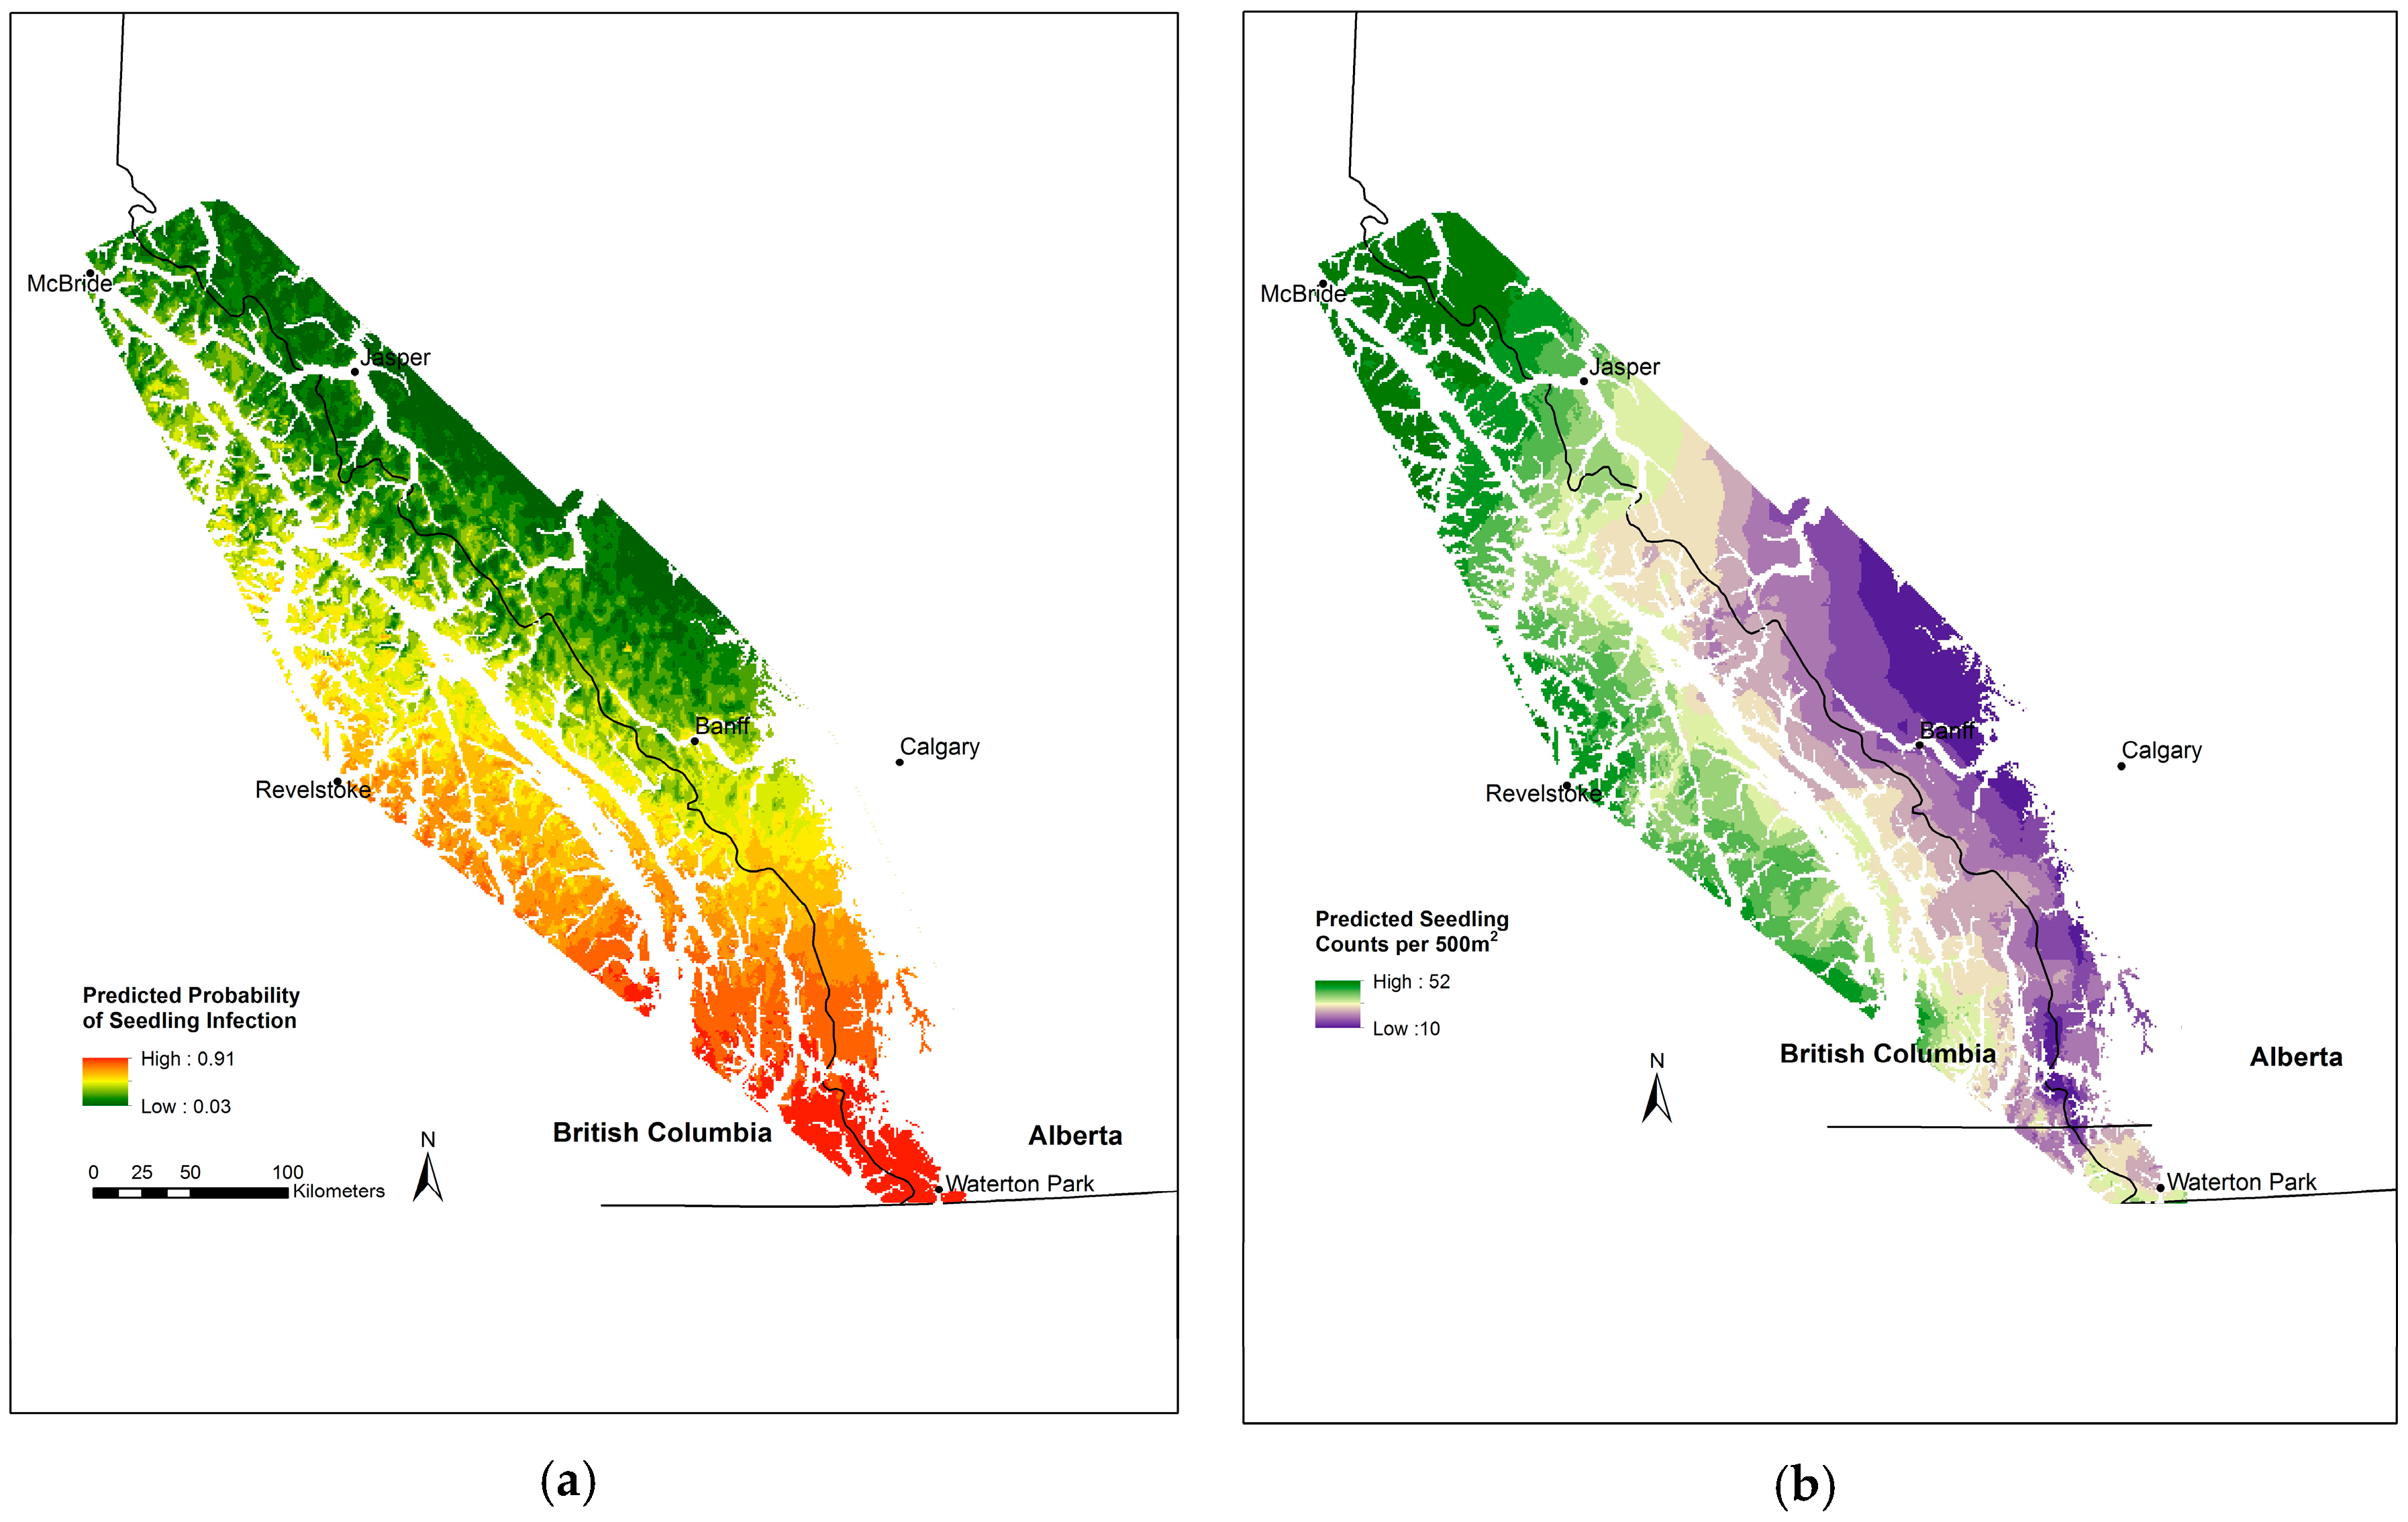
3.5. Whitebark Pine Seedling Infection

Blister rust infection in seedlings declined from visit 1 to visit 2, but increased from visit 1 levels in visit 3 (Table 2, Figure 8a). The 2014 probability of infection for a tall seedling (based on mean values for predictor variables) is almost 20%. As with whitebark trees, seedling infection is spatially variable (Table 2, Figure 9a), and is higher in tall seedlings than short seedlings (Table 2, Figure 8a). Seedlings are much less likely to be infected at middle and northern latitudes (Figure 8b), and are more likely to be infected at sites with higher spring radiation (Table 2). The average cross-validated area under the curve of this model for live seedling infection was 0.78 (SD = 0.02).

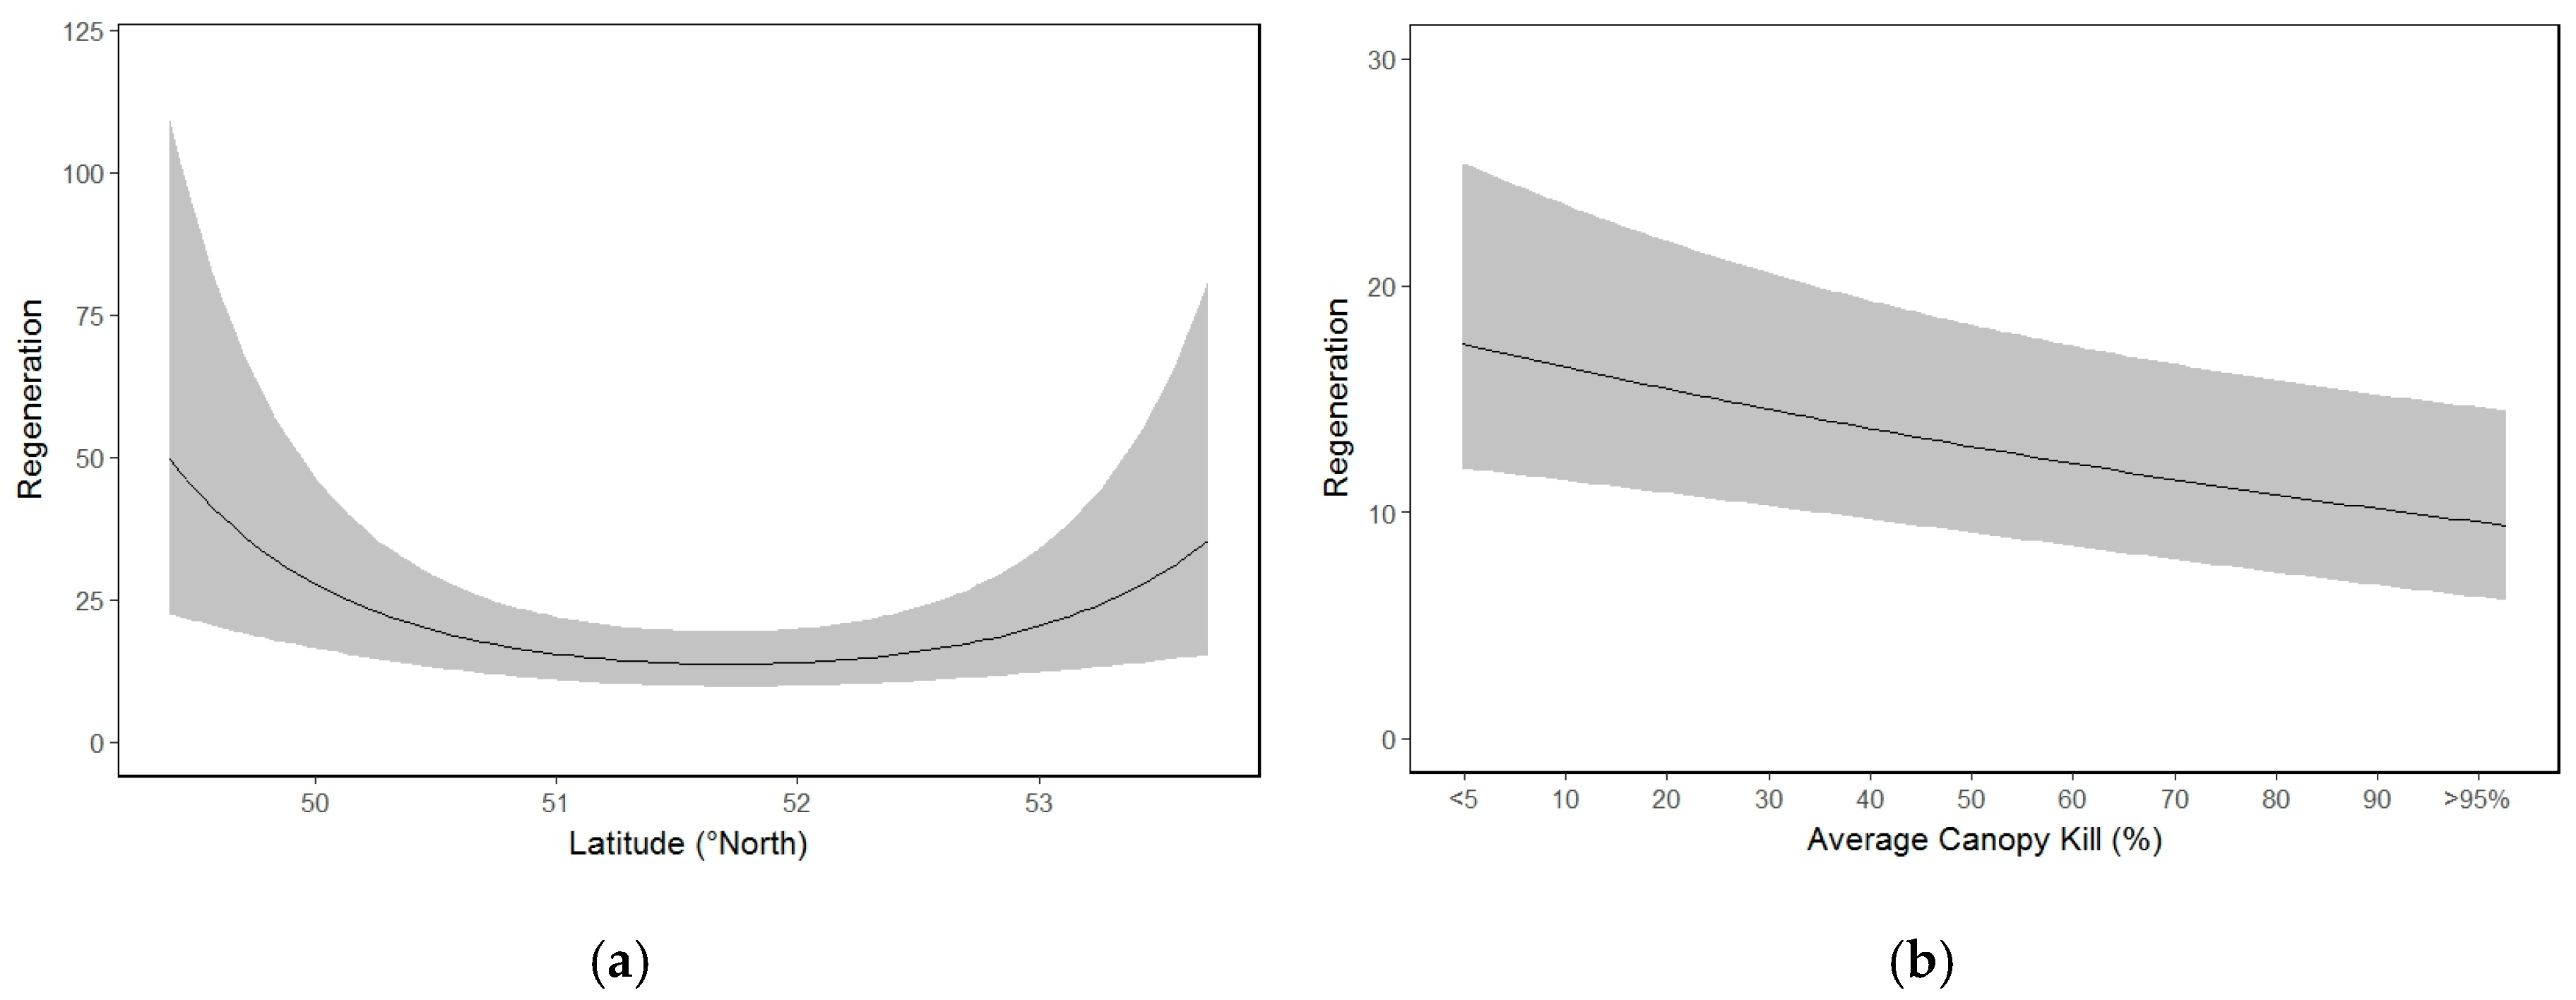
3.6. Whitebark Pine Natural Regeneration

Natural regeneration in plots ranged from 0 to 2254 (mean = 463) seedlings per hectare, estimated from plots that ranged in size from 140 to 2830 m2; however, the majority of plots (80%) were 500 m2. Eleven plots (n = 181 plots) had no regeneration. We estimated live basal area using DBH measurements from all whitebark. Average basal area was 9.2 m2 per hectare (SD = 7.3) in 2014. We tested basal area and canopy kill, which reduces the cone producing potential in a stand, for inclusion in the model, but only canopy kill was retained. Regeneration was highest in the southern and northern regions of the study area and on south-west aspects (Table 2, Figure 10a). Seedling counts peaked where there were moderate growing degree days, declined as average canopy kill increased at a plot (Figure 10b), and increased slightly in 2014 compared to the previous years (Table 2). The natural regeneration map illustrates the spatial variation in regeneration and highlights pockets of low regeneration that occur in the southern east-slopes and southern continental divide areas (Figure 9b). Validation plots and cross-validation indicated a good predictive performance: the RMSE is 20.6, which is small relative to the range (0–138) of seedling counts. All predictions (plots and maps) used the plot size of 500 m2 for the offset to account for variable plot size in seedling counts.

4. Discussion

Our long-term monitoring program detected the increasing and cascading effects of blister rust infection across whitebark pine stands in the Canadian Rockies and Columbia Mountains from 2003/4 to 2014. Blister rust infection increased throughout this large region, with the disease progressively killing whitebark pine trees and the tree canopy, removing cone producing branches, consistent with other studies that have demonstrated blister rust infection leading to crown damage, mortality, and lower cone production [32]. We found negative relationships between canopy and natural regeneration, indicating that blister rust is already leading to declines in whitebark pine numbers. The consistent spatial patterns in blister rust, mortality, and canopy kill indicate that the areas with the greatest need for active restoration are in southern Alberta and south-east British Columbia.

4.1. Blister Rust and Mountain Pine Beetle Relationships

Our blister rust infection results were consistent with other studies that have found that infection was lower further east of the continental divide, where conditions are drier [33], and progressively north, where the growing season is a shorter [14,21,22]. The spread of blister rust from Ribes and other alternate hosts to whitebark pine is mediated by high relative humidity and mild temperature conditions [14,34], and in our study area, the southern and western portions are relatively warmer and wetter. The lower infection rates in the north and east may be due to the dry and cold environments limiting the spread of blister rust [35,36] and the progression of the disease through time from the introduction point to the extent of the Canadian range of the species.
The increasing infection probability for larger trees has important implications for whitebark pine regeneration given that cone production increases with tree size [37]. Campbell and Antos [14] also found that larger trees were much more likely to be infected than small trees, and they theorized that the higher incidence reflects their greater chance of intercepting basidiospores via their higher surface area of foliage compared to small trees. Increasing infection rates over time, including in high elevation, short growing season areas, indicates that satisfactory conditions for the spread of blister rust exist throughout our study area; this is also true of other Canadian study areas [13,14]. While the predictive accuracy of our infection models was good, it is also likely that blister rust infection is influenced by wind patterns that disperse basidiospores, and the presence of the alternate hosts for blister rust [34,38], which are variables not measured in this study.
The conditions for seedling infection were influenced by time, topographic variables, and climatic conditions, including summer heat moisture and spring radiation. The infection results for seedlings point to areas where the conditions for the spread of blister rust are suitable for relatively short lived, low surface area seedlings to become infected. Consistent with this, and similar to other studies, tall seedlings were more highly infected than short seedlings [39,40]. McDonald and Hoff [34] describe that blister rust infection requires two hosts (e.g., Ribes and whitebark pine) in close proximity, plus suitable environmental conditions. Seedlings have a lower chance of infection than large canopy trees due to their low surface area to intercept basidiospores [14]. Therefore, by extension, the variables predicting seedling infection indicate the most suitable environmental conditions for the growth and spread of blister rust from an alternate host to whitebark pine in the Canadian Rocky and Columbia Mountains. Summer heat moisture is an index that accounts for the mean temperature of the warmest month and mean summer precipitation [25]. While growing degree days predicted tree infection in our study and others [14], more specific and suitable environmental conditions appear to be required for the growth and spread of blister rust to seedlings. The importance of summer heat moisture and spring radiation likely reflects the benefit of high humidity conditions combined with a long enough growing season for blister rust to more effectively complete its life cycle [14,41]. Basidiospores require high humidity during late summer to successfully infect pine trees [34]. The importance of spring radiation and summer heat is consistent with findings by Larson [38] and Campbell and Antos [14], and it likely reveals that blister rust is better able to complete its life-cycle in areas where spring radiation extends the short growing season in high elevation habitats in the northern range of whitebark pine. While tree infection indicates that the conditions are suitable for blister rust to complete its life cycle throughout our study area, seedling infection indicates the most suitable locations for the growth and spread of blister rust.
Consistent with Campbell and Antos [14] and Zeglen [13], mountain pine beetle was not a significant cause of mortality for whitebark pine. However, mountain pine beetle outbreaks have historically occurred throughout the mountain parks [42,43]. For example, Kootenay, Yoho, and Banff had outbreaks in the 1930–40’s and Waterton Lakes followed with outbreaks in 1978–1981, with Jasper National Park currently experiencing a marked increase in mountain pine beetle attacked lodgepole pine trees with anticipated increased mortality rates in whitebark pine. Stand assessments conducted in 2016 and 2017 to identify putatively resistant trees in Jasper National Park documented mountain pine beetle colonization of large diameter whitebark pine trees in three widely distributed stands. Stand assessments in Glacier National Park from 2015–17 indicated that mortality due to mountain pine beetle averaged 5%, while live tree mountain pine beetle attack averaged 3.4% across twelve distinct stands. Protecting candidate trees using verbenone and green-leaf volatile compounds [44] is standard practice throughout the study area at locations with a high risk of mountain pine beetle infestation. These protective measures are also being applied in other mountain parks with observed mountain pine beetle attack.

4.2. Regeneration Relationships

Consistent with Zeglen [13], who sampled whitebark pine stands across its range in BC, regeneration was highly variable in the Canadian Rocky and Columbia Mountains. Regeneration was influenced by topography, time, and large scale climatic variables. The lowest regeneration areas were in two regions: (1) in areas with high blister rust infection; and (2) coincident with areas along the drier east-slopes near Banff National Park, where infection rates are relatively low. Our study found that regeneration was higher on warmer aspects, consistent with other studies [24]. It is likely that seedlings benefit from a longer growing season compared to more northern aspects, combined with the possibility that a seed cache habitat on southerly aspects is available to Clark’s nutcrackers for longer periods due to late snow arrival and early snow melt [24]. In drier whitebark pine stands, it is also likely that heat damage affects survival. Other studies have documented that seedlings are more likely to emerge at warmer sites; however, they are at risk of heat damage and drought and are more abundant at locations with sufficient moisture [38,45,46]. Similar to Gelderman et al. [24], whitebark pine basal area was not important in predicting regeneration. This is in contrast to other studies that observed higher regeneration in stands with a higher whitebark pine basal area [38]. We believe this is, in part, due to the impact of blister rust, which depletes cone production as the disease spreads through the tree and eventually kills the cone producing branches at the top. This effect is indicated by the negative relationship between regeneration and canopy kill in our study. Other studies measure the seed source using distance to cone bearing trees [39], or by counting cones [18,47], and these measures may more effectively quantify the effect of seed source on regeneration. These detailed measurements were outside the scope of this large-scale monitoring study.
It is also possible that competing vegetation explains low seedling counts, particularly in low elevation, mid- to late seral stands that have not experienced recent disturbance. Fire suppression has reduced historic disturbance regimes in whitebark pine stands, favoring later successional forests and driving competition in whitebark pine stands [48]. Our study did not measure competing vegetation, which has been documented to influence the occurrence of whitebark pine seedlings, as whitebark pine is considered moderately shade intolerant [24,49]. We suspect that low whitebark regeneration in south-east BC is the result of the combination of competition with more shade tolerant species and declining seed sources due to blister rust.

4.3. Restoration Implications

Restoration strategies for whitebark pine communities are available [2,8,9,50], and initial restoration efforts have been applied in the Canadian Rockies and Columbia Mountains and include using prescribed fire and mechanical thinning to restore stands, planting putatively rust-resistant seedlings, and protecting rust-resistant trees from mountain pine beetles. Recent wildfires in Banff (Verdant Creek Fire), Waterton Lakes (Kenow Fire), and other areas within this study’s boundaries, emphasize the need to increase our efforts to locate and confirm the rust-resistance of individual whitebark pines. Seed collection from these putative rust-resistant trees is ongoing; however, an increased effort to collect and store seeds in offsite facilities is essential to protect from these natural events. Additionally, increasing use of alternative breeding programs and techniques (e.g., scion collection and grafting) will best protect and provide rust-resistant stock for future conservation programs.
The live tree blister rust infection probability map (Figure 4a), combined with the strong relationship between infection and tree size, indicates a near absence of large uninfected whitebark pine in the southern Canadian Rocky and Columbia Mountains. Planting rust-resistant seedlings should be a high-priority restoration strategy in this part of the study area coupled with enhanced protection of existing healthy stands of whitebark pine in areas under threat of mountain pine beetle outbreaks. The need to plant rust-resistant seedlings where natural regeneration is low is also apparent, particularly in areas along the east slopes and in the highest infection zones where canopy kill rates point to low cone production as a contributing cause of poor regeneration. This study, and others [24,42], indicate that blister rust resistant seedling planting along the drought-prone east-slopes should occur on aspects and in microsites that reduce mortality risk from heat damage. Planting in areas of moderate regeneration in forests where shade-tolerant species outcompete whitebark pine can be combined with mechanical thinning or prescribed fire to open up the forest canopy [24], reduce shade-tolerant competitors, and provide caching habitat for Clark’s nutcracker. These restoration strategies should be combined with information, as it becomes available, about the types and geographic distribution of rust resistance in these areas.
Permanently marked monitoring plots and trees across a large region present an opportunity to examine the trajectory of individual trees and stands over time and in response to forest insects, disease, climate change, and restoration actions. Establishing new permanently marked monitoring plots in recent prescribed and natural burn scars to examine whitebark pine natural regeneration success post-fire would help inform future restoration techniques. Expanding the study area to encompass nearby monitoring sites in BC would increase the range of ecological and climatic conditions in which we could assess trends in blister rust infection, canopy kill, and seedling regeneration. We recommend this be coupled with an evaluation of the current program’s ability to detect change over a set period of time to identify over-sampled areas allowing for a redistribution of plots to achieve a more uniform sampling effort, and ensure we focus needed resources on restoration. Additional efficiencies may be found through the elimination of monitoring variables that do not improve the models depicted above or are highly correlated with related measures, thus allowing for, either the addition of variables that can better inform active restoration programs (e.g., abundance of competitive species; presence of ectomycorrhizal fungi [51]), and/or the saving of time in the field better used for additional plots. We also recommend increasing our knowledge of the distribution of whitebark pine in portions of the study area (e.g., Banff and Jasper national parks) using remote sensing, to support restoration [52].

5. Conclusions

Blister rust infection of whitebark pine is highly variable across the Canadian Rocky and Columbia Mountains; however, this study confirms that the conditions required for blister rust infection exist throughout the region. High blister rust infection rates in the southern and western extent of the study area identified priority areas and opportunities for active restoration work. Pockets of low blister rust infection remain along the north-east slopes. Observed natural regeneration is low along the east slopes of the study area and areas where blister rust infection is very high; the latter likely being caused by canopy kill depleting the available seed source.
Infection rate data is currently being used within individual National Parks to target highly infected stands and search for mature whitebark pine trees that may have resistance to blister rust. In order to become more coordinated with this work, Parks Canada is using the Open Standards for the Practice of Conservation (www.http://cmp-openstandards.org/) to create a unified plan for whitebark restoration that includes the input of adjacent jurisdictions. Additionally, land managers in this region are working with the Crown Managers Partnership (http://crownmanagers.org/) to increase restoration efforts in the southern-most portion of the study area. This study mapped infection, seedling regeneration, canopy kill, and mortality with the aim to provide the tools for land managers to work across protected areas, and provincial and national boundaries, to prioritize areas and methods for restoration.

Acknowledgments

Many thanks go to our 2014 field assistants: Genoa Alger, Kenley Bzdel, Luiz Drummond, Evan Esch, Marielle Harper, Michael Oliveira, and Kathryn Walpole, and all of the field assistants in the previous years who surveyed our whitebark plots. Marge Meijer with Alberta Environment and Parks provided data and supported logistics in 2014. We recognize Joyce Gould’s work that established many of the plots in Alberta Parks. Thank you to Peter Achuff who assisted in training our crews and to Adam Collingwood for essential mapping for field work. We thank private landowners who allowed access to their land to conduct monitoring. Data collection was jointly funded by Parks Canada and Alberta Environment and Parks. We appreciate Genoa Alger’s valuable comments on the manuscript. Finally, thank you to the anonymous reviewers whose suggestions significantly improved our manuscript.

Author Contributions

Cyndi Smith designed the monitoring program and conducted field measurements for the first two time periods. Brenda Shepherd, Brad Jones, Robert Sissons, Jed Cochrane, and Jane Park managed the data collection, and completed quality control on the data. Brenda Shepherd analyzed the data and created the maps based on regression models. Brenda Shepherd, Robert Sissons, Brad Jones, Jed Cochrane, Jane Park, and Natalie Stafl wrote the paper.

Conflicts of Interest

The authors declare no conflict of interest.

References

  1. Committee on the Status of Endangered Wildlife in Canada. COSEWIC Assessment and Status Report on the Whitebark Pine (Pinus albicaulis) in Canada-2010; Committee on the Status of Endangered Wildlife in Canada: Ottawa, ON, Canada, 2010. [Google Scholar]
  2. Keane, R.E.; Holsinger, L.M.; Mahalovich, M.F.; Tomback, D.F. Restoring Whitebark Pine Ecosystems in the Face of Climate Change; US Department of Agriculture, Forest Service, Rocky Mountain Research Station: Fort Collins, CO, USA, 2017.
  3. Tomback, D.F.; Kendall, K.C. Biodiversity losses: The downward spiral. In Whitebark Pine Communities: Ecology and Restoration; Tomback, D.F., Arno, S.F., Keane, R.E., Eds.; Island Press: Washington, DC, USA, 2001; pp. 243–262. [Google Scholar]
  4. Tomback, D.F.; Arno, S.F.; Keane, R.E. Whitebark Pine Communities: Ecology and Restoration; Island Press: Washington, DC, USA, 2001. [Google Scholar]
  5. Tomback, D.F.; Chipman, K.G.; Resler, L.M.; Smith-McKenna, E.K.; Smith, C.M. Relative abundance and functional role of whitebark pine at treeline in the Northern Rocky Mountains. Arct. Antarct. Alpine Res. 2014, 46, 407–418. [Google Scholar] [CrossRef]
  6. Tomback, D.F.; Achuff, P. Blister rust and western forest biodiversity: Ecology, values and outlook for white pines. For. Pathol. 2010, 40, 186–225. [Google Scholar] [CrossRef]
  7. Smith-McKenna, E.K.; Malanson, G.P.; Resler, L.M.; Carstensen, L.W.; Prisley, S.P.; Tomback, D.F. Cascading effects of feedbacks, disease, and climate change on alpine treeline dynamics. Environ. Model. Softw. 2014, 62, 85–96. [Google Scholar] [CrossRef]
  8. Environment and Climate Change Canada. Recovery Strategy for the Whitebark Pine (Pinus albicus) in Canada [Proposed]; Environment and Climate Change Canada: Ottawa, ON, Canada, 2017. [Google Scholar]
  9. Keane, R.E.; Tomback, D.F.; Aubry, C.A.; Bower, A.D.; Campbell, E.M.; Cripps, C.L.; Jenkins, M.B.; Mahalovich, M.F.; Manning, M.; McKinney, S.T.; et al. A Range-Wide Restoration Strategy for Whitebark Pine (Pinus albicaulis); US Department of Agriculture, Forest Service, Rocky Mountain Research Station: Fort Collins, CO, USA, 2012. [Google Scholar]
  10. Alberta Whitebark Pine Recovery Team. Alberta Whitebark Pine Recovery Team. Alberta Whitebark Pine Recovery Plan 2012/2013–2017/2018. In Alberta Recovery Plan No. 34; Alberta Whitebark Pine Recovery Team: Edmonton, AB, USA, 2012; p. 44. [Google Scholar]
  11. Smith, C.M.; Shepherd, B.; Gillies, C.; Stuart-Smith, J. Changes in blister rust infection and mortality in whitebark pine over time. Can. J. For. Res. 2012, 43, 90–96. [Google Scholar] [CrossRef]
  12. Smith, C.M.; Wilson, B.; Rasheed, S.; Walker, R.C.; Carolin, T.; Shepherd, B. Whitebark pine and white pine blister rust in the Rocky Mountains of Canada and northern Montana. Can. J. For. Res. 2008, 38, 982–995. [Google Scholar] [CrossRef]
  13. Zeglen, S. Whitebark pine and white pine blister rust in British Columbia, Canada. Can. J. For. Res. 2002, 32, 1265–1274. [Google Scholar] [CrossRef]
  14. Campbell, E.M.; Antos, J.A. Distribution and severity of white pine blister rust and mountain pine beetle on whitebark pine in British Columbia. Can. J. For. Res. 2000, 30, 1051–1059. [Google Scholar] [CrossRef]
  15. Cooke, B.J.; Carroll, A.L. Predicting the risk of mountain pine beetle spread to eastern pine forests: Considering uncertainty in uncertain times. For. Ecol. Manag. 2017, 396, 11–25. [Google Scholar] [CrossRef]
  16. Kendall, K.C.; Keane, R.E. Whitebark pine decline: Infection, mortality, and population trends. In Whitebark Pine Communities: Ecology and Restoration; Tomback, D.F., Arno, S.F., Keane, R.E., Eds.; Island Press: Washington, DC, USA, 2001; pp. 221–242. [Google Scholar]
  17. Six, D.L.; Adams, J. White pine blister rust severity and selection of individual whitebark pine by the mountain pine beetle (Coleoptera: Curculionidae, Scolytinae). J. Entomol. Sci. 2007, 42, 345–353. [Google Scholar] [CrossRef]
  18. Barringer, L.E.; Tomback, D.F.; Wunder, M.B.; McKinney, S.T. Whitebark Pine Stand Condition, Tree Abundance, and Cone Production as Predictors of Visitation by Clark’s Nutcracker. PLoS ONE 2012, 7, e37663. [Google Scholar] [CrossRef] [PubMed]
  19. Tomback, D.F.; Keane, R.E.; McCaughey, W.W.; Smith, C.M. Methods for Surveying and Monitoring Whitebark Pine for Blister Rust Infection and Damage. Whitebark Pine Ecosystem Foundation: Missoula, Mont. Available online: whitebarkfound.org/monitoring.html (accessed on 8 December 2006).
  20. Hoff, R.J. How to Recognize Blister Rust Infection on Whitebark Pine; US Department of Agriculture, Forest Service, Rocky Mountain Research Station: Fort Collins, CO, USA, 1992; pp. 1–8.
  21. Larson, E.R. Influences of the biophysical environment on blister rust and mountain pine beetle, and their interactions, in whitebark pine forests. J. Biogeogr. 2011, 38, 453–470. [Google Scholar] [CrossRef]
  22. Smith-Mckenna, E.K.; Resler, L.M.; Tomback, D.F.; Zhang, H.; Malanson, G.P. Topographic influences on the distribution of white pine blister rust in Pinus albicaulis treeline communities. Ecoscience 2013, 20, 215–229. [Google Scholar] [CrossRef]
  23. Smith, C.M.; Langor, D.W.; Myrholm, C.; Weber, J.; Gillies, C.; Stuart-Smith, J. Changes in white pine blister rust infection and mortality in limber pine over time. Can. J. For. Res. 2013, 43, 919–928. [Google Scholar] [CrossRef]
  24. Gelderman, M.S.; Macdonald, S.E.; Gould, A.J. Regeneration niche of whitebark pine in the Canadian Rocky Mountains: The basis to restoring an endangered species. Arct. Antarct. Alpine Res. 2016, 48, 279–292. [Google Scholar] [CrossRef]
  25. Wang, T.; Hamann, A.; Spittlehouse, D.; Carroll, C. Locally downscaled and spatially customizable climate data for historical and future periods for North America. PLoS ONE 2016, 11, e0156720. [Google Scholar] [CrossRef] [PubMed]
  26. National Geographic, Esri, DeLorme, NAVTEQ, UNEP-WCMC, USGS, NASA, ESA, METI, NRCAN, GEBCO, NOAA, iPC. 2011. National Geographic World Map, Digital Topographic Basemap of the World. Available online: http://www.arcgis.com/home/item.html?id=b9b1b422198944fbbd5250b3241691b6 (accessed on 13 March 2018).
  27. R Development Core Team. R: A Language and Environment for Statistical Computing; R Foundation for Statistical Computing: Vienna, Austria, 2011. [Google Scholar]
  28. Zuur, A.F.; Ieno, E.N.; Elphick, C.S. A protocol for data exploration to avoid common statistical problems. Methods Ecol. Evol. 2010, 1, 3–14. [Google Scholar] [CrossRef]
  29. Burnham, K.; Anderson, D.R. Model Selection and Inference: A Practical Information-Theoretic Approach; Springer: New York, NY, USA, 1998. [Google Scholar]
  30. Franklin, J. Mapping Species Distributions: Spatial Inference and Prediction; Cambridge University Press: Cambridge, UK, 2010. [Google Scholar]
  31. Pearce, J.; Ferrier, S. Evaluating the predictive performance of habitat models developed using logistic regression. Ecol. Model. 2000, 133, 225–245. [Google Scholar] [CrossRef]
  32. McKinney, S.T.; Tomback, D.F. The influence of white pine blister rust on seed dispersal in whitebark pine. Can. J. For. Res. 2007, 37, 1044–1057. [Google Scholar] [CrossRef]
  33. Marshall, S.J.; White, E.C.; Demuth, M.N.; Bolch, T.; Wheate, R.; Menounos, B.; Beedle, M.J.; Shea, J.M. Glacier water resources on the eastern slopes of the Canadian Rocky Mountains. Can. Water Resour. J. 2011, 36, 109–134. [Google Scholar] [CrossRef]
  34. McDonald, G.I.; Hoff, R.J. Blister rust: An introduced plague. In Whitebark Pine Communities: Ecology and Restoration; Tomback, D.F., Arno, S.F., Keane, R.E., Eds.; Island Press: Washington, DC, USA, 2001; pp. 193–220. [Google Scholar]
  35. Van Arsdel, E.; Riker, A.; Patton, R. The effects of temperature and moisture on the spread of white pine blister rust. Phytopathology 1956, 46, 307–318. [Google Scholar]
  36. McDonald, G.I.; Hoff, R.J.; Wykoff, W.R. Computer Simulation of White Pine Blister Rust Epidemics; US Department of Agriculture, Forest Service, Rocky Mountain Research Station: Fort Collins, CO, USA, 1981.
  37. Spector, D.A. The Influence of Forest Structure on Cone Production in Whitebark Pine throughout the Greater Yellowstone Ecosystem; Montana State University-Bozeman, College of Letters & Science: Bozeman, MT, USA, 1999. [Google Scholar]
  38. Larson, E.R.; Kipfmueller, K.F. Patterns in whitebark pine regeneration and their relationships to biophysical site characteristics in southwest Montana, central Idaho, and Oregon, USA. Can. J. For. Res. 2010, 40, 476–487. [Google Scholar] [CrossRef]
  39. Tomback, D.F.; Clary, J.K.; Koehler, J.; Hoff, R.J.; Arno, S.F. The effects of blister rust on post-fire regeneration of whitebark pine: The Sundance Burn of northern Idaho (USA). Conserv. Biol. 1995, 9, 654–664. [Google Scholar] [CrossRef]
  40. Cleaver, C.M.; Jacobi, W.R.; Burns, K.S.; Means, R.E. Limber Pine Regeneration and White Pine Blister Rust in the Central and Southern Rocky Mountains. For. Sci. 2017, 63, 151–164. [Google Scholar] [CrossRef]
  41. Mulvey, R.; Hansen, E. Castilleja and Pedicularis confirmed as telial hosts for Cronartium ribicola in whitebark pine ecosystems of Oregon and Washington. For. Pathol. 2011, 41, 453–463. [Google Scholar] [CrossRef]
  42. Wong, C.M.; Daniels, L.D. Novel forest decline triggered by multiple interactions among climate, an introduced pathogen and bark beetles. Glob. Chang. Biol. 2017, 23, 1926–1941. [Google Scholar] [CrossRef] [PubMed]
  43. Dykstra, P.; Braumandl, T.F. Historic Influence of the Mountain Pine Beetle on Stand Dynamics in Canada's Rocky Mountain Parks; Natural Resources Canada: Victoria, BC, Canada, 2006. [Google Scholar]
  44. Perkins, D.L.; Jorgensen, C.L.; Rinella, M.J. Verbenone decreases whitebark pine mortality throughout a mountain pine beetle outbreak. For. Sci. 2015, 61, 747–752. [Google Scholar] [CrossRef]
  45. Moody, R.J. Post-Fire Regeneration and Survival of Whitebark Pine (Pinus albicaulis Engelm.); University of British Columbia: Vancouver, BC, Canada, 2006. [Google Scholar]
  46. McCaughey, W.W.; Tomback, D.F. The natural regeneration process. In Whitebark Pine Communities: Ecology and Restoration; Island Press: Washington, DC, USA, 2001. [Google Scholar]
  47. Tomback, D.F.; Anderies, A.J.; Carsey, K.S.; Powell, M.L.; Mellmann-Brown, S. Delayed seed germination in whitebark pine and regeneration patterns following the Yellowstone fires. Ecology 2001, 82, 2587–2600. [Google Scholar] [CrossRef]
  48. Keane, R.E.; Ryan, K.C.; Veblen, T.T.; Allen, C.D.; Logan, J.A.; Hawkes, B.; Barron, J. Cascading Effects of Fire Exclusion in the Rocky Mountain Ecosystems: A Literature Review; Department of Agriculture, Forest Service, Rocky Mountain Research Station: Fort Collins, CO, USA, 2002; p. 24.
  49. Keane, R.E. Successional dynamics: Modeling an anthropogenic threat. In Whitebark Pine Communities: Ecology and Restoration; Island Press: Washington, DC, USA, 2001; pp. 159–192. [Google Scholar]
  50. Pigott, D.; Moody, R.; Clason, A. Promoting Whitebark Pine Recovery in British Columbia; Society for Ecosystem Restoration: Washington, DC, USA, 2015; p. 108. [Google Scholar]
  51. Cripps, C.L.; Antibus, R.K. Native ectomycorrhizal fungi of limber and whitebark pine: Necessary for forest sustainability. In Proceedings of the The Future of High-Elevation, Five-Needle White Pines in Western North America: High Five Symposium, Fort Collins, CO, USA, 28–30 June 2010; USDA Forest Service, Rocky Mountain Research Station: Fort Collins, CO, USA, 2011. [Google Scholar]
  52. McDermid, G.; Smith, I. Mapping the distribution of whitebark pine (Pinus albicaulis) in Waterton Lakes National Park using logistic regression and classification tree analysis. Can. J. Remote Sens. 2008, 34, 356–366. [Google Scholar] [CrossRef]
Figure 1. Whitebark pine study sites. The inset map shows the study area map location in red [26].
Forests 09 00138 g001
Figure 2. Incidence of white pine blister rust for live trees and whitebark pine mortality for the plots that were visited three times, approximately every five years between 2003 and 2014. Number of plots = 135.
Forests 09 00138 g002
Figure 3. Fitted estimates of live tree infection by blister rust as a function of (a) visit for southern latitude (red) and mid-latitude (blue) locations in the study area and (b) tree diameter. Plots were constructed using the range of values for visit and latitude values for a southern and mid-latitude position for plot (a) and tree diameter for (b) while holding remaining predictor variables at their mean values for the study area. Confidence intervals (alpha = 0.05) are shown.
Forests 09 00138 g003
Figure 4. Predicted probability of blister rust infection for a 10 cm DBH tree (a) and predicted probability of mortality (b). Maps are based on predictions for 2014 using quantile classification with 10 bins of predictions for trees nested in plots. Areas below 1579 m were clipped from the map consistent with our lowest elevation study plots.
Forests 09 00138 g004
Figure 5. Fitted estimates of tree mortality by all causes as a function of visit (a) and latitude (b) from the optimal tree mortality model. Plots were constructed using the range of values for visit (a) and latitude (b) while holding remaining predictor variables at their mean values for the study area. Confidence intervals (alpha = 0.05) are shown.
Forests 09 00138 g005
Figure 6. Fitted estimates of canopy kill by all causes as a function of visit (a) and latitude by year (b) from the optimal tree mortality model. Plots were constructed using the range of values for visit (a) and latitude by year (b) while holding remaining predictor variables at their mean values for the study area. Confidence intervals (alpha = 0.05) are shown.
Forests 09 00138 g006
Figure 7. Predicted probability of canopy kill. This map was based on predictions for 2014 using quantile classification with 10 bins of predictions for trees nested in plots. Areas below 1579 m were clipped from the map consistent with our lowest elevation study plots.
Forests 09 00138 g007
Figure 8. Probability of seedling infection by white pine blister rust for short (<50 cm) and tall (>50 cm) seedlings by year (a) and latitude (b). Plots were constructed using the range of values for visit (a) and latitude (b) while holding remaining predictor variables at their mean values for the study area. Confidence intervals (alpha = 0.05) are shown.
Forests 09 00138 g008
Figure 9. Predicted probability of infection for tall seedlings (greater than 50 cm) (a) and predicted whitebark natural regeneration (counts of seedlings/500 m2) for plots on south-west aspects based on the average plot-level canopy kill of 20% (b). Maps were based on predictions for 2014 using quantile classification with 10 bins of predictions for trees nested in plots. Areas below 1579 m were clipped from the map consistent with our lowest elevation study plots.
Forests 09 00138 g009
Figure 10. Seedling regeneration (counts) by latitude (a) and average canopy kill per plot (b) in 2014, estimated by holding other predictor variables at their mean values for a 500 m2 plot.
Forests 09 00138 g010
Table 1. Predictor and response variables.
Date Source 1VariableDescriptionVariable Type
FieldVisitVisit 1, 2, 3 (2003–2007, 2008–2012, 2014)Predictor
GISDivide Distance to divide (km)Predictor
FieldLatitudeLatitude (°)Predictor
Field and GISElevationElevation (m)Predictor
Field and GISSlopeSlope (0–90°)Predictor
FieldAspectAzimuth converted (0–1) Predictor
FieldDBHTree diameter at breast height (cm) 2 Predictor
ClimateWNASHMSummer heat moisture index Predictor
ClimateWNAbFFPDay frost-free period begins (day of year)Predictor
ClimateWNADD5 Degree days above 5 °C 3Predictor
ClimateWNAMWMT Mean warmest month temperature (°C)Predictor
ClimateWNARad_spSpring solar radiation (MJ m−2 day−1)Predictor
ClimateWNAPAS_spSpring snow (mm)Predictor
ClimateWNAPPT_spSpring precipitation (mm)Predictor
FieldBasal area Basal area of whitebark pine (m2/ha)Predictor
FieldHeight classSeedling height class (short ≤ 50 cm, tall > 50 cm)Predictor
FieldPlotPlot ID Random effect
GISLocationLocation ID for plotsRandom effect
FieldDisease Live tree status (0 = WPBR absent, 1 = WPBR present)Response
FieldMortality Tree status (0 = dead, 1 = live)Response
FieldCanopy KillMean proportion of canopy kill by plotResponse
FieldRegeneration Seedling count by plotResponse
1 Variables were obtained from measurements taken in the field (field), geographic information systems (GIS), and a climate model for western North America (ClimateWNA) [25]. 2 Measured 1.3 m above the ground on the uphill side. 3 Measured by accumulating the number of temperature degrees above 5 °C each day. Warmer than normal days increase plant growth and days at or below 5 °C do not contribute to DD5.
Table 2. Summary of final generalized linear mixed models predicting live tree infection, tree mortality, seedling infection, canopy kill, and regeneration. All continuous variables were standardized prior to analysis. Table 1 describes all predictor and response variables.
Model and Fixed EffectsCoefficientsStandard Errorp Value
Live Tree Infection
Latitude−0.36330.13720.0081 **
Divide−1.04620.1916<0.0001 ***
Divide2−0.31380.10910.0040 **
Visit 20.54190.0495<0.0001 ***
Visit 30.99900.0496<0.0001 ***
DD50.90100.1298<0.0001 ***
DBH0.85320.0266<0.0001 ***
Tree Mortality
Latitude−0.65100.1398<0.0001 ***
Latitude20.44940.14740.0023 **
Divide−0.91490.1667<0.0001 ***
Divide2−0.28630.09530.0026 **
Visit 20.58600.0525<0.0001 ***
Visit 30.85890.0526<0.0001 ***
DD50.32600.14860.0282 *
Seedling Infection
Latitude−0.81500.1160<0.0001 ***
Latitude20.32690.11530.0046 **
Divide−0.33420.11530.0037 **
Visit 2−0.21030.07540.0053 **
Visit 30.37150.0740<0.0001 ***
Rad_sp0.24470.12350.0476 *
Height class1.38100.0647<0.0001 ***
Canopy Kill
Latitude0.01860.06560.7760
Visit 20.04050.04880.4070
Visit 30.77660.0471<0.0001 ***
Divide−0.41690.0823<0.0001 ***
Divide2−0.13190.05640.0190 *
DD50.30590.0599<0.0001 ***
DD520.10820.04470.0150 *
Latitude at Visit 2−0.20400.0472<0.0001 ***
Latitude at Visit 3−0.41540.0477<0.0001 ***
Regeneration
Latitude−0.14220.10940.1937
Latitude20.33980.10510.0012 **
Divide−0.25700.11200.0217 *
Visit 20.01880.05030.7082
Visit 30.23590.06240.0002 ***
Aspect0.22710.09140.0130 *
DD5−0.33180.12700.0090 **
DD52 −0.18180.07180.0113 *
Canopy kill−0.13420.04580.0034 **
* p value significant at 0.05; ** p value significant at 0.01; *** p value significant at 0.001.

