Article

Factors Affecting Natural Regeneration of Tropical Forests across a Precipitation Gradient in Myanmar

Department of Environmental Horticulture, University of Seoul, Seoul 02504, Korea
*
Author to whom correspondence should be addressed.
Forests 2018, 9(3), 143; https://doi.org/10.3390/f9030143
Submission received: 15 January 2018 / Revised: 12 February 2018 / Accepted: 13 March 2018 / Published: 15 March 2018
(This article belongs to the Section Forest Ecology and Management)

Abstract

:
Natural regeneration is an essential component of forest dynamics and the recovery of ecosystem functions. Therefore, understanding regeneration status, and how abiotic and biotic factors affect it, is important for ecological studies. This study discovered different regeneration statuses of tropical forests in response to differences in rainfall in Myanmar, and the environmental and overstory factors that had the most influence on understory regeneration. Study sites were set up in regions with 625 to 2035 mm of annual rainfall, and ecological characteristics were measured. According to the results, natural regeneration increased with rainfall, showing a good regeneration status at all sites. Forests within a range of 1411–2035 mm of annual rainfall had a significantly higher density and species diversity at specific natural regeneration stages than those with 625–1029 mm. Not only abiotic but also overstory structure affected the natural regeneration of forests. However, not all factors influenced natural regeneration status. Overstory size distribution parameters did not show a significant influence on natural regeneration. Average annual rainfall (abiotic), as well as ecosystem complexity, density, species richness, and diversity (overstory), were found to be the most influential factors for the density and diversity of natural regeneration. The results of this study will support silviculture and the management of tropical forests.

1. Introduction

Natural regeneration is a key component for securing the sustainability of forests and forest dynamics [1,2,3] because it has the potential for the development of future generations, the storage of carbon, and it leads to the recovery of the ecosystem functions [4,5,6]. The research conducted in sub-tropical forests of India showed that an absence or a small number of seedlings and saplings of tree species in a forest stand indicates poor regeneration; on the other hand, a greater number of seedlings and saplings shows successful regeneration [7]. The maintenance of a forest stand with sufficient regeneration is the main target in conservation ecology [2].
Natural regeneration has also been used as a tool in the implementation of large-scale restoration programs in degraded forest areas [8,9], especially in the tropical regions [10,11]. When we consider species distribution and the diversity of forests in tropical ecology, natural regeneration should also be included in the assessment because it can help us to envisage the upcoming forest stand. Therefore, understanding the mechanism and nature of natural regeneration facilitates the enhancement of natural regeneration, as well as the changes in future forest structure [12].
Natural regeneration could be affected by both abiotic (environment) and biotic (overstory structure) factors [1,2], and securing a sufficient regeneration of a forest is a great challenge in forest management. A reduction in precipitation, especially drought, can limit the regeneration potential and composition of plants because almost all species are very susceptible to environmental factors at the seedling stages [8,13,14]. Osem et al. [12] reported that species composition at regeneration stages varied in regions with an annual rainfall of 300 to 900 mm. Mok et al. [15] also estimated, by simulation analysis, that species diversity and composition at the regeneration stage could change in upcoming decades due to an increase in temperature and decrease in precipitation. On the other hand, changes in overstory structure, such as species distribution and canopy cover, could directly affect the diversity [2], survivorship [16,17,18,19], and composition [20,21] of natural regeneration of some species. Therefore, monitoring the changes in natural regeneration in response to different overstory structures and climatic regions has been essential in ecological studies.
Only a few studies have focused on natural regeneration ecology. Among them, some studies have addressed the effect of overstory structure on natural regeneration at relatively small scales in Acadian forests [22], disturbed forests [23], and Amazonian forests [24]. Although the factors driving the structure and composition of natural regeneration have been studied by modeling approaches [9], there is also no convincing evidence to date relating to which overstory factors have a stronger relationship with natural regeneration than others, especially in Asian regions. Beside this, the regeneration-rainfall gradient hypothesis has—to our knowledge—only been tested in a few studies. The way in which abiotic and biotic factors affect the structure and composition of natural regeneration by actual field surveys is still not well understood [25,26].
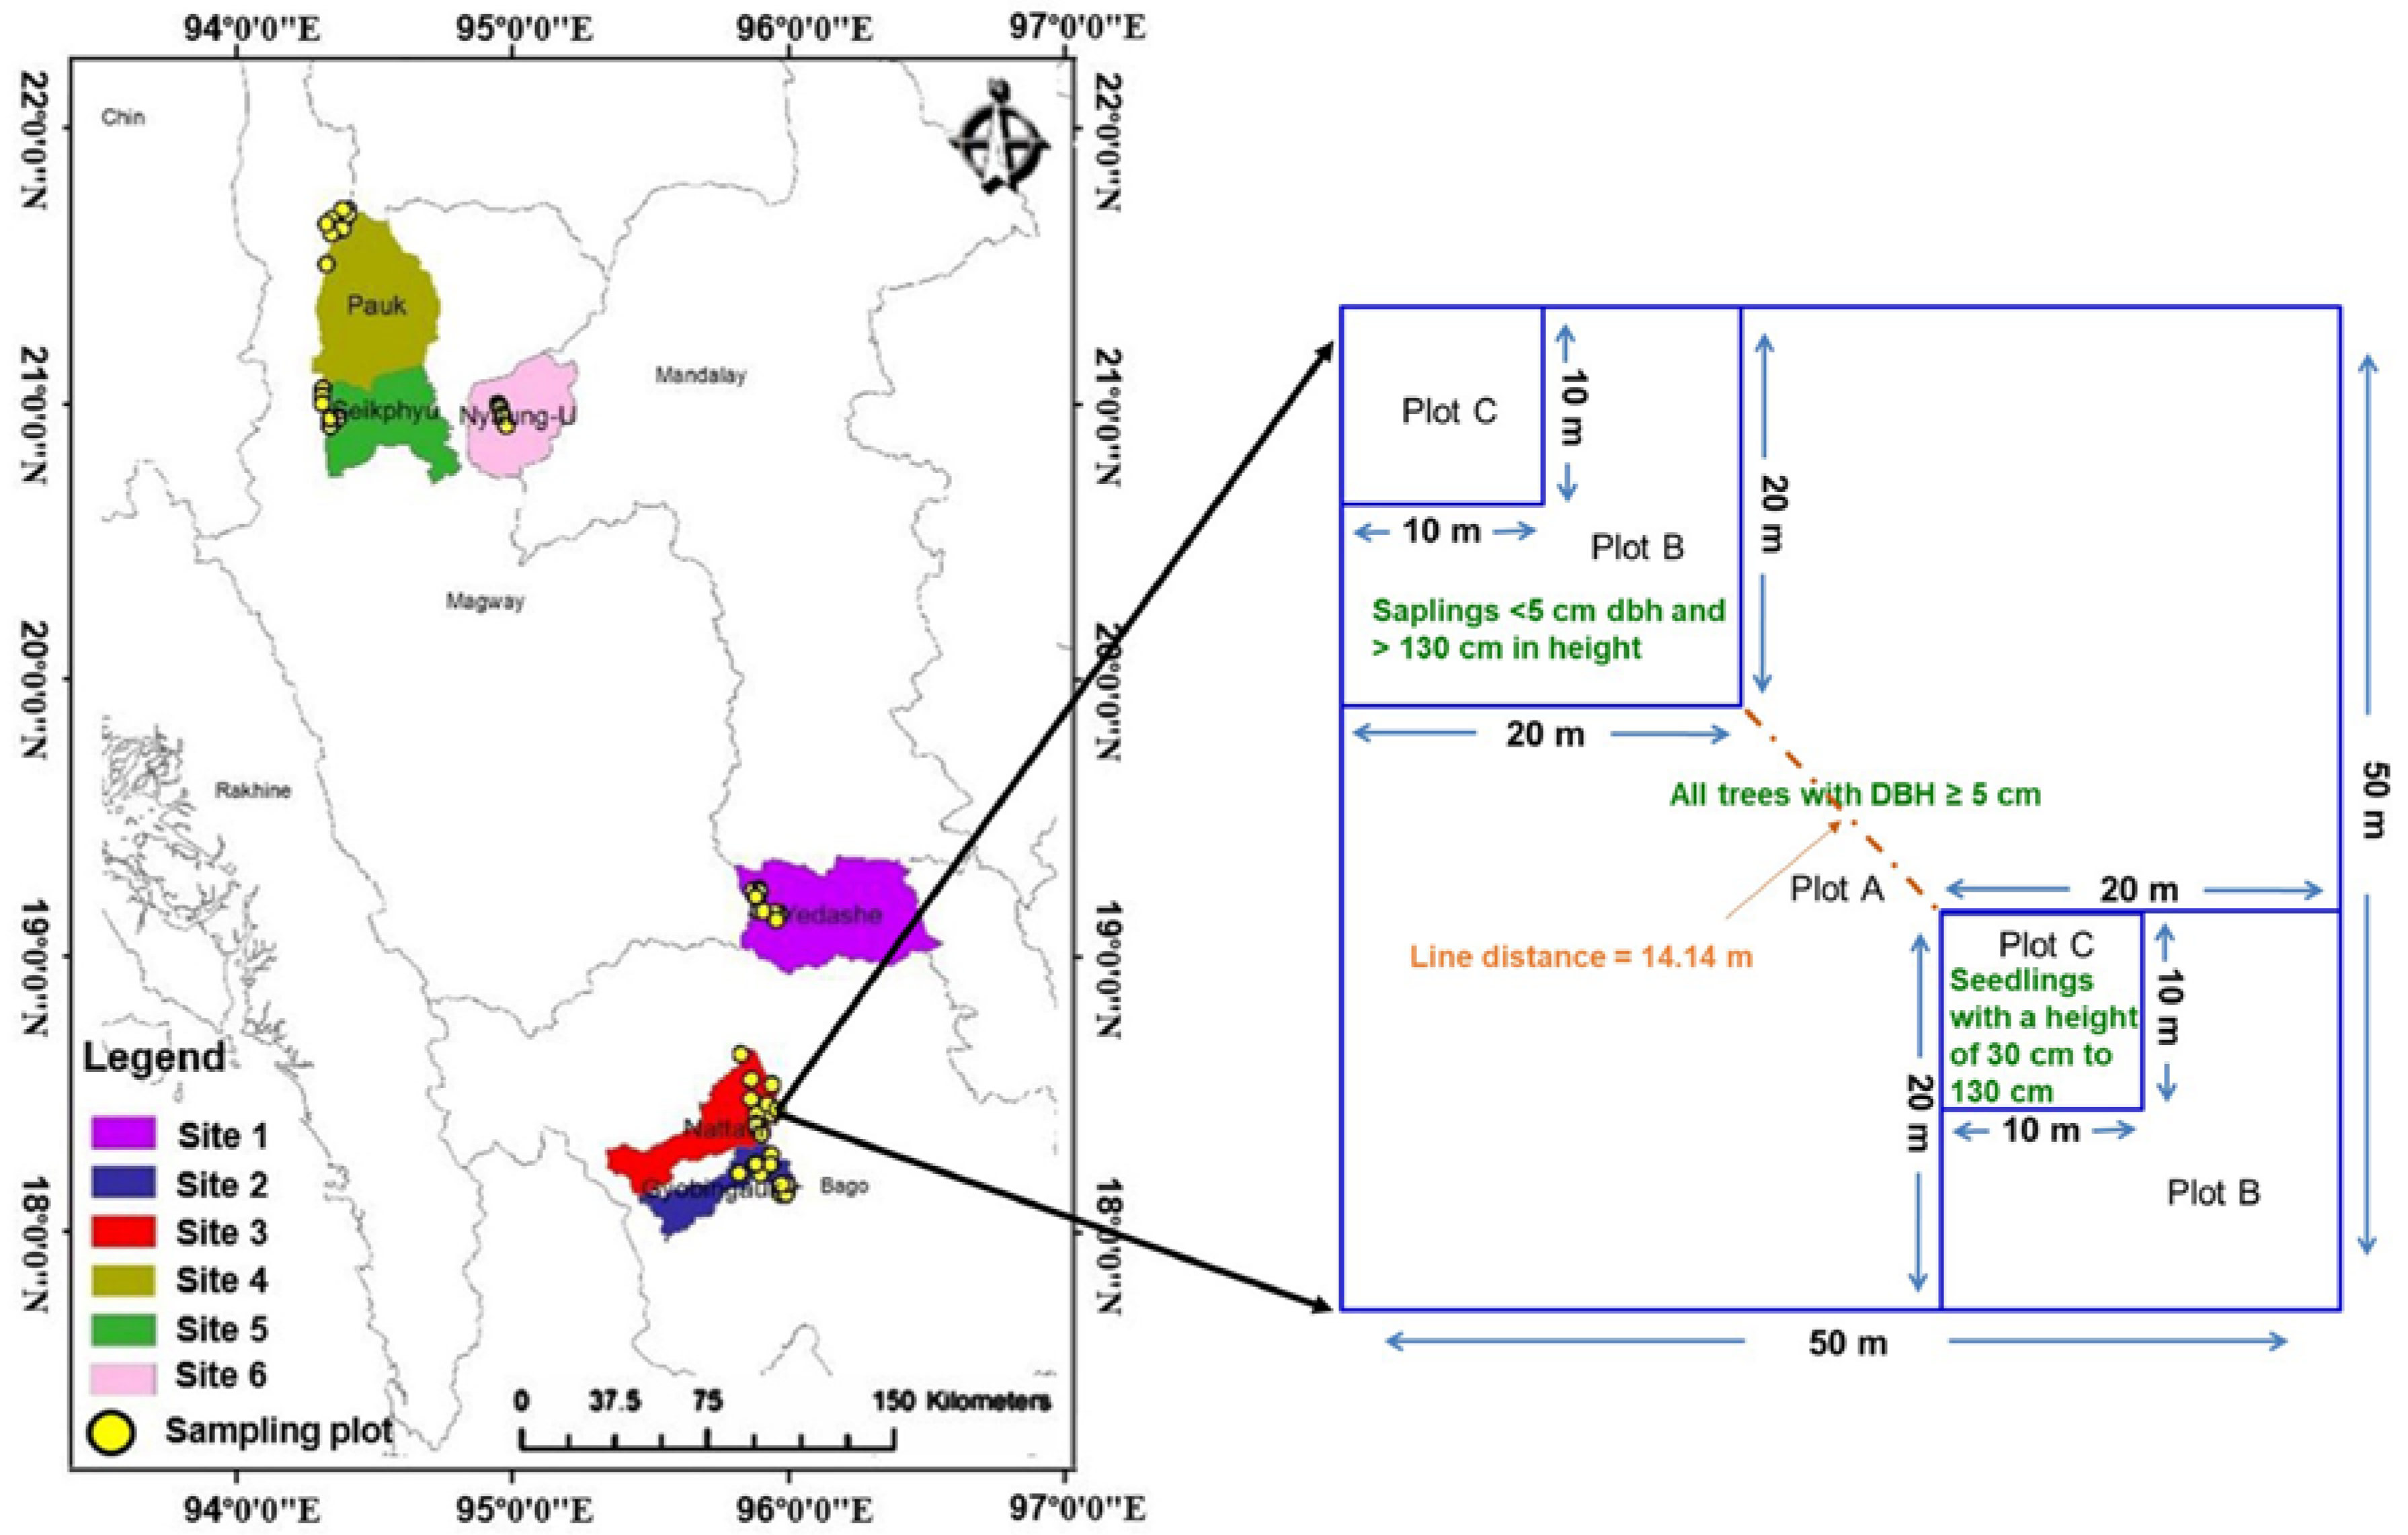
This study focused on cause-and-effect relationships between environmental factors and natural regeneration, and those between overstory structure and natural regeneration of tropical forests in Myanmar. So, the research questions were set up as: (1) Do species diversity, richness, density, and status of natural regeneration vary across a precipitation gradient in Myanmar? (2) Do environmental and overstory structural factors affect the status of natural regeneration? and (3) If so, how do these factors vary?
The objectives of the study were:
(1)
To observe the natural regeneration status of tropical forests in Myanmar across a precipitation gradient;
(2)
To extrapolate the effects of the environmental factors and overstory structure on natural regeneration of tropical forests; and
(3)
To identify the most influential environmental and overstory structure factors on natural regeneration of tropical forests.

2. Materials and Methods

2.1. Study Area

Study sites were located in tropical deciduous forests of Myanmar, having an average annual rainfall of 625 to 2035 mm (Figure 1).
The climate of the study sites is a tropical savanna climate. The climatic index of the study sites calculated by De Martonne’s method [27,28,29] was 55.00 in site 1, 43.24 in site 2, 37.93 in site 3, 30.18 in site 4, 23.61 in site 5, and 16.80 in site 6. De Martonne’s method is widely used to quantify aridity [29]. The higher the index value, the lower the aridity found. Generally, a value below 20 was considered arid or semi-arid, and more specifically, the upper limit for semi-arid was defined as 22.5, and for arid, it was set at 7.5 [28,30]. The average annual rainfall of sites 1 to 6 was 2035 mm, 1600 mm, 1411 mm, 1029 mm, 843 mm, and 625 mm, respectively, during 1982–2014 (Department of Meteorology and Hydrology of Myanmar). The soil texture found in the study sites was sandy loam to sandy soil. The climatic variables of the study sites are shown in Table 1.
The forests at sites 1–5 were a heterogeneous forest type, and that at site 6 was a homogeneous forest type. The study sites are protected as ‘reserve forests’. A diversity in species composition, as well as a variety of forest structural patterns, were dispersed for their representative sites. Economically important species were included in the forests, and the forests were managed by the ‘Myanmar selection system’ on a sustainable basis. However, illegal logging of trees and grazing were occurring in some places, and such areas were excluded from the survey for the collection of data. Xylia dolabriformis Benth. was one of the most dominant species at sites 1–5 [31], although it was not found at site 6. The dominant species at site 1 were Xylia dolabriformis, Tectona grandis L.f., Protium serratum (Wall. ex Colebr.) Engl., Mitragyna rotundifolia (Roxb.) Kuntze, and Lagerstroemia tomentosa C. Presl, whereas those at site 2 were X. dolabriformis, Cordia grandis Roxb., M. rotundifolia, Dalbergia cultrate var. cultrata., and Lannea grandis (Dennst.) Engl. At site 3, the dominant species were X. dolabriformis, Terminalia tomentosa Willd., M. rotundifolia, Tectona grandis, and P. serrata. The dominant species at site 4 were X. dolabriformis, Pentacme siamensis (Miq.) Kurz, Terminalia tomentosa, Shorea oblongifolia Thw., and Dipterocarpus tuberculatus Roxb., and those at site 5 were Tectona hamiltoniana Wall., X. dolabriformis, Terminalia oliveri Brandis, T. tomentosa, and Anogeissus acuminate (Roxb. ex Candolle) Guillemin et al. [31]. At site 6, the dominant species were Morinda tinctorial Roxb., Acacia leucophloea (Roxb.) Willd, Rhus paniculate Wall., Terminalia oliveri, and Acacia catechu (L.f.) Willd.

2.2. Sampling Procedures

Plots for the regeneration survey were laid out within the sample plot (50 m × 50 m) in which the overstory structure survey was carried out. The sample plots were established using the stratified random sampling method. The stratification of forests was performed based on the appearance of tree density, coverage, and the occurrence of minor disturbance. Then, the sample plots were placed randomly in each stratum. All trees greater than 5 cm in diameter at breast height (dbh) in the 50 m × 50 m sample plots were recorded as the overstory structure in this study. Some of the overstory structure data were obtained from our former published research, Khaine et al. [31], because the same study sites were used. Within each sample plot (50 m × 50 m), two subsample plots of 20 m × 20 m, i.e., 400 m2 each, were laid out in diagonally opposite corners of the plot (see Plot B in Figure 1). The diagonal distance between the nearest opposite corners of two subsample plots was 14.14 m. In total, the subsample plots covered 0.88 ha (22 plots) in site 1, 0.72 ha (18 plots) in site 2, 0.8 ha (20 plots) in site 3, 0.8 ha (20 plots) in site 4, 0.48 ha (12 plots) in site 5, and 0.48 ha (12 plots) in site 6. Saplings (<5 cm dbh and >130 cm in height) were counted in all the subsample plots. Therefore, a total of 104 plots, covering 4.16 ha, were used for the sapling survey.
For the seedling survey, two sub-subsample plots were set up in diagonally opposite corners of the subsample plot (20 m × 20 m) (see Plot C in Figure 1). The diagonal distance between the nearest opposite corners of two sub-subsample plots was 28.28 m. Each sub-subsample plot covered 100 m2 (10 m × 10 m). Therefore, there were a total of 44 plots covering 0.44 ha in site 1, 36 plots covering 0.36 ha in site 2, 40 plots covering 0.40 ha in each of sites 3 and 4, and 24 plots covering 0.24 ha in each of sites 5 and 6. Seedlings with a height of 30 cm to 130 cm were counted in all sub-subsample plots. A total of 208 plots covering 2.08 ha were used for the seedling survey. The layout of sample plots is shown in Figure 1.

2.3. Data Analysis

Species identification of understory plants (natural regeneration) was done at the Plant Taxonomy and Seed Storage Division, Forest Research Institute of Myanmar. The density and the relative density of understory plants were explored on a hectare basis. Screening of dominant species at the natural regeneration stage was undertaken, based on the abundance of each species at each study site.
The Jackknife species richness [32], Shannon diversity index [33], and Simpson diversity index [34] of natural regeneration and over-story structure of forests were calculated as follows:
J = R + {(n − 1)/n}k,
where, J = Jackknife species richness, R = total number of species, n = total number of plots, and k = number of unique species.
H’ = Σsi = 1 (Pi)(lnPi),
where, H’ = Shannon’s diversity index, s = number of species in the sample, Pi = proportion of the total sample belonging to the ith species, and ln = natural logarithm.
E (%) = 100 (H’/lnHmax),
where, E = the Shannon evenness index in percentage, H’ = Shannon’s diversity index, and Hmax = the number of total species.
D = Σsi = 1 {ni (ni − 1)/N (N − 1)},
where, (1 − D) = Simpson’s index of diversity, ni = number of individuals of species i, s = number of species in the sample, and N = total number of individuals in the sample.
Duncan’s multiple range test (DMRT) in an ANOVA analysis was used for a comparison of sites. Moreover, the transition of seedlings and saplings to mature stages was evaluated for each species, based on the ratio of their composition in a stand; the status of natural regeneration was determined based on these values [7,35], as shown in Table 2.
As shown in the above table, ‘good regeneration’ is defined as the condition in which an ample or adequate number of seedlings and saplings contribute to the mature population, while ‘fair regeneration’ is defined as the condition in which there were a fair number of seedlings, but the percentage of saplings was either lower than or close to that of the mature trees. ‘Poor regeneration’ is the condition in which individuals were found at either the seedling or sapling stage only, in greater numbers than the mature trees. The fourth regeneration status is termed as ‘no regeneration,’ in which a species presented only at the mature stage and did not occur in either seedling or sapling stages. In this study, the regeneration status of a forest was determined based on a total population size of the forest, while the regeneration status of individual species was assessed on a population size of each species in a forest. The goodness of regeneration status could vary among species (taxonomic groups) even though they all showed a similar regeneration status in a forest. The reason for the variation among species is that the composition (density) of individual species in the total population of a forest differs among taxonomic groups. For example, although two species showed good regeneration statuses in a forest, a species which had a higher density than the other species could have a better regeneration potential in a comparison between the two species.
The spatial distribution of natural regeneration was conducted in this study because a complete characterization of regeneration should include a measure of spatial distribution [36,37]. Spatial distribution was computed using the formula used by Loetsch et al. [36] and Kershaw et al. [37]:
I = δ2/µ,
where, I = index of spatial distribution of a forest, δ2 = population variation of the number of individuals per plot, and µ = population mean of the number of individuals per plot.
Three parameters, namely, species diversity, species richness, and density of overstory structure of sites 1–5, were obtained from our previously published research conducted at the same sample plots [31]. These parameters for site 6, and other parameters of overstory structure for all sites, were calculated in this study. Size heterogeneity of forests at each study site was determined by the Gini coefficient [2,38]. Several studies have proved that this coefficient is very relevant for the evaluation of size heterogeneity of forest structure for most ecological questions [2,38,39]:
G = (Σni = 1 Σni = 1 |xixj|)/(2n2µ),
where, G = Gini coefficient, xi = the ith position of individual stems of a forest stand, xj = the (i − 1)th position of individual stems of a forest stand, n = total individuals of a forest stand, and µ = mean stem size of a forest stand.
Size distribution of overstory structure was evaluated by the skewness and kurtosis functions of the representative data (diameter, height, and basal area). The skewness and kurtosis functions have been found to be effective methods for the assessment of size distribution in multi-cohort stands [38,40]; therefore, the shape of the size distributions in this study was assessed using these functions.
SPSS statistical software (Version 24, International Business Machines Corporation (IBM), Armonk, NY, USA, 2016) was applied for all statistical analyses in this study. The effect of climate on natural regeneration was determined using Pearson correlation analysis at a 95% confidence interval. Climatic factors such as average annual rainfall (Avg. R), maximum rainfall (Max. R), average annual temperature (Avg. T), and temperature difference (T dif) were considered as independent variables, and the density per hectare, spatial distribution, and diversity of understory species in forests at all study sites as dependent variables. The correlation between climatic factors and understory structure was analyzed separately for seedlings and saplings. The values of spatial distribution used in the correlation analysis were site-level values.
For the effects of overstory structure parameters on natural regeneration, the most suitable biological factors were selected based on the relationships between response (natural regeneration) and explanatory (overstory) variables by means of Pearson correlation analysis in SPSS software. The overstory biological factors that were taken into consideration as factors influencing the density and richness of natural regeneration were: species richness, density, diversity, size heterogeneity, size distribution, and ecosystem complexity. The density was expressed on a per hectare basis, and the factors used in the correlation analysis were site-level values. Size heterogeneity (Gini coefficient) was determined based on tree diameter. Size distribution was assessed based on tree diameter, height, and basal area. Ecosystem complexity was calculated by the multiplication of the number of species, density, mean height, basal area, and times (2.5 × 10⁻³) in each forest (0.1 ha basis) [41,42]. The response and explanatory variables are shown in Table 3.
A follow-up stepwise regression analysis was applied to investigate the combination effects of overstory structure on natural regeneration. Only the parameters that had a significant correlation with natural regeneration were used in the stepwise analysis. Eleven combinations of structure parameters were tested in this study.

3. Results

3.1. Seedling and Sapling Density

Natural regeneration of forests among study sites varied in density. In a comparison of study sites, both seedlings and saplings at sites 1–3 had significantly higher densities than at sites 4–6 (p < 0.05). Densities of natural regeneration did not vary significantly among forests with 1411 to 2035 mm annual rainfall, whereas there was significant variation among forests with 625 to 1029 mm annual rainfall (95% confidence interval). The average seedling densities at sites 1–3 were 2575, 2536, and 2585 seedlings ha−1, respectively, while the average seedling densities at sites 4–6 were 2097, 1596, and 771 seedlings ha−1, respectively (Table 4). Similar results were found in the case of sapling density. Sapling densities did not show significant differences among sites 1 to 3 (2235, 2261, and 2241 saplings ha−1, respectively), although the difference between sites 4, 5, and 6 was significant (2040, 1440, and 783 saplings ha−1, respectively).
The highest seedling density was found at site 3, while the highest sapling density was found at site 2. Statistically, the seedling and sapling densities of forests in high rainfall regions were approximately three times higher than those of forests with 625 mm of annual rainfall (Figure 2). In addition, seedling densities were higher than sapling densities at the study sites, except at site 6. At site 6, where there was less rainfall, germination and survival at seedling stages may be difficult, but a species that has passed these stages may then be at an advantage and be able to survive in this area. Long-term continuous monitoring of the density of seedlings and saplings is required in each forest type because different ecosystems have functionally different regeneration dynamics, and thus, the canopy replacement in a future forest stand might differ or vary among different precipitation regions, even in a condition where the current regeneration status shows a similar species mixture with a similar density of a forest.

3.2. Species Richness and Diversity

The species richness values for seedling and sapling stages were lower than those for the mature stage at all the study sites and decreased with a decrease in annual rainfall (Table 4). Richness was highest at site 1 (high rainfall region), and the lowest at site 6 (low rainfall region). There were 74, 72, 67, 47, 21, and 17 seedling species at sites 1–6, respectively. At the sapling stage, there were 74, 71, 68, 47, 20, and 17 species at sites 1–6, respectively. Little difference between the number of species in seedling and sapling stages was found.
At seedling and sapling stages, the species diversity of forests differed between sites. Diversity tended to increase with rainfall, showing a significant increase at 1411 mm of annual rainfall (p < 0.05). Shannon and Simpson indices of seedlings ranged from 1.44 to 2.04, and 0.79 to 0.90, respectively, and those of saplings ranged from 1.76 to 2.63, and 0.81 to 0.93, respectively (Table 5). The lowest species diversity at the regeneration stage was found at site 5. The difference between the sites was manifest at the 95% confidence interval.

3.3. Species Composition at Regeneration Stages

The species composition of each forest type varied among the six study sites. For example, the most abundant species of the seedling and sapling layers at site 1 were X. dolabriformis, T. grandis, and P. serrata, whereas the most abundant species at site 2 were X. dolabriformis, D. pentagyna, and C. grandis. At site 3, X. dolabriformis, Terminalia tomentosa, and M. rotundifolia were the most abundant species, and at site 4, Pentacme siamensis, Terminalia tomentosa, and X. dolabriformis were the most abundant species. Whereas, the most abundant species at site 5 were Tectona hamiltoniana, Terminalia tomentosa, and Terminalia oliveri. The most important species at site 6 were completely different from the previous sites; the most abundant species at site 6 were M. tinctoria, A. catechu, and A. leucophloea. Table S1 shows the five most commonly occurring species at the six study sites.

3.4. Status of Natural Regeneration

Regeneration is a key process for the existence of species in a forest stand. The survival of seedlings or saplings determines successful regeneration, which is the single most successful step toward achieving long-term sustainability of forests [7,43,44]. The status of natural regeneration was determined depending on the transition between seedlings, saplings, and matures in each forest. The number of plants generally reduced in the transition from the seedling to sapling stages, and from the sapling to the mature stages, at all sites. Overall, the percentages of natural regeneration reaching mature stages were 7.0%, 7.7%, 6.7%, 7.8%, 7.5%, and 16.8% at sites 1–6, respectively. Thus, good natural regeneration occurred at all study sites, with sites 1 to 5 exhibiting better natural regeneration than site 6; this could also indicate that the proportion of plants in regeneration stages at sites 1–5 was much higher (two times) than at site 6. Table 6 shows the composition of seedlings, saplings, and mature trees of selected species at each study site.
Regeneration varied among species within a forest. As an example, at site 1, some species such as X. dolabriformis Benth., Tectona grandis Linn.f, and Protium serrata (Wall. Ex Colebr.) Engl. had a higher number of individuals at the seedling stage than at the sapling stage (Table 6), although some species such as M. rotundifolia (Roxb.) Kuntze and L. tomentosa C. Presl had a higher number of individuals at the sapling stage than at the seedling stage. Azadirachta indica A. Juss. was only present at the mature stage, and no regeneration of this species was found at site 1, although X. dolabriformis Benth., and Tectona grandis Linn.f displayed good regeneration. The number of seedlings and saplings of X. dolabriformis Benth. was 7.20 and 6.33 times, and the values of Tectona grandis Linn.f were 6.81 and 6.41 times, higher than the number of mature trees, respectively.
At site 2, most of the species exhibited good regeneration (e.g., T. grandis Linn.f, X. dolabriformis Benth., etc.) (Table 6). The number of seedlings and saplings of T. grandis Linn.f was 7.09 and 5.55 times, and those of X. dolabriformis Benth. was 6.86 and 6.21 times, higher than the number of mature trees, respectively. Nevertheless, no regeneration of Rinorea bengalensis (Wall.) Kuntze, as well as poor regeneration of Lagerstroemia parviflora Roxb., occurred at site 2. Lagerstroemia parviflora Roxb. had no saplings, although the number of seedlings was six times higher than the mature trees.
Similarly, some species such as Pittosporum napaulensis DC. (no seedlings and five times higher saplings than the mature) and Cleidion speciflorum Merr. (no saplings and five times higher seedlings than the mature) had poor natural regeneration, while T. grandis Linn.f (10.42 and 7.92 times higher seedlings and saplings, respectively, than the mature) and X. dolabriformis Benth. (6.85 and 6.96 times higher seedlings and saplings, respectively, than the mature) showed a good regeneration pattern at site 3 (Table 6). Likewise, Morinda tinctoria Roxb., Acacia leucophloea (Roxb.) Willd, Rhus paniculata Wall., and Acacia catechu (L.f.) Willd. exhibited good regeneration at site 6, whereas the regeneration of Gardenia obtusifolia Roxb. and Lannea grandis Engl. species did not occur at site 6 (Table 6). At site 6, Morinda tinctoria Roxb., Acacia leucophloea (Roxb.) Willd, Rhus paniculata Wall., and Acacia catechu (L.f.) Willd. had, respectively, 2.49, 4.80, 2.36, and 4.36 times higher seedlings, and 2.98, 3.15, 3.15, and 3.23 times higher saplings, than the mature trees.
In this study, the regeneration status of a forest was determined based on a total population size of the forest, while the regeneration status of individual species was assessed on a population size of each species in a forest. However, the goodness of the regeneration status could vary among species (taxonomic groups) even though they all showed a similar regeneration status in a forest. The reason for the variation among species is that the composition (density) of individual species in the total population of a forest differs among taxonomic groups. For example, although two species showed good regeneration statuses in a forest, a species which had a higher density than the other species could have a better regeneration potential in a comparison between the two species. For example, although both X. dolabriformis Benth., and Protium serrata (Wall. Ex Colebr.) Engl. had a good regeneration status, X. dolabriformis Benth. had a better regeneration potential than Protium serrata (Wall. Ex Colebr.) Engl. because X. dolabriformis Benth. had a higher density or composition than Protium serrata (Wall. Ex Colebr.) Engl. in a forest.

3.5. Spatial Distribution in Natural Regeneration of the Forest

Spatial distribution of natural regeneration at all study sites showed a regular distribution. Table 7 shows the spatial distribution of natural regeneration (seedling and sapling stages) at the study sites. A comparison of the sites showed that regeneration statuses in the seedling layers at sites 3 and 6, and in the sapling layers at site 5, were more clustered than at other sites. The index of spatial distribution at sites 1–6 was 0.05, 0.06, 0.11, 0.08, 0.04, and 0.11 at the seedling layers, and 0.06, 0.09, 0.11, 0.12, 0.25, and 0.07 at the sapling layers, respectively (Table 7).

3.6. Effect of Climate on Natural Regeneration

The seedling and sapling densities were strongly affected by climatic factors such as the average annual rainfall, maximum rainfall, and the temperature difference (p < 0.01). The seedling and sapling densities increased with average annual rainfall and maximum rainfall, indicating positive correlations between density, average annual rainfall, and maximum rainfall. Conversely, densities decreased when the temperature difference increased, showing a negative correlation between density and the temperature difference (Table 8). Diversity was also affected by climatic factors in which average annual rainfall, maximum rainfall, and average annual temperature strongly affected the species diversity of forests (99% confidence interval). Spatial distribution did not show any correlation with climatic factors.

3.7. Overstory Structure Parameters Influencing Natural Regeneration

Among overstory structure parameters, the overstory species richness, density, and ecosystem complexity were strongly correlated with density of natural regeneration, while the overstory density, richness, diversity, and ecosystem complexity were strongly correlated with species richness and diversity of natural regeneration (Table 9).
Parameters such as overstory size heterogeneity and distribution were not strongly correlated with density, richness, and diversity of natural regeneration. Therefore, these parameters should be excluded as predictors for the estimation of natural regeneration.
The combined effects of overstory species richness, density, diversity, and ecosystem complexity on natural regeneration status were clearly seen in this study, although the combined effects of these overstory parameters on natural regeneration of forests varied along with the included parameters (Table 10). Three factors, namely: overstory species richness, density, and ecosystem complexity, were assessed using correlation tests, to identify interaction effects on the density of natural regeneration. Similarly, four factors, including overstory density, richness, diversity, and ecosystem complexity, were assessed using correlation tests, to identify interaction effects on the richness and diversity of natural regeneration.
Among four possible combinations for the density of natural regeneration, two combination effects, overstory density × richness and overstory richness × ecosystem complexity, significantly influenced the density of natural regeneration (Table 10). In the case of species richness and diversity of natural regeneration, the interaction effect of overstory density × richness × diversity × ecosystem complexity was the most influential factor on the richness and diversity of natural regeneration among eleven possible combinations. Both species richness and diversity of natural regeneration were significantly influenced by the combination effects of overstory density, richness, diversity, and ecosystem complexity (Table 10).

4. Discussion

The assessment of natural regeneration plays a vital role in sustainable forest management, because the regeneration stage is very important for the successful establishment of the mature community [
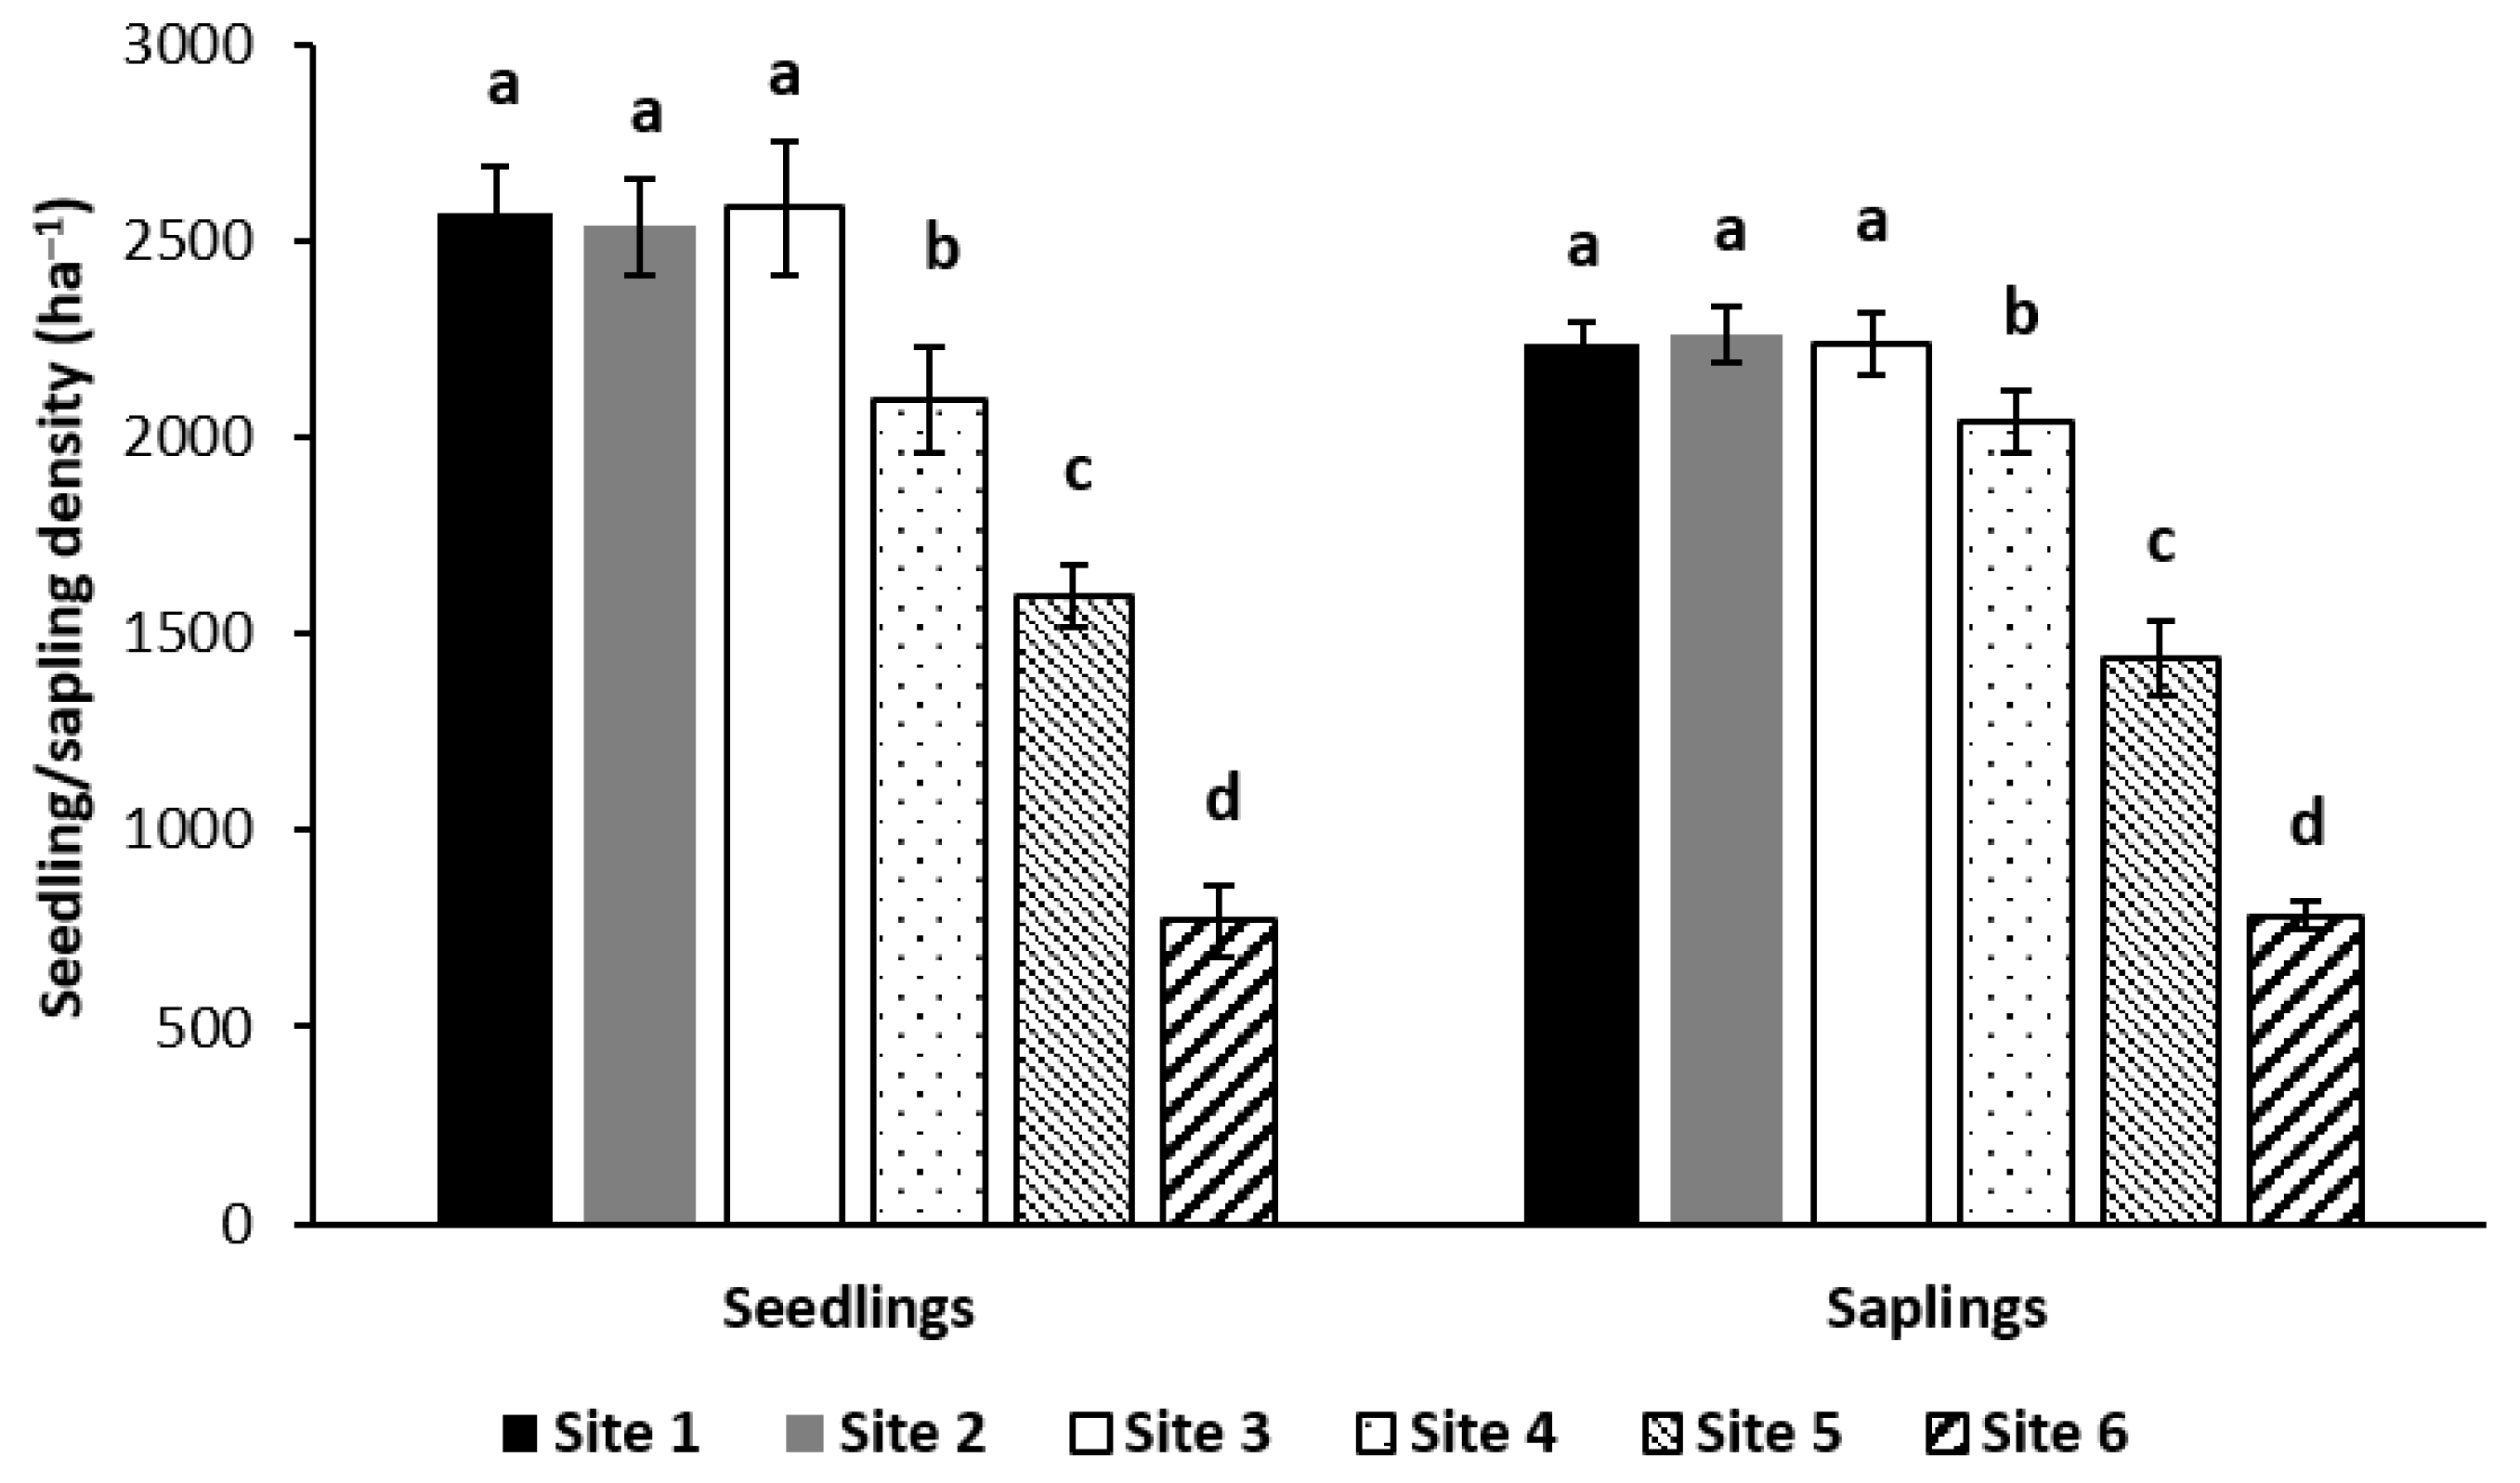
2]. In this study, the densities of both seedlings and saplings at all sites were good enough for future regeneration from a management perspective, even though the density at lower rainfall regions (sites 4–6) was significantly lower than for the other sites.
Within the lower rainfall sites, the seedling and sapling densities of the forests with 1029 mm of annual rainfall and 843 mm of annual rainfall were 2.5 times and two times higher than those of the forests with 625 mm of annual rainfall, respectively. This finding supported the research by Galiano et al. [45] and Parada and Lusk [46], which explored how drought or reduced rainfall limited the survival of plants at the seedling stage. In comparison with other studies, the density of natural regeneration at our study sites was lower than that of semi-evergreen forests in Myanmar studied by Oo [47], and higher than that of the secondary forests in Vietnam studied by Woo et al. [48].
The richness of understory species in this study ranged from 17 species in the low rainfall region to 74 species in the high rainfall region, showing an increasing trend from low to high rainfall. Nonetheless, the species richness of forests at all sites in this study was lower than the richness found in semi-evergreen forests [47], although it was higher than that of dry forests in a semiarid region, where twelve regenerating species occurred [12].
Similar observations were made for species diversity. The results throughout the study sites showed an increasing trend with rainfall. Moreover, a noticeable difference (a significant increase) was found when annual rainfall changed from 625–1029 mm to 1411 mm. There was no evidence of a significance difference between forests with 625–1029 mm of annual rainfall.
Our study supported the statement developed by Mok et al. [15] that climatic variation was one of the factors that resulted in a shift in species niches, showing that species composition varied among forests in different rainfall regions. Moreover, this study showed that some species were distributed throughout a wide range of rainfall regions, whereas some species were adapted to a particular area. The natural regeneration of T. grandis and X. dolabriformis occurred throughout the regions where the annual rainfall was 843–2035 mm, showing that X. dolabriformis exhibited higher regeneration than T. grandis (Table S1). In addition, T. grandis occurred abundantly at sites 1–3 only, while X. dolabriformis occurred abundantly at sites 1–5. Therefore, the distribution range of X. dolabriformis was wider than that of T. grandis. However, those two species did not occur in a region with 625 mm of annual rainfall.
Furthermore, in a region with 625 mm of annual rainfall, a higher percentage of regeneration occurred for M. tinctoria and A. catechu species. However, those species were not observed in the high rainfall regions, particularly M. tinctoria, which was not observed in regions with 843–2035 mm of annual rainfall, while A. catechu did not occur in regions with 1029–2035 mm of annual rainfall. Therefore, low rainfall regions could be the preferred habitat of these species.
Most of the species at all sites had a good regeneration status, although a few species had a poor regeneration status or no natural regeneration. Numerically, 1.33% of total species at site 1, 1.37% at site 2, 2.04% at site 4, 4.55% at site 5, and 10.53% at site 6 revealed no natural regeneration. Moreover, 1.37% of total species at site 2, 4.35% at site 3, 4.08% at site 4, and 4.55% at site 5 demonstrated poor regeneration. The regeneration status found in this study was better than that of subtropical forests found by Khumbongmayum et al. [7], who reported that 2–16% of total species had no regeneration, and 13–29% had poor regeneration.
The spatial distribution of forests varied among sites, although the values did not differ significantly from each other. Within a range of 625–2035 mm of annual rainfall, the spatial distribution at all study sites was found to be regular, without showing any decreasing or increasing trends with annual rainfall.
Generally, natural regeneration largely depends on not only abiotic (temperature, rainfall, fertility, etc.), but also biotic (diversity, richness, composition, etc.) factors. In terms of abiotic factors, it is commonly accepted that the amount of rainfall is one of the essential factors for plant survival [49,50,51]. Our study supports that statement, in that the diversity and density of natural regeneration increased with rainfall. This study was also consistent with Osem et al. [12] findings that the density and richness increased linearly with rainfall in the regions where annual rainfall ranged from 300 to 900 mm.
This study highlighted that natural regeneration was more susceptible to the impact of rainfall in low rainfall regions than high rainfall regions, because the density of natural regeneration was significantly lower when annual rainfall decreased within the lower rainfall regions; however, a significant effect of rainfall on natural regeneration did not occur within high rainfall regions (Figure 2). Among climatic factors, average rainfall tended to be the most influential factor on the natural regeneration of forests, followed by maximum rainfall and average temperature.
In terms of biotic effects, understory species richness depends on overstory diversity [2,52]. Within a range of 625 to 2035 mm annual rainfall, the richer the overstory diversity of the forest, the richer the understory species recorded. The correlation of the diversity of mature trees to the diversities of seedlings and saplings was strong (r = 0.961, p ≤ 0.01 for seedlings, and r = 0.99, p ≤ 0.01 for saplings). Natural generation status was better in forests with a range of 843–2035 mm of annual rainfall than that in forests with 625 mm of annual rainfall.
Luo et al. [3] expressed that stand density was one of the factors that affected regeneration status. In this study, the overstory structure parameters that affected the natural regeneration of a forest were the overstory species richness, density, species diversity, and ecosystem complexity. Additionally, this study explored the combination of the influential overstory parameters that significantly affected species diversity and richness of natural regeneration, with the combination of two overstory factors, overstory density × richness and overstory richness × ecosystem complexity, showing significant effects.
The results from this study exhibited the variation of natural regeneration in response to different overstory structures across a rainfall gradient, which may indicate that there is potential for greater species diversity, richness, and density of upcoming forest stands with 1411–2035 mm of annual rainfall than those of forests with 625–1029 mm of annual rainfall. Although the density of upcoming forests with 1029 mm of annual rainfall is expected to be higher than those of forests with 625–843 mm of annual rainfall, the species diversity and richness of forests may remain the same between those regions, if there are no other disturbances. Overall, the possibility of a more diverse forest stand may occur in regions with 1411–2035 mm of annual rainfall than the other regions (625–1029 mm) in the future generation, and the overstory structure may control the natural regeneration of forests. The results from this study may form a basis for creating the next generation. A forest management approach, including silvicultural operations which can enhance natural regeneration such as canopy opening, climber cutting, weeding, enrichment planting, etc., may be given for maintaining forest biodiversity or creating the upcoming forest stands as a diverse forest with intended species.

5. Conclusions

The status of natural regeneration in tropical forests of Myanmar differed along rainfall gradients (a range of 625 to 2035 mm annual rainfall), although it demonstrated a good regeneration status, and regular species distributions, within that range of annual rainfall. The impact of climate was significant on species diversity, richness, and density of natural regeneration; an increasing trend occurred in regions with 625–2035 mm of annual rainfall. Forests with 1411 to 2035 mm of annual rainfall have a significantly higher density and species diversity at natural regeneration stages than those forests with an annual rainfall of 625 to 1029 mm. This study also revealed that species distributions, as well as the regeneration status of species at natural regeneration stages, varied from site to site, with a change of dominant species in the overstory structure. Both abiotic and biotic factors influenced the regeneration status. Among the environmental factors, average annual rainfall, followed by maximum rainfall and the temperature difference, strongly influenced the density of natural regeneration, although the average annual rainfall, followed by maximum rainfall and average annual temperature, influenced the diversity of natural regeneration. Nevertheless, the spatial distribution of natural regeneration could not be determined by the environmental factors. Biotic factors, such as: (1) the overstory density × richness interaction, and (2) the overstory richness × ecosystem complexity interaction, significantly influenced the density of natural regeneration. All combination effects of overstory density, richness, diversity, and ecosystem complexity significantly influenced species richness and the diversity of natural regeneration. It can be concluded that the natural regeneration of forests varied with both: (1) different rainfall gradients, and (2) overstory structure parameters, in terms of density, species richness, diversity, and ecosystem complexity. To control or conserve the natural regeneration of forests, amount of rainfall and overstory parameters should be taken into consideration in the forest management system.

Supplementary Materials

The following are available online at https://www.mdpi.com/1999-4907/9/3/143/s1, Table S1: Species mostly occurred at seedling and sapling layers among the study sites.

Acknowledgments

This study was conducted with the financial support of ‘R&D Program for Forest Science Technology (2017047B10–1818–BB01)’ provided by Korea Forest Service (Korea Forestry Promotion Institute). We are grateful to everyone who helped with the field survey. We would like to thank two anonymous reviewers for their constructive comments.

Author Contributions

Inkyin Khaine and Su Young Woo conceived and designed the experiments; Inkyin Khaine, MyeongJa Kwak, Seong Han Lee, Sun Mi Je, Hana You, Taeyoon Lee, Jihwi Jang, Hyun Kyung Lee, Hyo Cheng Cheng, and Jeong Ho Park performed the experiments; Inkyin Khaine, Euddeum Lee, Yang Li, Haenaem Kim, JoungKyu Lee, and Jieun Kim analyzed the data; Su Young Woo and Inkyin Khaine contributed analysis tools; Inkyin Khaine and Su Young Woo wrote the paper.

Conflicts of Interest

The authors declare no conflict of interest.

References

  1. Borja, M.E.L. Climate change and forest natural regeneration in Mediterranean mountain areas. For. Res. 2014, 3, e108. [Google Scholar] [CrossRef]
  2. Bose, A.K.; Weiskittel, A.; Wagner, R.G.; Kuehne, C. Assessing the factors influencing natural regeneration patterns in the diverse, multi-cohort, and managed forests of Maine, USA. J. Veg. Sci. 2016, 27, 1140–1150. [Google Scholar] [CrossRef]
  3. Luo, M.; Zheng, X.; Du, Y. Natural regeneration of an artificial Platycladus orientalis stand in Beijing. Nat. Environ. Pollut. Technol. 2017, 10, 287–293. [Google Scholar]
  4. Rozendaal, D.M.A.; Chazdon, R.L. Demographic drivers of tree biomass change during secondary succession in northeastern Costa Rica. Ecol. Appl. 2015, 25, 506–516. [Google Scholar] [CrossRef] [PubMed]
  5. Poorter, L.; Bongers, F.; Aide, T.M.; Zambrano, A.M.A.; Balvanera, P.; Becknell, J.M.; Boukili, V.; Brancalion, P.H.S.; Broadbent, E.N.; Chazdon, R.L.; et al. Biomass resilience of Neotropical secondary forests. Nature 2016, 530, 211–214. [Google Scholar] [CrossRef] [PubMed]
  6. Chazdon, R.L.; Guariguata, M.R. Natural regeneration as a tool for large-scale restoration in the tropics: Prospects and challenges. Biotropica 2016, 48, 716–730. [Google Scholar] [CrossRef]
  7. Khumbongmayum, A.D.; Khan, M.; Tripathi, R. Biodiversity conservation in sacred groves of Manipur, northeast India: Population structure and regeneration status of woody species. Biodivers. Conserv. 2006, 15, 2439–2456. [Google Scholar] [CrossRef]
  8. Vieira, D.L.; Scariot, A. Principles of natural regeneration of tropical dry forests for restoration. Restor. Ecol. 2006, 14, 11–20. [Google Scholar] [CrossRef]
  9. Chazdon, R.L. Landscape restoration, natural regeneration, and the forests of the future. Ann. Mo. Bot. Gard. 2017, 102, 251–257. [Google Scholar] [CrossRef]
  10. Fredericksen, T.S.; Pariona, W. Effect of skidder disturbance on commercial tree regeneration in logging gaps in a Bolivian tropical forest. For. Ecol. Manag. 2002, 171, 223–230. [Google Scholar] [CrossRef]
  11. De Carvalho, A.L.; d’Oliveira, M.V.N.; Putz, F.E.; de Oliveira, L.C. Natural regeneration of trees in selectively logged forest in western Amazonia. For. Ecol. Manag. 2017, 392, 36–44. [Google Scholar] [CrossRef]
  12. Osem, Y.; Zangy, E.; Bney-Moshe, E.; Moshe, Y.; Karni, N.; Nisan, Y. The potential of transforming simple structured pine plantations into mixed Mediterranean forests through natural regeneration along a rainfall gradient. For. Ecol. Manag. 2009, 259, 14–23. [Google Scholar] [CrossRef]
  13. Felsmann, K.; Baudis, M.; Kayler, Z.E.; Puhlmann, H.; Ulrich, A.; Gessler, A. Responses of the structure and function of the understory plant communities to precipitation reduction across forest ecosystems in Germany. Ann. For. Sci. 2018, 75, 3. [Google Scholar] [CrossRef]
  14. Khaine, I.; Woo, S.Y. An overview of interrelationship between climate change and forests. For. Sci. Technol. 2015, 11, 11–18. [Google Scholar] [CrossRef]
  15. Mok, H.; Arndt, S.K.; Nitschke, C.R. Modelling the potential impact of climate variability and change on species regeneration potential in the temperate forests of South-Eastern Australia. Glob. Chang. Biol. 2012, 18, 1053–1072. [Google Scholar] [CrossRef]
  16. Palik, B.; Mitchell, R.J.; Pecot, S.; Battaglia, M.; Pu, M. Spatial distribution of overstory retention influences resources and growth of longleaf pine seedlings. Ecol. Appl. 2003, 13, 674–686. [Google Scholar] [CrossRef]
  17. O’Brien, M.J.; O’Hara, K.L.; Erbilin, N.; Wood, D.L. Overstory and shrub effects on natural regeneration processes in native Pinus radiate stands. For. Ecol. Manag. 2007, 240, 178–185. [Google Scholar] [CrossRef]
  18. Zhu, J.; Lu, D.; Zhang, W. Effects of gaps on regeneration of woody plants: A meta-analysis. J. For. Res. 2014, 25, 501–510. [Google Scholar] [CrossRef]
  19. Dickinson, M.B.; Whigham, D.F.; Hermann, S.M. Tree regeneration in felling and natural treefall disturbances in a semideciduous tropical forest in Mexico. For. Ecol. Manag. 2000, 134, 137–151. [Google Scholar] [CrossRef]
  20. Gilliam, F.S. The ecological significance of the herbaceous layer in temperate forest ecosystems. BioScience 2007, 57, 845–858. [Google Scholar] [CrossRef]
  21. Battles, J.J.; Shlisky, A.J.; Barrett, R.H.; Heald, R.C.; Allen-Diaz, B.H. The effects of forest management on plant species diversity in a Sierran conifer forest. For. Ecol. Manag. 2001, 146, 211–222. [Google Scholar] [CrossRef]
  22. Bataineh, M.; Kenefic, L.; Weiskittel, A.; Wagner, R.; Brissette, J. Influence of partial harvesting and sites factors on the abundance and composition of natural regeneration in the Acadian Forest of Maine, USA. For. Ecol. Manag. 2013, 306, 69–106. [Google Scholar] [CrossRef]
  23. Kozlowski, T.T. Physiological ecology of natural regeneration of harvested and disturbed forest stands: Implications for forest management. For. Ecol. Manag. 2002, 158, 195–221. [Google Scholar] [CrossRef]
  24. Schwartz, G.; Falkowski, V.; Peña-Claros, M. Natural regeneration of tree species in the Eastern Amazon: Short-term responses after reduced-impact logging. For. Ecol. Manag. 2017, 385, 97–103. [Google Scholar] [CrossRef]
  25. Nyland, R.D. Silviculture Concepts and Applications, 3rd ed.; Waveland Press Inc.: Long Grove, IL, USA, 2016. [Google Scholar]
  26. Weiskittel, A.R.; Hann, D.W.; Kershaw, J.A., Jr.; Vanclay, J.K. Forest Growth and Yield Modeling; John Wiley & Sons: Chichester, UK, 2011. [Google Scholar]
  27. De Martonne, E. L’indice d’aridité. Bulletin l’Association Géographes Français 1926, 3, 3–5. [Google Scholar] [CrossRef]
  28. Doerr, A.H. De martonne’s index of aridity and Oklahoma’s climate. Proc. Oklahoma Acad. Sci. 1963, 43, 211–213. [Google Scholar]
  29. Grieser, J.; Gommes, R.; Cofield, S.; Bernardi, M. Data Sources for FAO Worldmaps of Koeppen Climatologies and Climatic Net Primary Production; The Agromet Group, SDRN Food and Agriculture Organization of the United Nations: Rome, Italy, 2006. [Google Scholar]
  30. Paltineanu, C.; Mihailescu, I.; Seceleanu, I.; Dragota, C.; Vasenciuc, F. Using aridity indices to describe some climate and soil features in Eastern Europe: A Romanian case study. Theor. Appl. Climatol. 2007, 90, 263–274. [Google Scholar] [CrossRef]
  31. Khaine, I.; Woo, S.Y.; Kang, H.D.; Kwak, M.J.; Je, S.M.; You, H.; Lee, T.Y.; Jang, J.H.; Lee, H.K.; Lee, E.D.; et al. Species diversity, stand structure, and species distribution across a precipitation gradient in tropical forests in Myanmar. Forests 2017, 8, 282. [Google Scholar] [CrossRef]
  32. Heltshe, J.F.; Forrester, N.E. Estimating species richness using the jackknife procedure. Biometrics 1983, 39, 1–11. [Google Scholar] [CrossRef] [PubMed]
  33. Shannon, C.E.; Weaver, W.J. The Mathematical Theory of Communication; University of Illinois Press: Urbana, IL, USA; Chicago, IL, USA, 1949. [Google Scholar]
  34. Simpson, E.H. Measurement of diversity. Nature 1949, 163, 688. [Google Scholar] [CrossRef]
  35. Bhuyan, P.; Khan, M.; Tripathi, R. Tree diversity and population structure in undisturbed and human-impacted stands of tropical wet evergreen forest in Arunachal Pradesh, Eastern Himalayas, India. Biodivers. Conserv. 2003, 12, 1753–1773. [Google Scholar] [CrossRef]
  36. Loetsch, F.; Zohrer, F.; Haller, K.E. Forest Inventory Volume II; BLV Verlagsgesellchaft: München, Germany, 1973. [Google Scholar]
  37. Kershaw, J.A.; Ducey, M.J.; Beers, T.W.; Husch, B. Forest Mensuration, 5th ed.; John Wiley & Sons, Inc.: Chichester, UK, 2017. [Google Scholar]
  38. Hakkenberg, C.R.; Song, C.; Peet, R.K.; White, P.S. Forest structure as a predictor of tree species diversity in the North Carolina Piedmont. J. Veg. Sci. 2016, 27, 1151–1163. [Google Scholar] [CrossRef]
  39. Dixon, P.M.; Weiner, J.; Mitchell-Olds, T.; Woodley, R. Bootstrapping the Gini coefficient of inequality. Ecology 1987, 68, 1548–1551. [Google Scholar] [CrossRef]
  40. Knox, R.G.; Peet, R.K.; Christensen, N.L. Population dynamics in Loblolly pine stands: Changes in skewness and size inequality. Ecology 1989, 70, 1153–1166. [Google Scholar] [CrossRef]
  41. Lugo, A.E.; Gonzalez-Liboy, J.A.; Cintron, B.; Gugger, K. Structure, productivity, and transpiration of a subtropical dry forest in Puerto Rico. Biotropica 1978, 10, 278–291. [Google Scholar] [CrossRef]
  42. Kalacska, M.; Sanchez-Azofeifa, G.A.; Calvo-Alvarado, J.C.; Quesada, M.; Rivard, B.; Janzen, D.H. Species composition, similarity and diversity in three successional stages of a seasonally dry tropical forest. For. Ecol. Manag. 2004, 200, 227–247. [Google Scholar] [CrossRef]
  43. Malik, Z.A.; Bhatt, A.B. Regeneration status of tree species and survival of their seedlings in Kedarnath Wildlife Sanctuary and its adjoining areas in Western Himalia, India. Trop. Ecol. 2016, 57, 677–690. [Google Scholar]
  44. Singh, S.; Malic, Z.A.; Sharma, C.M. Tree species richness, diversity, and regeneration status in different oak (Quercus spp.) dominated forests of Garhwal Himalaya, India. J. Asia-Pac. Biodivers. 2016, 9, 293–300. [Google Scholar] [CrossRef]
  45. Galiano, L.; Martinez-Vilalta, J.; Eugenio, M.; Cerda, I.G.; Lloret, F. Seedling emergence and growth of Quercus spp. following severe drought effects on a Pinus sylvestris canopy. J. Veg. Sci. 2013, 24, 580–588. [Google Scholar] [CrossRef]
  46. Parada, T.; Lusk, C.H. Pattern of tree seedling mortality in a temperate-mediterranean transition zone forest in Chile. Gayana Bot. 2011, 68, 236–243. [Google Scholar] [CrossRef]
  47. Oo, T.N. Carbon Sequestration of Tropical Deciduous Forests and Forest Plantations in Myanmar. Ph.D Thesis, Seoul National University, Seoul, Korea, 2009. [Google Scholar]
  48. Woo, S.Y.; Thai, H.T.; Park, P.S. Stand structure and natural regeneration of degraded forestland in the northern mountainous region of Vietnam. Landsc. Ecol. Eng. 2011, 7, 251–261. [Google Scholar] [CrossRef]
  49. Goldie, X.; Gillman, L.; Crisp, M.; Wright, S. Evolutionary speed limited by water in arid Australia. Proc. Biol. Sci. 2010, 277, 2645–2653. [Google Scholar] [CrossRef] [PubMed]
  50. Johnson, C.; Chhin, S.; Zhang, J. Effects of climate on competitive dynamics in mixed conifer forests of the Sierra Nevada. For. Ecol. Manag. 2017, 394, 1–12. [Google Scholar] [CrossRef]
  51. Nlungu-Kweta, P.; Leduc, A.; Bergeron, Y. Climate and disturbance regime effects on aspen (Populus tremuloides Michx.) stand structure and composition along an east–west transect in Canada’s boreal forest. Forestry 2017, 90, 70–81. [Google Scholar] [CrossRef]
  52. Olson, M.G.; Wagner, R.G. Factors affecting species richness of tree regeneration in mixed-wood stands of central Maine. J. Veg. Sci. 2011, 22, 303–311. [Google Scholar] [CrossRef]
Figure 1. Location map of the study areas, and layout of sampling plots.
Forests 09 00143 g001
Figure 2. Seedling and sapling densities of forests at six study sites. Error bars show standard deviations. Different letters indicate significant differences among the sites by Duncan’s multiple range tests at p < 0.05.
Forests 09 00143 g002
Table 1. Climatic variables of the study sites.
SiteLatitude (N)/Longitude (E)Avg. R (mm)Max. R (mm)Min. R (mm)Avg. T (°C)Max. T (°C)Min. T (°C)R dif (mm)T dif (°C)
Site 119°15′–19°23′/95°51′–95°58′2035476327.038.115.347322.8
Site 218°15′–18°24′/95°49′–95°59′1600323127.038.715.432223.3
Site 318°28′–18°46′/95°49′–95°57′1411290127.238.815.628923.2
Site 421°38′–21°49′/94°19′–94°24′1029200124.134.612.419922.2
Site 521°02′–21°11′/94°18′–94°22′843191025.736.214.019122.2
Site 621°06′–21°07′/94°56′–94°57′625124027.239.514.512425.0
Avg. R: mean annual rainfall; Max. R: maximum monthly rainfall; Min. R: minimum monthly rainfall; Avg. T: mean annual temperature; Max. T: maximum temperature; Min. T: minimum temperature; R dif: the difference between the highest rainfall and the lowest rainfall of the year; T dif: the difference between the highest and the lowest temperature of a year.
Table 2. Different regeneration statuses of a forest.
Sr. No.Regeneration StatusSeedling (Se)Sapling (Sa)Compare to Mature
1Good regenerationampleampleSe > mature; Sa > mature
2Fair regenerationampleconditionalSe > Sa; Sa ≤ mature
3Poor regenerationpresentabsentno Sa; but Se > mature
absentpresentno Se; but Sa > mature
4No regenerationabsentabsentonly mature
Table 3. Variables of overstory structure and natural regeneration.
DescriptionUnitMeanSDRange
MinimumMaximum
Response variables
Seedling densitytrees2026.33726.95770.002585.00
Sapling densitytrees1833.17601.97783.002261.00
Seedling richnessspecies49.6725.6417.0074.00
Sapling richnessspecies49.1725.8917.0074.00
Seedling diversity-1.760.291.442.04
Sapling diversity-2.250.371.762.63
Explanatory variables
Over-story densitytrees306.8351.59229.00368.00
Over-story richnessspecies51.1725.5119.0075.00
Over-story diversity-2.690.512.033.20
Size heterogeneitycm0.00610.00880.00190.024
Size distribution
Skewness (D)cm0.960.780.182.27
Kurtosis (D)cm2.162.77−0.216.25
Skewness (H)m0.700.550.171.40
Kurtosis (H)m1.241.99−0.234.44
Skewness (BA)m22.251.171.173.63
Kurtosis (BA)m29.267.492.1020.26
Ecosystem complexity-13.3512.840.1425.76
D: diameter; H: height; BA: basal area.
Table 4. Species richness of seedlings, saplings, and trees among six study sites.
SiteSeedlingSaplingTree
No. of SpeciesJackknife IndexNo. of SpeciesJackknife IndexNo. of SpeciesJackknife Index
Site 17474.83 a7474.95 a7575.83 a
Site 27272.95 a7171.89 a7373.79 a
Site 36767.93 a6869.00 a6969.73 a
Site 44747.86 b4546.00 b4949.81 b
Site 52121.92 c2021.00 c2223.00 c
Site 61717.51 c1717.77 c1920.00 c
Different lowercase letters indicate the differences among the sites was significant by cluster analysis.
Table 5. Different diversity indices of seedlings and saplings among six study sites.
SiteSeedlingSapling
Shannon Diversity IndexSimpson Diversity IndexShannon EvennessShannon Diversity IndexSimpson Diversity IndexShannon Evenness
Site 12.01 ± 0.21 a0.89 ± 0.03 a96.99 ± 2.35 ab2.49 ± 0.23 a0.92 ± 0.02 ab95.95 ± 1.92 a
Site 22.02 ± 0.15 a0.90 ± 0.02 a97.82 ± 1.59 a2.58 ± 0.19 a0.93 ± 0.02 a96.39 ± 1.02 a
Site 32.04 ± 0.12 a0.90 ± 0.02 a97.61 ± 1.38 a2.63 ± 0.08 a0.93 ± 0.01 a95.91 ± 1.41 a
Site 41.55 ± 0.20 b0.81 ± 0.05 c95.83 ± 3.91 bc1.93 ± 0.35 c0.84 ± 0.07 c92.29 ± 5.75 bc
Site 51.44 ± 0.20 c0.79 ± 0.06 d94.89 ± 3.90 c1.76 ± 0.27 d0.81 ± 0.07 c91.77 ± 5.80 c
Site 61.47 ± 0.11 bc0.87 ± 0.04 b94.61 ± 3.32 c2.11 ± 0.08 b0.89 ± 0.02 b94.37 ± 2.40 ab
Different letters indicate significant differences among the sites by Duncan’s multiple range tests at p < 0.05.
Table 6. Composition of seedlings, saplings, and mature trees of some species at six study sites.
SiteSpeciesSeedling (%)Sapling (%)Mature (%)Total (%)
Site 1Xylia dolabriformis Benth.49.5443.586.88100
Tectona grandis Linn.f47.9245.057.03100
Protium serrata (Wall. Ex Colebr.) Engl.51.7142.375.92100
Mitragyna rotundifolia (Roxb.) Kuntze45.5646.677.78100
Lagerstroemia tomentosa C. Presl46.3547.456.20100
Azadirachta indica A. Juss00100100
Site 2Xylia dolabriformis Benth.48.7344.167.11100
Mitragyna rotundifolia (Roxb.) Kuntze41.9250.008.08100
Tectona grandis Linn.f52.0040.677.33100
Lannea grandis Engl.48.2843.108.62100
Rinorea bengalensis (Wall.) Kuntze00100100
Lagerstroemia parviflora Roxb.85.71014.29100
Site 3Xylia dolabriformis Benth.46.2347.016.75100
Tectona grandis Linn.f53.8840.955.17100
Mitragyna rotundifolia (Roxb.) Kuntze47.8445.326.83100
Pittosporum nepaulensis DC.083.3316.67100
Stereospermum fimbriatum Wall.075.0025.00100
Cleidion speciflorum Merr.83.33016.67100
Site 4Xylia dolabriformis Benth.41.9949.618.40100
Pentacme siamensis (Miq.) Kurz45.0647.137.80100
Terminalia tomentosa (Roxb.) Wight&Arn46.8246.107.08100
Shorea oblongifolia Thw.44.9747.627.41100
Dipterocarpus tuberculatus Roxb.44.6347.997.38100
Holarrhena antidysenterica (Linn.) Wall.00100100
Premna latifolia Roxb.88.89011.11100
Diospyros burmanica Kurz083.3316.67100
Site 5Tectona hamiltoniana Wall.48.2844.677.05100
Terminalia oliveri Brandis.47.7145.716.57100
Terminalia tomentosa (Roxb.) Wight&Arn56.6337.226.15100
Anogeissus acuminata (Roxb. Ex Candolle)47.2745.457.27100
Pentacme siamensis (Miq.) Kurz72.73027.27100
Spondias pinnata (L.f.) Kurz00100100
Site 6Morinda tinctoria Roxb.38.4946.0515.46100
Acacia leucophloea (Roxb.) Willd53.6335.2011.17100
Rhus peniculata Wall.36.2248.4315.35100
Acacia catechu (L.f.) Willd.50.7937.5711.64100
Gardenia obtusifolia Roxb.00100100
Lannea grandis Engl.00100100
Table 7. Spatial distribution of natural regeneration at seedling and sapling stages at the study sites.
SiteIndex of Spatial Distribution at Seedling StageIndex of Spatial Distribution at Sapling Stage
10.050.06
20.060.09
30.110.11
40.080.12
50.040.25
60.110.07
Table 8. Pearson correlation coefficients between forest growth and environmental factors.
DescriptionAvg. RMax. RAvg. TT dif
Seedlings
Density0.819 **0.747 **0.141 *−0.475 **
Shannon index0.732 **0.677 **0.529 **0.027
Simpson index0.488 **0.451 **0.620 **0.373 **
Shannon evenness0.307 **0.267 **0.174 *−0.037
Spatial distribution−0.354−0.4210.2390.649
Saplings
Density0.776 **0.694 **0.012−0.538 **
Shannon index0.620 **0.560 **0.631 **0.250 *
Simpson index0.485 **0.440 **0.605 **0.360 **
Shannon evenness0.342 **0.316 **0.393 **0.204 *
Spatial distribution−0.446−0.397−0.449−0.560
** and * represent correlations are significant at p < 0.01 and p < 0.05 level, respectively; Avg. R: mean annual rainfall; Max. R: maximum rainfall; Avg. T: mean annual temperature; T dif: the difference between the highest temperature of the warmest month and the lowest temperature of the coldest month of the year.
Table 9. The relationship between natural regeneration and overstory layers.
DescriptionSeDSaDSeRSaRSeDiSaDi
Over-story density0.797 *0.819 *0.919 **0.911 *0.828 *0.780
Over-story richness0.938 **0.925 **1.000 **0.999 **0.946 **0.838 *
Over-story diversity0.6810.6280.853 *0.869 *0.961 **0.999 **
Size heterogeneity0.3510.3040.4590.4650.4300.342
Size distribution
Skewness (D)−0.516−0.561−0.215−0.198−0.0460.190
Kurtosis (D)−0.397−0.438−0.093−0.0770.0350.234
Skewness (H)−0.366−0.416−0.097−0.0830.0190.169
Kurtosis (H)−0.134−0.1800.1150.1280.1760.264
Skewness (BA)−0.153−0.1930.1420.1500.2300.362
Kurtosis (BA)0.1050.0550.3810.3900.4560.536
Ecosystem complexity0.860 *0.812 *0.953 **0.961 **0.995 **0.929 **
** and * refer the relation are considered significant at p < 0.01 and p < 0.05, respectively; SeD: seedling density; SaD: sapling density; SeR: seedling richness; SaR: sapling richness; SeDi: seedling diversity; SaDi: sapling diversity.
Table 10. Effects of overstory structural parameters on natural regeneration.
DescriptionSeDSaDSeRSaRSeDiSaDi
Ovs density × richness0.911 *0.863 *1.000 **0.999 **0.908 *0.702
Ovs density × EC0.7630.7270.961 **0.965 **0.991 **0.863
Ovs richness × EC0.891 *0.903 *1.000 **1.000 **0.991 **0.884 *
Ovs density × richness × EC0.9450.9381.000 **1.000 **0.991 *0.924
Ovs density × diversity 0.887 *0.888 *0.936 *0.999 **
Ovs diversity × EC 0.926 *0.936 *0.995 **1.000 **
Ovs richness × diversity 1.000 **0.999 **0.981 **0.999 **
Ovs richness × diversity × EC 1.000 **1.000 **0.996 **1.000 **
Ovs density × diversity × EC 0.983 *0.980 *0.995 **1.000 **
Ovs density × richness × diversity 1.000 **1.000 **0.995 **0.999 **
Ovs density × richness × diversity × EC 1.000 **1.000 **0.999 **1.000 *
** and * refer that the effects are considered significant at p < 0.01 and p < 0.05, respectively; SeD: seedling density; SaD: sapling density; SeR: seedling richness; SaR: sapling richness; SeDi: seedling diversity; SaDi: sapling diversity; OvS: Over-story; EC: ecosystem complexity.

