Analysis of Soil Degradation Causes in Phyllostachys edulis Forests with Different Mulching Years


1
Zhejiang Provincial Key Laboratory of Bamboo Research, Bamboo Shoot Engineering and Technology Research Center for State Forestry Administration, Zhejiang Academy of Forestry, Hangzhou 310023, China
2
Agriculture and Forestry Bureau of Shengzhou City, Shengzhou 312400, China
*
Authors to whom correspondence should be addressed.
Forests 2018, 9(3), 149; https://doi.org/10.3390/f9030149
Submission received: 14 January 2018
/
Revised: 5 March 2018
/
Accepted: 16 March 2018
/
Published: 16 March 2018
(This article belongs to the Section Forest Ecology and Management)
Abstract
:Moso bamboo (Phyllostachys edulis (Carrière) J.Houz.) is famous for its fast growth and biomass accumulation, as well as high annual output for timber and bamboo shoots. Organic mulches are widely used to improve shoots’ production in moso bamboo forests. However, continuous mulching management may cause bamboo forest degradation and affect sustainable development. The objective of this study was to identify the degradation mechanism and to provide a theoretical basis for recovery. A complete randomized block design with four treatments was conducted, including mulching for one year (M1), two years (M2), three years (M3) and no-mulching management (NM). Soil nutrient contents, enzyme activities and microbial biomass were determined. With the increase of mulching years, the soil pH value gradually reduced, causing soil acidification, but the content of soil organic matter was inclined to ascend. Soil total nitrogen (TN), total phosphorus (TP) and total potassium (TK) contents showed an increasing trend, and they were significantly higher in mulching stands than those in NM (p < 0.05). Contents of soil available nutrients (AN, AP and AK) increased, then decreased with the increase of mulching years and peaked in M1. With the increase of mulching years, the soil stoichiometry ratio (C/N, C/P and N/P) gradually increased. Soil invertase, urease and acid phosphatase activities presented a single-peak curve and reached the maximum within one year after mulching. Total microbial biomass and that of individual groups changed greatly after mulching. Soil microbial biomass increased first and then decreased, and it was the largest in M1. The fungi:bacteria ratio decreased in the first year and then began to rise, while the aerobic:anaerobic ratio showed the opposite trend. According to the overall results, M3 leads to soil acidification, imbalance of the nutrients’ proportion, abnormal enzyme activity and change of soil microbial flora, and rotated mulching management (mulching one year and then recuperating one year) should be recommended in practice.
1. Introduction
Moso bamboo (Phyllostachys edulis (Carrière) J.Houz.) is an important forest type in Southern China, which is characterized by its fast growth and rapid biomass accumulation [1,2]. Bamboo timbers and bamboo shoots are the main forest products in moso bamboo forests, which play a key role in the bamboo industry and economic development [3,4,5]. In addition, bamboo shoots are also known for their edible value, great taste and high nutrition, due to which they have become a traditional vegetable in Chinese dishes [6]. However, with the implementation of intensive management, yields of forest products including bamboo timbers and shoots have already reached a high level, and it is hard to further improve them in the short term [3]. Furthermore, the low price of shoots caused by the short shooting period and market concentration [7] seriously restricts the economic benefit. Therefore, in order to improve economic benefits, new technical measures should be explored.
Mulching was adopted as a strategy to buffer soil temperature, reduce water evaporation, prevent weed growth [8,9,10] and improve production by enhancing soil quality [11,12,13]. Research showed that shoot bud differentiation was closely related to soil temperature [6]. Therefore, mulching management with organic materials in bamboo forests was an efficient approach to promote shoot bud differentiation and early germination [3,14]. Recently, the technique of mulching with organic materials was applied extensively in moso bamboo forests, and the yield of bamboo shoots and the economic output of bamboo forest increased obviously [7].
Previous research showed that continuous mulching management increased “off-year” shoot yield in moso bamboo forest, and the yields of “on-year” and “off-year” were approximately equal [7]. As a result, the natural biological rhythm in moso bamboo forests was changed, which accelerated the conversion process from on- and off-year to even-year bamboo forest [3]. In addition, mulching management impeded the normal growth of the rhizome-root system, which seriously limited the absorption space of that system [3]. Continuous mulching may lead to a great change in soil water, heat, gas and other environmental conditions, resulting in soil degradation [15]. The abnormal growth of moso bamboo forests and the soil degradation posed a threat to sustainable development of these forests.
Straw, bamboo leaf and rice chaff are commonly-used organic materials in bamboo forests, and they have been used in the production systems for decades. However, previous studies mainly focused on the impacts of mulches on the yield of bamboo shoots [7], the structure of bamboo forest [15] and the growth of bamboo rhizome [16], while their influences on the soil micro-ecological environment and the evolution of soil quality were overlooked.
Therefore, the objective of the present study was to identify the degradation mechanism of moso bamboo forests and to provide solutions for recovery. More specifically, we investigated the soil nutrient contents, enzyme activities and microbial biomass of different mulching years in moso bamboo forests. Finally, the optimized pattern of mulching management was proposed in terms of maintaining productivity.
2. Materials and Methods
2.1. Study Site
The experimental site is located at Shanbei village (119°57′ E, 30°39′ N), Huzhou city, Zhejiang province, China. The region has a humid mid-subtropical monsoon climate, with an annual average temperature of 15.2 °C and mean precipitation of 1400 mm. Annual average sunshine duration is 2124.5 h with 246 frost-free days. The site has an altitude of 78 m above sea level and a slope of 7°. The soil is defined as Ultisol according to the USDA soil classification system. Soil bulk density is 1.22 g·cm−3, organic matter content 13.50 g·kg−1 and pH 5.83 in the top 20-cm soil layer.
2.2. Experimental Design
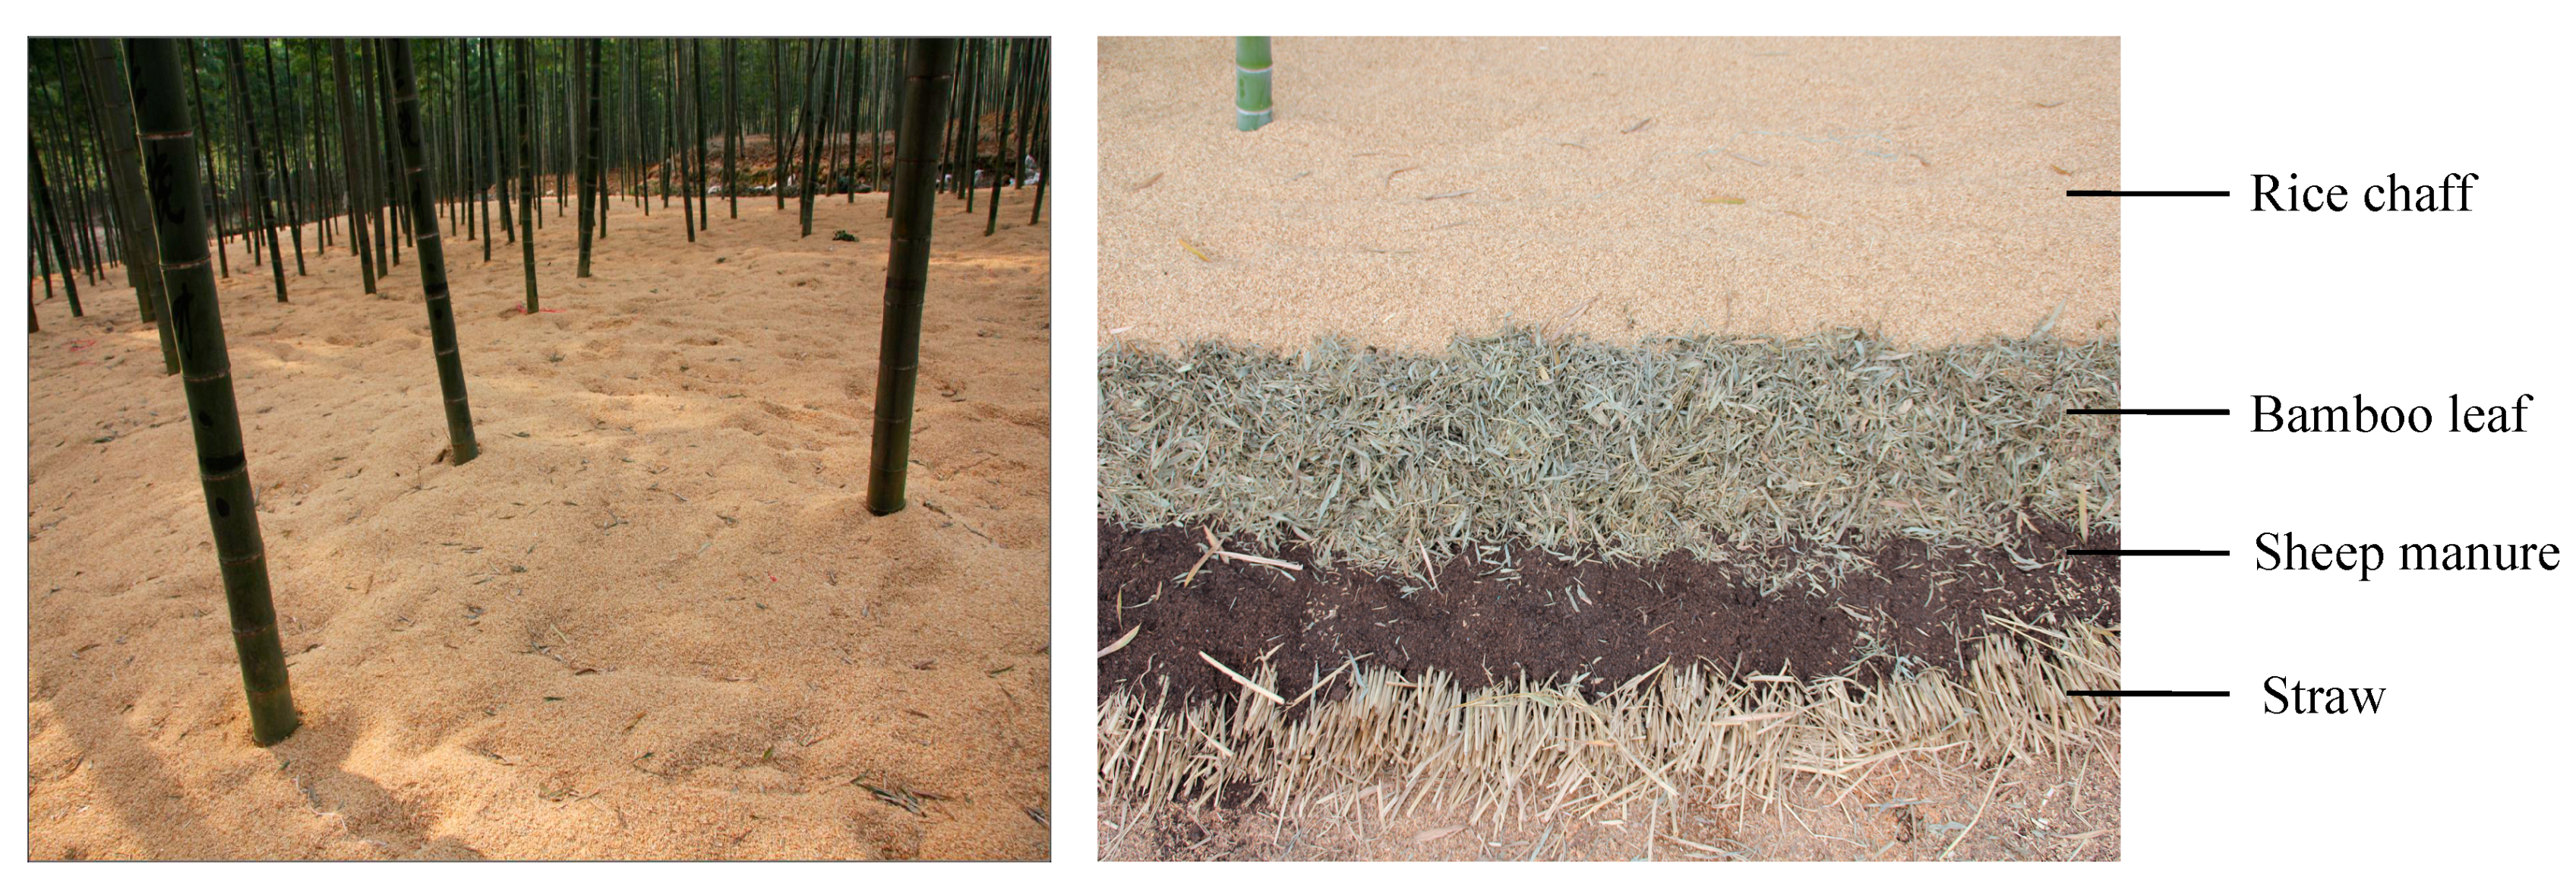
The moso bamboo forest used for the experiment was a pure forest with a concentrated slice. The production of bamboo shoots was the major strategy, whereas the harvest of bamboo timber was the minor strategy. In order to improve the production of bamboo shoots and maximize economic benefits, intensive managements, such as fertilization and mulching with organic matters, had been conducted in moso bamboo forests since 2013. Approximately 750 kg·ha−1 of compound fertilizer were applied in June combined with tilling, and 1500 kg·ha−1 of this fertilizer were applied in September for the cultivation of shoots [16]. The mulching time was mid- to late November. Specifically (Figure 1), first, organic fertilizers (sheep manure, 60,000 kg·ha−1) were applied before mulching. Second, 10 cm of straw were placed to cover the bottom. Then, 300,000 kg·ha−1 of water and 20,000 kg·ha−1 of sheep manure were added to accelerate the fermentation of the straw. Finally, 20 cm of bamboo leaves were placed on the sheep manure, and 20 cm of rice chaff were mulched on the top as the insulating layer. The organic mulches were gradually removed when natural shoots sprouted. Continuous mulching management was conducted in the experimental forests, and bamboo forests with different mulching years were established, which created better conditions for this study.
In May 2016, four moso bamboo stands with different mulching managements were selected, including: (1) mulching for one year (M1); (2) mulching for two years (M2); (3) mulching for three years (M3); and (4) no-mulching as the control (NM). Then, we randomly delineated three sample plots of 20 m × 20 m in the selected stands. The three sample plots within the same experimental stand were well separated by a distance of more than 10 m between two adjacent plots. In each plot, the diameter at breast height (DBH, 1.3 m), height and age of all bamboos were measured and recorded. The age was expressed by “du”, which reflected the phenomenon of “on-year” and “off-year” in moso bamboo forests [17,18]. In an “on-year”, more than 90% of new shoots were produced, followed by a few new shoots in an “off-year”, because moso bamboo forests produced new shoots at two-year intervals [19]. Bamboo of 1 (I) “du” corresponds to 1–2 years, and consequently, 2 (II) and 3 (III) “du” indicate 3–4 and 5–6 years, respectively [20]. The descriptions of stand characteristics are shown in Table 1.
2.3. Soil Sampling
Soils were sampled in May 2016, which was the late shooting period. Before soil core sampling, mulches were removed from the plot to prevent the contamination of the organic mulching matters by surface soil. Soil samples were collected at a 0–20-cm depth using a soil sampler with a diameter of 5 cm. In each plot, three soil cores were collected randomly, and samples were divided into two parts: one part was stored at −20 °C in a refrigerator for the analysis of enzyme activities and microbial biomass; the other part was air dried at room temperature, ground and sieved through 2-mm and 0.15-mm meshes before chemical analyses. The identifiable plant residues, stones, soil animals and root fragments were removed during sieving.
2.4. Soil Chemical Properties
Soil pH was measured in a 1:2.5 (m/v) soil/water suspension. Soil organic carbon (SOC) was analyzed using the H2SO4-K2Cr2O7 wet oxidation method [21]. Soil total nitrogen (TN) and total phosphorus (TP) were determined using Kjeldahl’s method and Olsen’s extractable phosphorus method, respectively [22]. Soil available nitrogen (AN), available phosphorus (AP) and available potassium (AK) were determined using the alkali-hydrolytic diffusion method, Olsen’s extractable phosphorus method and the neutral normal ammonium acetate method, respectively [22].
2.5. Soil Enzyme Activities
Enzyme activities were determined according to methods of Guan [23]. Invertase activity was measured using the colorimetric method with 3,5-dinitrosalicylic acid. Urease activity was measured using the indophenol blue colorimetric method. Acid phosphatase activity was measured using the colorimetric method with pyrocatechol phosphate.
2.6. Soil Microbial Biomass
Soil microbial biomass was determined using phospholipid fatty acid (PLFA) analysis by gas chromatography mass spectrometry (Agilent 6850, Agilent, Santa Clara, CA, USA). Methyl nonadecanoate (19:0) was used as an internal standard to calculate the individual fatty acid concentration [24,25,26]. Total biomass was calculated as the sum of all extracted PLFAs (Phospholipid-derived fatty acids). The sums of i15:0, a15:0, i16:0, 16:1ω9c, 16:1ω7c, i17:0, a17:0, cy17:0, 18:1ω7c and cy19:0 were chosen to represent bacteria [27,28]. The fatty acids of 16:1ω7c and 18:1ω7c were used to represent aerobic bacteria, and 17:0cy and 19:0cy were used to represent anaerobic bacteria [28]. The PLFAs 18:2ω6,9c and 18:1ω9c were chosen to represent fungi, and 10Me 16:0, 10Me 17:0 and 10Me 18:0 to identify actinomycetes [26,29,30]. The ratio of fungal PLFAs to bacterial PLFAs was used to calculate the F/B ratio [29].
2.7. Statistical Analysis
The treatments were analyzed with SAS 9.0 (SAS Institute Inc, Hong Kong, China) to detect significant differences by one-way ANOVA. Multiple comparisons were conducted using the least significant difference (LSD) range test, where differences were considered significant at p < 0.05. Figures were prepared using the Origin 8.6 software program.
3. Results
3.1. Soil Chemical Properties
As shown in Table 2, with the increase of mulching years, the soil pH decreased, and there were no significant differences between NM and M1 (p > 0.05). After three years of mulching management, the SOC level was improved, whereas no obvious difference was observed between NM and M1 (p > 0.05). TN content increased with the increase of mulching years, and mulching management significantly improved TN content (p < 0.05). The contents of TN in M1, M2 and M3 were 11.8%, 48.5% and 69.9% higher than that in NM, respectively. With the increase of mulching years, TP content raised, while no significant difference existed between NM and M1 (p > 0.05).
With the increase of mulching years, the contents of AN, AP and AK increased first and then decreased. All of the available nutrient contents in M1 were significantly higher than those in NM, M2 and M3 (p < 0.05). There were no significant differences in the available nutrient contents between NM and M2 (p > 0.05); while all of the available nutrient contents in M3 were significantly lower than those in NM (p < 0.05).
As shown in Figure 2, there was a gradually increasing trend of C/N, C/P and N/P with the increase of mulching years, and no significant differences between NM and M1 were found (p > 0.05). C/N and C/P in M3 were significantly higher than those in M2 (p < 0.05), while there was no significant difference in N/P between M2 and M3 (p > 0.05).
3.2. Soil Enzyme Activities
Mulching management increased soil invertase activity, urease activity and acid phosphatase activity in the first year, while it decreased these soil enzyme activities in the third year (Table 3). All of the soil enzyme activities reached the maximum within one year after mulching and then declined rapidly to a low level similar to the control. M1 significantly increased soil invertase, urease and acid phosphatase activity levels, and they were significantly higher than those in other treatments (p < 0.05). No statistically-significant differences in soil enzyme activities between NM and M2 were found (p > 0.05), while soil enzyme activities in NM were significantly higher than those in M3 (p < 0.05).
3.3. Soil Microbial Biomass
Total microbial biomass and that of individual groups varied between the treatments (Table 4). With the increase of mulching years, total microbial PLFAs showed a single peak curve, and the highest PLFAs were detected in M1. The total microbial PLFAs in M1, M2 and M3 were higher than that in NM. There was no significant difference in total microbial PLFAs between M1 and M2 (p > 0.05), and no significant differences between NM and M3 were found (p > 0.05).
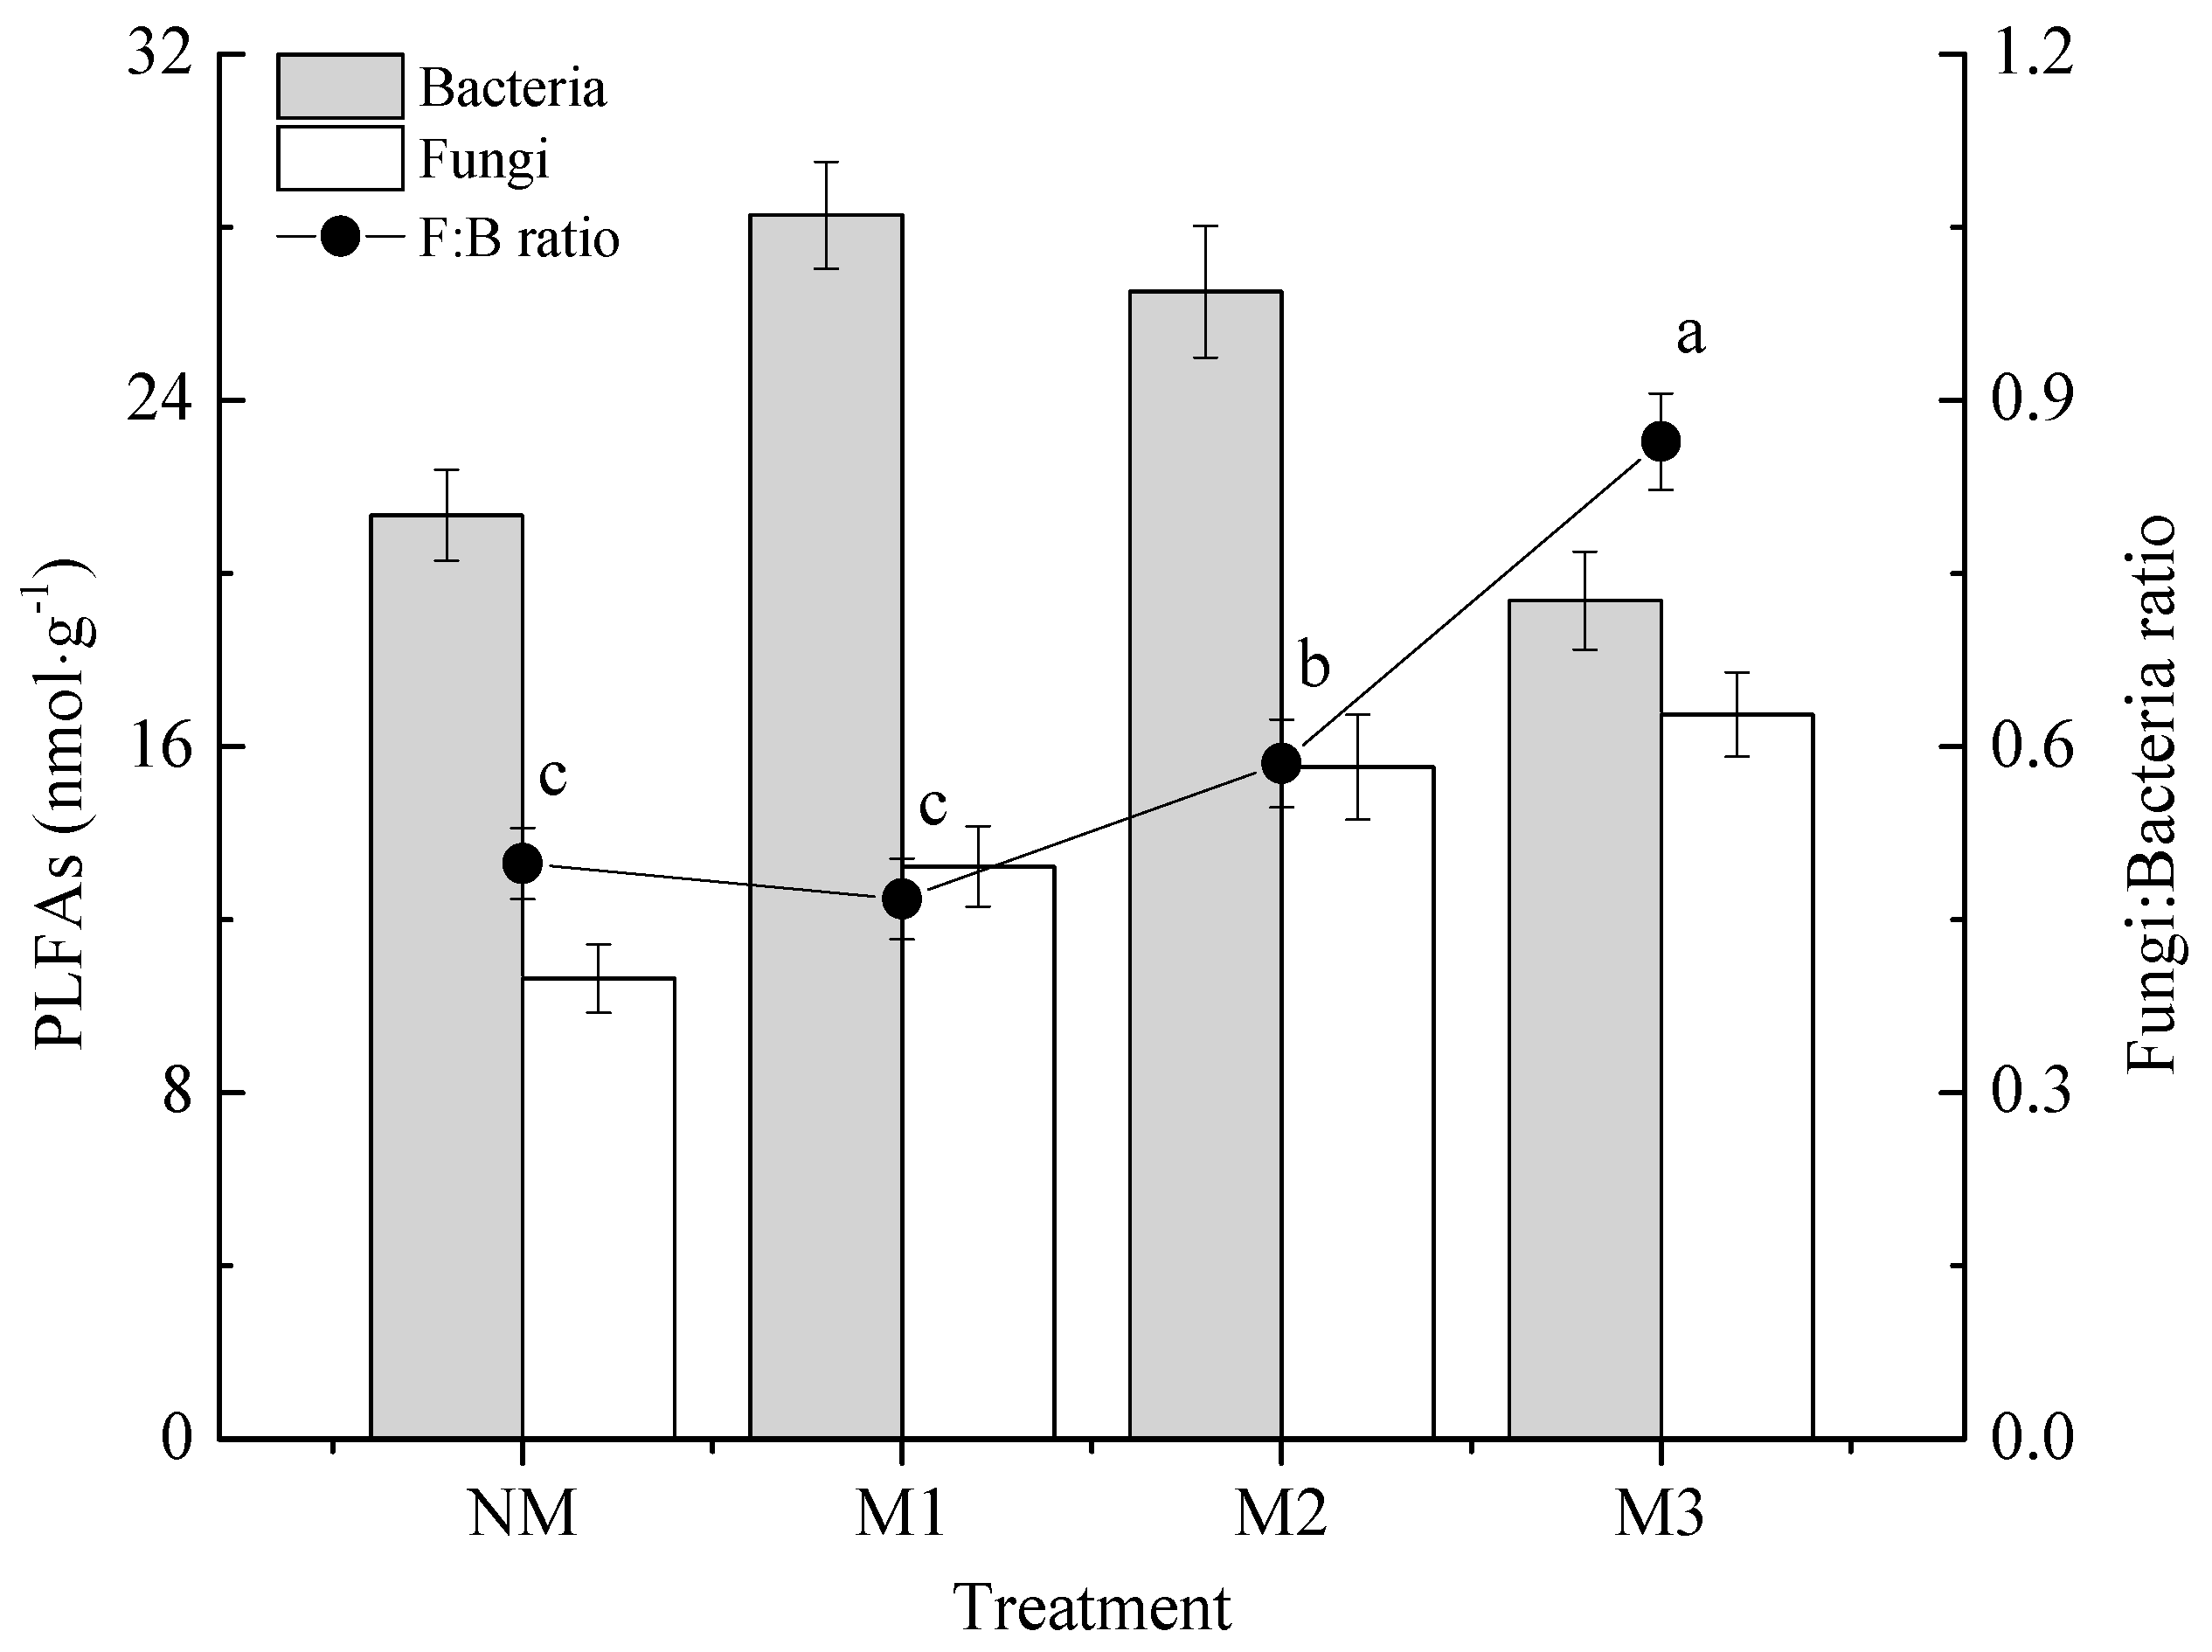
Figure 3 shows the difference between the bacteria and fungi biomass in each treatment and the fungi:bacteria PLFA ratio. With the increase of mulching years, total bacteria PLFAs increased first and then decreased, while total fungi PLFAs continued to increase. The fungi:bacteria PLFA ratio decreased first and then increased with the increase of mulching years, and no obvious difference was observed between NM and M1 (p > 0.05).
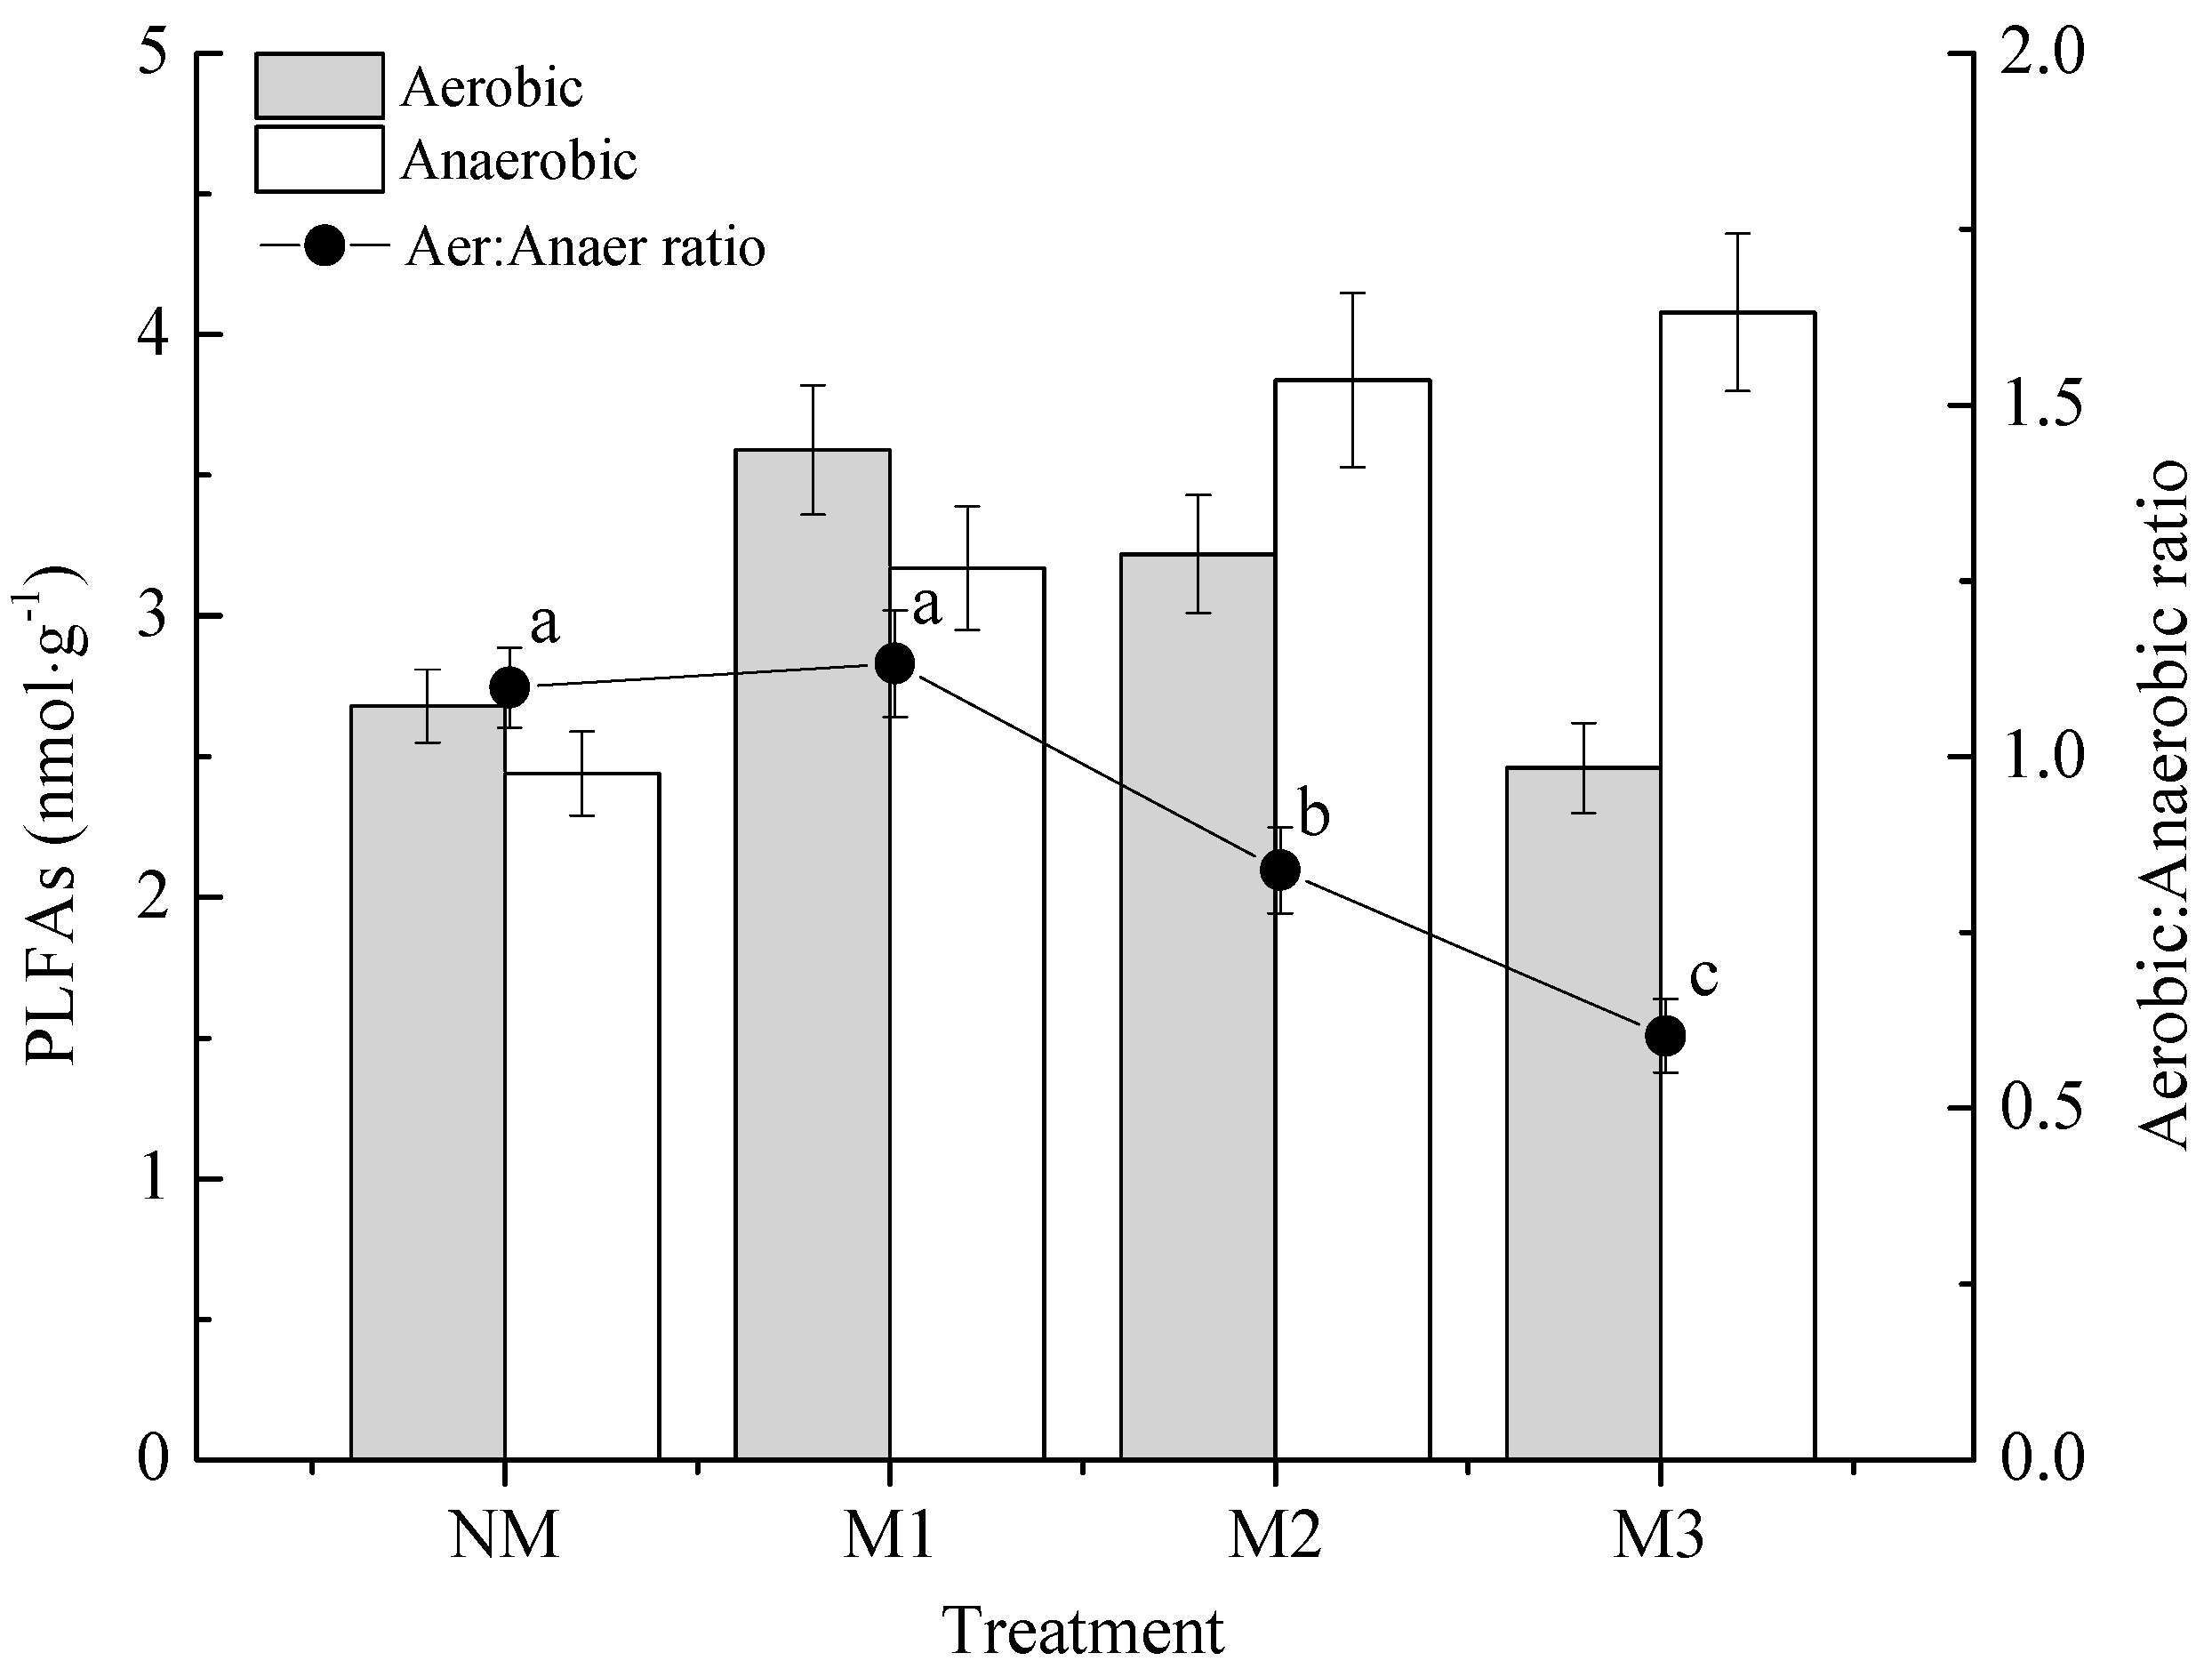
Figure 4 shows the difference between the aerobic bacteria and anaerobic bacteria biomass in each treatment and the aerobic:anaerobic PLFA ratio. With the increase of mulching years, aerobic bacteria PLFAs increased first and then decreased, while anaerobic bacteria PLFAs continued to increase. The aerobic:anaerobic PLFA ratio increased first and then decreased with the increase of mulching years, and no significant differences between NM and M1 were found (p > 0.05).
4. Discussion
Soil degradation refers to a retrogressive succession process with the loss of forest productivity or soil utilization and environment adjustment under human influences. Mulching management is a necessary measure to improve the yield of bamboo shoots and economic benefits. Soil degradation of moso bamboo forests is a complicated process, and the decline of soil quality and sustainability may be related to soil physical, chemical and biological characters.
4.1. Mulching Management and Soil pH
In our study, the pH value decreased with the increase of mulching years, which declined from 5.83 in NM to 5.03 in M3. This was consistent with the result of Liu [31] in Phyllostachys praecox forests: that pH value of surface (0–10 cm) and subsurface (10–20 cm) soil tended to decline with the increase of mulching years. The change of pH was a complicated process affected by many factors, and three reasons should explain why it decreased with the increase of mulching years. Firstly, chemical nitrogen fertilizer, which was applied before mulching, may accelerate the accumulation of N, resulting in nitrification and much more H+ [9,32]. Secondly, the degradation of residual mulching materials and the cultivation of anaerobic bacteria may lead to the accumulation of phenolic acids and then result in soil acidification [33]. Finally, organic acids excreted from bamboo roots were also considered to reduce soil acidity [3].
4.2. Mulching Management and Soil Nutrients
Contents of TOC and nutrients presented an increased trend with the increase of mulching years in our study, which was consistent with Guo et al. [34]. TOC content in M3 was approximately twice as high as that in NM. The increase of TOC was derived from the decomposition of mulching materials [31]. The heat preservation function of upper mulching materials (rice chaff) raised the temperature and then prompted the fermentation and decay of lower materials (straw). Previous research works reported that nutrients in the soil were taken out of bamboo forests due to shoot and timber harvesting, and the uptake of soil nutrients was high [2,35]. However, mulching management did not decrease soil nutrient contents because of the application of fertilizers and the decomposition of mulching materials in this study, which increased nutrient contents and compensated for the uptake [36]. In addition, the increment of soil nutrients was higher than the uptake [3,36], so the soil nutrient contents in mulching management were higher than those in NM. The nutrients’ ratios reflected soil nutrient contents and their relationship [37]. In this study, the increase of soil nutrients was due to the lack of synchronization, which may lead to the imbalance of the nutrients’ proportion [3].
In the present study, available nutrient (AN, AP and AK) contents increased in M1 and then decreased with the increase of mulching years. The increase of soil enzyme activities and microbial biomass after mulching probably improved available nutrients. M3 significantly decreased the available nutrient levels in the soil, indicating a negative effect of mulching materials on soil available nutrients. The decrease of aerobic bacteria in M3 enhanced denitrification and reduced nitrates, which increased the loss of AN in soil [3]. The reduction of AP effectiveness may relate to the decrease of pH, because some soil cations were fixed as delayed phosphates by phosphoric acid [31,38]. Soil AK content declined with the decrease of pH, which is consistent with the result of Zhao et al. [38]. In the process of soil acidification, the adsorption capacity of soil of K gradually decreased, resulting in the decrease of its efficiency [31].
4.3. Mulching Management and Soil Enzyme Activities
Soil enzymes, such as invertase, urease and acid phosphatase, played important roles in maintaining and increasing soil fertility, and they were involved in the cycling of carbon, nitrogen and phosphorus [39,40]. Our research showed that M1 had promoting effects on the soil enzyme activity levels compared to M2 and M3. Similar results were also reported by Liu [31], Chen [3], etc. This phenomenon was due to the fact that M2 and M3 led to a condition of high temperature and high humidity, resulting in abnormal enzyme activity [31]. Soil acidification also caused the decrease of enzyme activity [31]. M1 improved soil physical and chemical properties and thereby increased the microbial number and activity, which may explain the enhancement of the soil enzyme activity levels; while the diverse effect of M2 and M3 on soil enzyme activities may be related to their various impacts on soil microbial biomass.
4.4. Mulching Management and Soil Microbial Biomass
The preliminary study showed that M1 performed better to increase soil microbial biomass than M3. These results were consistent with the results obtained by Guo et al. [41] in Phyllostachys praecox forests. The enhancement in M1 probably occurred because of the increase of soil moisture, soil nutrient levels and root exudates [39,42]. However, soil acidification and the imbalance of nutrients’ proportion may show a great depression effect on soil microbial biomass in M3 [41].
The results of specific microbial groups were interesting with regards to microbial flora [28]. Although M1 did not contain the highest levels of TOC, it contained the biggest overall microbial biomass, which was largely comprised by bacterial communities, particularly aerobic bacteria. This was probably because M1 provided better conditions for increased microbial growth as described by Unger et al. [43]. Studies have demonstrated that fungi are crucial for soil food web development and play a vital role in decomposition and nutrient recycling [28,44]. In this study, fungi PLFAs increased with the increase of mulching years due to soil acidification, and it had promoting effects on soil characteristics. The ratios of fungal to bacterial PLFAs emphasized the pattern of fungal- or bacterial-dominated zones. For mulching management, this ratio was significantly higher in M3 than that in M1, illustrating that fungi dominated the competition gradually. Increased proportions of anaerobic bacterial PLFAs and decreased aerobic:anaerobic ratio indicated that anaerobic bacteria dominated. This suggested that M3 changed the conditions of soil, which was conductive to the growth of anaerobic bacteria. Although fungi improved soil characteristics [45], the change of soil microbial flora may lead to soil deterioration.
5. Conclusions
This study provided an insight into how mulching years affect soil characteristics in moso bamboo forests. Soil acidification was observed with the increase of mulching years. TOC and nutrient contents increased, but there was a lack of synchronization, leading to the imbalance of nutrients’ proportion. The available nutrient contents, enzyme activities and soil microbial biomass peaked in M1 and then declined gradually. Microbiota disruption was also observed due to the dramatic change in bacteria, fungi and actinomycete biomass. In general, though enhanced soil quality was found in M1, constant mulching could result in damage to the soil conditions and quality. Considering the phenomenon of “on-year” and “off-year” in moso bamboo forests, rotated mulching management (mulching one year and then recuperating one year) should be recommended in practice.
Acknowledgments
This study was financially supported by the “National Key R&D Program of China (2016YFD060090201)” and the “Demonstration Project of Forestry Science and Technology Extension Funds” by Central Government (2017TS02, 2015TS07). We are sincerely grateful to the anonymous reviewers for valuable suggestions to improve the article.
Author Contributions
B.W. and Q.L. conceived of and designed the experiments. J.Z., B.W. and H.Y. performed the experiments. J.Z., Q.L. and K.X. analyzed the data. J.Z. wrote the paper. All authors contributed to reviewing the manuscript.
Conflicts of Interest
The authors declare no conflict of interest.
References
- Tang, X.; Fan, S.; Qi, L.; Guan, F.; Du, M.; Zhang, H. Soil respiration and net ecosystem production in relation to intensive management in Moso bamboo forests. Catena 2016, 137, 219–228. [Google Scholar] [CrossRef]
- Zhao, J.C.; Su, W.H.; Fan, S.H.; Cai, C.J.; Zhu, X.W.; Peng, C.; Tang, X.L. Effects of various fertilization depths on ammonia volatilization in Moso bamboo (Phyllostachys edulis) forests. Plant Soil Environ. 2016, 62, 128–134. [Google Scholar]
- Chen, S.L. Thoughts on related problems of mulched technique with organic materials in moso bamboo forest for early shooting. J. Zhejiang A F Univ. 2011, 28, 799–804. [Google Scholar]
- Mertens, B.; Hua, L.; Belcher, B.; Ruiz-Pérez, M.; Fu, M.; Yang, X. Spatial patterns and processes of bamboo expansion in Southern China. Appl. Geogr. 2008, 28, 16–31. [Google Scholar] [CrossRef]
- Song, X.Z.; Zhou, G.M.; Jiang, H.; Yu, S.; Fu, J.; Li, W.; Wang, W.; Ma, Z.; Peng, C. Carbon sequestration by Chinese bamboo forests and their ecological benefits: Assessment of potential, problems, and future challenges. Environ. Rev. 2011, 19, 418–428. [Google Scholar] [CrossRef]
- Jiang, Z.H. Bamboo and Rattan in the World; China Forestry Publishing House: Beijing, China, 2007. [Google Scholar]
- Chen, J.M.; Zhu, W.; Fu, L.F.; Chen, J.M.; Ji, W.W.; Zhu, Z.J. Effect of mulching on rhizome growth and bamboo shoot yield in moso shoot productive forest. Word Bamboo Rat. 2015, 13, 20–28. [Google Scholar]
- Rathinasabapathi, B.; Ferguson, J.; Gal, M. Evaluation of allelopathic potential of wood chips for weed suppression in horticultural production systems. Hortic. Sci. 2015, 40, 711–713. [Google Scholar]
- Ni, X.; Song, W.; Zhang, H.; Yang, X.; Wang, L. Effects of mulching on soil properties and growth of tea olive (Osmanthus fragrans). PLoS ONE 2016, 11, e0158228. [Google Scholar] [CrossRef] [PubMed]
- Patil, N.N.; Rao, V.K.; Dimri, D.C.; Sharma, S.K. Effect of mulching on soil properties, growth and yield of strawberry cv. Chandler under mid hill conditions of Uttarakhand. Prog. Hortic. 2016, 48, 42–47. [Google Scholar] [CrossRef]
- Mulumba, L.N.; Lal, R. Mulching effects on selected soil physical properties. Soil Tillage Res. 2008, 98, 106–111. [Google Scholar] [CrossRef]
- Jordán, A.; Zavala, L.M.; Gil, J. Effects of mulching on soil physical properties and runoff under semi-arid conditions in southern Spain. Catena 2010, 81, 77–85. [Google Scholar] [CrossRef]
- Nzeyimana, I.; Hartemink, A.E.; Ritsema, C.; Stroosnijder, L.; Lwanga, E.H.; Geissen, V. Mulching as a strategy to improve soil properties and reduce soil erodibility in coffee farming systems of Rwanda. Catena 2017, 149, 43–51. [Google Scholar] [CrossRef]
- Li, T. Effects of Mulching on Soil Physicochemistry Properties and Quality of Bamboo Shoots in Phyllostachys heterocycla Stand. Master’s Thesis, Sichuan Agricultural University, Chengdu, China, 2016. [Google Scholar]
- Zhong, Z.L.; Zhu, W.Q.; Wu, L.D. Effects of removing the mulching in mid and late December on Phyllostachys heterocycla cv. pubescens yield and growth. J. Northeast For. Univ. 2016, 44, 7–10. [Google Scholar]
- Wang, B.; Wang, K.H.; Li, Q.; Zhu, Z.J.; Ding, X.Z.; Yang, J. A preliminary study of the effect of mulching on growth of Phyllostachys edulis. Word Bamboo Rat. 2012, 10, 20–22. [Google Scholar]
- Tang, X.; Fan, S.; Qi, L.; Guan, F.; Liu, G.; Du, M. Effects of understory removal on root production, turnover and total belowground carbon allocation in Moso bamboo forests. For.-Biogeosci. For. 2015, 9, 187–194. [Google Scholar] [CrossRef]
- Tang, X.; Fan, S.; Qi, L.; Guan, F.; Su, W.; Du, M. A comparison of soil respiration, carbon balance and root carbon use efficiency in two managed Moso bamboo forests in subtropical China. Ann. For. Res. 2016, 59, 3–20. [Google Scholar] [CrossRef]
- Fu, J. Moso bamboo in China. ABS Mag. 2000, 21, 12–17. [Google Scholar]
- Zhou, B.; Li, Z.; Wang, X.; Gao, Y.; An, Y.; Deng, Z.; Letu, G.; Gu, L. Impact of the 2008 ice storm on Moso bamboo plantations in southeast China. J. Geophys. Res. Biogeosci. 2011, 116, G00H06. [Google Scholar] [CrossRef]
- Fan, S.; Guan, F.; Xu, X.; Forrester, D.I.; Ma, W.; Tang, X. Ecosystem carbon stock loss after land use change in subtropical forests in China. Forests 2016, 7, 142. [Google Scholar] [CrossRef]
- Bao, S.D. Soil and Agricultural Chemistry Analysis; China Agriculture Press: Beijing, China, 2005. (In Chinese) [Google Scholar]
- Guan, S.Y. Soil Enzyme and Its Research Methods; China Agriculture Press: Beijing, China, 1986. (In Chinese) [Google Scholar]
- Cycoń, M.; Wójcik, M.; Borymski, S.; Zofia, P.S. Short-term effects of the herbicide napropamide on the activity and structure of the soil microbial community assessed by the multi-approach analysis. Appl. Soil Ecol. 2013, 66, 8–18. [Google Scholar] [CrossRef]
- Wu, C.; Qin, Z.; Huang, J.; Zhou, R. Characterization of microbial community in Daqu by PLFA method. Food Sci. Technol. Res. 2014, 20, 147–154. [Google Scholar] [CrossRef]
- Francisco, R.; Stone, D.; Creamer, R.E.; Sousa, J.P.; Morais, P.V. European scale analysis of phospholipid fatty acid composition of soils to establish operating ranges. Appl. Soil Ecol. 2016, 97, 49–60. [Google Scholar] [CrossRef]
- Carrasco, L.; Gattinger, A.; Fließbach, A.; Roldán, A.; Schloter, M.; Caravaca, F. Estimation by PLFA of microbial community structure associated with the rhizosphere of Lygeum spartum and Piptatherum miliaceum growing in semiarid mine tailings. Microb. Ecol. 2010, 60, 265–271. [Google Scholar] [CrossRef] [PubMed]
- Molineux, C.J.; Gange, A.C.; Connop, S.P.; Newport, D.J. Are microbial communities in green roof substrates comparable to those in post-industrial sites?—A preliminary study. Urban Ecosyst. 2015, 18, 1245–1260. [Google Scholar] [CrossRef]
- Moche, M.; Gutknecht, J.; Schulz, E.; Langer, U.; Rinklebe, J. Monthly dynamics of microbial community structure and their controlling factors in three floodplain soils. Soil Biol. Biochem. 2015, 90, 169–178. [Google Scholar] [CrossRef]
- Si, G.; Peng, C.; Yuan, J.; Xu, X.; Zhao, S.; Xu, D.; Wu, J. Changes in soil microbial ommunity composition and organic carbon fractions in an integrated rice-crayfish farming system in subtropical China. Sci. Rep. 2017, 7, 2856. [Google Scholar] [CrossRef] [PubMed]
- Liu, L. Study on Degradation Characteristics and the Improvement of Soil in Covered Phyllostachys praecox F. Prevernalis Forest. Master’s Thesis, Chinese Academy of Forestry, Beijing, China, 2009. [Google Scholar]
- Álvarez, E.; Fernández-Marcos, M.L.; Monterroso, C.; Fernández-Sanjurjo, M.J. Application of aluminium toxicity indices to soils under various forest species. For. Ecol. Manag. 2005, 211, 227–239. [Google Scholar] [CrossRef]
- Chalker-Scott, L. Impact of mulches on landscape plants and environment—A review. J. Environ. Hortic. 2007, 25, 239–249. [Google Scholar]
- Guo, Z.W.; Wang, W.Y.; Yang, Q.P.; Li, Y.C.; Chen, S.L. Effects of mulching management on stoichiometry of soil C, N and P in Phyllostachys praecox plantations. Guihaia 2013, 33, 627–632. [Google Scholar]
- Guan, F.; Xia, M.; Tang, X.; Fan, S. Spatial variability of soil nitrogen, phosphorus and potassium contents in Moso bamboo forests in Yong’an City, China. Catena 2017, 150, 161–172. [Google Scholar] [CrossRef]
- Jiang, P.K.; Xu, Q.F.; Qian, X.B.; Zhang, R.H.; Yang, F.F. Dynamic changes of chemical properties of warmer soil covered with different organic materials in Phyllostachys praecox forests. J. Zhejiang For. Coll. 1999, 16, 123–130. [Google Scholar]
- Guo, Z.W.; Chen, S.L.; Yang, Q.P.; Li, Y.C. Responses of N and P stoichiometry on mulching management in the stand of Phyllostachys praecox. Acta Ecol. Sin. 2012, 32, 6361–6368. [Google Scholar]
- Zhao, J.; Shen, X.; Li, X.; Hu, J.J.; Wang, H.Q.; Chen, L.B. Correlation between soil pH and the contents of available nutrients in selected soils from three pear orchards in Wendeng. North. Hourtic. 2009, 33, 5–8. [Google Scholar]
- Qian, X.; Gu, J.; Pan, H.; Zhang, K.; Sun, W.; Wang, X. Effects of living mulches on the soil nutrient contents, enzyme activities, and bacterial community diversities of apple orchard soils. Eur. J. Soil Biol. 2015, 70, 23–30. [Google Scholar] [CrossRef]
- Burns, R.G.; DeForest, J.L.; Marxsen, J.; Sinsabaugh, R.L.; Stromberger, M.E.; Wallenstein, M.D.; Weintraub, M.N.; Zoppini, A. Soil enzymes in a changing environment: Current knowledge and future directions. Soil Biol. Biochem. 2013, 58, 216–234. [Google Scholar] [CrossRef]
- Guo, Z.W.; Yu, W.X.; Chen, S.L.; Li, Y.C.; Yang, Q.P. Influence of mulching management on soil microbe and its relationship with soil nutrient in Phyllostachys praecox stand. Acta Ecol. Sin. 2013, 33, 5623–5630. [Google Scholar]
- Wardle, D.A.; Yeates, G.W.; Bonner, K.I.; Nicholson, K.S.; Watson, R.N. Impacts of ground vegetation management strategies in a kiwifruit orchard on the composition and functioning of the soil biota. Soil Biol. Biochem. 2001, 33, 893–905. [Google Scholar] [CrossRef]
- Unger, I.M.; Kennedy, A.C.; Muzika, R.M. Flooding effects on soil microbial communities. Appl. Soil Ecol. 2009, 42, 1–8. [Google Scholar] [CrossRef]
- Smith, R.S.; Shiel, R.S.; Bardgett, R.D.; Millward, D.; Corkhill, P.; Evans, P.; Quirk, H.; Hobbs, P.J.; Kometa, S.T. Long-term change in vegetation and soil microbial communities during the phased restoration of traditional meadow grassland. J. Appl. Ecol. 2008, 45, 670–679. [Google Scholar] [CrossRef]
- Wang, Y.; Xu, J.; Shen, J.; Luo, Y.; Scheu, S.; Ke, X. Tillage residue burning and crop rotation alter soil fungal community and water-stable aggregation in arable fields. Soil Tillage Res. 2010, 107, 71–79. [Google Scholar] [CrossRef]
Figure 1.
Photos of the experimental fields and the descriptions of mulching management.

Figure 2.
Stoichiometry of the nutrients of soil in P. edulis stands of different mulching years. The bars mean the standard error (n = 9). Different lowercase letters in the figure indicate significant differences among different treatments at the p < 0.05 level. NM, M1, M2 and M3 represent no-mulching, mulching for one year, two years and three years, respectively.
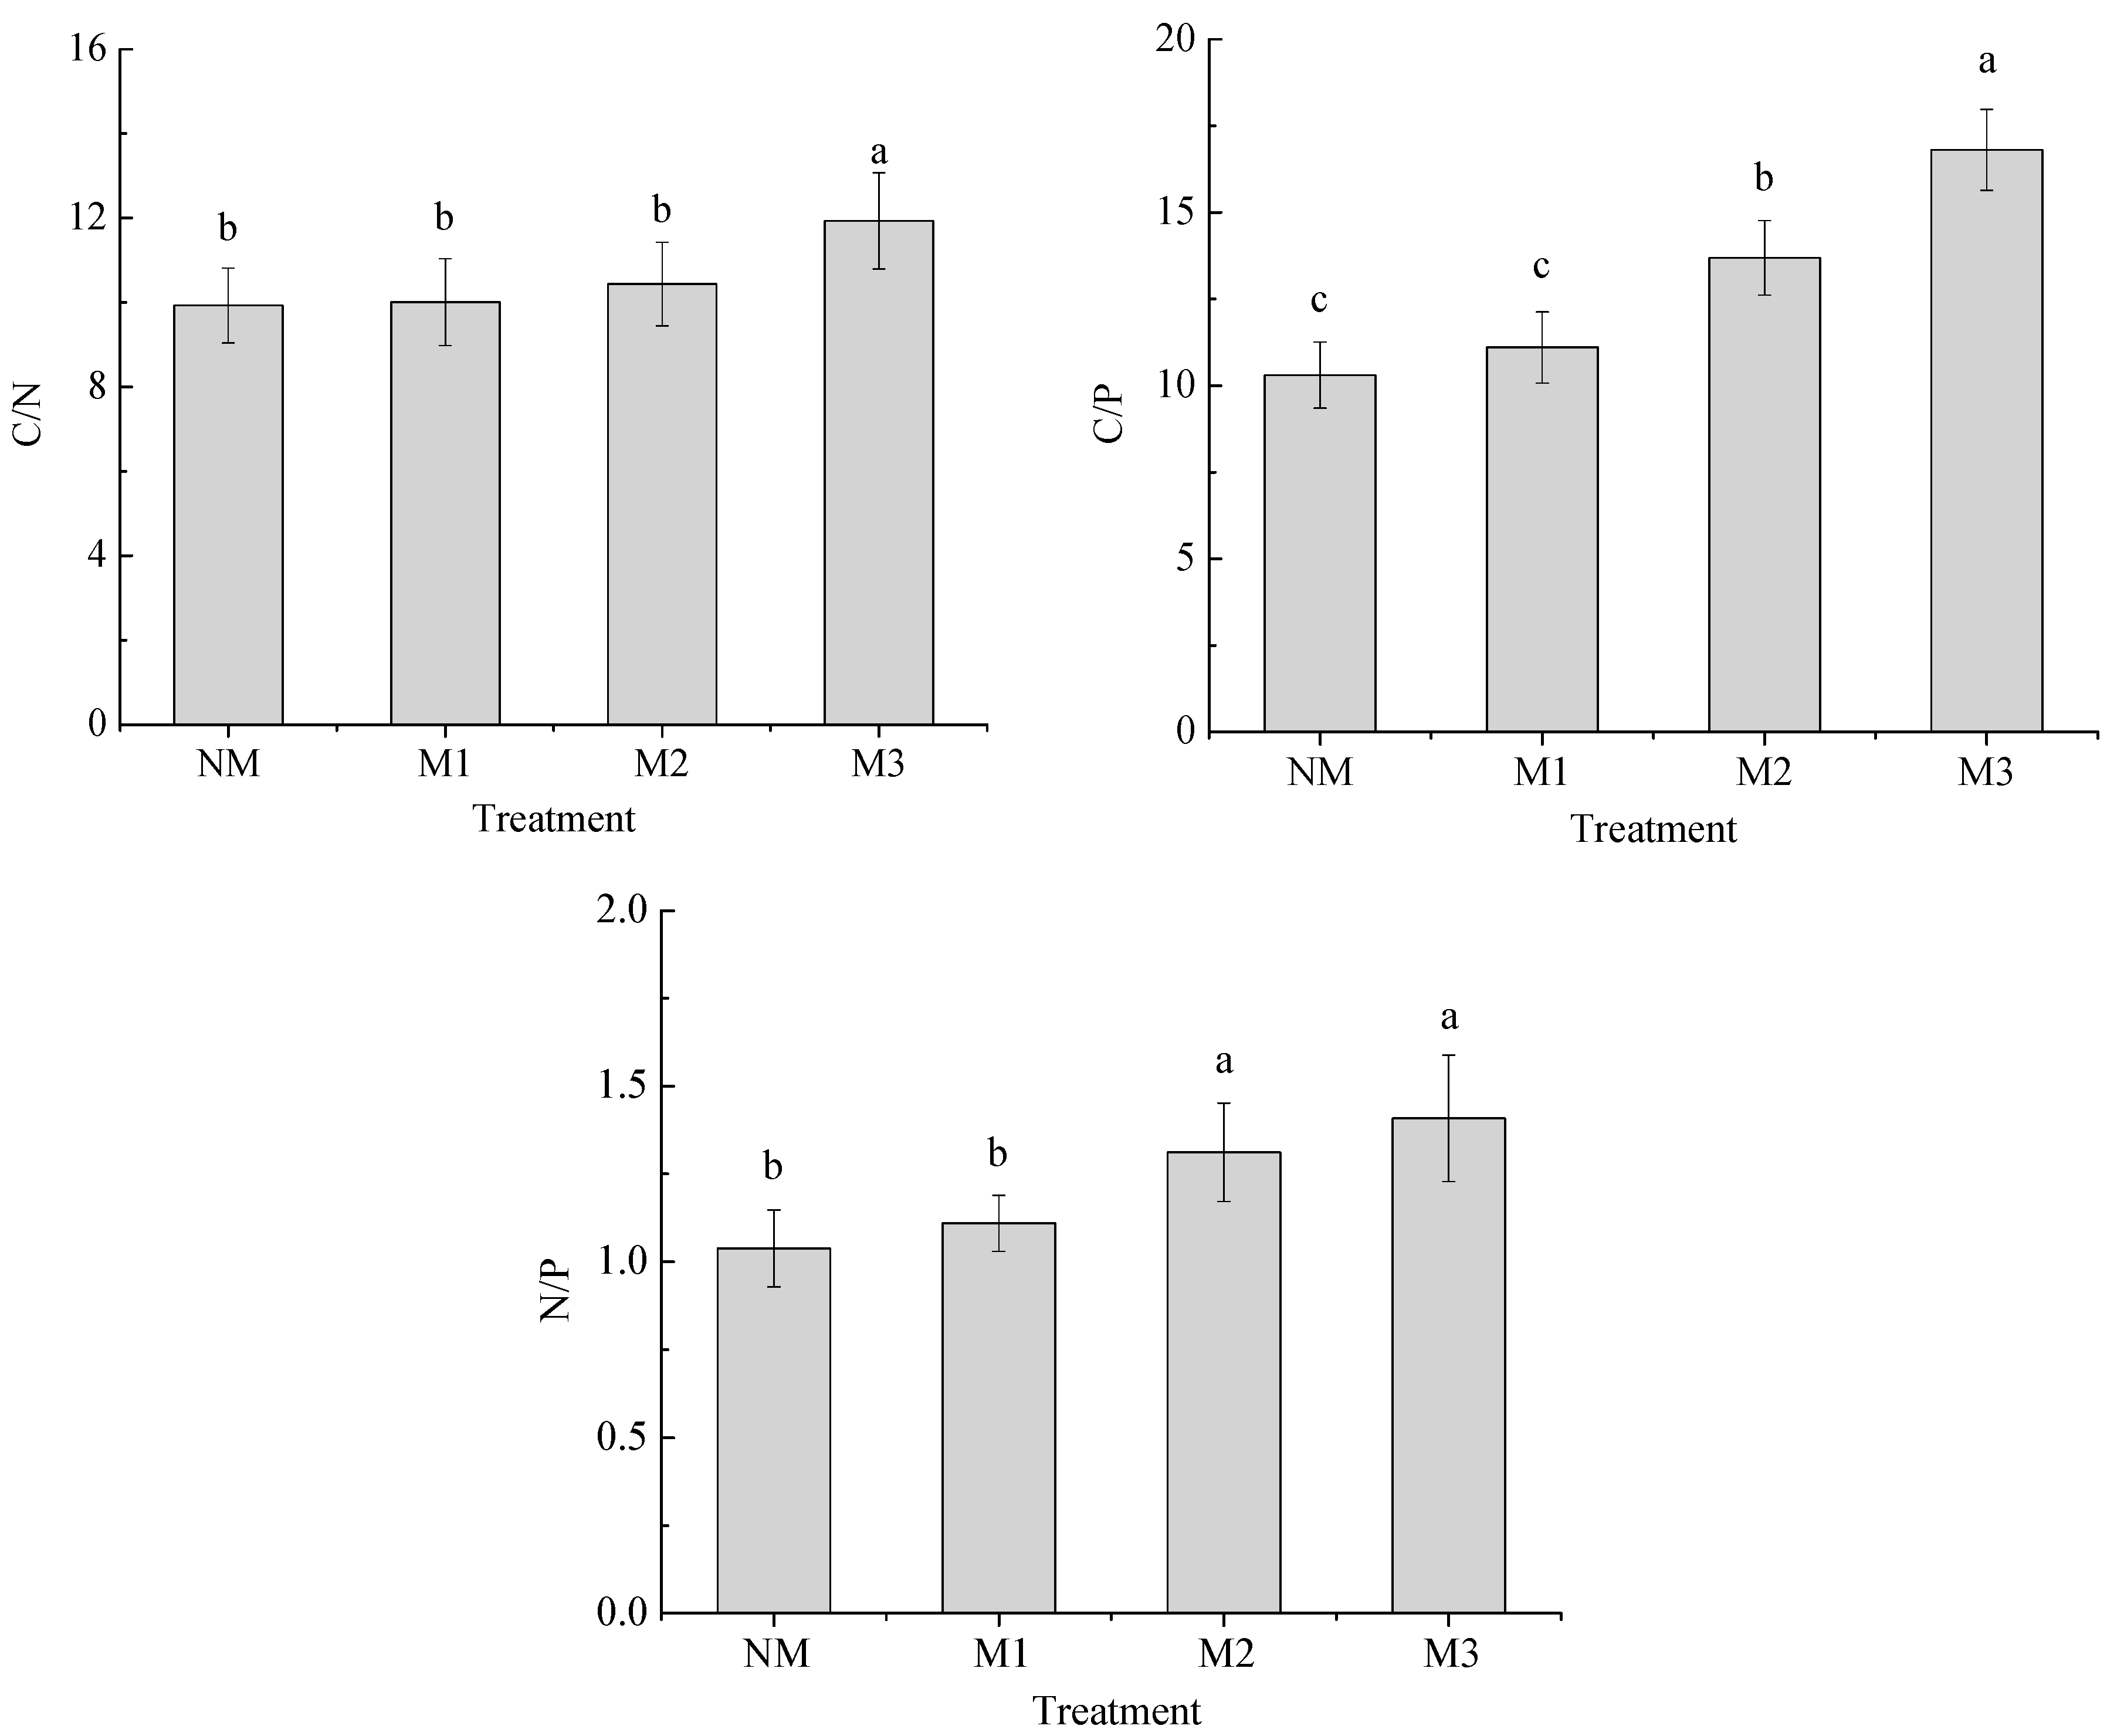
Figure 3.
Bacteria, fungi and the fungi:bacteria (F:B) ratio in P. edulis stands of different mulching years. The bars are the means ± standard error (n = 9). Different lowercase letters in the figure indicate significant differences among different treatments at the p < 0.05 level. NM, M1, M2 and M3 represent no-mulching, mulching for one year, two years and three years, respectively.

Figure 4.
Aerobic bacteria, anaerobic bacteria and the aerobic:anaerobic ratio in P. edulis stands of different mulching years. The bars are means ± standard error (n = 9). Different lowercase letters in the figure indicate significant differences among different treatments at the p < 0.05 level. NM, M1, M2 and M3 represent no-mulching, mulching for one year, two years and three years, respectively.

Table 1.
Characteristics of the four experimental stands.
| Treatment | Density (individual·ha−2) | Mean DBH (cm) | Mean Height (m) | Age Structure (I:II:III) |
|---|---|---|---|---|
| NM | 2542 ± 81 b | 10.14 ± 0.52 b | 14.45 ± 1.78 c | 0.42:0.31:0.27 |
| M1 | 2509 ± 84 b | 10.31 ± 0.68 a | 15.22 ± 1.89 a | 0.39:0.32:0.29 |
| M2 | 2580 ± 79 a | 9.93 ± 0.76 b | 14.89 ± 1.52 b | 0.38:0.31:0.31 |
| M3 | 2587 ± 93 a | 10.42 ± 0.65 a | 15.08 ± 1.94 b | 0.41:0.29:0.30 |
The values are the means ± standard deviations (n = 3). Different lowercase letters in the same column indicate significant differences among different treatments at p < 0.05 level. NM, M1, M2 and M3 represent no-mulching, mulching for one year, two years and three years, respectively. Age structure represents the proportion of individuals of three ages. I, II and III represent 1–2, 3–4 and 5–6 years, respectively.
Table 2.
Selected nutrient contents of soil in P. edulis stands of different mulching years.
| Treatment | pH | SOC (g·kg−1) | TN (g·kg−1) | TP (g·kg−1) | AN (mg·kg−1) | AP (mg·kg−1) | AK (mg·kg−1) |
|---|---|---|---|---|---|---|---|
| NM | 5.83 ± 0.21 a | 13.50 ± 0.92 c | 1.36 ± 0.13 d | 1.31 ± 0.14 c | 76.56 ± 3.24 b | 29.45 ± 1.33 b | 59.27 ± 3.51 b |
| M1 | 5.72 ± 0.22 a | 15.21 ± 1.21 c | 1.52 ± 0.28 c | 1.37 ± 0.25 c | 91.07 ± 4.81 a | 40.18 ± 1.53 a | 75.32 ± 4.24 a |
| M2 | 5.27 ± 0.15 b | 21.08 ± 1.39 b | 2.02 ± 0.37 b | 1.54 ± 0.31 b | 79.06 ± 3.83 b | 28.79 ± 1.47 b | 57.39 ± 3.84 b |
| M3 | 5.03 ± 0.11 c | 27.56 ± 1.57 a | 2.31 ± 0.33 a | 1.64 ± 0.34 a | 65.98 ± 3.43 c | 21.32 ± 1.29 c | 38.45 ± 2.25 c |
SOC is the soil organic carbon; TN is the total nitrogen; TP is the total phosphorus; AN is the available nitrogen; AP is the available phosphorus; AK is the available potassium. The values are the means ± standard deviations (n = 9). Different lowercase letters in the same column indicate significant differences among different treatments at the p < 0.05 level. NM, M1, M2 and M3 represent no-mulching, mulching for one year, two years and three years, respectively.
Table 3.
Selected enzyme activity of soil in P. edulis stands of different mulching years.
| Treatment | Invertase Activity (mg·g−1) | Urease Activity (mg·g−1) | Acid Phosphatase Activity (mg·g−1) |
|---|---|---|---|
| NM | 13.1 ± 0.95 b | 0.81 ± 0.05 b | 1.77 ± 0.11 b |
| M1 | 14.8 ± 1.03 a | 0.86 ± 0.04 a | 1.95 ± 0.15 a |
| M2 | 13.6 ± 0.84 b | 0.79 ± 0.03 b | 1.81 ± 0.12 b |
| M3 | 10.5 ± 0.82 c | 0.65 ± 0.03 c | 1.40 ± 0.10 c |
The values are the means ± standard deviations (n = 9). Different lowercase letters in the same column indicate significant differences among different treatments at the p < 0.05 level. NM, M1, M2 and M3 represent no-mulching, mulching for one year, two years and three years, respectively.
Table 4.
Mean total microbial phospholipid fatty acids (PLFAs) in P. edulis stands of different mulching years.
Table 4.
Mean total microbial phospholipid fatty acids (PLFAs) in P. edulis stands of different mulching years.
| Treatment | Total PLFAs (nmol·g−1) | Total Bacteria (nmol·g−1) | Aerobic Bacteria (nmol·g−1) | Anaerobic Bacteria (nmol·g−1) | Total Fungi (nmol·g−1) | Total Actinomycetes (nmol·g−1) |
|---|---|---|---|---|---|---|
| NM | 39.64 ± 2.13 b | 21.34 ± 1.05 b | 2.68 ± 0.13 c | 2.44 ± 0.15 d | 10.64 ± 0.79 c | 7.66 ± 0.55 b |
| M1 | 54.62 ± 2.47 a | 28.28 ± 1.24 a | 3.59 ± 0.23 a | 3.17 ± 0.22 c | 13.23 ± 0.93 b | 13.11 ± 0.93 a |
| M2 | 50.05 ± 2.51 a | 26.51 ± 1.52 a | 3.22 ± 0.21 b | 3.84 ± 0.31 b | 15.52 ± 1.21 a | 8.02 ± 0.62 b |
| M3 | 41.62 ± 1.97 b | 19.37 ± 1.13 b | 2.46 ± 0.16 c | 4.08 ± 0.28 a | 16.74 ± 0.98 a | 5.51 ± 0.47 c |
The values are the means ± standard deviations (n = 9). Different lowercase letters in the same column indicate significant differences among different treatments at the p < 0.05 level. NM, M1, M2 and M3 represent no-mulching, mulching for one year, two years and three years, respectively.
© 2018 by the authors. Licensee MDPI, Basel, Switzerland. This article is an open access article distributed under the terms and conditions of the Creative Commons Attribution (CC BY) license (http://creativecommons.org/licenses/by/4.0/).
Share and Cite
MDPI and ACS Style
Zhao, J.; Wang, B.; Li, Q.; Yang, H.; Xu, K. Analysis of Soil Degradation Causes in Phyllostachys edulis Forests with Different Mulching Years. Forests 2018, 9, 149. https://doi.org/10.3390/f9030149
AMA Style
Zhao J, Wang B, Li Q, Yang H, Xu K. Analysis of Soil Degradation Causes in Phyllostachys edulis Forests with Different Mulching Years. Forests. 2018; 9(3):149. https://doi.org/10.3390/f9030149
Chicago/Turabian StyleZhao, Jiancheng, Bo Wang, Qin Li, Hejun Yang, and Kang Xu. 2018. "Analysis of Soil Degradation Causes in Phyllostachys edulis Forests with Different Mulching Years" Forests 9, no. 3: 149. https://doi.org/10.3390/f9030149
Note that from the first issue of 2016, this journal uses article numbers instead of page numbers. See further details here.