Dynamic Shifts in the HIV Proviral Landscape During Long Term Combination Antiretroviral Therapy: Implications for Persistence and Control of HIV Infections

 , ,
, , 
Abstract
:1. Introduction
2. Materials and Methods
2.1. Study Approval
2.2. Samples
2.3. CD4+ T Cell Subset Separation
2.4. DNA Isolation
2.5. Total HIV-1 DNA Quantification
2.6. Integration Site Identification
2.7. Characterizing Proviral Structure
2.8. Statistics
2.9. Data Sharing
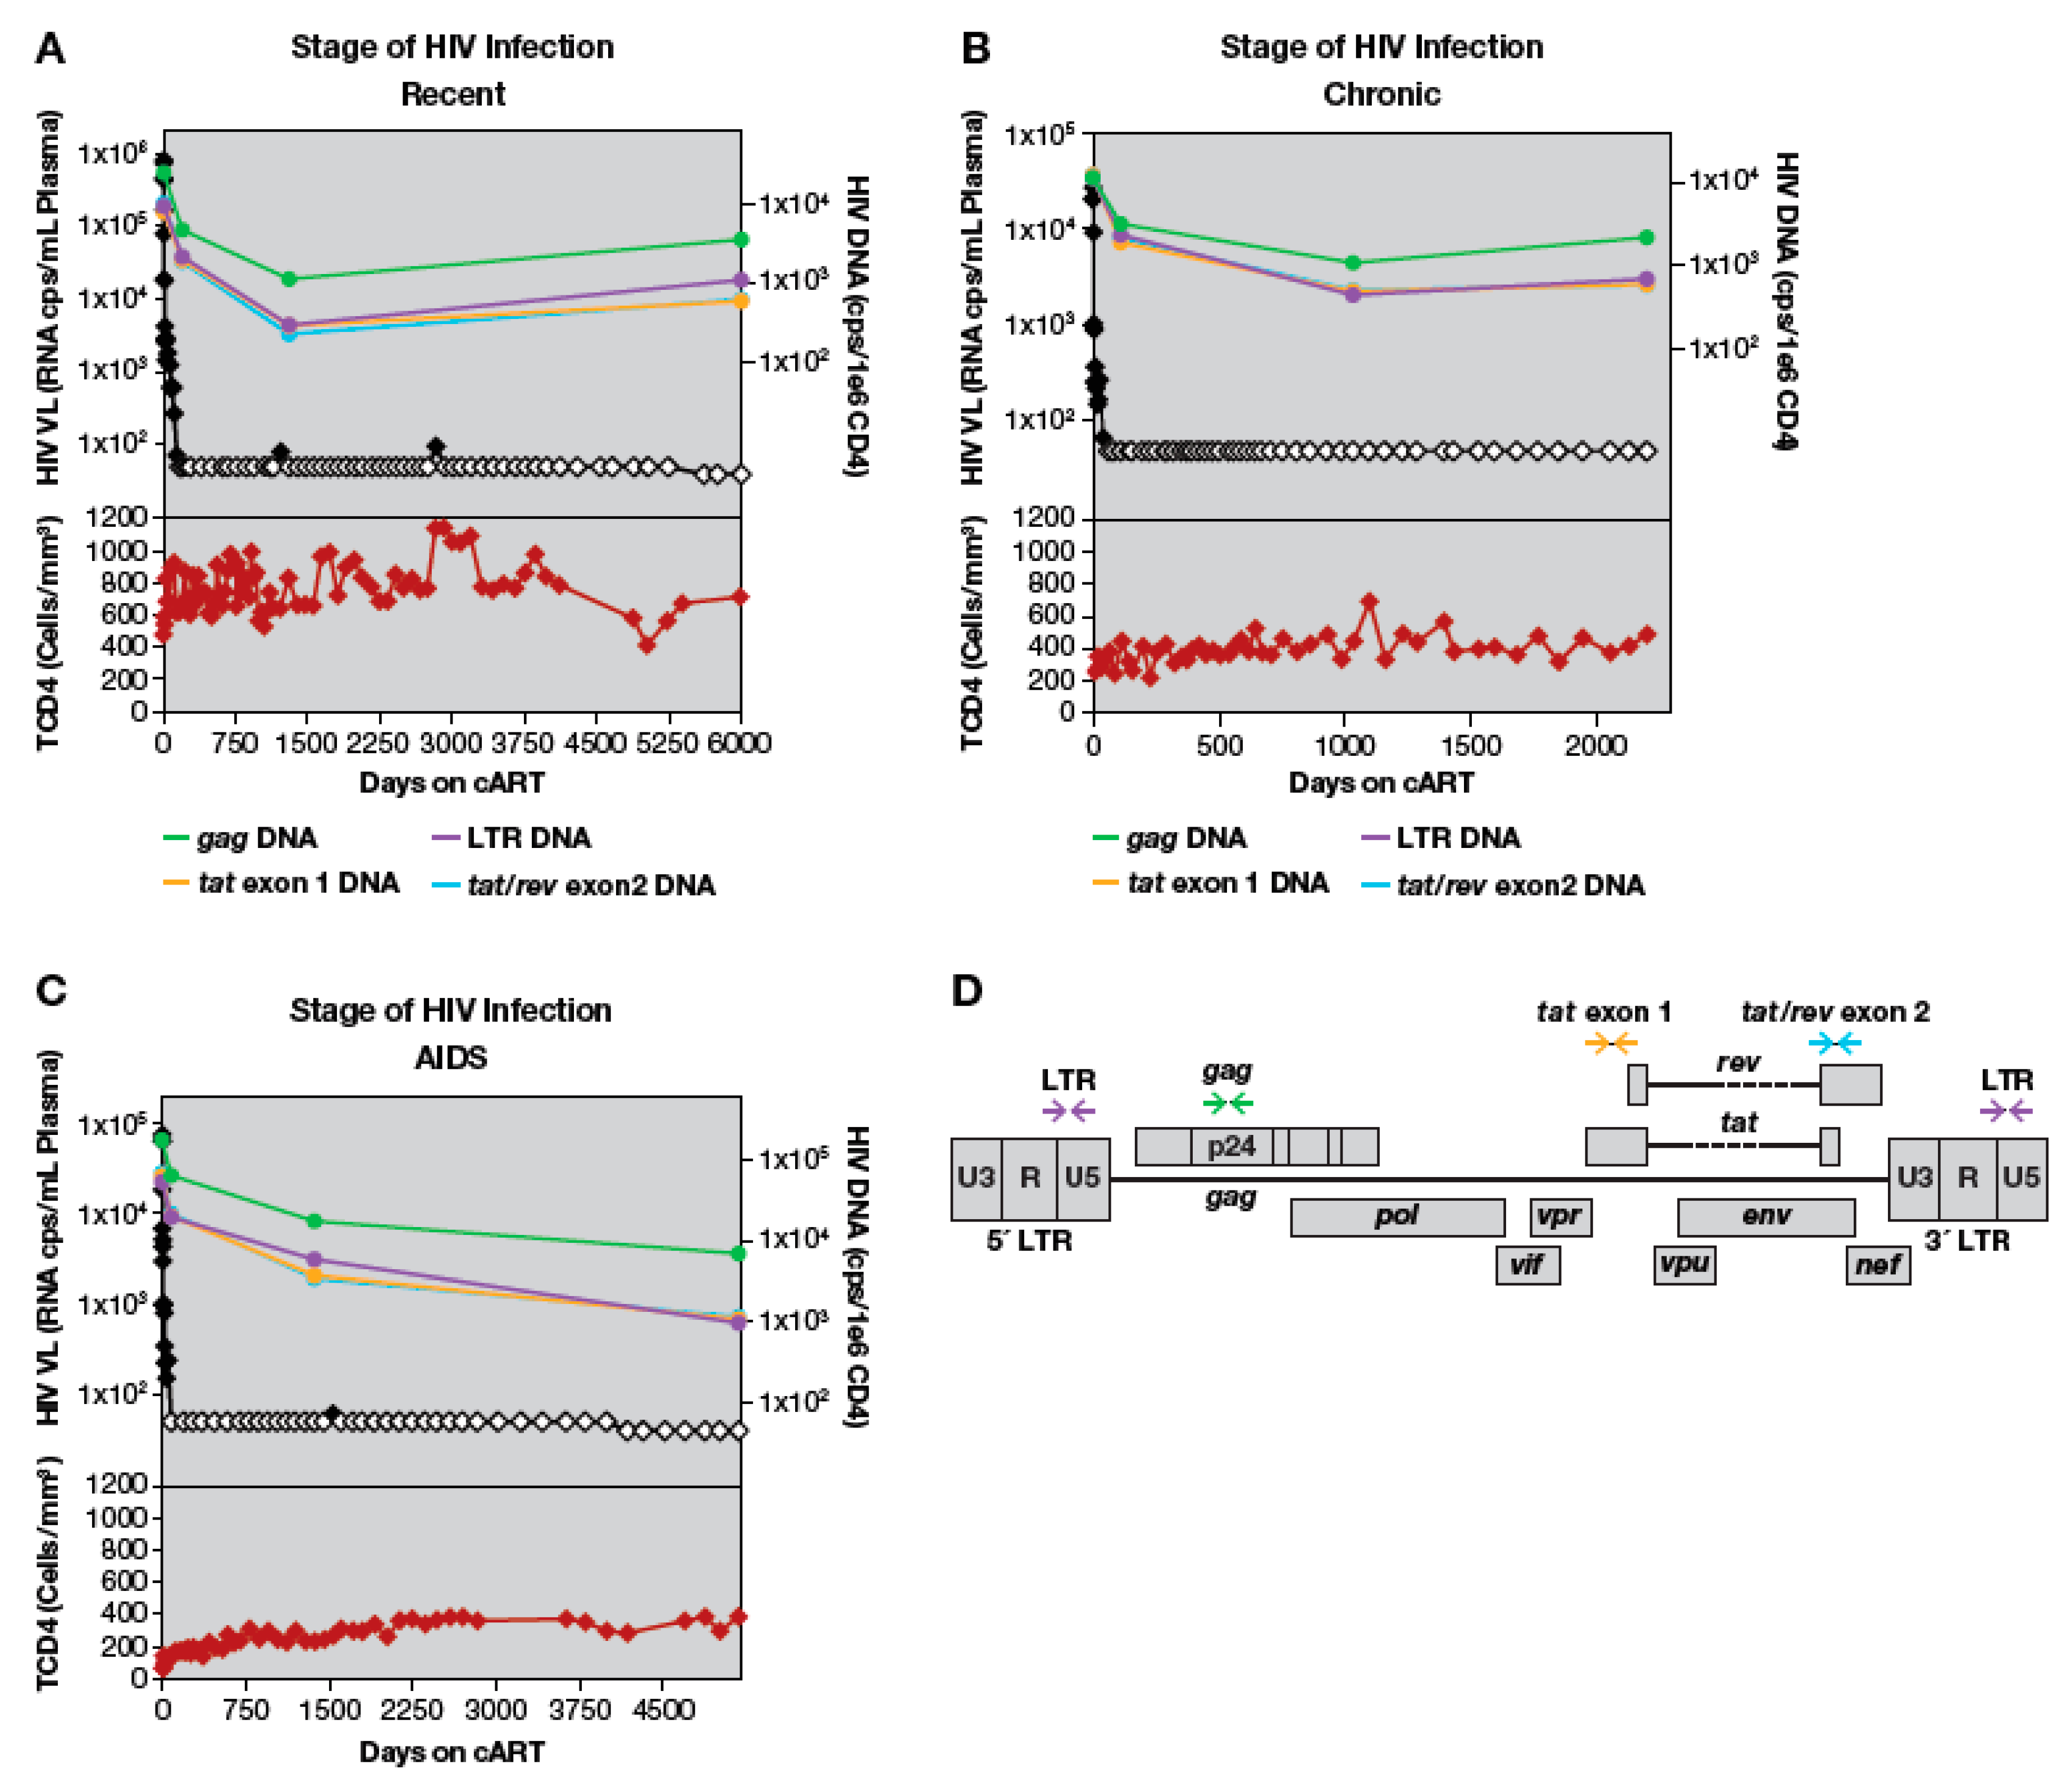
3. Results
3.1. Participants
3.2. HIV-1 DNA Quantification with Multiplexed Droplet Digital PCR Assays
3.3. Loss of LTR and Internal HIV-1 DNA Sequences after Treatment Initiation
3.4. Quantitation of HIV-1 DNA LTR and Internal Sequences Using Multiplexed ddPCR
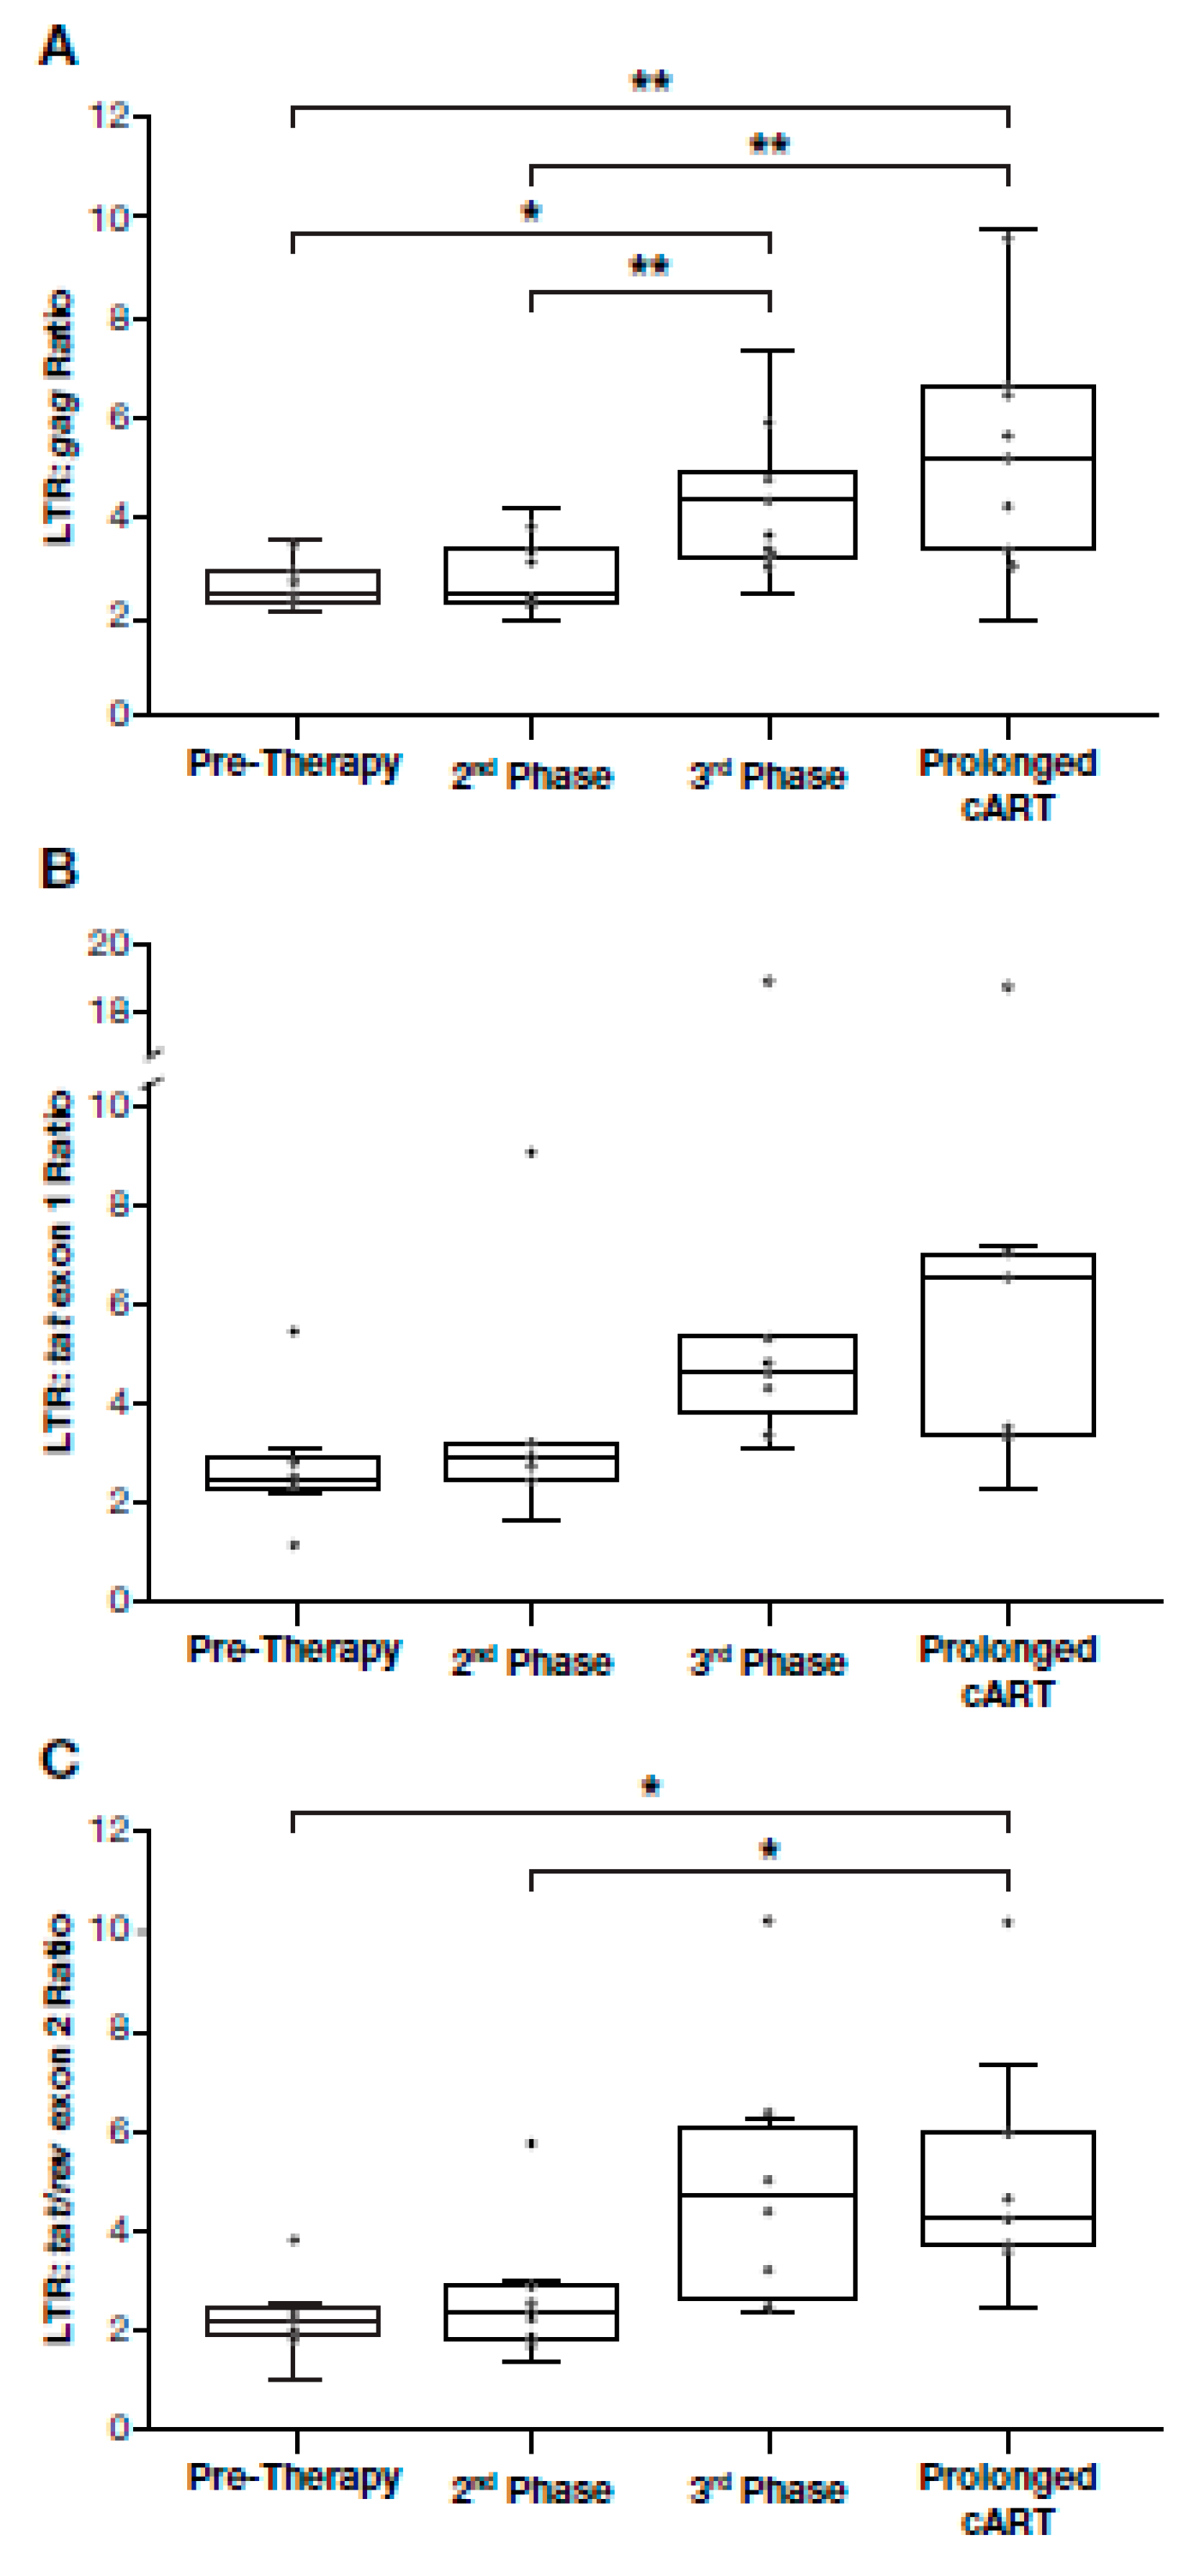
3.5. Proportion of Deleted and/or Highly Defective Proviruses Increases after Long-Term cART
3.6. Dynamics of HIV Proviral Populations after Treatment Interruption
3.7. Changes in the Size of a Large HIV-Infected Clone
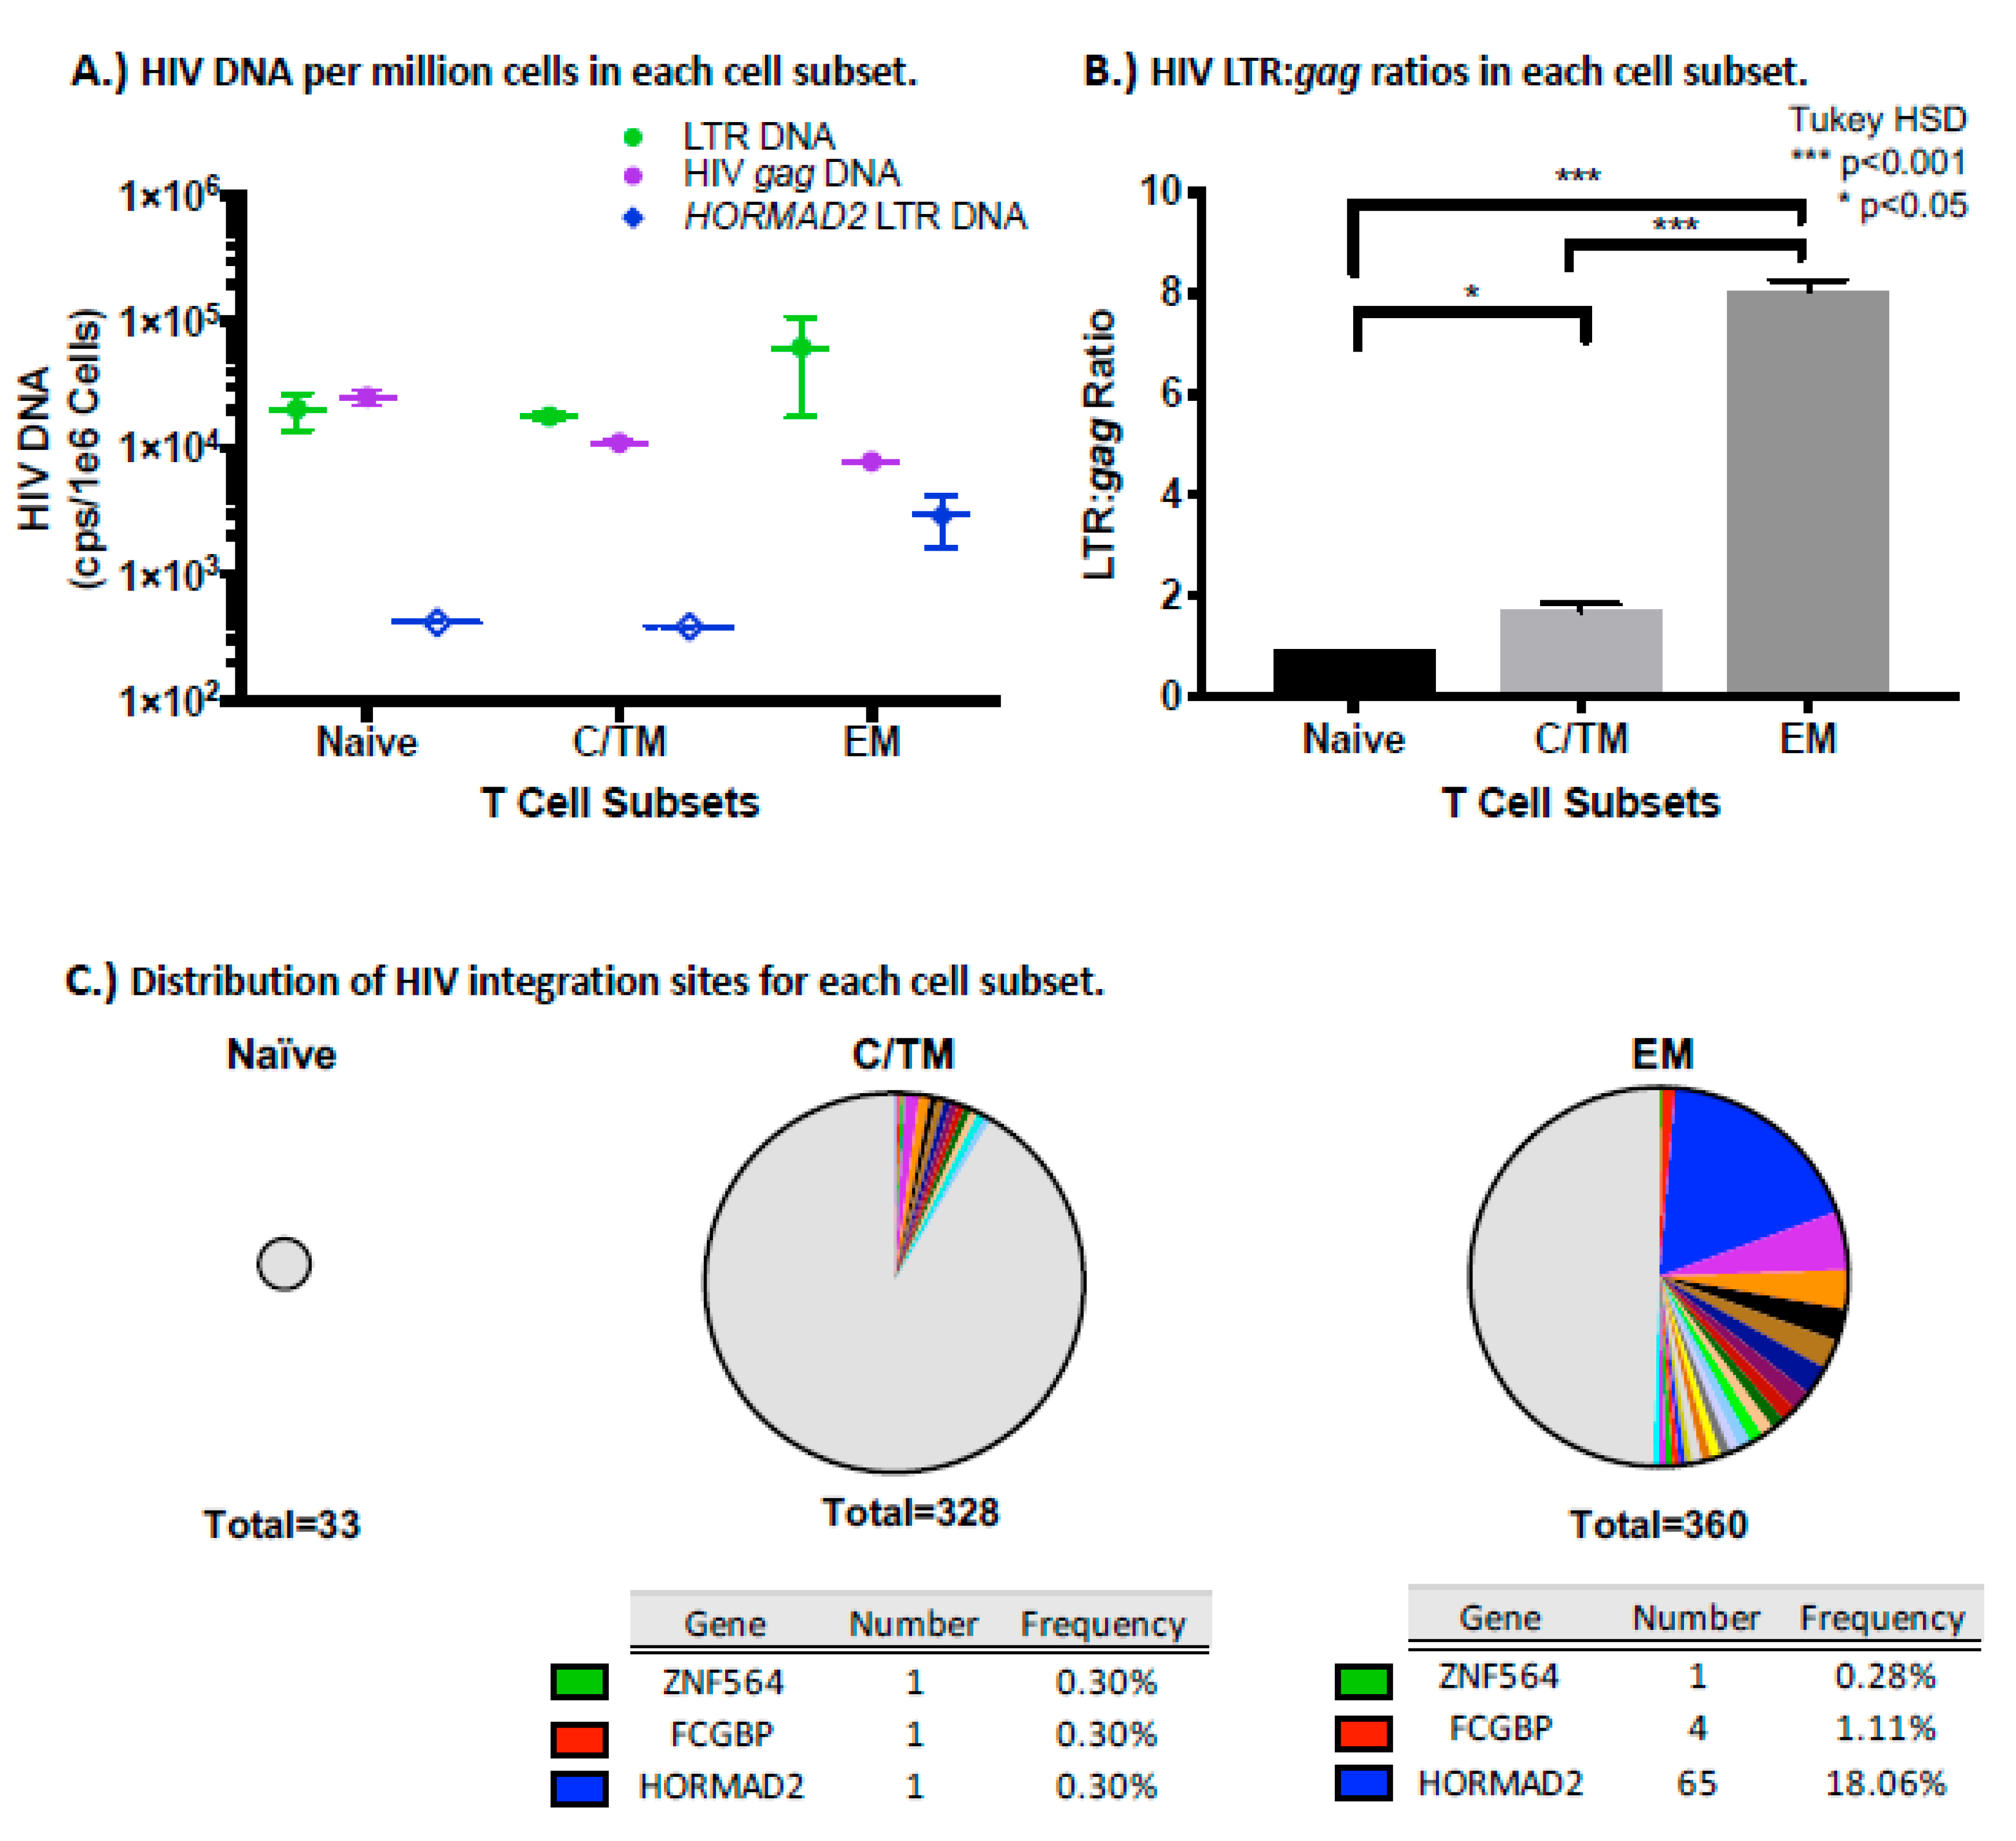
3.8. The HORMAD2 Clone is Enriched in Effector Memory Cells
4. Discussion
Supplementary Materials
Author Contributions
Funding
Acknowledgments
Conflicts of Interest
References
- Kearney, M.F.; Spindler, J.; Shao, W.; Yu, S.; Anderson, E.M.; O'Shea, A.; Rehm, C.; Poethke, C.; Kovacs, N.; Mellors, J.W.; et al. Lack of Detectable HIV-1 Molecular Evolution during Suppressive Antiretroviral Therapy. PLoS Pathog. 2014, 10, e1004010. [Google Scholar] [CrossRef] [PubMed] [Green Version]
- Van Zyl, G.U.; Katusiime, M.G.; Wiegand, A.; McManus, W.R.; Bale, M.J.; Halvas, E.K.; Luke, B.; Boltz, V.F.; Spindler, J.; Laughton, B.; et al. No evidence of HIV replication in children on antiretroviral therapy. J. Clin. Invest. 2017, 127, 3827–3834. [Google Scholar] [CrossRef] [PubMed] [Green Version]
- Bozzi, G.; Simonetti, F.; Watters, S.A.; Anderson, E.M.; Gouzoulis, M.; Kearney, M.; Rote, P.; Lange, C.; Shao, W.; Gorelick, R.; et al. No Evidence of Ongoing HIV Replication or Compartmentalization in Tissues During Combination Antiretroviral Therapy: Implications for HIV Eradication. Sci. Adv. 2019, 5, eaav2045. [Google Scholar] [CrossRef] [PubMed] [Green Version]
- Palella, F.J., Jr.; Delaney, K.M.; Moorman, A.C.; Loveless, M.O.; Fuhrer, J.; Satten, G.A.; Aschman, D.J.; Holmberg, S.D. Declining morbidity and mortality among patients with advanced human immunodeficiency virus infection. HIV Outpatient Study Investigators. N. Engl. J. Med. 1998, 338, 853–860. [Google Scholar] [CrossRef] [PubMed]
- Palella, F.J., Jr.; Baker, R.K.; Moorman, A.C.; Chmiel, J.S.; Wood, K.C.; Brooks, J.T.; Holmberg, S.D.; Investigators, H.I.V.O.S. Mortality in the highly active antiretroviral therapy era: Changing causes of death and disease in the HIV outpatient study. J. Acquir. Immune Defic. Syndr. 2006, 43, 27–34. [Google Scholar] [CrossRef] [Green Version]
- d'Arminio Monforte, A.; Sabin, C.A.; Phillips, A.; Sterne, J.; May, M.; Justice, A.; Dabis, F.; Grabar, S.; Ledergerber, B.; Gill, J.; et al. The changing incidence of AIDS events in patients receiving highly active antiretroviral therapy. Arch. Intern. Med. 2005, 165, 416–423. [Google Scholar] [CrossRef]
- Mocroft, A.; Vella, S.; Benfield, T.L.; Chiesi, A.; Miller, V.; Gargalianos, P.; d'Arminio Monforte, A.; Yust, I.; Bruun, J.N.; Phillips, A.N.; et al. Changing patterns of mortality across Europe in patients infected with HIV-1. EuroSIDA Study Group. Lancet 1998, 352, 1725–1730. [Google Scholar] [CrossRef]
- Wyl, V.; Gianella, S.; Fischer, M.; Niederoest, B.; Kuster, H.; Battegay, M.; Bernasconi, E.; Cavassini, M.; Rauch, A.; Hirschel, B.; et al. Early antiretroviral therapy during primary HIV-1 infection results in a transient reduction of the viral setpoint upon treatment interruption. PLoS ONE 2011, 6, e27463. [Google Scholar] [CrossRef] [Green Version]
- Yerly, S.; Gunthard, H.F.; Fagard, C.; Joos, B.; Perneger, T.V.; Hirschel, B.; Perrin, L.; Swiss, H.I.V.C.S. Proviral HIV-DNA predicts viral rebound and viral setpoint after structured treatment interruptions. AIDS 2004, 18, 1951–1953. [Google Scholar] [CrossRef]
- Davey, R.T., Jr.; Bhat, N.; Yoder, C.; Chun, T.W.; Metcalf, J.A.; Dewar, R.; Natarajan, V.; Lempicki, R.A.; Adelsberger, J.W.; Miller, K.D.; et al. HIV-1 and T cell dynamics after interruption of highly active antiretroviral therapy (HAART) in patients with a history of sustained viral suppression. Proc. Natl. Acad. Sci. USA 1999, 96, 15109–15114. [Google Scholar] [CrossRef] [Green Version]
- Palmer, S.; Maldarelli, F.; Wiegand, A.; Bernstein, B.; Hanna, G.J.; Brun, S.C.; Kempf, D.J.; Mellors, J.W.; Coffin, J.M.; King, M.S. Low-level viremia persists for at least 7 years in patients on suppressive antiretroviral therapy. Proc. Natl. Acad. Sci. USA 2008, 105, 3879–3884. [Google Scholar] [CrossRef] [PubMed] [Green Version]
- Finzi, D.; Blankson, J.; Siliciano, J.D.; Margolick, J.B.; Chadwick, K.; Pierson, T.; Smith, K.; Lisziewicz, J.; Lori, F.; Flexner, C.; et al. Latent infection of CD4+ T cells provides a mechanism for lifelong persistence of HIV-1, even in patients on effective combination therapy. Nat. Med. 1999, 5, 512–517. [Google Scholar] [CrossRef] [PubMed]
- Siliciano, J.D.; Kajdas, J.; Finzi, D.; Quinn, T.C.; Chadwick, K.; Margolick, J.B.; Kovacs, C.; Gange, S.J.; Siliciano, R.F. Long-term follow-up studies confirm the stability of the latent reservoir for HIV-1 in resting CD4+ T cells. Nat. Med. 2003, 9, 727–728. [Google Scholar] [CrossRef] [PubMed]
- Bruner, K.M.; Murray, A.J.; Pollack, R.A.; Soliman, M.G.; Laskey, S.B.; Capoferri, A.A.; Lai, J.; Strain, M.C.; Lada, S.M.; Hoh, R.; et al. Defective proviruses rapidly accumulate during acute HIV-1 infection. Nat. Med. 2016, 22, 1043–1049. [Google Scholar] [CrossRef] [PubMed] [Green Version]
- Ho, Y.C.; Shan, L.; Hosmane, N.N.; Wang, J.; Laskey, S.B.; Rosenbloom, D.I.; Lai, J.; Blankson, J.N.; Siliciano, J.D.; Siliciano, R.F. Replication-competent noninduced proviruses in the latent reservoir increase barrier to HIV-1 cure. Cell 2013, 155, 540–551. [Google Scholar] [CrossRef] [PubMed] [Green Version]
- Maldarelli, F.; Wu, X.; Su, L.; Simonetti, F.R.; Shao, W.; Hill, S.; Spindler, J.; Ferris, A.L.; Mellors, J.W.; Kearney, M.F.; et al. HIV latency. Specific HIV integration sites are linked to clonal expansion and persistence of infected cells. Science 2014, 345, 179–183. [Google Scholar] [CrossRef] [Green Version]
- Bui, J.K.; Sobolewski, M.D.; Keele, B.F.; Spindler, J.; Musick, A.; Wiegand, A.; Luke, B.T.; Shao, W.; Hughes, S.H.; Coffin, J.M.; et al. Proviruses with identical sequences comprise a large fraction of the replication-competent HIV reservoir. PLoS Pathog. 2017, 13, e1006283. [Google Scholar] [CrossRef]
- Ho, D.D.; Neumann, A.U.; Perelson, A.S.; Chen, W.; Leonard, J.M.; Markowitz, M. Rapid turnover of plasma virions and CD4 lymphocytes in HIV-1 infection. Nature 1995, 373, 123–126. [Google Scholar] [CrossRef]
- Perelson, A.S.; Essunger, P.; Cao, Y.; Vesanen, M.; Hurley, A.; Saksela, K.; Markowitz, M.; Ho, D.D. Decay characteristics of HIV-1-infected compartments during combination therapy. Nature 1997, 387, 188–191. [Google Scholar] [CrossRef]
- Perelson, A.S.; Neumann, A.U.; Markowitz, M.; Leonard, J.M.; Ho, D.D. HIV-1 dynamics in vivo: Virion clearance rate, infected cell life-span, and viral generation time. Science 1996, 271, 1582–1586. [Google Scholar] [CrossRef] [Green Version]
- Di Mascio, M.; Ribeiro, R.M.; Markowitz, M.; Ho, D.D.; Perelson, A.S. Modeling the long-term control of viremia in HIV-1 infected patients treated with antiretroviral therapy. Math. Biosci. 2004, 188, 47–62. [Google Scholar] [CrossRef] [PubMed]
- Maldarelli, F.; Palmer, S.; King, M.S.; Wiegand, A.; Polis, M.A.; Mican, J.; Kovacs, J.A.; Davey, R.T.; Rock-Kress, D.; Dewar, R.; et al. ART suppresses plasma HIV-1 RNA to a stable set point predicted by pretherapy viremia. PLoS Pathog. 2007, 3, e46. [Google Scholar] [CrossRef] [PubMed] [Green Version]
- Besson, G.J.; Lalama, C.M.; Bosch, R.J.; Gandhi, R.T.; Bedison, M.A.; Aga, E.; Riddler, S.A.; McMahon, D.K.; Hong, F.; Mellors, J.W. HIV-1 DNA decay dynamics in blood during more than a decade of suppressive antiretroviral therapy. Clin. Infect. Dis. 2014, 59, 1312–1321. [Google Scholar] [CrossRef] [PubMed] [Green Version]
- Crooks, A.M.; Bateson, R.; Cope, A.B.; Dahl, N.P.; Griggs, M.K.; Kuruc, J.D.; Gay, C.L.; Eron, J.J.; Margolis, D.M.; Bosch, R.J.; et al. Precise Quantitation of the Latent HIV-1 Reservoir: Implications for Eradication Strategies. J. Infect. Dis. 2015, 212, 1361–1365. [Google Scholar] [CrossRef] [PubMed]
- Bruner, K.M.; Hosmane, N.N.; Siliciano, R.F. Towards an HIV-1 cure: Measuring the latent reservoir. Trends Microbiol. 2015, 23, 192–203. [Google Scholar] [CrossRef] [PubMed] [Green Version]
- Imamichi, H.; Dewar, R.L.; Adelsberger, J.W.; Rehm, C.A.; O'Doherty, U.; Paxinos, E.E.; Fauci, A.S.; Lane, H.C. Defective HIV-1 proviruses produce novel protein-coding RNA species in HIV-infected patients on combination antiretroviral therapy. Proc. Natl. Acad. Sci. USA 2016, 113, 8783–8788. [Google Scholar] [CrossRef] [Green Version]
- Pollack, R.A.; Jones, R.B.; Pertea, M.; Bruner, K.M.; Martin, A.R.; Thomas, A.S.; Capoferri, A.A.; Beg, S.A.; Huang, S.H.; Karandish, S.; et al. Defective HIV-1 Proviruses Are Expressed and Can Be Recognized by Cytotoxic T Lymphocytes, which Shape the Proviral Landscape. Cell Host Microbe 2017, 21, 494–506.e4. [Google Scholar] [CrossRef] [Green Version]
- Pinzone, M.R.; VanBelzen, D.J.; Weissman, S.; Bertuccio, M.P.; Cannon, L.; Venanzi-Rullo, E.; Migueles, S.; Jones, R.B.; Mota, T.; Joseph, S.B.; et al. Longitudinal HIV sequencing reveals reservoir expression leading to decay which is obscured by clonal expansion. Nat. Commun. 2019, 10, 728. [Google Scholar] [CrossRef]
- Ferdin, J.; Goricar, K.; Dolzan, V.; Plemenitas, A.; Martin, J.N.; Peterlin, B.M.; Deeks, S.G.; Lenassi, M. Viral protein Nef is detected in plasma of half of HIV-infected adults with undetectable plasma HIV RNA. PLoS ONE 2018, 13, e0191613. [Google Scholar] [CrossRef]
- Simonetti, F.R.; Sobolewski, M.D.; Fyne, E.; Shao, W.; Spindler, J.; Hattori, J.; Anderson, E.M.; Watters, S.A.; Hill, S.; Wu, X.; et al. Clonally expanded CD4+ T cells can produce infectious HIV-1 in vivo. Proc. Natl. Acad. Sci. USA 2016, 113, 1883–1888. [Google Scholar] [CrossRef] [Green Version]
- Cohn, L.B.; Silva, I.T.; Oliveira, T.Y.; Rosales, R.A.; Parrish, E.H.; Learn, G.H.; Hahn, B.H.; Czartoski, J.L.; McElrath, M.J.; Lehmann, C.; et al. HIV-1 integration landscape during latent and active infection. Cell 2015, 160, 420–432. [Google Scholar] [CrossRef] [PubMed] [Green Version]
- Wagner, T.A.; McLaughlin, S.; Garg, K.; Cheung, C.Y.; Larsen, B.B.; Styrchak, S.; Huang, H.C.; Edlefsen, P.T.; Mullins, J.I.; Frenkel, L.M. HIV latency. Proliferation of cells with HIV integrated into cancer genes contributes to persistent infection. Science 2014, 345, 570–573. [Google Scholar] [CrossRef] [PubMed] [Green Version]
- Bosque, A.; Famiglietti, M.; Weyrich, A.S.; Goulston, C.; Planelles, V. Homeostatic proliferation fails to efficiently reactivate HIV-1 latently infected central memory CD4+ T cells. PLoS Pathog. 2011, 7, e1002288. [Google Scholar] [CrossRef] [PubMed] [Green Version]
- Musick, A.; Spindler, J.; Boritz, E.; Perez, L.; Crespo-Velez, D.; Patro, S.C.; Sobolewski, M.D.; Bale, M.J.; Reid, C.; Keele, B.F.; et al. HIV Infected T Cells Can Proliferate in vivo Without Inducing Expression of the Integrated Provirus. Front. Microbiol. 2019, 10, 2204. [Google Scholar] [CrossRef] [PubMed]
- Wiegand, A.; Spindler, J.; Hong, F.F.; Shao, W.; Cyktor, J.C.; Cillo, A.R.; Halvas, E.K.; Coffin, J.M.; Mellors, J.W.; Kearney, M.F. Single-cell analysis of HIV-1 transcriptional activity reveals expression of proviruses in expanded clones during ART. Proc. Natl. Acad. Sci. USA 2017, 114, E3659–E3668. [Google Scholar] [CrossRef] [Green Version]
- Anderson, E.M.; Maldarelli, F. The role of integration and clonal expansion in HIV infection: Live long and prosper. Retrovirology 2018, 15, 71. [Google Scholar] [CrossRef]
- Reeves, D.B.; Duke, E.R.; Wagner, T.A.; Palmer, S.E.; Spivak, A.M.; Schiffer, J.T. A majority of HIV persistence during antiretroviral therapy is due to infected cell proliferation. Nat. Commun. 2018, 9, 4811. [Google Scholar] [CrossRef] [Green Version]
- Wang, Z.; Gurule, E.E.; Brennan, T.P.; Gerold, J.M.; Kwon, K.J.; Hosmane, N.N.; Kumar, M.R.; Beg, S.A.; Capoferri, A.A.; Ray, S.C.; et al. Expanded cellular clones carrying replication-competent HIV-1 persist, wax, and wane. Proc. Natl. Acad. Sci. USA 2018, 115, E2575–E2584. [Google Scholar] [CrossRef] [Green Version]
- Pakker, N.G.; Notermans, D.W.; de Boer, R.J.; Roos, M.T.; de Wolf, F.; Hill, A.; Leonard, J.M.; Danner, S.A.; Miedema, F.; Schellekens, P.T. Biphasic kinetics of peripheral blood T cells after triple combination therapy in HIV-1 infection: A composite of redistribution and proliferation. Nat. Med. 1998, 4, 208–214. [Google Scholar] [CrossRef] [Green Version]
- Bucy, R.P.; Hockett, R.D.; Derdeyn, C.A.; Saag, M.S.; Squires, K.; Sillers, M.; Mitsuyasu, R.T.; Kilby, J.M. Initial increase in blood CD4(+) lymphocytes after HIV antiretroviral therapy reflects redistribution from lymphoid tissues. J. Clin. Invest. 1999, 103, 1391–1398. [Google Scholar] [CrossRef]
- Di Mascio, M.; Sereti, I.; Matthews, L.T.; Natarajan, V.; Adelsberger, J.; Lempicki, R.; Yoder, C.; Jones, E.; Chow, C.; Metcalf, J.A.; et al. Naive T-cell dynamics in human immunodeficiency virus type 1 infection: Effects of highly active antiretroviral therapy provide insights into the mechanisms of naive T-cell depletion. J. Virol. 2006, 80, 2665–2674. [Google Scholar] [CrossRef] [PubMed] [Green Version]
- Lewin, S.R.; Ribeiro, R.M.; Kaufmann, G.R.; Smith, D.; Zaunders, J.; Law, M.; Solomon, A.; Cameron, P.U.; Cooper, D.; Perelson, A.S. Dynamics of T cells and TCR excision circles differ after treatment of acute and chronic HIV infection. J. Immunol. 2002, 169, 4657–4666. [Google Scholar] [CrossRef] [PubMed]
- Douek, D.C.; McFarland, R.D.; Keiser, P.H.; Gage, E.A.; Massey, J.M.; Haynes, B.F.; Polis, M.A.; Haase, A.T.; Feinberg, M.B.; Sullivan, J.L.; et al. Changes in thymic function with age and during the treatment of HIV infection. Nature 1998, 396, 690–695. [Google Scholar] [CrossRef] [PubMed]
- Grund, B.; Baker, J.V.; Deeks, S.G.; Wolfson, J.; Wentworth, D.; Cozzi-Lepri, A.; Cohen, C.J.; Phillips, A.; Lundgren, J.D.; Neaton, J.D.; et al. Relevance of Interleukin-6 and D-Dimer for Serious Non-AIDS Morbidity and Death among HIV-Positive Adults on Suppressive Antiretroviral Therapy. PLoS ONE 2016, 11, e0155100. [Google Scholar] [CrossRef]
- Bruner, K.M.; Wang, Z.; Simonetti, F.R.; Bender, A.M.; Kwon, K.J.; Sengupta, S.; Fray, E.J.; Beg, S.A.; Antar, A.A.R.; Jenike, K.M.; et al. A quantitative approach for measuring the reservoir of latent HIV-1 proviruses. Nature 2019, 566, 120–125. [Google Scholar] [CrossRef]
- Avettand-Fenoel, V.; Chaix, M.L.; Blanche, S.; Burgard, M.; Floch, C.; Toure, K.; Allemon, M.C.; Warszawski, J.; Rouzioux, C.; French Pediatric Cohort Study, A.-C.O.G. LTR real-time PCR for HIV-1 DNA quantitation in blood cells for early diagnosis in infants born to seropositive mothers treated in HAART area (ANRS CO 01). J. Med. Virol. 2009, 81, 217–223. [Google Scholar] [CrossRef]
- Ruggiero, A.; De Spiegelaere, W.; Cozzi-Lepri, A.; Kiselinova, M.; Pollakis, G.; Beloukas, A.; Vandekerckhove, L.; Strain, M.; Richman, D.; Phillips, A.; et al. During Stably Suppressive Antiretroviral Therapy Integrated HIV-1 DNA Load in Peripheral Blood is Associated with the Frequency of CD8 Cells Expressing HLA-DR/DP/DQ. EBioMedicine 2015, 2, 1153–1159. [Google Scholar] [CrossRef] [Green Version]
- Bon, I.; Calza, L.; Musumeci, G.; Longo, S.; Bertoldi, A.; D'Urbano, V.; Gibellini, D.; Magistrelli, E.; Viale, P.L.; Re, M.C. Impact of Different Antiretroviral Strategies on Total HIV-DNA Level in Virologically Suppressed HIV-1 Infected Patients. Curr. Hiv Res. 2017, 15, 448–455. [Google Scholar] [CrossRef] [Green Version]
- Strain, M.C.; Lada, S.M.; Luong, T.; Rought, S.E.; Gianella, S.; Terry, V.H.; Spina, C.A.; Woelk, C.H.; Richman, D.D. Highly precise measurement of HIV DNA by droplet digital PCR. PLoS ONE 2013, 8, e55943. [Google Scholar] [CrossRef]
- Yukl, S.A.; Kaiser, P.; Kim, P.; Telwatte, S.; Joshi, S.K.; Vu, M.; Lampiris, H.; Wong, J.K. HIV latency in isolated patient CD4(+) T cells may be due to blocks in HIV transcriptional elongation, completion, and splicing. Sci. Transl. Med. 2018, 10. [Google Scholar] [CrossRef] [Green Version]
- Thomas, J.; Ruggiero, A.; Procopio, F.A.; Pantaleo, G.; Paxton, W.A.; Pollakis, G. Comparative analysis and generation of a robust HIV-1 DNA quantification assay. J. Virol. Methods 2019, 263, 24–31. [Google Scholar] [CrossRef] [PubMed]
- Anderson, E.M.; Maldarelli, F. Quantification of HIV DNA Using Droplet Digital PCR Techniques. Curr. Protoc. Microbiol. 2018, 51, e62. [Google Scholar] [CrossRef] [PubMed]
- Maldarelli, F.; Kearney, M.; Palmer, S.; Stephens, R.; Mican, J.; Polis, M.A.; Davey, R.T.; Kovacs, J.; Shao, W.; Rock-Kress, D.; et al. HIV populations are large and accumulate high genetic diversity in a nonlinear fashion. J. Virol. 2013, 87, 10313–10323. [Google Scholar] [CrossRef] [PubMed] [Green Version]
- Polis, M.A.; Sidorov, I.A.; Yoder, C.; Jankelevich, S.; Metcalf, J.; Mueller, B.U.; Dimitrov, M.A.; Pizzo, P.; Yarchoan, R.; Dimitrov, D.S. Correlation between reduction in plasma HIV-1 RNA concentration 1 week after start of antiretroviral treatment and longer-term efficacy. Lancet 2001, 358, 1760–1765. [Google Scholar] [CrossRef]
- Polis, M.A.; Suzman, D.L.; Yoder, C.P.; Shen, J.M.; Mican, J.M.; Dewar, R.L.; Metcalf, J.A.; Falloon, J.; Davey, R.T., Jr.; Kovacs, J.A.; et al. Suppression of cerebrospinal fluid HIV burden in antiretroviral naive patients on a potent four-drug antiretroviral regimen. AIDS 2003, 17, 1167–1172. [Google Scholar] [CrossRef]
- Boritz, E.A.; Darko, S.; Swaszek, L.; Wolf, G.; Wells, D.; Wu, X.; Henry, A.R.; Laboune, F.; Hu, J.; Ambrozak, D.; et al. Multiple Origins of Virus Persistence during Natural Control of HIV Infection. Cell 2016, 166, 1004–1015. [Google Scholar] [CrossRef] [Green Version]
- Hong, F.; Aga, E.; Cillo, A.R.; Yates, A.L.; Besson, G.; Fyne, E.; Koontz, D.L.; Jennings, C.; Zheng, L.; Mellors, J.W. Novel Assays for Measurement of Total Cell-Associated HIV-1 DNA and RNA. J. Clin. Microbiol. 2016, 54, 902–911. [Google Scholar] [CrossRef] [Green Version]
- Thomas, J.A.; Gagliardi, T.D.; Alvord, W.G.; Lubomirski, M.; Bosche, W.J.; Gorelick, R.J. Human immunodeficiency virus type 1 nucleocapsid zinc-finger mutations cause defects in reverse transcription and integration. Virology 2006, 353, 41–51. [Google Scholar] [CrossRef] [Green Version]
- Palmer, S.; Wiegand, A.P.; Maldarelli, F.; Bazmi, H.; Mican, J.M.; Polis, M.; Dewar, R.L.; Planta, A.; Liu, S.; Metcalf, J.A.; et al. New real-time reverse transcriptase-initiated PCR assay with single-copy sensitivity for human immunodeficiency virus type 1 RNA in plasma. J. Clin. Microbiol. 2003, 41, 4531–4536. [Google Scholar] [CrossRef] [Green Version]
- Sunshine, S.; Kirchner, R.; Amr, S.S.; Mansur, L.; Shakhbatyan, R.; Kim, M.; Bosque, A.; Siliciano, R.F.; Planelles, V.; Hofmann, O.; et al. HIV Integration Site Analysis of Cellular Models of HIV Latency with a Probe-Enriched Next-Generation Sequencing Assay. J. Virol. 2016, 90, 4511–4519. [Google Scholar] [CrossRef] [Green Version]
- Symons, J.; Chopra, A.; Malatinkova, E.; De Spiegelaere, W.; Leary, S.; Cooper, D.; Abana, C.O.; Rhodes, A.; Rezaei, S.D.; Vandekerckhove, L.; et al. HIV integration sites in latently infected cell lines: Evidence of ongoing replication. Retrovirology 2017, 14, 2. [Google Scholar] [CrossRef] [PubMed] [Green Version]
- Besansky, N.J.; Butera, S.T.; Sinha, S.; Folks, T.M. Unintegrated human immunodeficiency virus type 1 DNA in chronically infected cell lines is not correlated with surface CD4 expression. J. Virol. 1991, 65, 2695–2698. [Google Scholar] [CrossRef] [PubMed] [Green Version]
- Rutsaert, S.; Bosman, K.; Trypsteen, W.; Nijhuis, M.; Vandekerckhove, L. Digital PCR as a tool to measure HIV persistence. Retrovirology 2018, 15, 16. [Google Scholar] [CrossRef] [PubMed] [Green Version]
- Trypsteen, W.; Kiselinova, M.; Vandekerckhove, L.; De Spiegelaere, W. Diagnostic utility of droplet digital PCR for HIV reservoir quantification. J. Virus Erad. 2016, 2, 162–169. [Google Scholar]
- Kiselinova, M.; Pasternak, A.O.; De Spiegelaere, W.; Vogelaers, D.; Berkhout, B.; Vandekerckhove, L. Comparison of droplet digital PCR and seminested real-time PCR for quantification of cell-associated HIV-1 RNA. PLoS ONE 2014, 9, e85999. [Google Scholar] [CrossRef] [Green Version]
- Hindson, B.J.; Ness, K.D.; Masquelier, D.A.; Belgrader, P.; Heredia, N.J.; Makarewicz, A.J.; Bright, I.J.; Lucero, M.Y.; Hiddessen, A.L.; Legler, T.C.; et al. High-throughput droplet digital PCR system for absolute quantitation of DNA copy number. Anal. Chem. 2011, 83, 8604–8610. [Google Scholar] [CrossRef]
- Nadler, S.B.; Hidalgo, J.H.; Bloch, T. Prediction of blood volume in normal human adults. Surgery 1962, 51, 224–232. [Google Scholar]
- Estes, J.D.; Kityo, C.; Ssali, F.; Swainson, L.; Makamdop, K.N.; Del Prete, G.Q.; Deeks, S.G.; Luciw, P.A.; Chipman, J.G.; Beilman, G.J.; et al. Defining total-body AIDS-virus burden with implications for curative strategies. Nat. Med. 2017, 23, 1271–1276. [Google Scholar] [CrossRef] [Green Version]
- Dynamics of HIV Decay and Persistence After Initiating Antiretroviral Therapy; Catholic University of America: Washington, DC, USA, 2019.
- Shao, W.; Shan, J.; Kearney, M.F.; Wu, X.; Maldarelli, F.; Mellors, J.W.; Luke, B.; Coffin, J.M.; Hughes, S.H. Retrovirus Integration Database (RID): A public database for retroviral insertion sites into host genomes. Retrovirology 2016, 13, 47. [Google Scholar] [CrossRef] [Green Version]
- Coffin, J.M. HIV population dynamics in vivo: Implications for genetic variation, pathogenesis, and therapy. Science 1995, 267, 483–489. [Google Scholar] [CrossRef] [Green Version]
- Clouse, K.A.; Powell, D.; Washington, I.; Poli, G.; Strebel, K.; Farrar, W.; Barstad, P.; Kovacs, J.; Fauci, A.S.; Folks, T.M. Monokine regulation of human immunodeficiency virus-1 expression in a chronically infected human T cell clone. J. Immunol. 1989, 142, 431–438. [Google Scholar]
- Folks, T.M.; Clouse, K.A.; Justement, J.; Rabson, A.; Duh, E.; Kehrl, J.H.; Fauci, A.S. Tumor necrosis factor alpha induces expression of human immunodeficiency virus in a chronically infected T-cell clone. Proc. Natl. Acad. Sci. USA 1989, 86, 2365–2368. [Google Scholar] [CrossRef] [PubMed] [Green Version]
- Joos, B.; Fischer, M.; Kuster, H.; Pillai, S.K.; Wong, J.K.; Boni, J.; Hirschel, B.; Weber, R.; Trkola, A.; Gunthard, H.F.; et al. HIV rebounds from latently infected cells, rather than from continuing low-level replication. Proc. Natl. Acad. Sci. USA 2008, 105, 16725–16730. [Google Scholar] [CrossRef] [PubMed] [Green Version]
- Clarridge, K.E.; Blazkova, J.; Einkauf, K.; Petrone, M.; Refsland, E.W.; Justement, J.S.; Shi, V.; Huiting, E.D.; Seamon, C.A.; Lee, G.Q.; et al. Effect of analytical treatment interruption and reinitiation of antiretroviral therapy on HIV reservoirs and immunologic parameters in infected individuals. PLoS Pathog. 2018, 14, e1006792. [Google Scholar] [CrossRef] [PubMed] [Green Version]
- Salantes, D.B.; Zheng, Y.; Mampe, F.; Srivastava, T.; Beg, S.; Lai, J.; Li, J.Z.; Tressler, R.L.; Koup, R.A.; Hoxie, J.; et al. HIV-1 latent reservoir size and diversity are stable following brief treatment interruption. J. Clin. Invest. 2018. [Google Scholar] [CrossRef] [PubMed] [Green Version]
- Hughes, S.H.; Toyoshima, K.; Bishop, J.M.; Varmus, H.E. Organization of the endogenous proviruses of chickens: Implications for origin and expression. Virology 1981, 108, 189–207. [Google Scholar] [CrossRef]
- Westaway, D.; Payne, G.; Varmus, H.E. Proviral deletions and oncogene base-substitutions in insertionally mutagenized c-myc alleles may contribute to the progression of avian bursal tumors. Proc. Natl. Acad. Sci. USA 1984, 81, 843–847. [Google Scholar] [CrossRef] [Green Version]
- Farber, D.L.; Yudanin, N.A.; Restifo, N.P. Human memory T cells: Generation, compartmentalization and homeostasis. Nat. Rev. Immunol. 2014, 14, 24–35. [Google Scholar] [CrossRef]
- Sallusto, F.; Geginat, J.; Lanzavecchia, A. Central memory and effector memory T cell subsets: Function, generation, and maintenance. Annu. Rev. Immunol. 2004, 22, 745–763. [Google Scholar] [CrossRef]
- Sallusto, F.; Lenig, D.; Forster, R.; Lipp, M.; Lanzavecchia, A. Two subsets of memory T lymphocytes with distinct homing potentials and effector functions. Nature 1999, 401, 708–712. [Google Scholar] [CrossRef]
- Riou, C.; Yassine-Diab, B.; Van grevenynghe, J.; Somogyi, R.; Greller, L.D.; Gagnon, D.; Gimmig, S.; Wilkinson, P.; Shi, Y.; Cameron, M.J.; et al. Convergence of TCR and cytokine signaling leads to FOXO3a phosphorylation and drives the survival of CD4+ central memory T cells. J. Exp. Med. 2007, 204, 79–91. [Google Scholar] [CrossRef] [Green Version]
- Hiener, B.; Horsburgh, B.A.; Eden, J.S.; Barton, K.; Schlub, T.E.; Lee, E.; von Stockenstrom, S.; Odevall, L.; Milush, J.M.; Liegler, T.; et al. Identification of Genetically Intact HIV-1 Proviruses in Specific CD4(+) T Cells from Effectively Treated Participants. Cell Rep. 2017, 21, 813–822. [Google Scholar] [CrossRef] [Green Version]
- Mager, D.L.; Goodchild, N.L. Homologous recombination between the LTRs of a human retrovirus-like element causes a 5-kb deletion in two siblings. Am. J. Hum. Genet. 1989, 45, 848–854. [Google Scholar]
- Jern, P.; Coffin, J.M. Effects of retroviruses on host genome function. Annu. Rev. Genet. 2008, 42, 709–732. [Google Scholar] [CrossRef] [Green Version]
- Subramanian, R.P.; Wildschutte, J.H.; Russo, C.; Coffin, J.M. Identification, characterization, and comparative genomic distribution of the HERV-K (HML-2) group of human endogenous retroviruses. Retrovirology 2011, 8, 90. [Google Scholar] [CrossRef] [Green Version]
- Einkauf, K.B.; Lee, G.Q.; Gao, C.; Sharaf, R.; Sun, X.; Hua, S.; Chen, S.M.; Jiang, C.; Lian, X.; Chowdhury, F.Z.; et al. Intact HIV-1 proviruses accumulate at distinct chromosomal positions during prolonged antiretroviral therapy. J. Clin. Invest. 2019, 129, 988–998. [Google Scholar] [CrossRef] [Green Version]
- Fromentin, R.; Massanella, M.; Vandergeeten, C.; Barton, K.; Hiener, B.; Chiu, W.; Looney, D.J.; Ramgopal, M.; Richman, D.; Trautmann, L.; et al. In vivo massive expansion of a T-cell clone carrying a defective HIV genome: Implication for the measurement of the HIV reservoir. In Proceedings of the International AIDS Society Conference on HIV Science, Paris, France, 24 July 2017. [Google Scholar]
- Sandler, N.G.; Wand, H.; Roque, A.; Law, M.; Nason, M.C.; Nixon, D.E.; Pedersen, C.; Ruxrungtham, K.; Lewin, S.R.; Emery, S.; et al. Plasma levels of soluble CD14 independently predict mortality in HIV infection. J. Infect. Dis. 2011, 203, 780–790. [Google Scholar] [CrossRef] [Green Version]
- Margolis, D.M.; Archin, N.M. Proviral Latency, Persistent Human Immunodeficiency Virus Infection, and the Development of Latency Reversing Agents. J. Infect. Dis. 2017, 215, S111–S118. [Google Scholar] [CrossRef] [Green Version]
- O'Doherty, U.; Swiggard, W.J.; Jeyakumar, D.; McGain, D.; Malim, M.H. A sensitive, quantitative assay for human immunodeficiency virus type 1 integration. J. Virol. 2002, 76, 10942–10950. [Google Scholar] [CrossRef] [Green Version]
- Strongin, Z.; Sharaf, R.; VanBelzen, D.J.; Jacobson, J.M.; Connick, E.; Volberding, P.; Skiest, D.J.; Gandhi, R.T.; Kuritzkes, D.R.; O'Doherty, U.; et al. Effect of Short-Term Antiretroviral Therapy Interruption on Levels of Integrated HIV DNA. J. Virol. 2018, 92. [Google Scholar] [CrossRef] [Green Version]
- Lada, S.M.; Huang, K.; VanBelzen, D.J.; Montaner, L.J.; O'Doherty, U.; Richman, D.D. Quantitation of Integrated HIV Provirus by Pulsed-Field Gel Electrophoresis and Droplet Digital PCR. J. Clin. Microbiol. 2018, 56. [Google Scholar] [CrossRef] [Green Version]


© 2020 by the authors. Licensee MDPI, Basel, Switzerland. This article is an open access article distributed under the terms and conditions of the Creative Commons Attribution (CC BY) license (http://creativecommons.org/licenses/by/4.0/).
Share and Cite
Anderson, E.M.; Simonetti, F.R.; Gorelick, R.J.; Hill, S.; Gouzoulis, M.A.; Bell, J.; Rehm, C.; Pérez, L.; Boritz, E.; Wu, X.; et al. Dynamic Shifts in the HIV Proviral Landscape During Long Term Combination Antiretroviral Therapy: Implications for Persistence and Control of HIV Infections. Viruses 2020, 12, 136. https://doi.org/10.3390/v12020136
Anderson EM, Simonetti FR, Gorelick RJ, Hill S, Gouzoulis MA, Bell J, Rehm C, Pérez L, Boritz E, Wu X, et al. Dynamic Shifts in the HIV Proviral Landscape During Long Term Combination Antiretroviral Therapy: Implications for Persistence and Control of HIV Infections. Viruses. 2020; 12(2):136. https://doi.org/10.3390/v12020136
Chicago/Turabian StyleAnderson, Elizabeth M., Francesco R. Simonetti, Robert J. Gorelick, Shawn Hill, Monica A. Gouzoulis, Jennifer Bell, Catherine Rehm, Liliana Pérez, Eli Boritz, Xiaolin Wu, and et al. 2020. "Dynamic Shifts in the HIV Proviral Landscape During Long Term Combination Antiretroviral Therapy: Implications for Persistence and Control of HIV Infections" Viruses 12, no. 2: 136. https://doi.org/10.3390/v12020136