
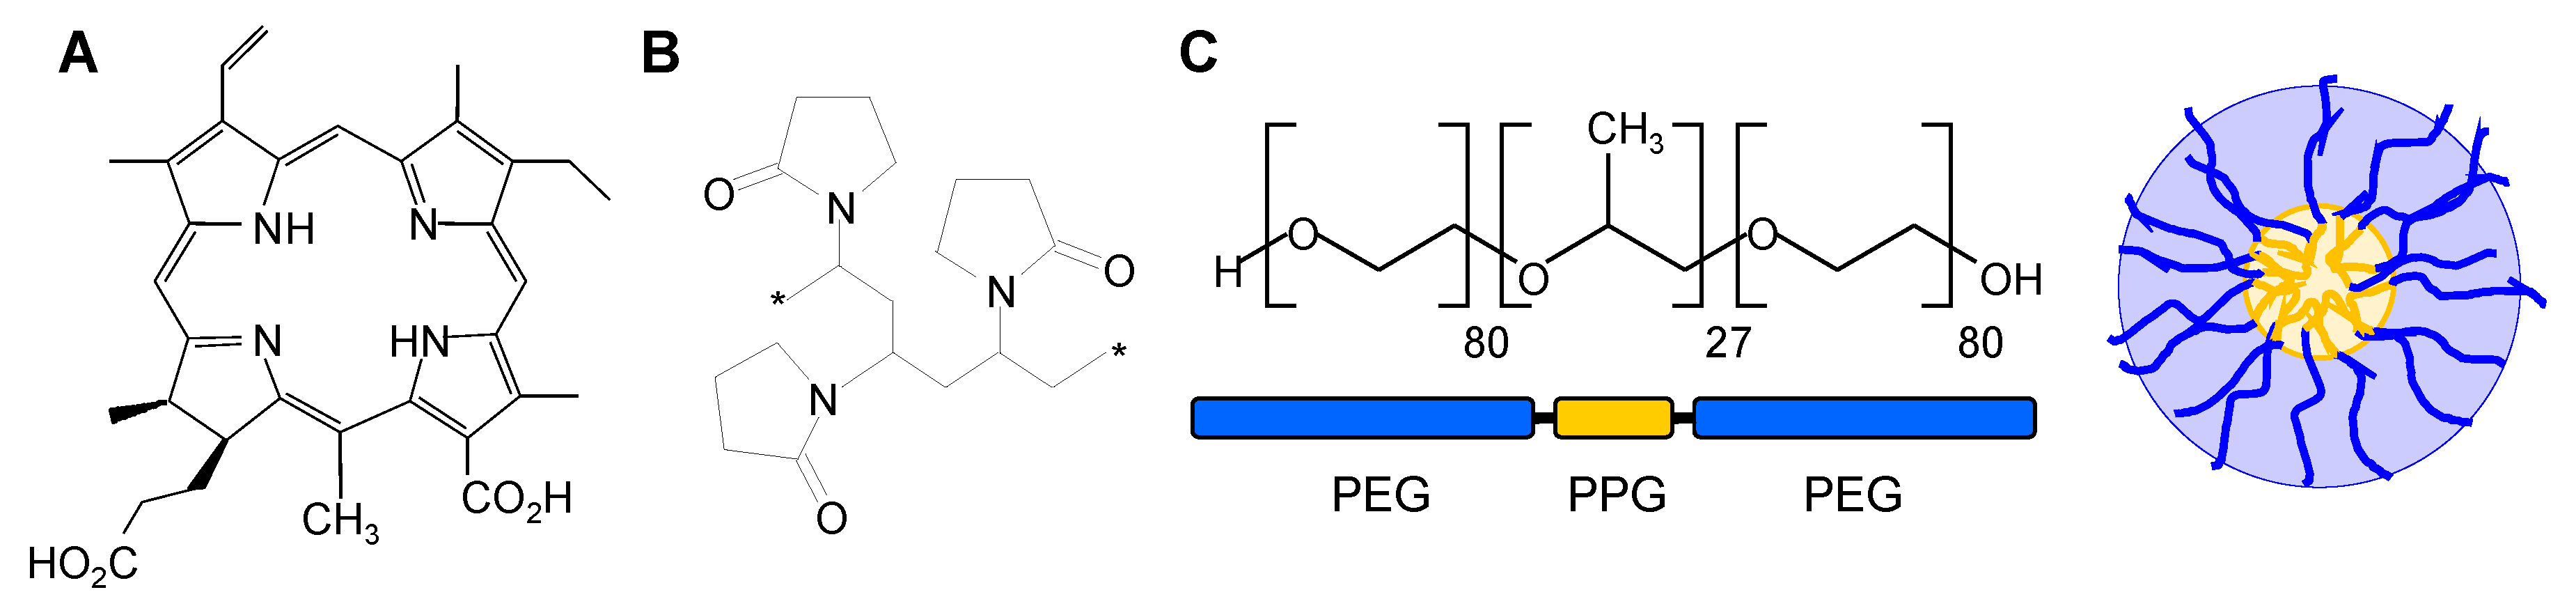
Intracellular Fate of the Photosensitizer Chlorin e4 with Different Carriers and Induced Metabolic Changes Studied by 1H NMR Spectroscopy

Abstract
:
1. Introduction
2. Materials and Methods
2.1. Chemicals
2.2. Cell Culture
2.3. Cellular Uptake by Flow Cytometry
2.4. Sample Classes for 1H HR-MAS NMR Spectroscopy
2.5. Preparation of the Loading Media i–xiii
2.6. Preparation of Cell Samples for 1H HR-MAS NMR Spectroscopy
2.7. 1H HR-MAS NMR Spectroscopy–Data Acquisition
2.8. Processing of 1H HR-MAS NMR Spectra
2.9. Data Analysis
3. Results and Discussion
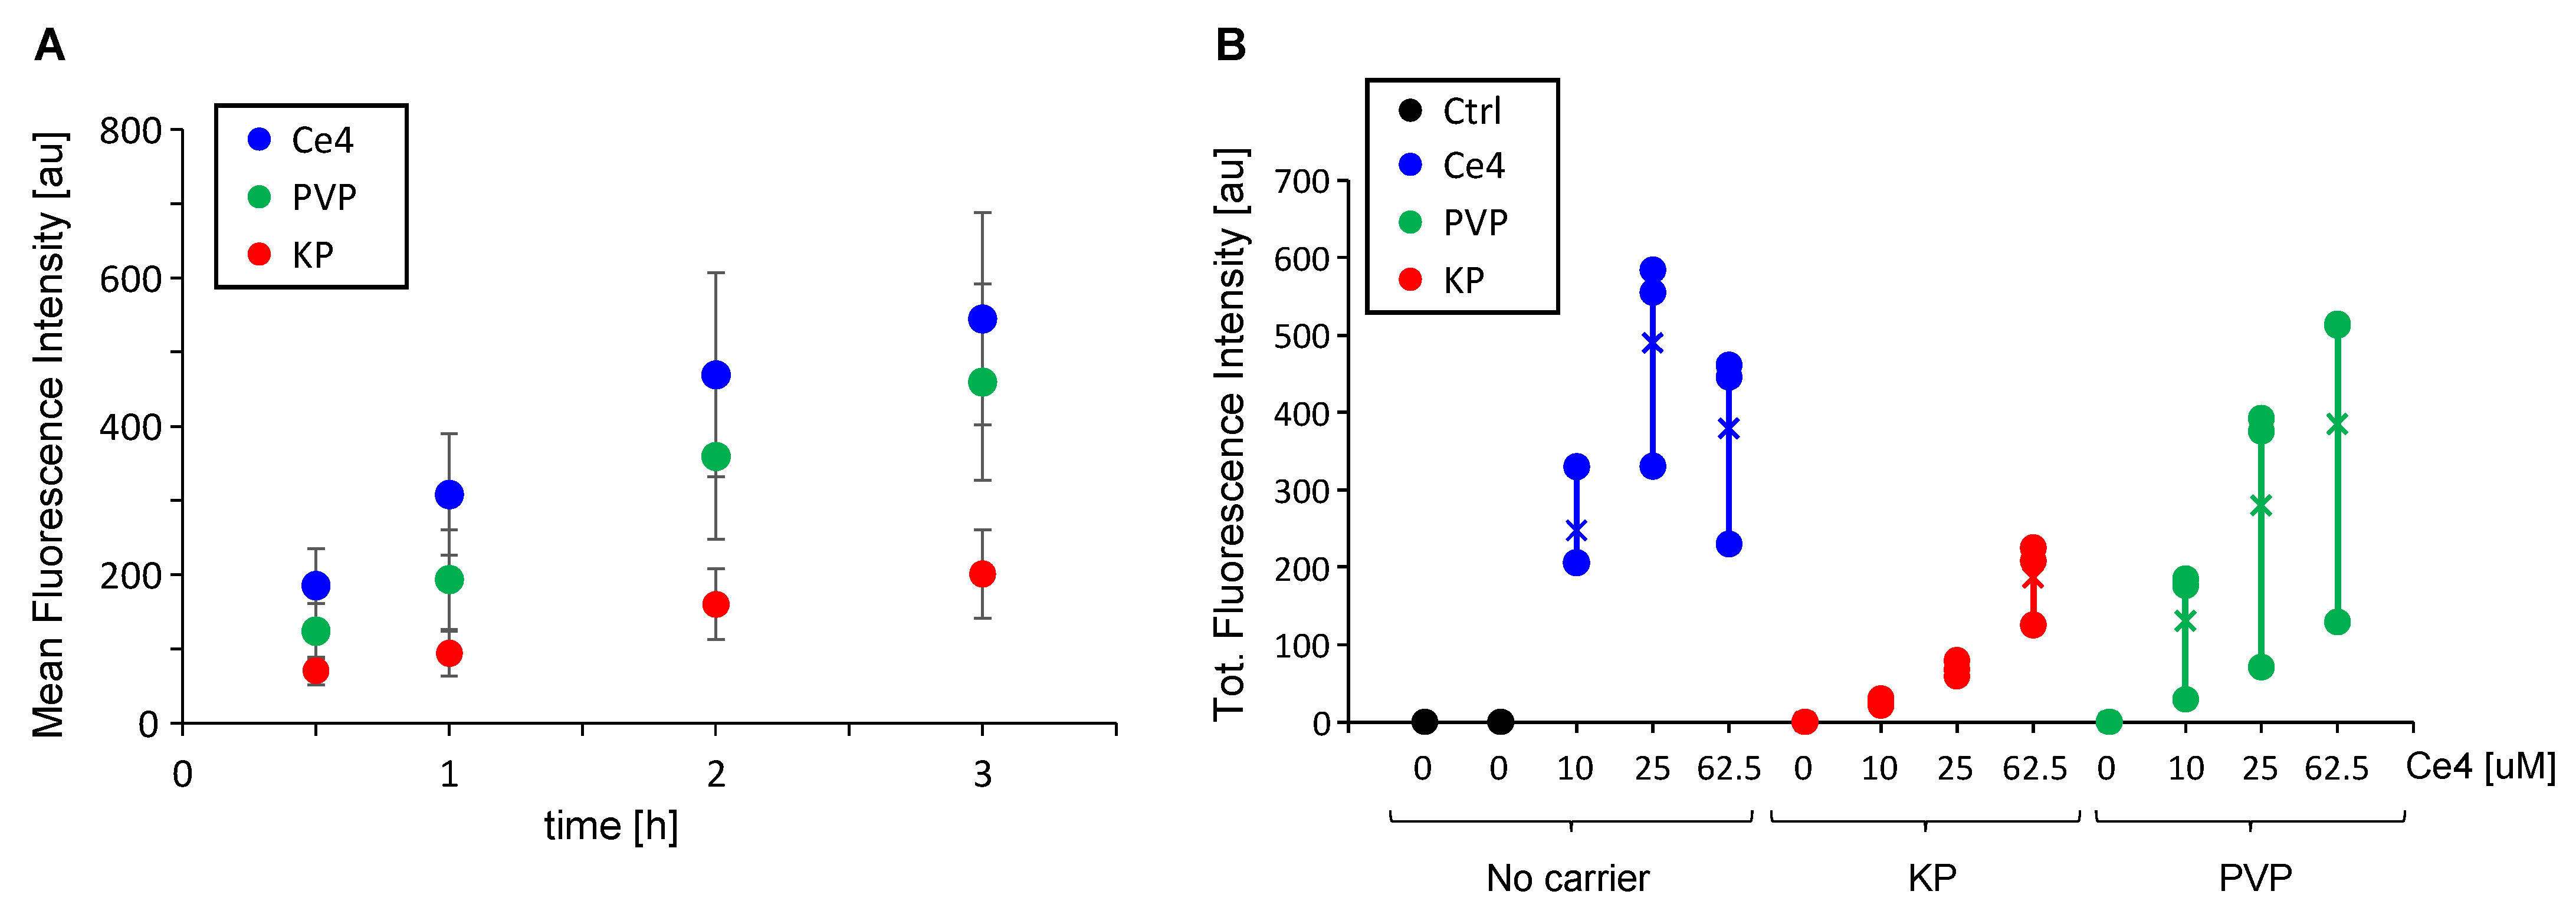
3.1. Cell Uptake of Ce4 and the Polymeric Carriers PVP and KP
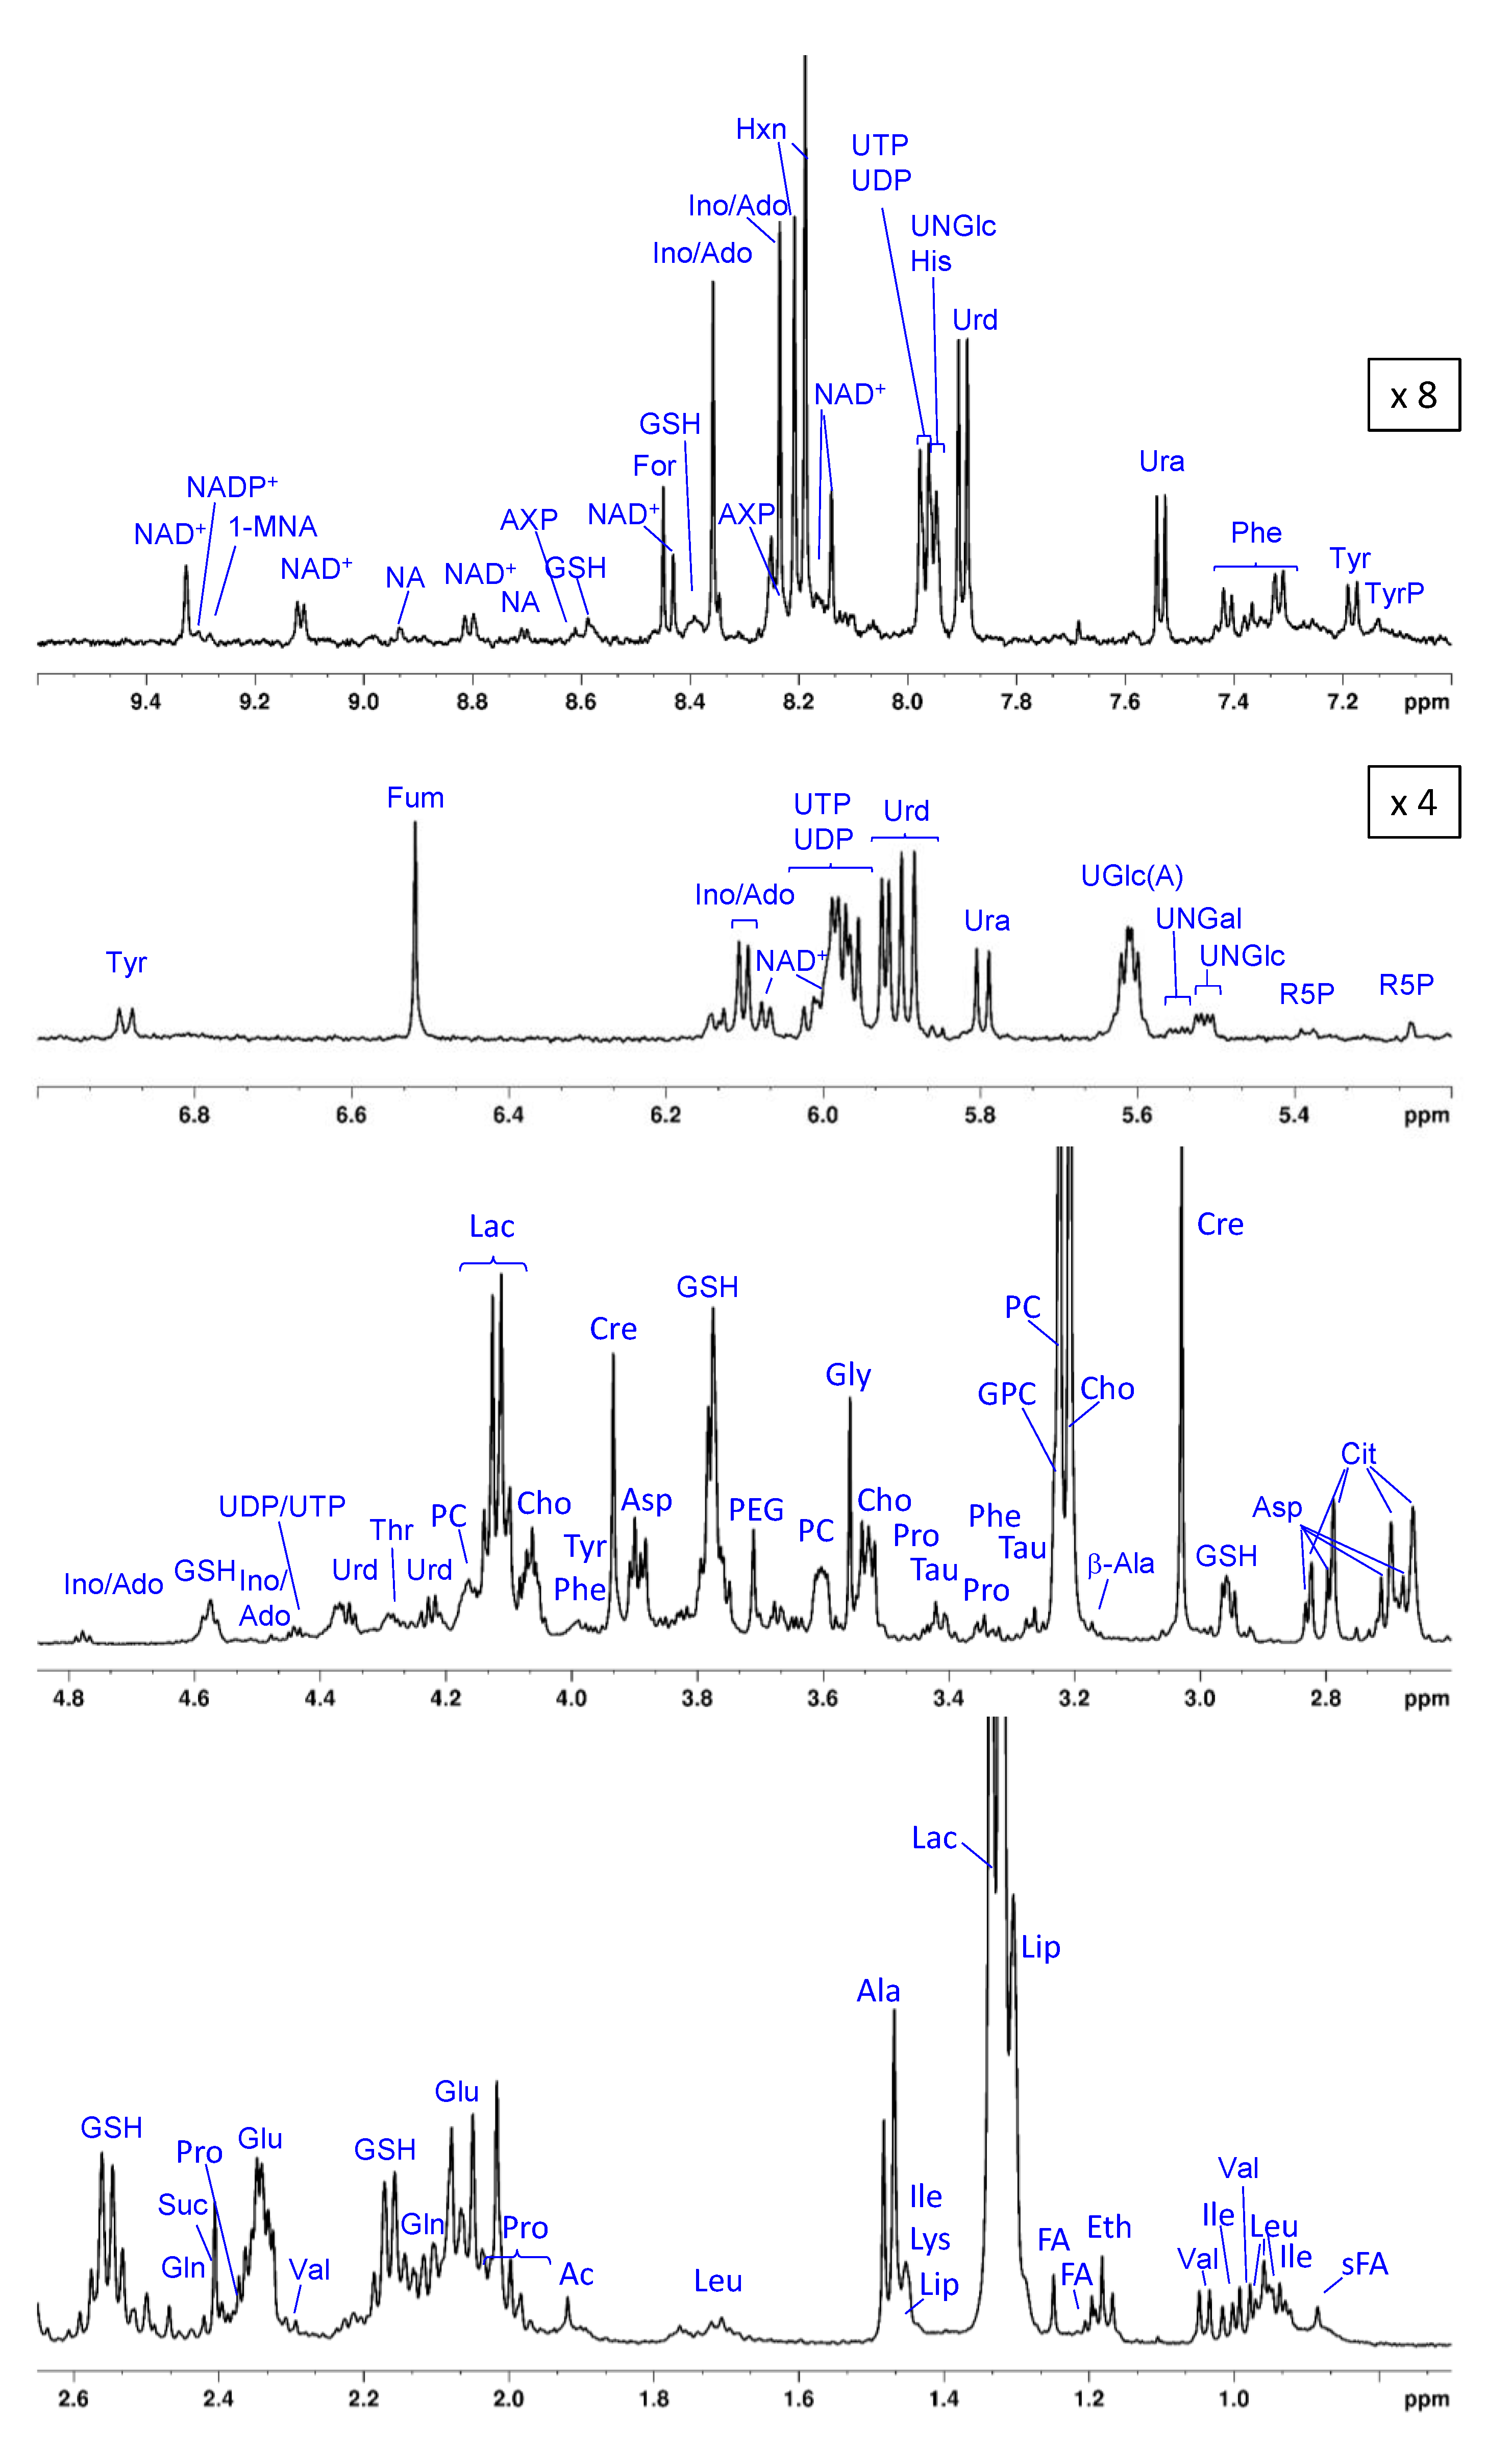
3.2. The Metabolic Profile of Treated and Untreated HeLa Cells: T2-Edited 1H HR-MAS NMR Spectra
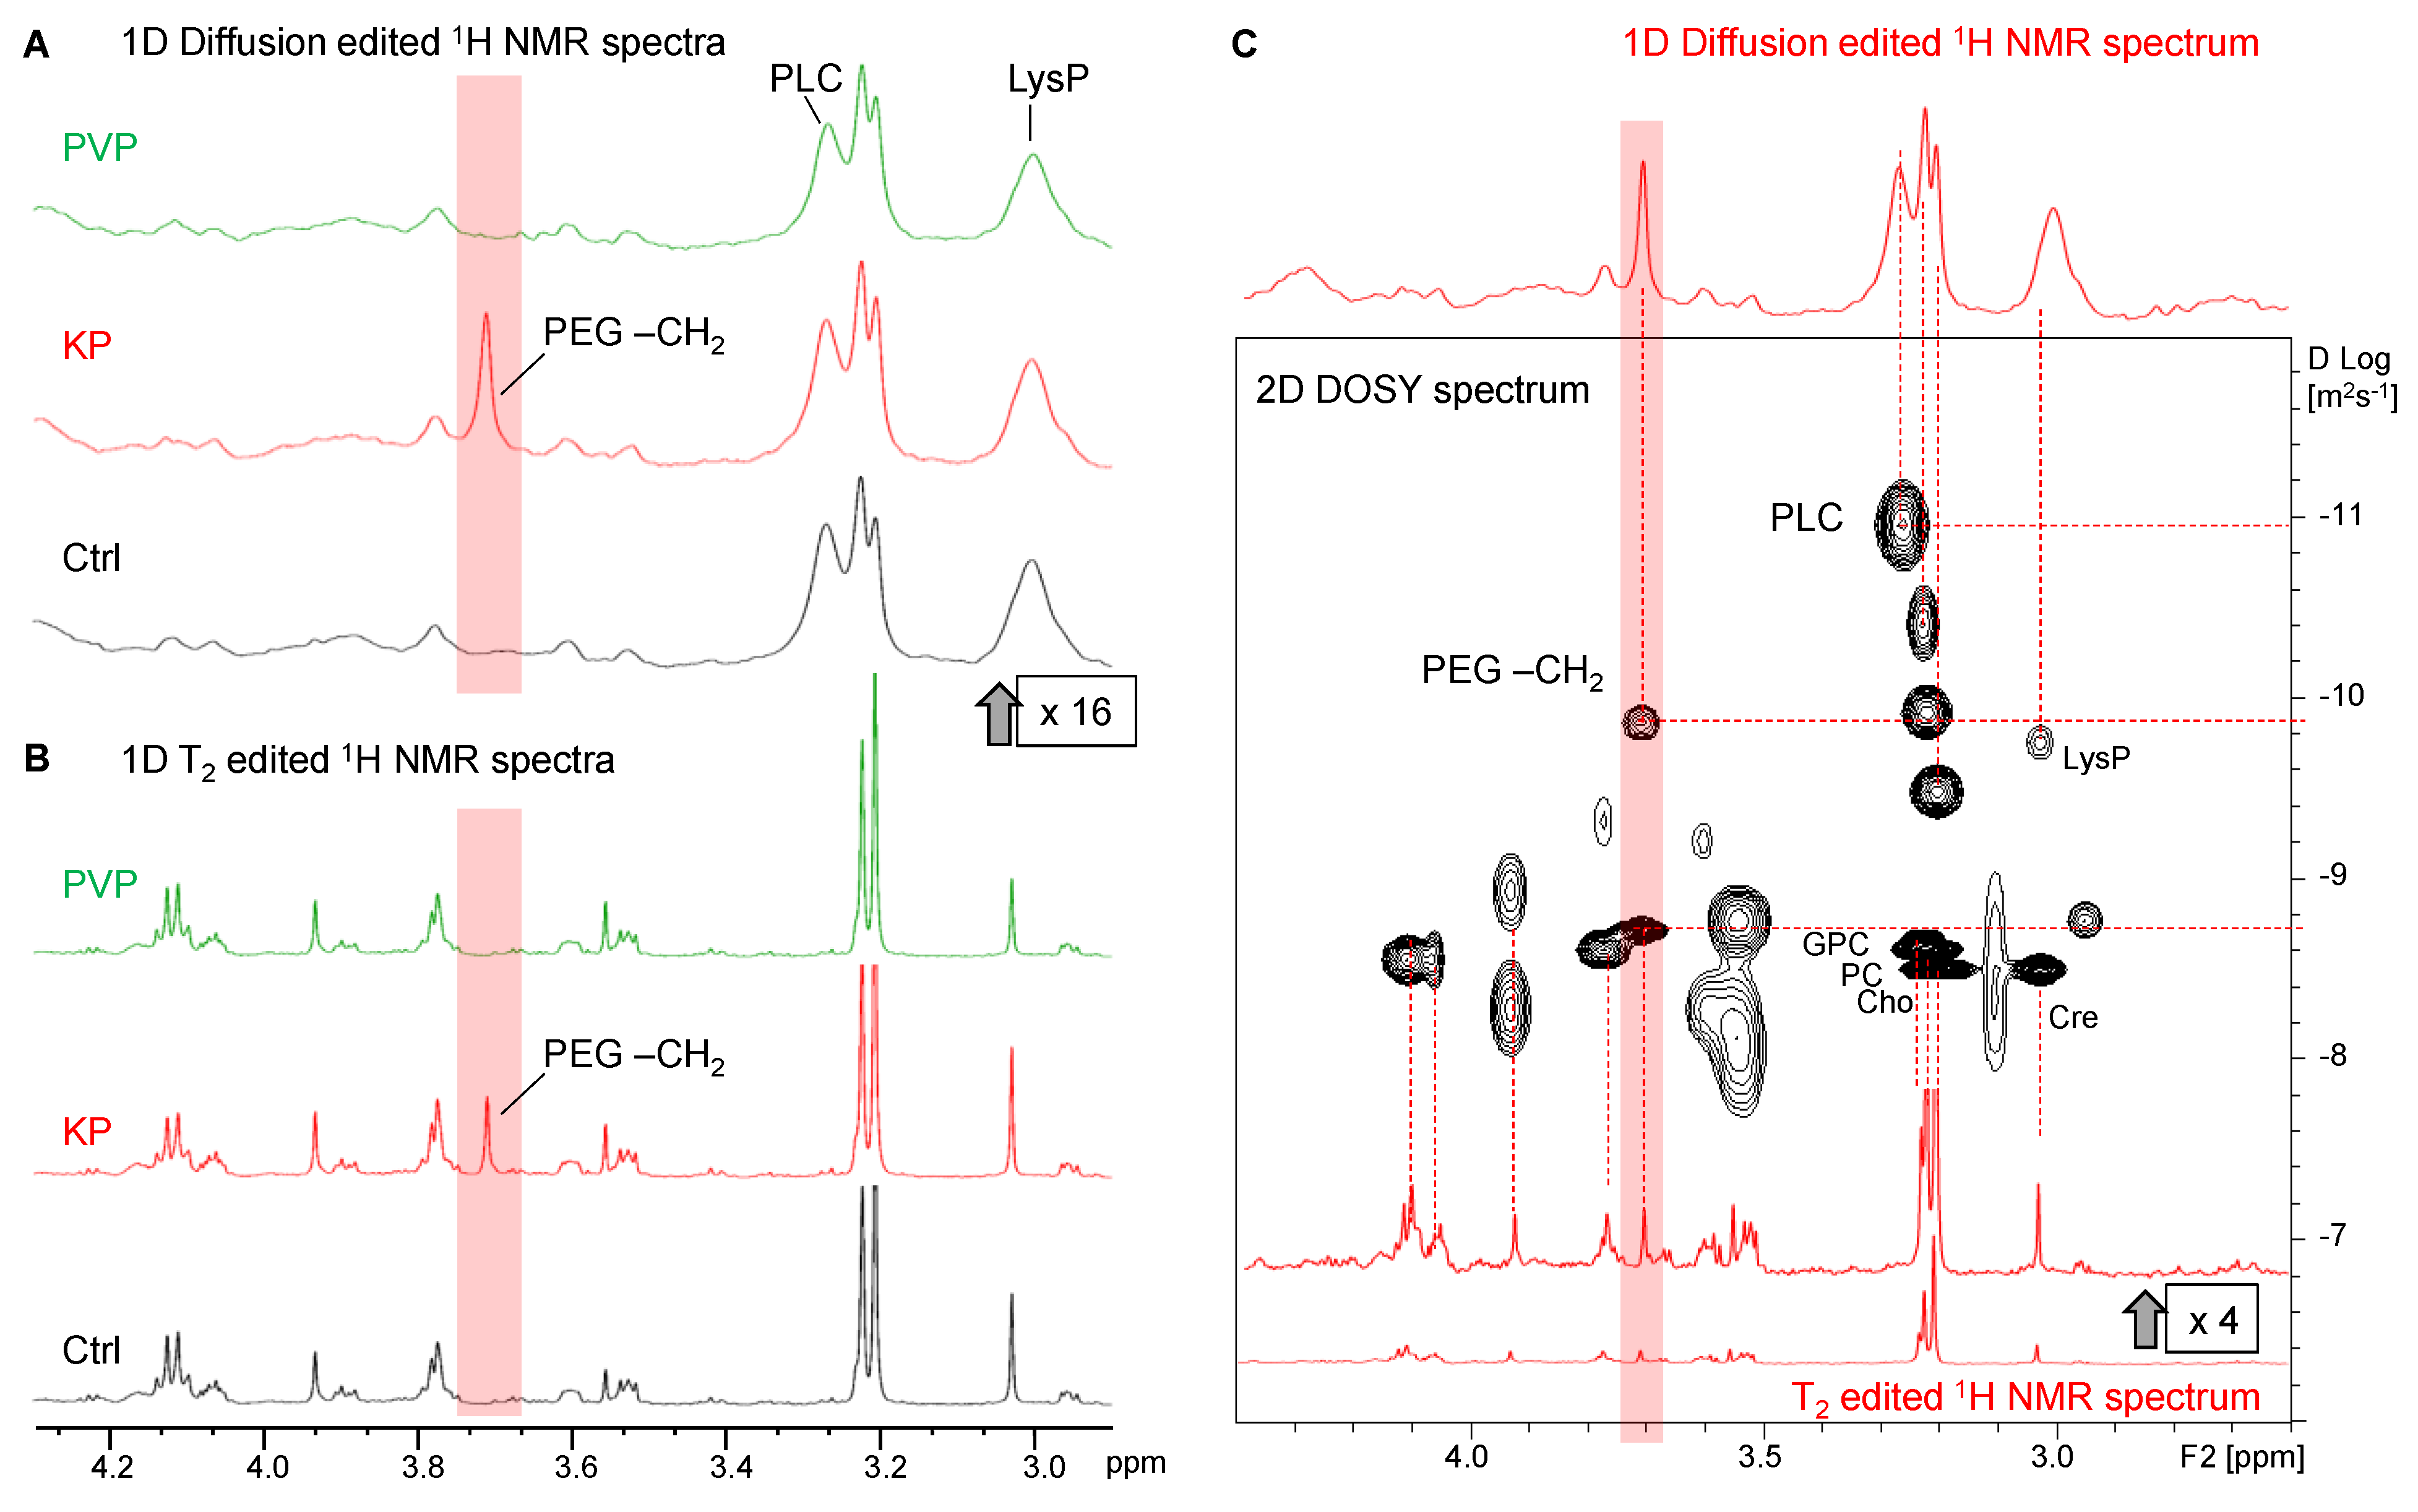
3.3. The Metabolic Profile of Treated and Untreated HeLa Cells: Diffusion-Edited 1H HR-MAS NMR Spectra
3.3.1. Lipids and Oligopeptides
3.3.2. Visibility of Intracellular KP
3.3.3. Invisibility of Intracellular PVP
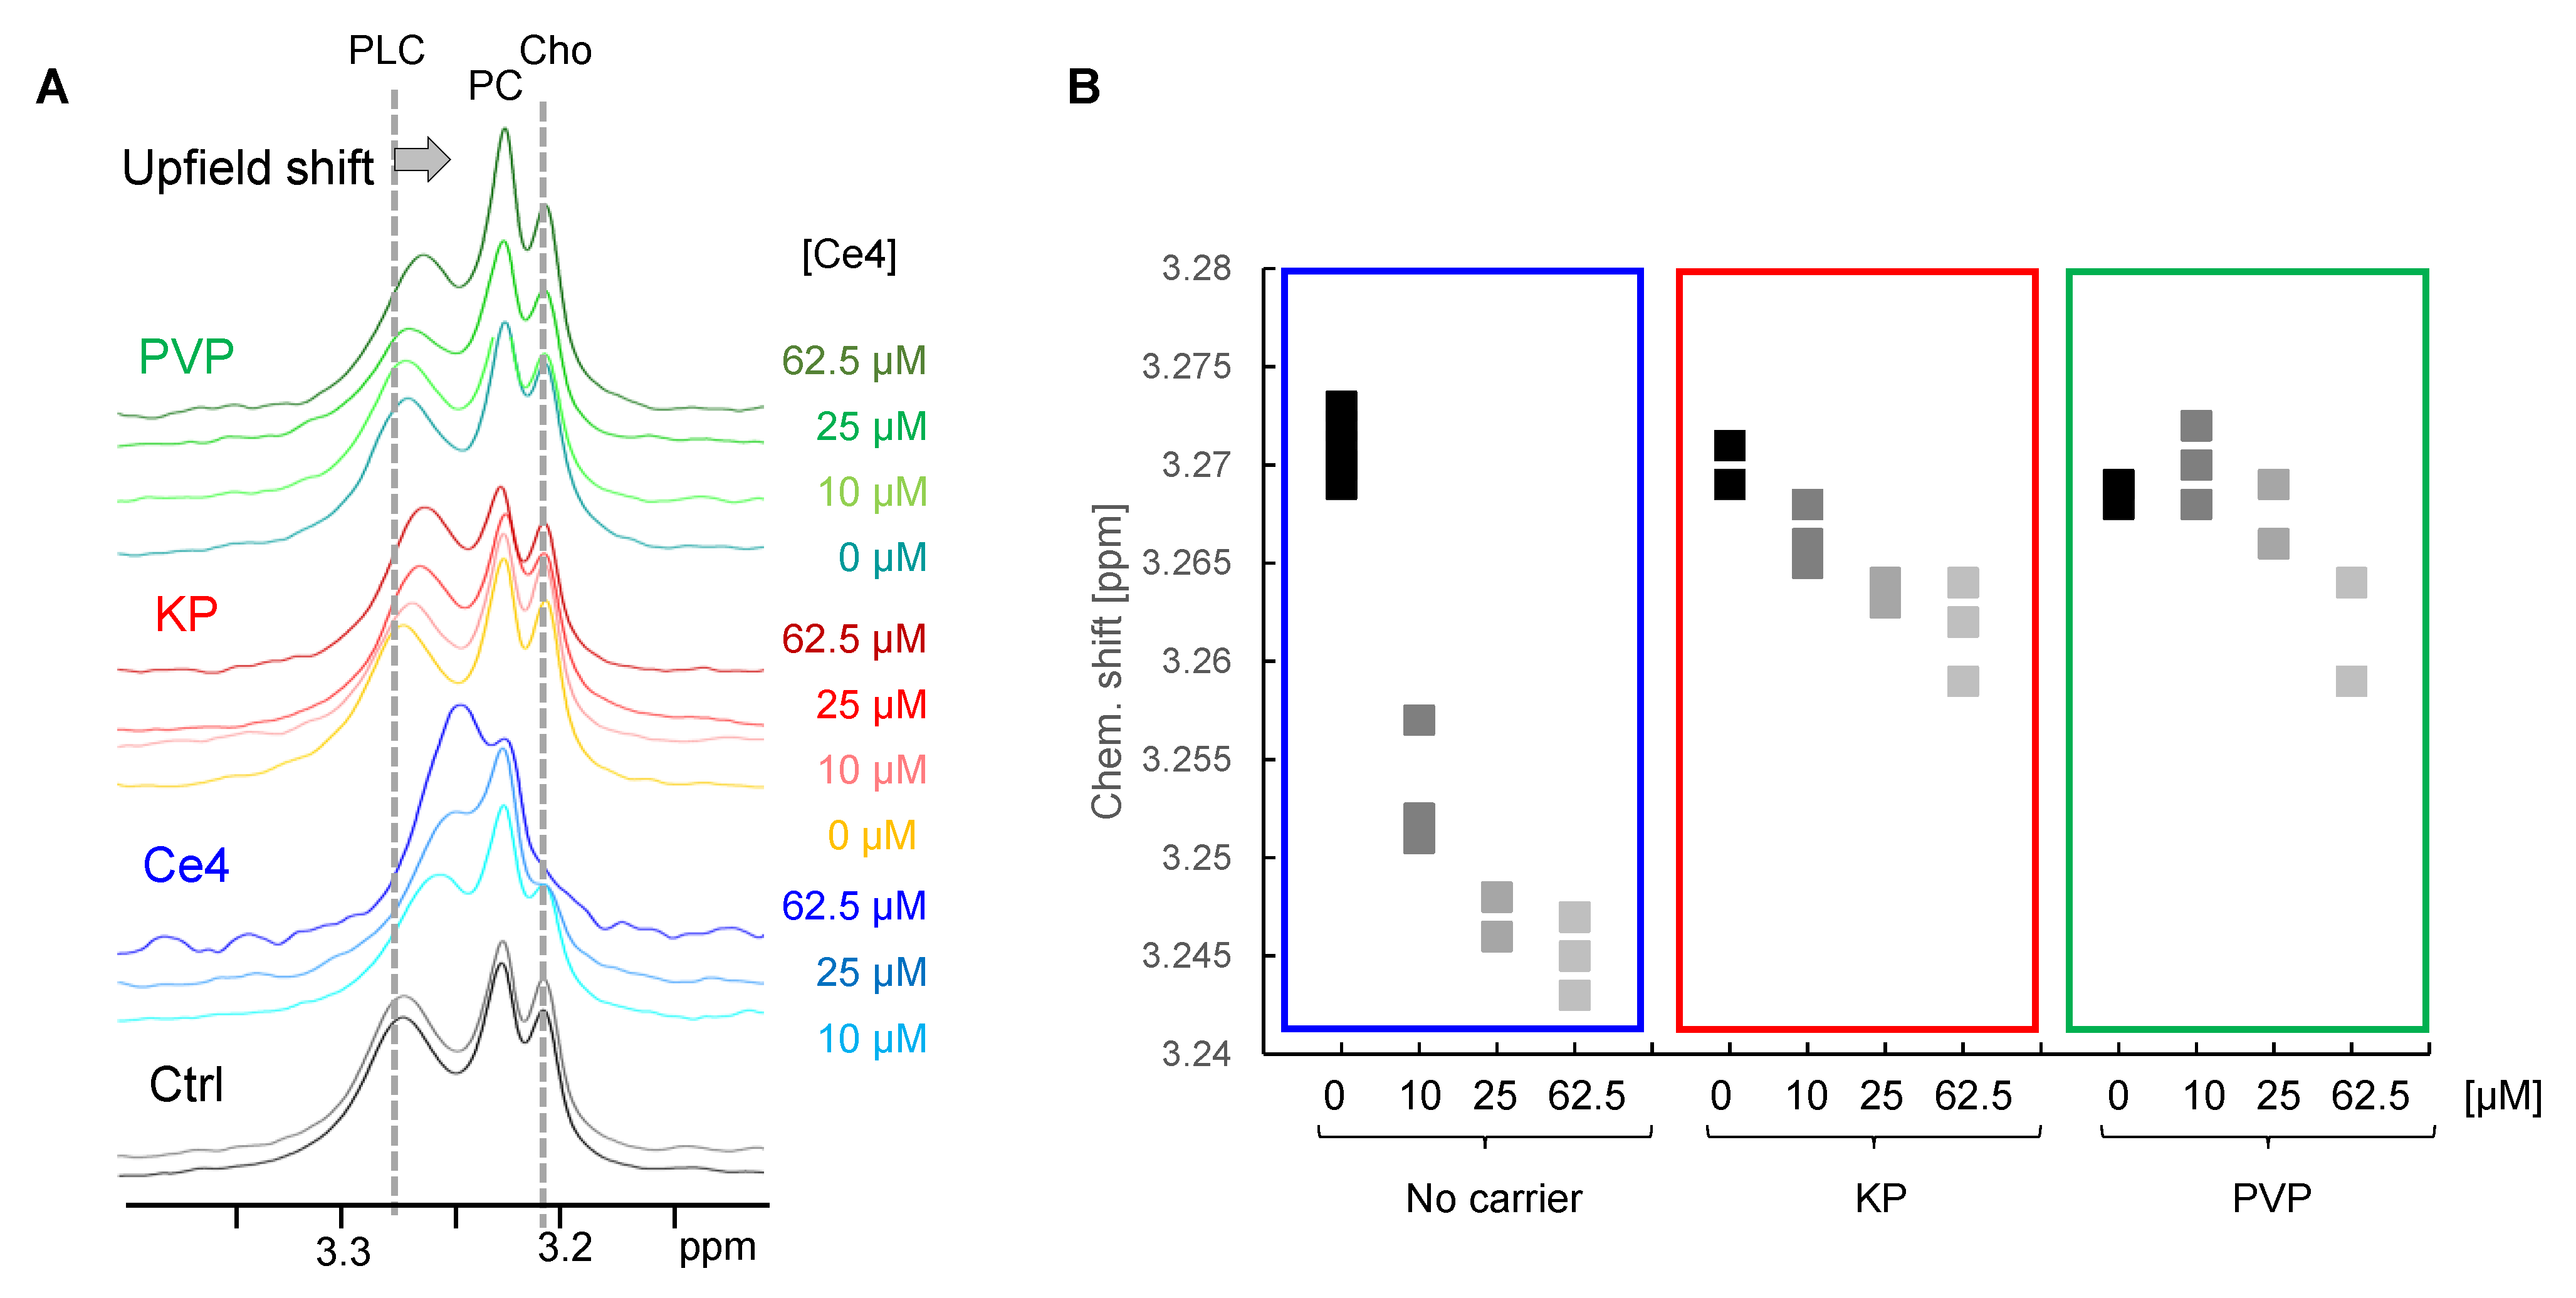
3.3.4. Indirect Detection of Intracellular Ce4
3.4. Metabolic Analysis of Cell Spectra: Impact of Ce4, PVP, and KP
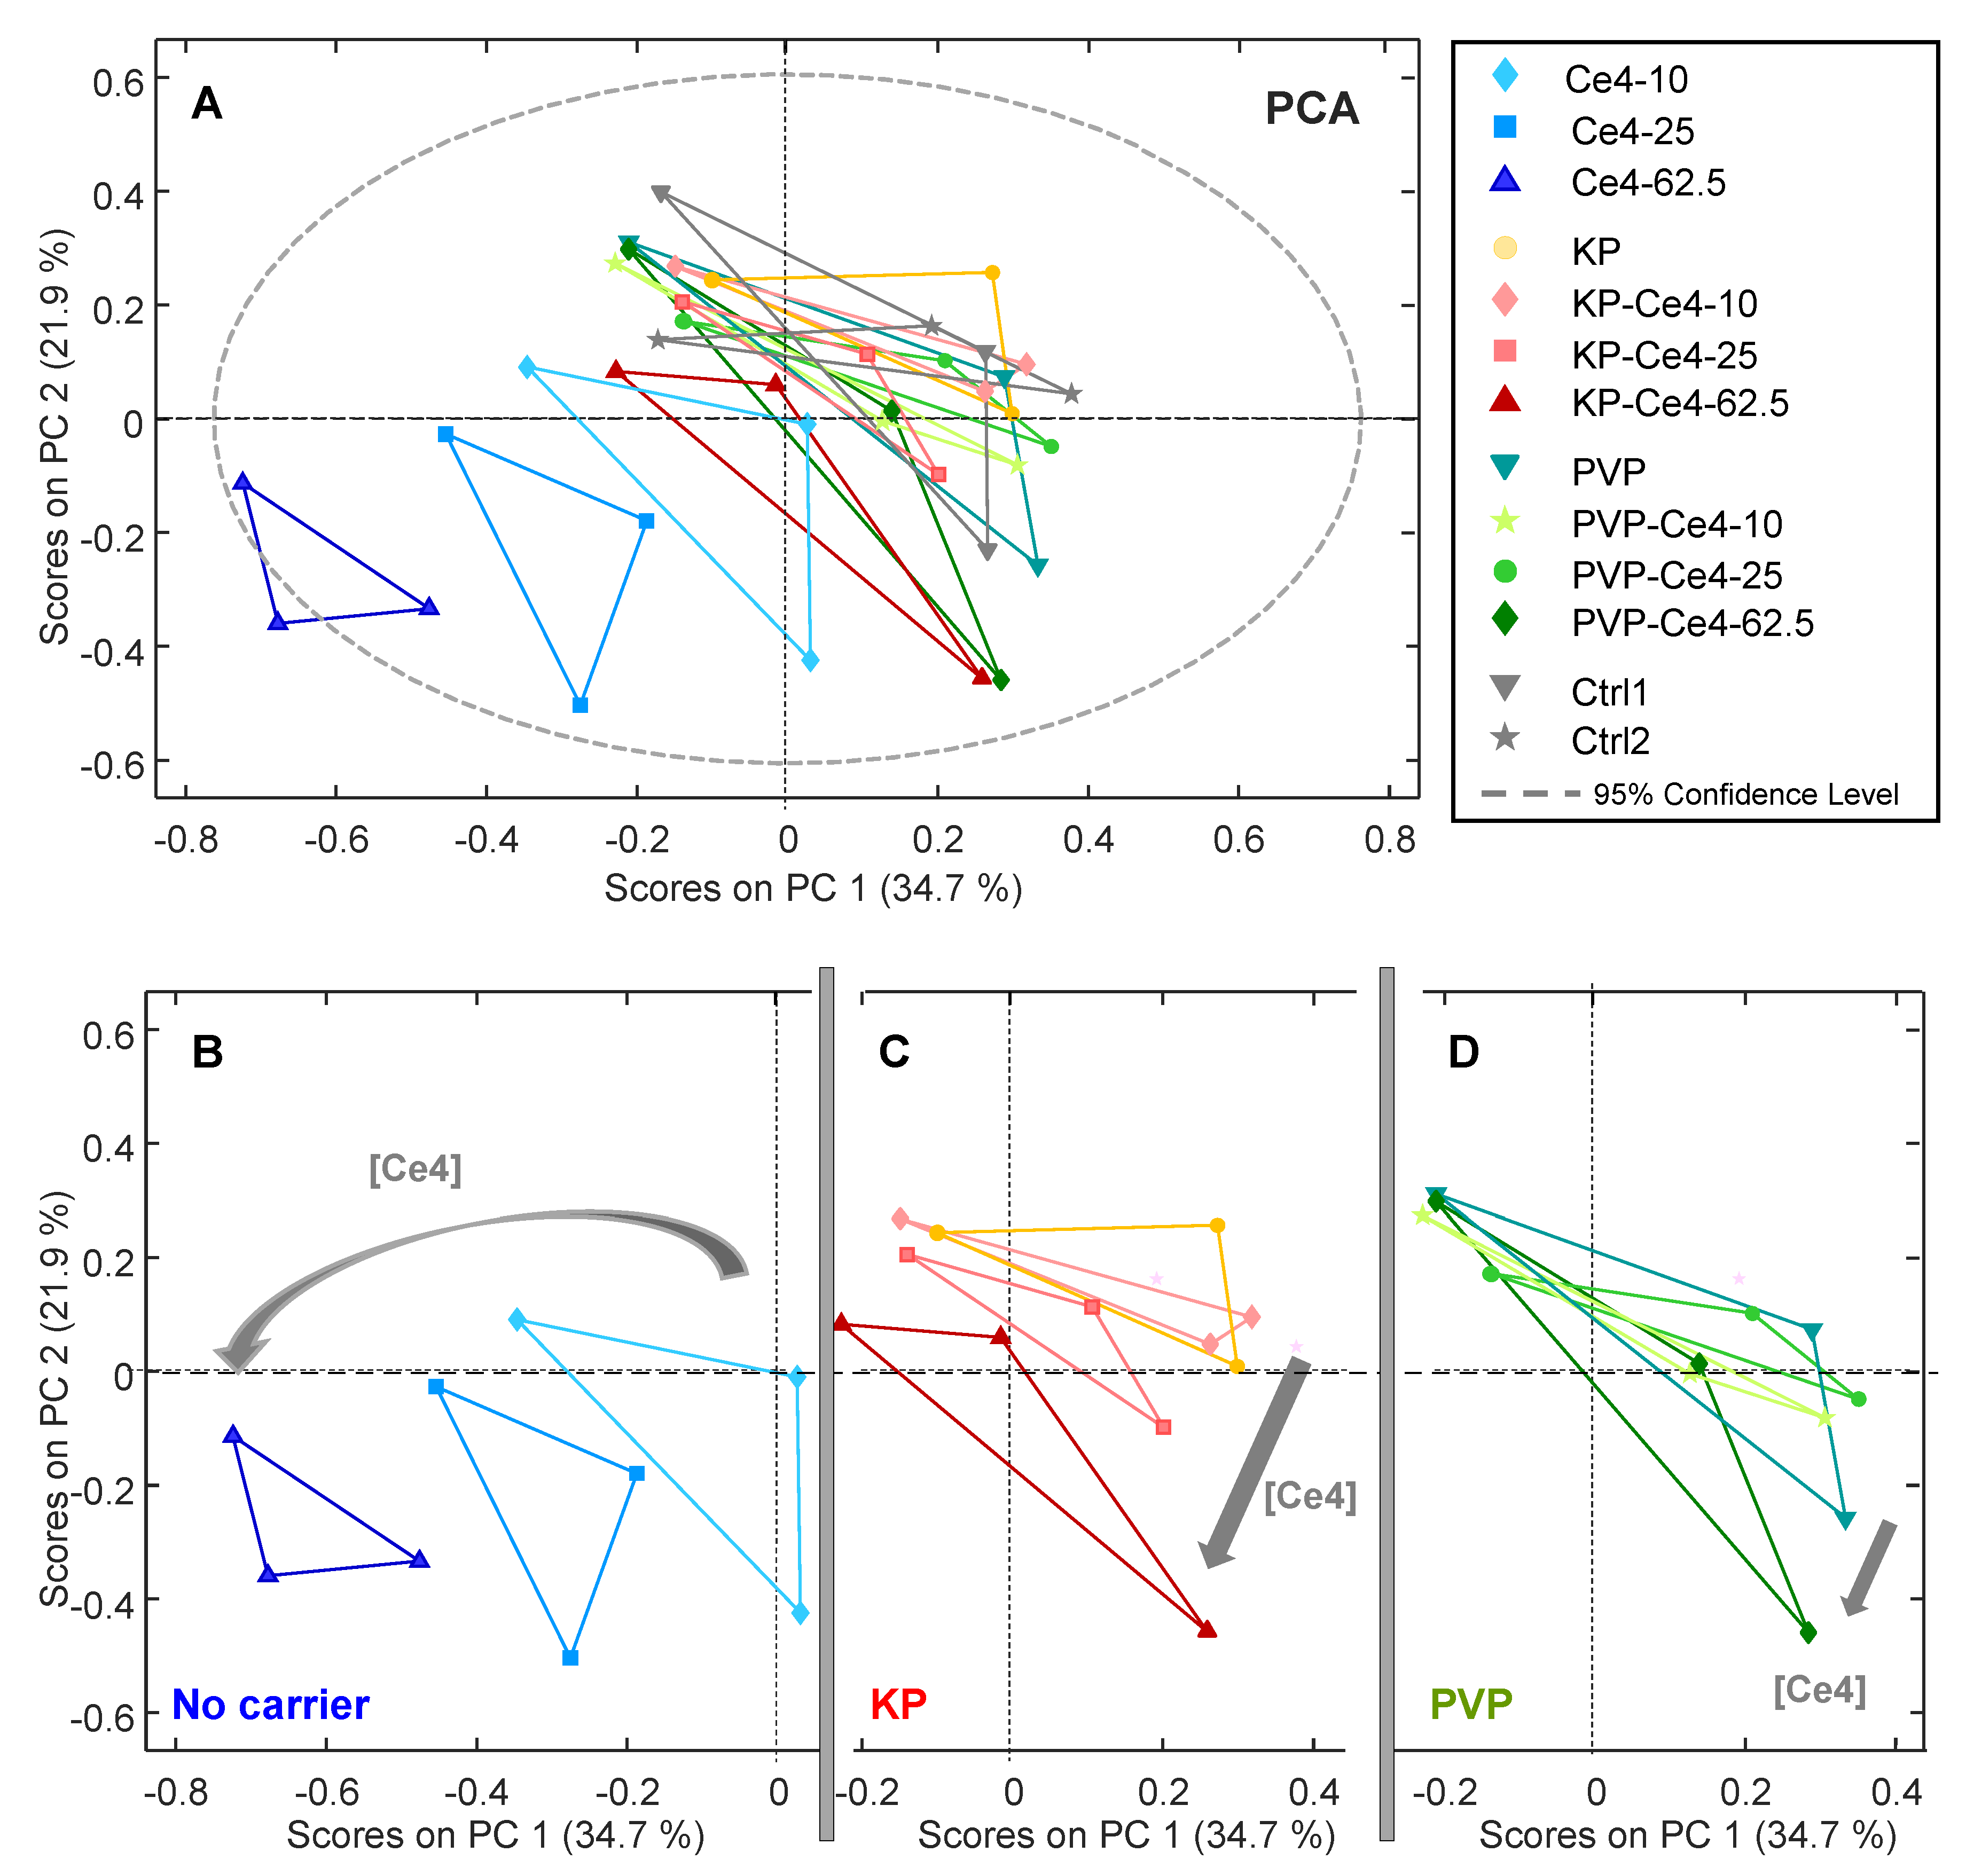
3.4.1. PCA
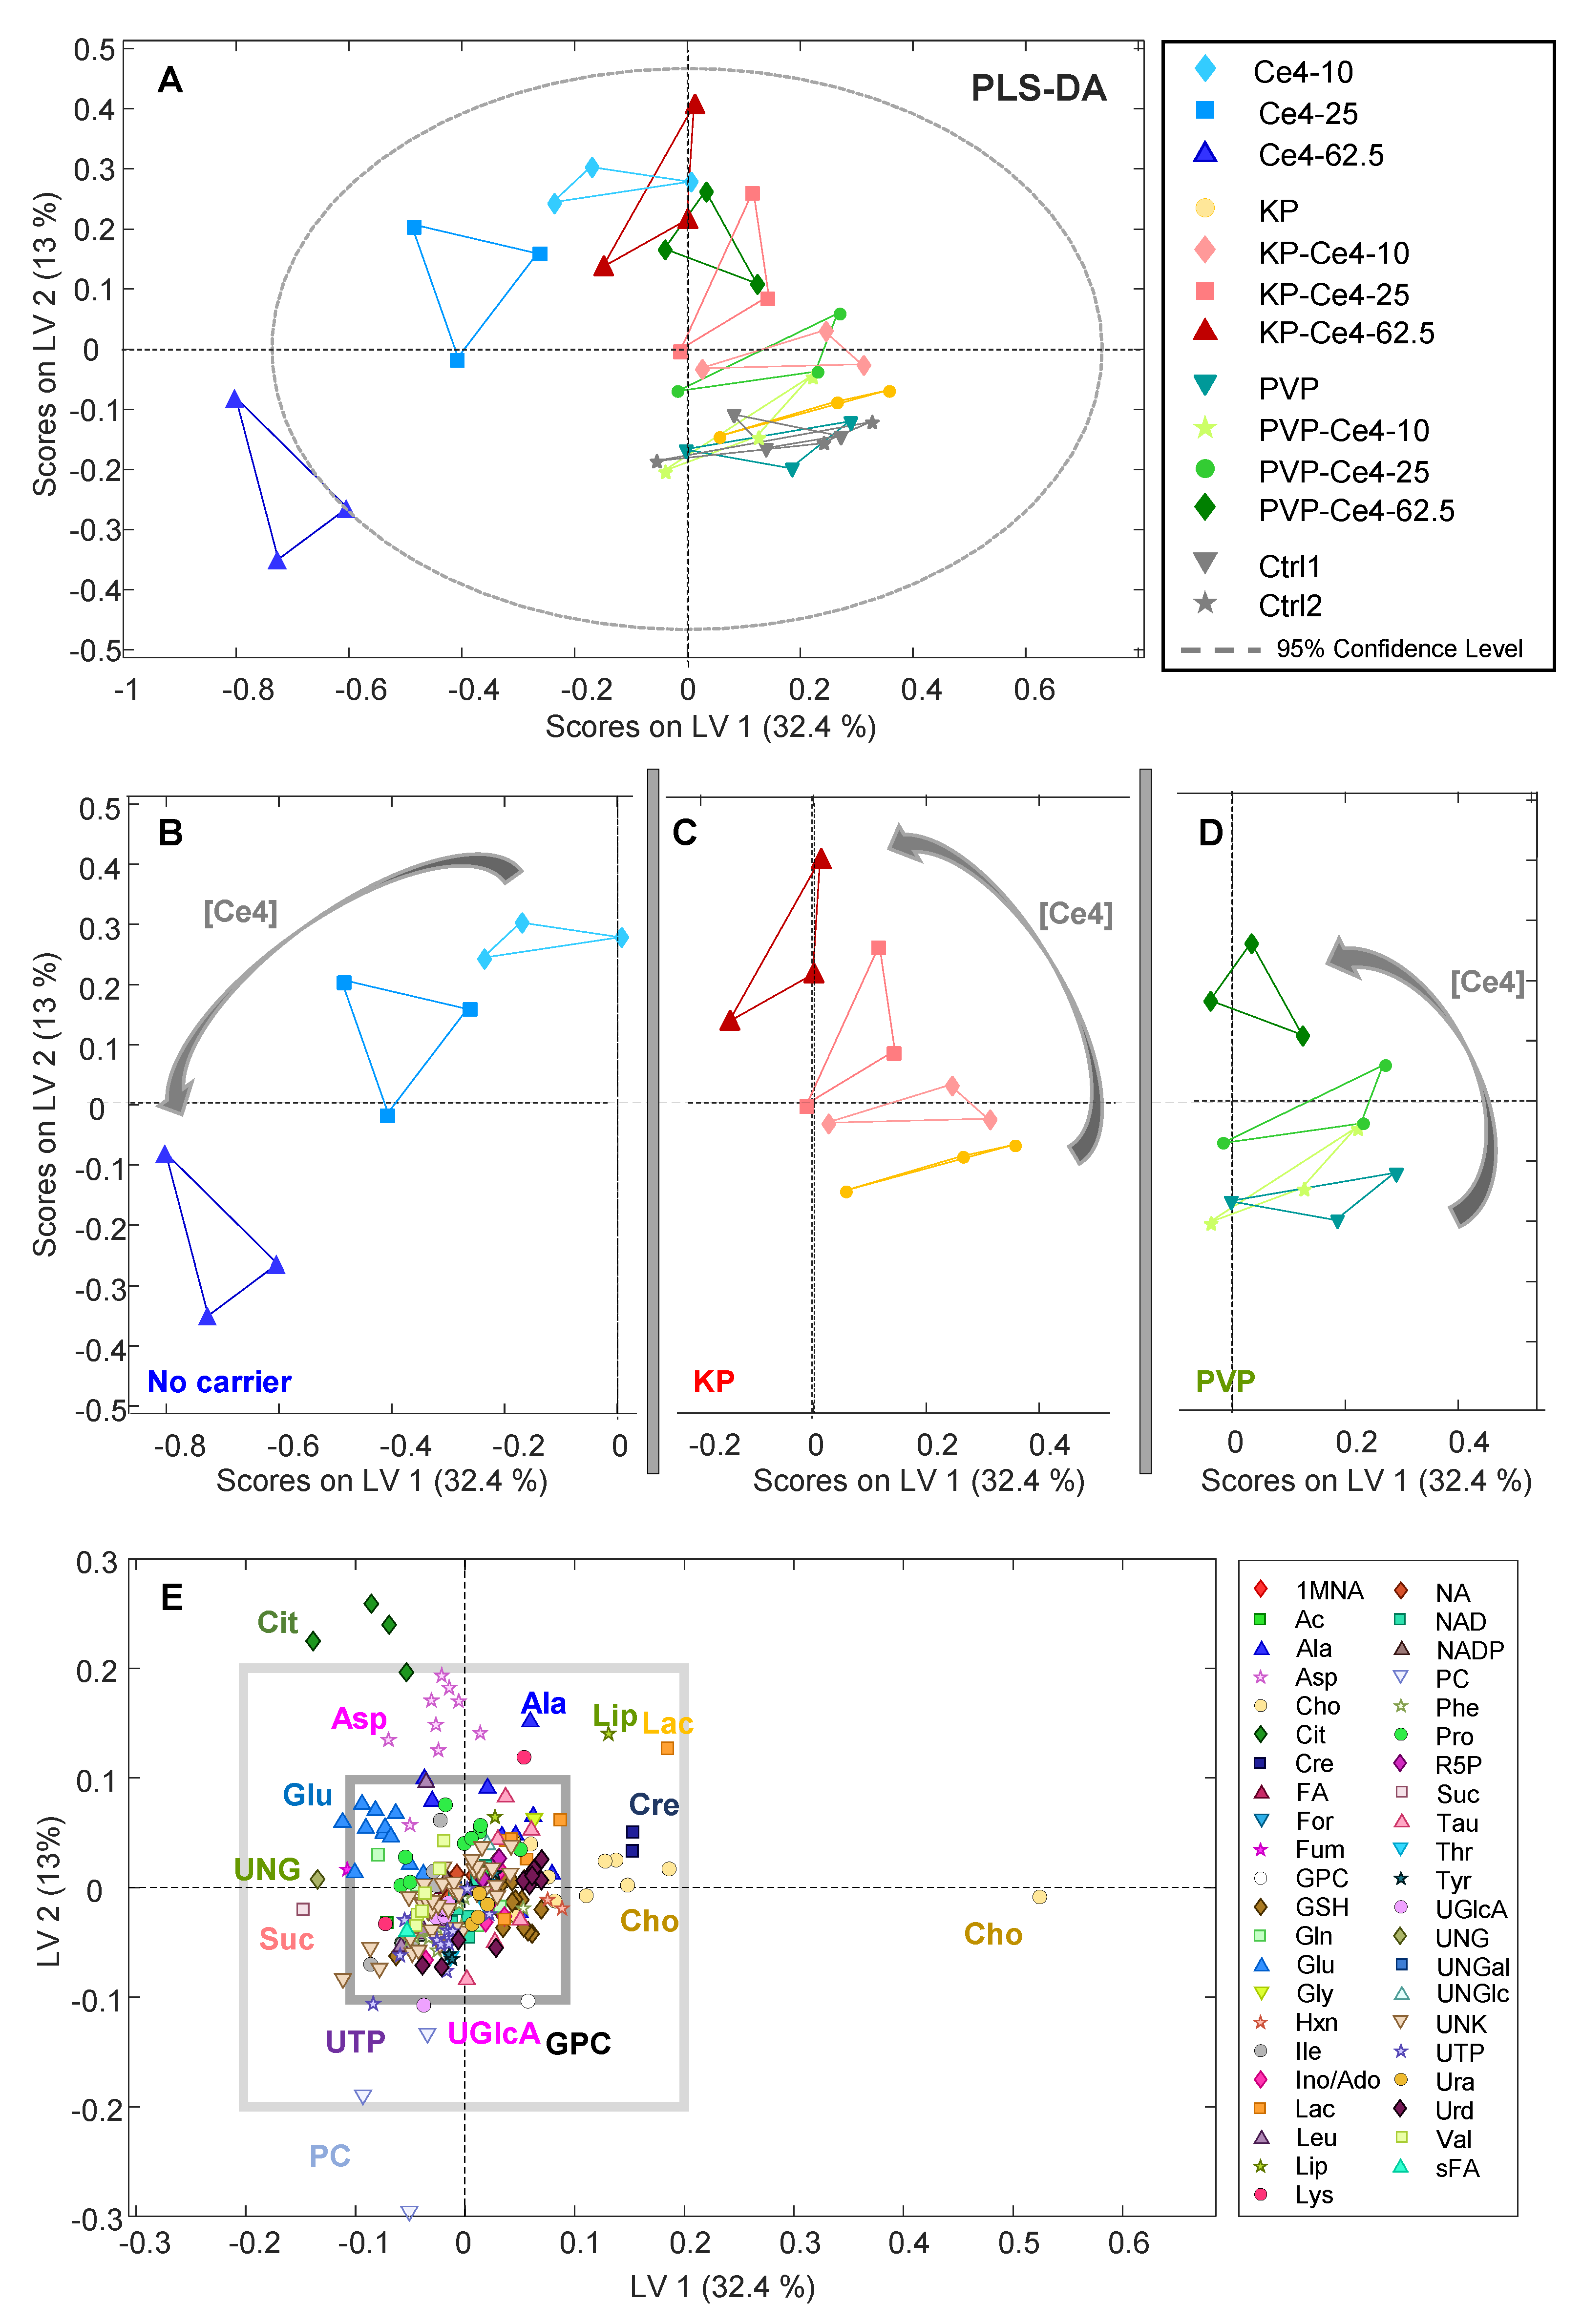
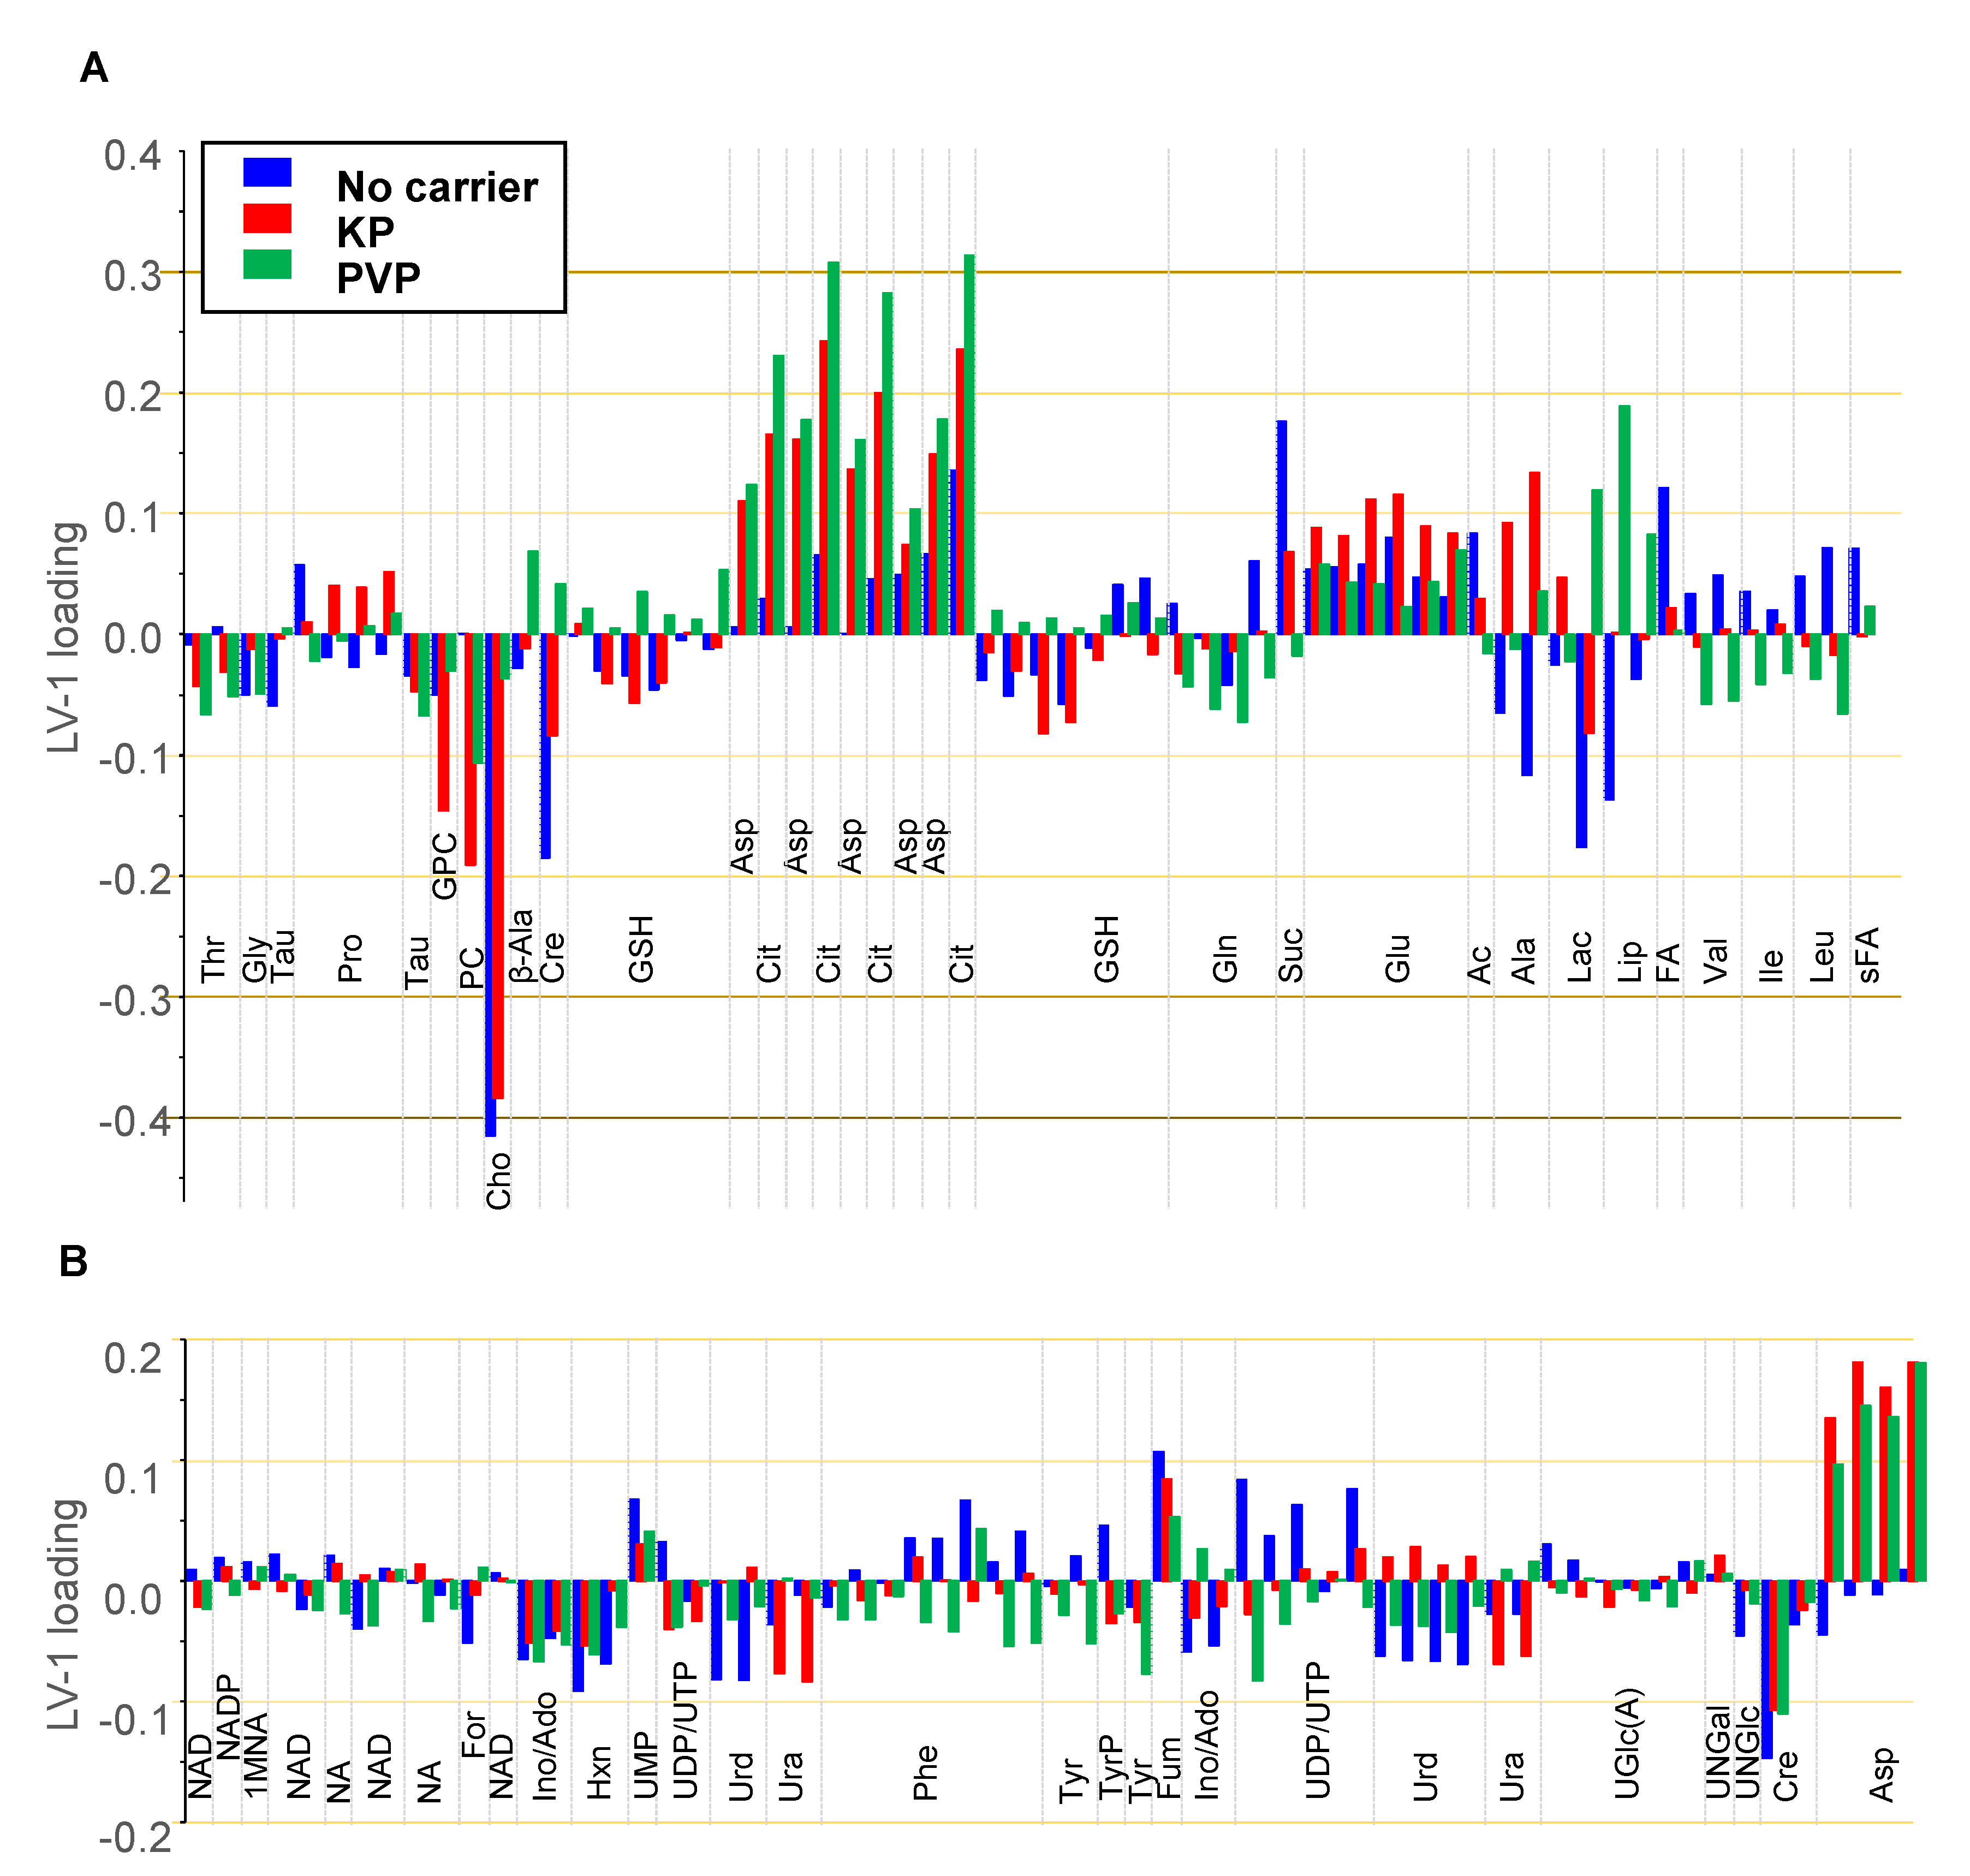
3.4.2. PLS-DA
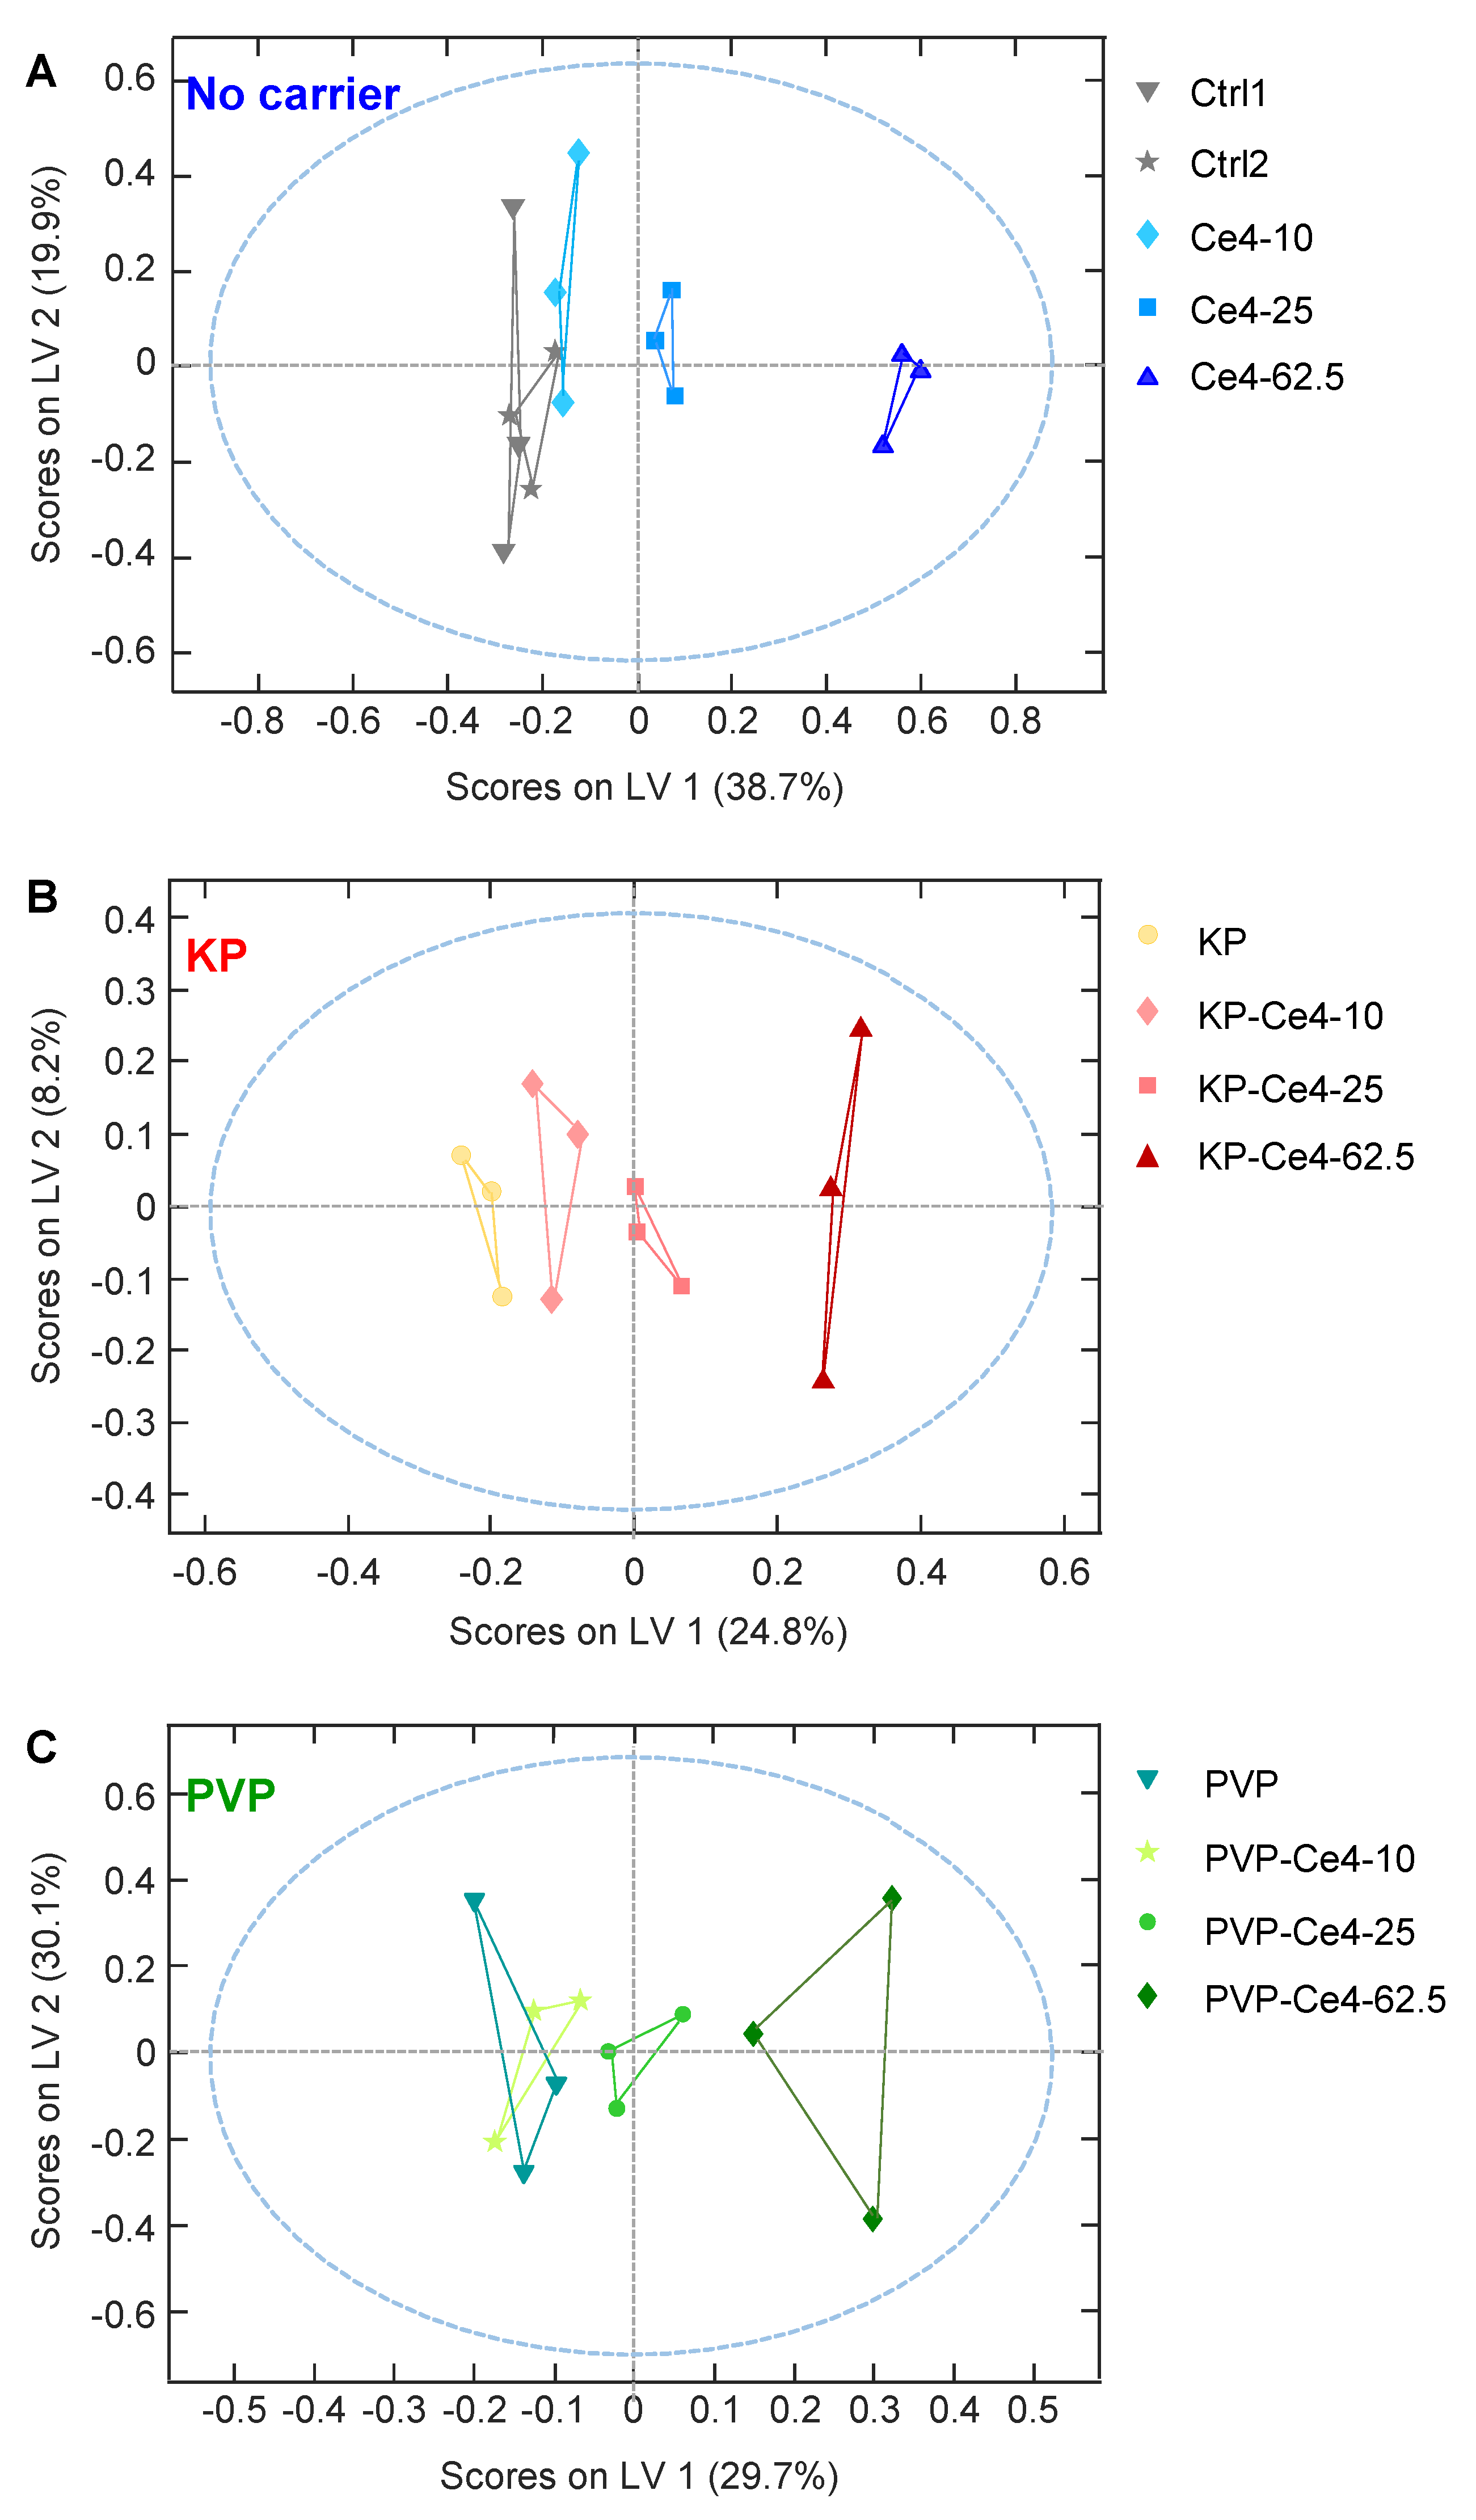
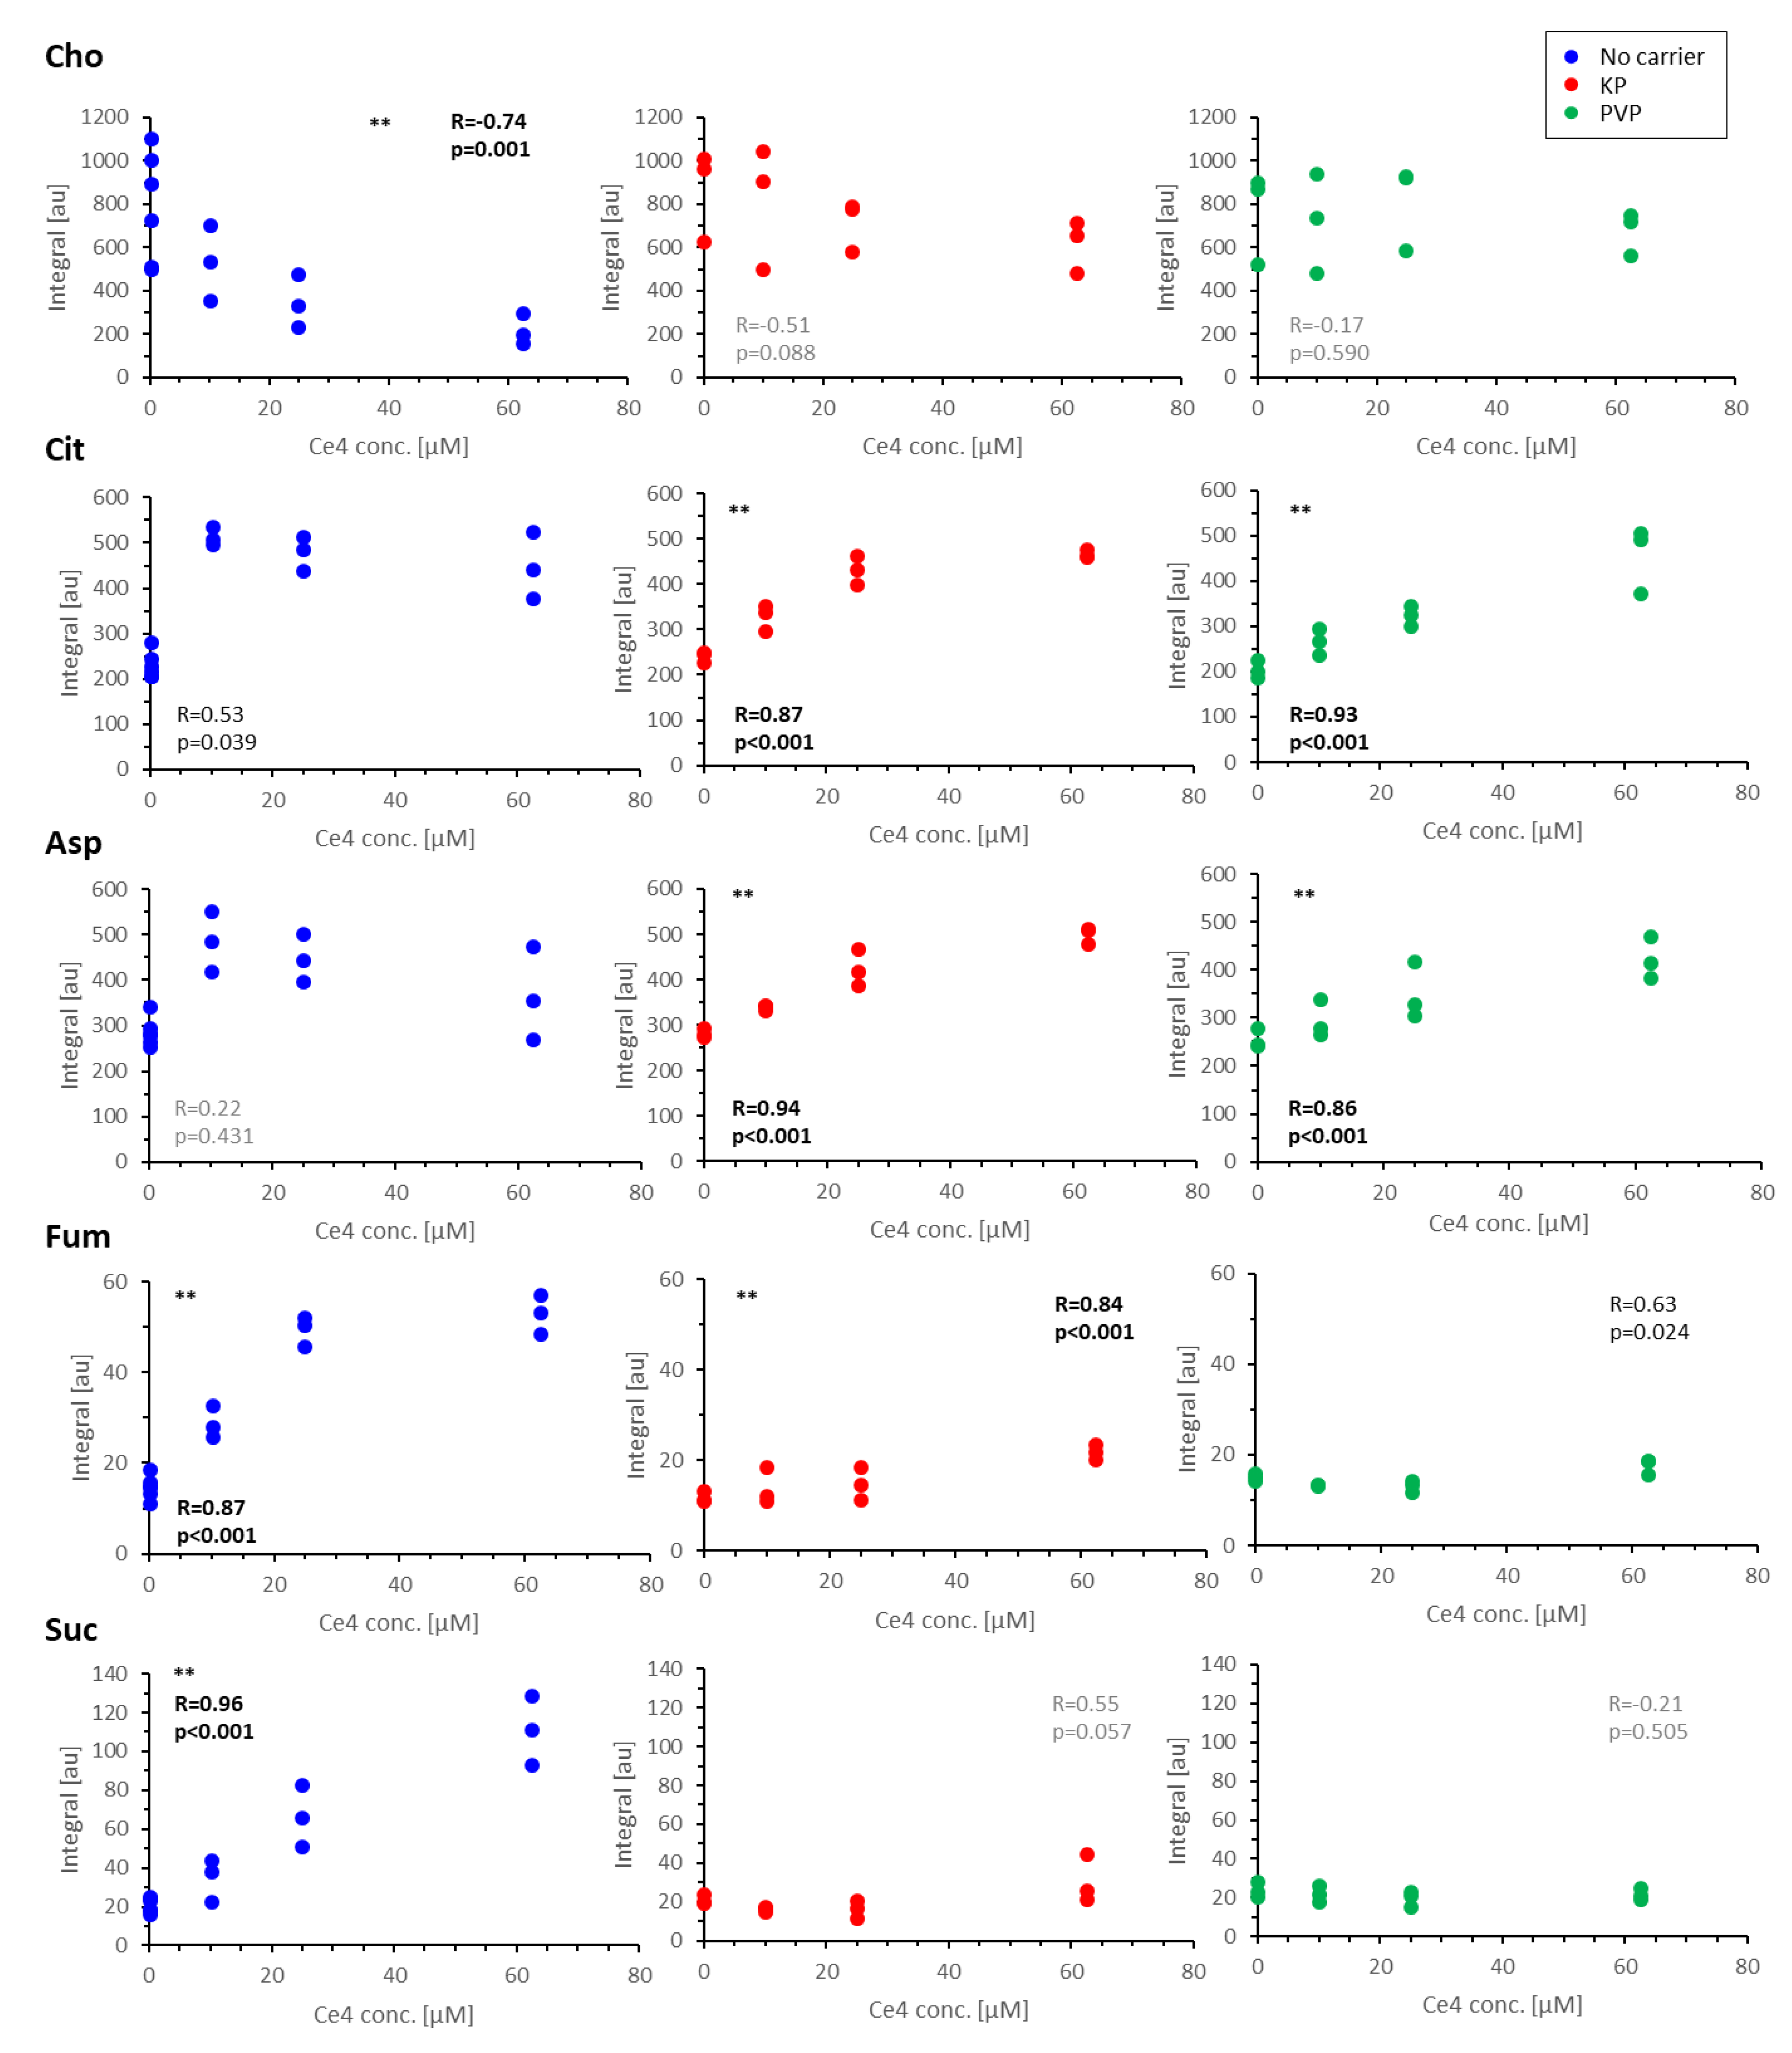
3.4.3. oPLS Analysis of Subgroups
3.4.4. Discussion of Metabolic Changes
Components of the Phosphatidylcholine Metabolism
- Cho, FA, Cit, and Ac
Components of the TCA Cycle
- Cit, Asp, Fum, and Suc
Nucleobases, Nucleosides, Nucleotides, and Amines
3.5. Limitations
4. Conclusions
Supplementary Materials
Author Contributions
Funding
Institutional Review Board Statement
Informed Consent Statement
Data Availability Statement
Conflicts of Interest
Abbreviations
References
- Dąbrowski, J.M. Chapter Nine—Reactive Oxygen Species in Photodynamic Therapy: Mechanisms of Their Generation and Potentiation. In Advances in Inorganic Chemistry; van Eldik, R., Hubbard, C.D., Eds.; Academic Press: Cambridge, MA, USA, 2017; Volume 70, pp. 343–394. [Google Scholar]
- Juzeniene, A. Chlorin e6-based photosensitizers for photodynamic therapy and photodiagnosis. Photodiagnosis Photodyn. Ther. 2009, 6, 94–96. [Google Scholar] [CrossRef] [PubMed]
- Abrahamse, H.; Hamblin, M.-R. New photosensitizers for photodynamic therapy. Biochem. J. 2016, 473, 347. [Google Scholar] [CrossRef] [PubMed]
- Ash, C.; Dubec, M.; Donne, K.; Bashford, T. Effect of wavelength and beam width on penetration in light-tissue interaction using computational methods. Lasers Med. Sci. 2017, 32, 1909–1918. [Google Scholar] [CrossRef] [PubMed]
- Baskaran, R.; Lee, J.; Yang, S.-G. Clinical development of photodynamic agents and therapeutic applications. Biomater. Res. 2018, 22, 25. [Google Scholar] [CrossRef] [PubMed]
- Invion Limited: Photosoft Granted Patent Protection in Australia. Available online: http://chogroup.com.au/uncategorised/photosoft-granted-patent-protection-in-australia/ (accessed on 17 September 2020).
- Cho, H.; RMW CHO Group Ltd. Chlorin Derivative Useful in Photodynamic Therapy and Diagnosis. CN Patent CN105008372B, 28 October 2015. [Google Scholar]
- Conte, C.; Maiolino, S.; Pellosi, D.S.; Miro, A.; Ungaro, F.; Quaglia, F. Polymeric Nanoparticles for Cancer Photodynamic Therapy. In Light-Responsive Nanostructured Systems for Applications in Nanomedicine; Sortino, S., Ed.; Springer: Cham, Switzerland, 2016; pp. 61–112. [Google Scholar]
- Nie, S. Understanding and overcoming major barriers in cancer nanomedicine. Nanomedicine 2010, 5, 523–528. [Google Scholar] [CrossRef] [PubMed]
- Li, S.D.; Huang, L. Nanoparticles Evading The Reticuloendothelial System: Role of The Supported Bilayer. Biochim. Biophys. Acta 2009, 1788, 2259–2266. [Google Scholar] [CrossRef] [PubMed]
- Maeda, H.; Nakamura, H.; Fang, J. The EPR effect for macromolecular drug delivery to solid tumors: Improvement of tumor uptake, lowering of systemic toxicity, and distinct tumor imaging in vivo. Adv. Drug Deliv. Rev. 2013, 65, 71–79. [Google Scholar] [CrossRef] [PubMed]
- Pathak, Y.V. Surface Modification of Nanoparticles for Targeted Drug Delivery; Pathak, Y.V., Ed.; Springer: Berlin/Heidelberg, Germany, 2019; p. 499. [Google Scholar]
- Sahay, G.; Alakhova, D.Y.; Kabanov, A.V. Endocytosis of nanomedicines. J. Control. Release 2010, 145, 182–195. [Google Scholar] [CrossRef]
- Deng, J.; Gao, C. Recent advances in interactions of designed nanoparticles and cells with respect to cellular uptake, intracellular fate, degradation and cytotoxicity. Nanotechnology 2016, 27, 412002. [Google Scholar] [CrossRef]
- Behzadi, S.; Serpooshan, V.; Tao, W.; Hamaly, M.A.; Alkawareek, M.Y.; Dreaden, E.C.; Brown, D.; Alkilany, A.M.; Farokhzad, O.C.; Mahmoudi, M. Cellular uptake of nanoparticles: Journey inside the cell. Chem. Soc. Rev. 2017, 46, 4218–4244. [Google Scholar] [CrossRef]
- Foroozandeh, P.; Aziz, A.A. Insight into Cellular Uptake and Intracellular Trafficking of Nanoparticles. Nanoscale Res. Lett. 2018, 13, 339. [Google Scholar] [CrossRef] [PubMed]
- Franco, P.; De Marco, I. The Use of Poly(N-vinyl pyrrolidone) in the Delivery of Drugs: A Review. Polymers 2020, 12, 1114. [Google Scholar] [CrossRef] [PubMed]
- Bailly, N.; Thomas, M.; Klumperman, B. Poly(N-vinylpyrrolidone)-block-poly(vinyl acetate) as a Drug Delivery Vehicle for Hydrophobic Drugs. Biomacromolecules 2012, 13, 4109–4117. [Google Scholar] [CrossRef] [PubMed]
- Kurakula, M.; Rao, G.S.N.K. Pharmaceutical assessment of polyvinylpyrrolidone (PVP): As excipient from conventional to controlled delivery systems with a spotlight on COVID-19 inhibition. J. Drug Deliv. Sci. Technol. 2020, 60, 102046. [Google Scholar] [CrossRef] [PubMed]
- Cabral, H.; Miyata, K.; Osada, K.; Kataoka, K. Block Copolymer Micelles in Nanomedicine Applications. Chem. Rev. 2018, 118, 6844–6892. [Google Scholar] [CrossRef] [PubMed]
- Raval, A.; Pillai, S.A.; Bahadur, A.; Bahadur, P. Systematic characterization of Pluronic-« micelles and their application for solubilization and in vitro release of some hydrophobic anticancer drugs. J. Mol. Liq. 2017, 230, 473–481. [Google Scholar] [CrossRef]
- Liu, J.; Lee, H.; Allen, C. Formulation of Drugs in Block Copolymer Micelles: Drug Loading and Release. Curr. Pharm. Des. 2006, 12, 4685–4701. [Google Scholar] [CrossRef] [PubMed]
- Demazeau, M.; Gibot, L.; Mingotaud, A.-F.; Vicendo, P.; Roux, C.; Lonetti, B. Rational design of block copolymer self-assemblies in photodynamic therapy. Beilstein J. Nanotechnol. 2020, 11, 180–212. [Google Scholar] [CrossRef]
- Pellosi, D.S.; Tessaro, A.L.; Moret, F.; Gaio, E.; Reddi, E.; Caetano, W.; Quaglia, F.; Hioka, N. Pluronic-« mixed micelles as efficient nanocarriers for benzoporphyrin derivatives applied to photodynamic therapy in cancer cells. J. Photochem. Photobiol. A Chem. 2016, 314 (Suppl. C), 143–154. [Google Scholar] [CrossRef]
- Chin, W.W.L.; Heng, P.W.S.; Thong, P.S.P.; Bhuvaneswari, R.; Hirt, W.; Kuenzel, S.; Soo, K.C.; Olivo, M. Improved formulation of photosensitizer chlorin e6 polyvinylpyrrolidone for fluorescence diagnostic imaging and photodynamic therapy of human cancer. Eur. J. Pharm. Biopharm. 2008, 69, 1083–1093. [Google Scholar] [CrossRef]
- Zhiyentayev, T.M.; Boltaev, U.T.; Solov’eva, A.B.; Aksenova, N.A.; Glagolev, N.N.; Chernjak, A.V.; Melik-Nubarov, N.S. Complexes of Chlorin e6 with Pluronics and Polyvinylpyrrolidone: Structure and Photodynamic Activity in Cell Culture. Photochem. Photobiol. 2014, 90, 171–182. [Google Scholar] [CrossRef] [PubMed]
- Pehlivan, E.G.; Ek, Y.; Topkaya, D.; Tazebay, U.H.; Dumoulin, F. Effect of PVP formulation on the in vitro photodynamic efficiency of a photosensitizing phthalocyanine. J. Porphyr. Phthalocyanines 2019, 23, 1587–1591. [Google Scholar] [CrossRef]
- Hädener, M.; Gjuroski, I.; Furrer, J.; Vermathen, M. Interactions of Polyvinylpyrrolidone with Chlorin e6-Based Photosensitizers Studied by NMR and Electronic Absorption Spectroscopy. J. Phys. Chem. B 2015, 119, 12117–12128. [Google Scholar] [CrossRef] [PubMed]
- Gjuroski, I.; Furrer, J.; Vermathen, M. How Does the Encapsulation of Porphyrinic Photosensitizers into Polymer Matrices Affect Their Self-Association and Dynamic Properties? ChemPhysChem 2018, 19, 1089–1102. [Google Scholar] [CrossRef] [PubMed]
- Pfister, S.; Sauser, L.; Gjuroski, I.; Furrer, J.; Vermathen, M. Monitoring the encapsulation of chlorin e6 derivatives into polymer carriers by NMR spectroscopy. J. Porphyr. Phthalocyanines 2019, 23, 1576–1586. [Google Scholar] [CrossRef]
- Gjuroski, I.; Girousi, E.; Meyer, C.; Hertig, D.; Stojkov, D.; Fux, M.; Schnidrig, N.; Bucher, J.; Pfister, S.; Sauser, L.; et al. Evaluation of polyvinylpyrrolidone and block copolymer micelle encapsulation of serine chlorin e6 and chlorin e4 on their reactivity towards albumin and transferrin and their cell uptake. J. Control. Release 2019, 316, 150–167. [Google Scholar] [CrossRef] [PubMed]
- Schwarz, W. Pvp: A Critical Review of the Kinetics and Toxicology of Polyvinylpyrrolidone (Povidone); CRC Press: Boca Raton, FL, USA, 2018. [Google Scholar]
- Czekanska, E.M. Assessment of cell proliferation with resazurin-based fluorescent dye. Methods Mol. Biol. 2011, 740, 27–32. [Google Scholar] [CrossRef] [PubMed]
- Kiesslich, T.; Gollmer, A.; Maisch, T.; Berneburg, M.; Plaetzer, K. A Comprehensive Tutorial on In Vitro Characterization of New Photosensitizers for Photodynamic Antitumor Therapy and Photodynamic Inactivation of Microorganisms. Biomed Res. Int. 2013, 2013, 840417. [Google Scholar] [CrossRef]
- van Meerloo, J.; Kaspers, G.J.L.; Cloos, J. Cell Sensitivity Assays: The MTT Assay. In Cancer Cell Culture: Methods and Protocols; Cree, I.A., Ed.; Humana Press: Totowa, NJ, USA, 2011; pp. 237–245. [Google Scholar]
- Adjei, I.M.; Sharma, B.; Labhasetwar, V. Nanoparticles: Cellular Uptake and Cytotoxicity. In Nanomaterial: Impacts on Cell Biology and Medicine; Capco, D.G., Chen, Y., Eds.; Springer: Dordrecht, The Netherlands, 2014; pp. 73–91. [Google Scholar]
- Sztandera, K.; Gorzkiewicz, M.; Klajnert-Maculewicz, B. Nanocarriers in photodynamic therapy—In vitro and in vivo studies. WIREs Nanomed. Nanobiotechnol. 2020, 12, e1509. [Google Scholar] [CrossRef]
- Lindon, J.C.; Beckonert, O.P.; Holmes, E.; Nicholson, J.K. High-resolution magic angle spinning NMR spectroscopy: Application to biomedical studies. Prog. Nucl. Magn. Reson. Spectrosc. 2009, 55, 79–100. [Google Scholar] [CrossRef]
- Griffin, J.L.; Bollard, M.; Nicholson, J.K.; Bhakoo, K. Spectral profiles of cultured neuronal and glial cells derived from HRMAS H-1 NMR spectroscopy. NMR Biomed. 2002, 15, 375–384. [Google Scholar] [CrossRef] [PubMed]
- Kaebisch, E.; Fuss, T.L.; Vandergrift, L.A.; Toews, K.; Habbel, P.; Cheng, L.L. Applications of high-resolution magic angle spinning MRS in biomedical studies I-cell line and animal models. NMR Biomed. 2017, 30, e3700–e3703. [Google Scholar] [CrossRef] [PubMed]
- Lv, M.; Huang, W.; Chen, Z.; Jiang, H.; Chen, J.; Tian, Y.; Zhang, Z.; Xu, F. Metabolomics techniques for nanotoxicity investigations. Bioanalysis 2015, 7, 1527–1544. [Google Scholar] [CrossRef] [PubMed]
- Carrola, J.; Bastos, V.; Jarak, I.; Oliveira-Silva, R.; Malheiro, E.; Daniel-da-Silva, A.L.; Oliveira, H.; Santos, C.; Gil, A.M.; Duarte, I.F. Metabolomics of silver nanoparticles toxicity in HaCaT cells: Structure-activity relationships and role of ionic silver and oxidative stress. Nanotoxicology 2016, 10, 1105–1117. [Google Scholar] [CrossRef] [PubMed]
- Kumar Babele, P. Zinc oxide nanoparticles impose metabolic toxicity by de-regulating proteome and metabolome in Saccharomyces cerevisiae. Toxicol. Rep. 2019, 6, 64–73. [Google Scholar] [CrossRef] [PubMed]
- Lindeque, J.Z.; Matthyser, A.; Mason, S.; Louw, R.; Taute, C.J.F. Metabolomics reveals the depletion of intracellular metabolites in HepG2 cells after treatment with gold nanoparticles. Nanotoxicology 2018, 12, 251–262. [Google Scholar] [CrossRef] [PubMed]
- Feng, J.; Li, J.; Wu, H.; Chen, Z. Metabolic responses of HeLa cells to silica nanoparticles by NMR-based metabolomic analyses. Metabolomics 2013, 9, 874–886. [Google Scholar] [CrossRef]
- Trivedi, A.B.; Kitabatake, N.; Doi, E. Toxicity of dimethyl sulfoxide as a solvent in bioassay system with HeLa cells evaluated colorimetrically with 3-(4,5-dimethylthiazol-2-yl)-2,5-diphenyl-tetrazolium bromide. Agric. Biol. Chem. 1990, 54, 2961–2966. [Google Scholar] [CrossRef]
- Jamalzadeh, L.; Ghafoori, H.; Sariri, R.; Rabuti, H.; Nasirzade, J.; Hasani, H.; Aghamaali, M.R. Cytotoxic Effects of Some Common Organic Solvents on MCF-7, RAW-264.7 and Human Umbilical Vein Endothelial Cells. Avicenna J. Med. Biochem. 2016, 4, 10–33453. [Google Scholar] [CrossRef]
- Diserens, G.; Hertig, D.; Vermathen, M.; Legeza, B.; Fluck, C.E.; Nuoffer, J.M.; Vermathen, P. Metabolic stability of cells for extended metabolomical measurements using NMR. A comparison between lysed and additionally heat inactivated cells. Analyst 2017, 142, 465–471. [Google Scholar] [CrossRef]
- Aguilar, J.A.; Nilsson, M.; Bodenhausen, G.; Morris, G.A. Spin echo NMR spectra without J modulation. Chem. Commun. 2012, 48, 811–813. [Google Scholar] [CrossRef]
- Wishart, D.S.; Jewison, T.; Guo, A.C.; Wilson, M.; Knox, C.; Liu, Y.; Djoumbou, Y.; Mandal, R.; Aziat, F.; Dong, E.; et al. HMDB 3.0—The Human Metabolome Database in 2013. Nucleic Acids Res. 2013, 41, D801–D807. [Google Scholar] [CrossRef] [PubMed]
- Vermathen, M.; Paul, L.E.H.; Diserens, G.l.; Vermathen, P.; Furrer, J. 1H HR-MAS NMR Based Metabolic Profiling of Cells in Response to Treatment with a Hexacationic Ruthenium Metallaprism as Potential Anticancer Drug. PLoS ONE 2015, 10, e0128478. [Google Scholar] [CrossRef] [PubMed]
- Diserens, G.; Vermathen, M.; Gjuroski, I.; Eggimann, S.; Precht, C.; Boesch, C.; Vermathen, P. Direct determination of phosphate sugars in biological material by 1H high-resolution magic-angle-spinning NMR spectroscopy. Anal. Bioanal. Chem. 2016, 408, 5651–5656. [Google Scholar] [CrossRef] [PubMed]
- Vermathen, M.; von Tengg-Kobligk, H.; Hungerbühler, M.N.; Vermathen, P.; Ruprecht, N. 1H HR-MAS NMR Based Metabolic Profiling of Lung Cancer Cells with Induced and De-Induced Cisplatin Resistance to Reveal Metabolic Resistance Adaptations. Molecules 2021, 26, 6766. [Google Scholar] [CrossRef] [PubMed]
- Shabalin, K.; Nerinovski, K.; Yakimov, A.; Kulikova, V.; Svetlova, M.; Solovjeva, L.; Khodorkovskiy, M.; Gambaryan, S.; Cunningham, R.; Migaud, M.E.; et al. NAD Metabolome Analysis in Human Cells Using ¹H NMR Spectroscopy. Int. J. Mol. Sci. 2018, 19, 3906. [Google Scholar] [CrossRef] [PubMed]
- Dieterle, F.; Ross, A.; Schlotterbeck, G.; Senn, H. Probabilistic Quotient Normalization as Robust Method to Account for Dilution of Complex Biological Mixtures. Application in 1H NMR Metabonomics. Anal. Chem. 2006, 78, 4281–4290. [Google Scholar] [CrossRef] [PubMed]
- Marin, A.; Muniruzzaman, M.; Rapoport, N. Mechanism of the ultrasonic activation of micellar drug delivery. J. Control. Release 2001, 75, 69–81. [Google Scholar] [CrossRef] [PubMed]
- Hatakeyama, H.; Akita, H.; Harashima, H. The polyethyleneglycol dilemma: Advantage and disadvantage of PEGylation of liposomes for systemic genes and nucleic acids delivery to tumors. Biol. Pharm. Bull. 2013, 36, 892–899. [Google Scholar] [CrossRef]
- Fang, Y.; Xue, J.; Gao, S.; Lu, A.; Yang, D.; Jiang, H.; He, Y.; Shi, K. Cleavable PEGylation: A strategy for overcoming the “PEG dilemma” in efficient drug delivery. Drug. Deliv. 2017, 24, 22–32. [Google Scholar] [CrossRef]
- Salmaso, S.; Caliceti, P. Stealth Properties to Improve Therapeutic Efficacy of Drug Nanocarriers. J. Drug Deliv. 2013, 2013, 374252. [Google Scholar] [CrossRef] [PubMed]
- Heitzman, J.A.; Dobratz, T.C.; Fischer, K.D.; Townsend, D. A (1)H-NMR approach to myocardial energetics. Sci. Rep. 2020, 10, 17195. [Google Scholar] [CrossRef] [PubMed]
- Vermathen, M.; Vermathen, P.; Simonis, U.; Bigler, P. Time-Dependent Interactions of the Two Porphyrinic Compounds Chlorin e6 and Mono-L-aspartyl-chlorin e6 with Phospholipid Vesicles Probed by NMR Spectroscopy. Langmuir 2008, 24, 12521–12533. [Google Scholar] [CrossRef] [PubMed]
- Rocha, C.M.; Barros, A.S.; Gil, A.M.; Goodfellow, B.J.; Humpfer, E.; Spraul, M.; Carreira, I.M.; Melo, J.B.; Bernardo, J.; Gomes, A.; et al. Metabolic Profiling of Human Lung Cancer Tissue by 1H High Resolution Magic Angle Spinning (HRMAS) NMR Spectroscopy. J. Proteome Res. 2010, 9, 319–332. [Google Scholar] [CrossRef] [PubMed]
- Zietkowski, D.; Payne, G.S.; Nagy, E.; Mobberley, M.A.; Ryder, T.A.; deSouza, N.M. Comparison of NMR lipid profiles in mitotic arrest and apoptosis as indicators of paclitaxel resistance in cervical cell lines. Magn. Reson. Med. 2012, 68, 369–377. [Google Scholar] [CrossRef] [PubMed]
- Sahay, G.; Batrakova, E.V.; Kabanov, A.V. Different internalization pathways of polymeric micelles and unimers and their effects on vesicular transport. Bioconjug. Chem. 2008, 19, 2023–2029. [Google Scholar] [CrossRef] [PubMed]
- Nelemans, L.C.; Gurevich, L. Drug Delivery with Polymeric Nanocarriers-Cellular Uptake Mechanisms. Materials 2020, 13, 366. [Google Scholar] [CrossRef] [PubMed]
- Penjweini, R.; Smisdom, N.; Deville, S.; Ameloot, M. Transport and accumulation of PVP-Hypericin in cancer and normal cells characterized by image correlation spectroscopy techniques. Biochim. Biophys Acta 2014, 1843, 855–865. [Google Scholar] [CrossRef]
- Luss, A.L.; Kulikov, P.P.; Romme, S.B.; Andersen, C.L.; Pennisi, C.P.; Docea, A.O.; Kuskov, A.N.; Velonia, K.; Mezhuev, Y.O.; Shtilman, M.I.; et al. Nanosized carriers based on amphiphilic poly-N-vinyl-2-pyrrolidone for intranuclear drug delivery. Nanomedicine 2018, 13, 703–715. [Google Scholar] [CrossRef]
- Kulikov, P.P.; Luss, A.L.; Nelemans, L.C.; Shtilman, M.I.; Mezhuev, Y.O.; Kuznetsov, I.A.; Sizova, O.Y.; Christiansen, G.; Pennisi, C.P.; Gurevich, L. Synthesis, Self-Assembly and In Vitro Cellular Uptake Kinetics of Nanosized Drug Carriers Based on Aggregates of Amphiphilic Oligomers of N-Vinyl-2-pyrrolidone. Materials 2021, 14, 5977. [Google Scholar] [CrossRef]
- Abraham, R.J.; Fell, S.C.M.; Smith, K.M. The n.m.r. spectra of porphyrins. 13—A ring current model for the porphyrin and chlorin (7,8-dihydroporphyrin) rings. Org. Magn. Reson. 1977, 9, 367–373. [Google Scholar] [CrossRef]
- Gjuroski, I.; Furrer, J.; Vermathen, M. Probing the Interactions of Porphyrins with Macromolecules Using NMR Spectroscopy Techniques. Molecules 2021, 26, 1942. [Google Scholar] [CrossRef] [PubMed]
- Moreira, L.M.; dos Santos, F.V.; Lyon, J.P.; Maftoum-Costa, M.; Pacheco-Soares, C.; da Silva, N.S. Photodynamic therapy: Porphyrins and phthalocyanines as Photosensitizers. Aust. J. Chem. 2008, 61, 741–754. [Google Scholar] [CrossRef]
- Moan, J.; Berg, K.; Kvam, E.; Western, A.; Malik, Z.; Rück, A.; Schneckenburger, H. Intracellular Localization of Photosensitizers. In Ciba Foundation Symposium 146—Photosensitizing Compounds: Their Chemistry, Biology and Clinical Use; Wiley: Hoboken, NJ, USA, 2007; pp. 95–111. [Google Scholar]
- Vermathen, M.; Marzorati, M.; Vermathen, P.; Bigler, P. pH-Dependent Distribution of Chlorin e6 Derivatives across Phospholipid Bilayers Probed by NMR Spectroscopy. Langmuir 2010, 26, 11085–11094. [Google Scholar] [CrossRef] [PubMed]
- Marzorati, M.; Bigler, P.; Vermathen, M. Interactions between selected photosensitizers and model membranes: An NMR classification. Biochim. Biophys. Acta-Biomembr. 2011, 1808, 1661–1672. [Google Scholar] [CrossRef] [PubMed]
- Fages, A.; Pontoizeau, C.; Jobard, E.; Lévy, P.; Bartosch, B.; Elena-Herrmann, B. Batch profiling calibration for robust NMR metabonomic data analysis. Anal. Bioanal. Chem. 2013, 405, 8819–8827. [Google Scholar] [CrossRef] [PubMed]
- van den Berg, R.A.; Hoefsloot, H.C.; Westerhuis, J.A.; Smilde, A.K.; van der Werf, M.J. Centering, scaling, and transformations: Improving the biological information content of metabolomics data. BMC Genom. 2006, 7, 142. [Google Scholar] [CrossRef]
- Saito, R.d.F.; Andrade, L.N.d.S.; Bustos, S.O.; Chammas, R. Phosphatidylcholine-Derived Lipid Mediators: The Crosstalk Between Cancer Cells and Immune Cells. Front. Immunol. 2022, 13, 768606. [Google Scholar] [CrossRef]
- Ackerstaff, E.; Glunde, K.; Bhujwalla, Z.M. Choline phospholipid metabolism: A target in cancer cells? J. Cell. Biochem. 2003, 90, 525–533. [Google Scholar] [CrossRef]
- Glunde, K.; Ackerstaff, E.; Mori, N.; Jacobs, M.A.; Bhujwalla, Z.M. Choline Phospholipid Metabolism in Cancer: Consequences for Molecular Pharmaceutical Interventions. Mol. Pharm. 2006, 3, 496–506. [Google Scholar] [CrossRef]
- Hernández-Alcoceba, R.; Saniger, L.; Campos, J.; Núñez, M.C.; Khaless, F.; Gallo, M.A.; Espinosa, A.; Lacal, J.C. Choline kinase inhibitors as a novel approach for antiproliferative drug design. Oncogene 1997, 15, 2289–2301. [Google Scholar] [CrossRef] [PubMed]
- Cheng, M.; Bhujwalla, Z.M.; Glunde, K. Targeting Phospholipid Metabolism in Cancer. Front. Oncol. 2016, 6, 266. [Google Scholar] [CrossRef] [PubMed]
- Icard, P.; Coquerel, A.; Wu, Z.; Gligorov, J.; Fuks, D.; Fournel, L.; Lincet, H.; Simula, L. Understanding the Central Role of Citrate in the Metabolism of Cancer Cells and Tumors: An Update. Int. J. Mol. Sci. 2021, 22, 6587. [Google Scholar] [CrossRef] [PubMed]
- Zara, V.; Assalve, G.; Ferramosca, A. Multiple roles played by the mitochondrial citrate carrier in cellular metabolism and physiology. Cell. Mol. Life Sci. 2022, 79, 428. [Google Scholar] [CrossRef] [PubMed]
- Fedotcheva, N.I.; Sokolov, A.P.; Kondrashova, M.N. Nonezymatic formation of succinate in mitochondria under oxidative stress. Free. Radic. Biol. Med. 2006, 41, 56–64. [Google Scholar] [CrossRef] [PubMed]
- Tretter, L.; Patocs, A.; Chinopoulos, C. Succinate, an intermediate in metabolism, signal transduction, ROS, hypoxia, and tumorigenesis. Biochim. Biophys. Acta (BBA) Bioenerg. 2016, 1857, 1086–1101. [Google Scholar] [CrossRef] [PubMed]
- Zhang, Y.; Guo, S.; Xie, C.; Fang, J. Uridine Metabolism and Its Role in Glucose, Lipid, and Amino Acid Homeostasis. Biomed. Res. Int. 2020, 2020, 7091718. [Google Scholar] [CrossRef]
- Balcerczyk, A.; Damblon, C.; Elena-Herrmann, B.; Panthu, B.; Rautureau, G.J.P. Metabolomic Approaches to Study Chemical Exposure-Related Metabolism Alterations in Mammalian Cell Cultures. Int. J. Mol. Sci. 2020, 21, 6843. [Google Scholar] [CrossRef]
- Rashid, M.U.; Coombs, K.M. Serum-reduced media impacts on cell viability and protein expression in human lung epithelial cells. J. Cell. Physiol. 2019, 234, 7718–7724. [Google Scholar] [CrossRef]
- Rusz, M.; Del Favero, G.; El Abiead, Y.; Gerner, C.; Keppler, B.K.; Jakupec, M.A.; Koellensperger, G. Morpho-metabotyping the oxidative stress response. Sci. Rep. 2021, 11, 15471. [Google Scholar] [CrossRef]

| Carrier | |||
|---|---|---|---|
| Ce4 Conc. [μM] | None | PVP [208.3 μM] | KP [3 mM] |
| 0 | Ctrl1, Ctrl2 | PVP | KP |
| 10 | Ce4-10 | PVP-Ce4-10 | KP-Ce4-10 |
| 25 | Ce4-25 | PVP-Ce4-25 | KP-Ce4-25 |
| 62.5 | Ce4-62.5 | PVP-Ce4-62.5 | KP-Ce4-62.5 |
| Compound | Abbreviation | Chemical Shift [ppm] | Multipl. | Group |
|---|---|---|---|---|
| Amino acids | ||||
| Alanine | Ala | 1.477 3.779 | (d) (q) | β-CH3 α-CH |
| Arginine | Arg | 1.656 3.214 | (m) (t) | γ-CH2 δ-CH2 |
| Aspartate | Asp | 2.689 2.814 3.894 | (m) (m) (m) | β-CH2 β-CH2 α-CH |
| Glutamate | Glu | 2.043 2.346 3.766 | (m) (m) (t) | β-CH2 γ-CH2 α-CH |
| Glutamine | Gln | 2.138 2.448 3.778 | (m) (m) (t) | β-CH2 γ-CH2 α-CH |
| Glycine | Gly | 3.558 | (s) | α-CH2 |
| Histidine a | His | 7.95 7.14 | (s) (s) | 2-CH (imid) 4-CH (imid) |
| Isoleucine | Ile | 0.937 1.009 1.257 1.461 1.982 3.673 | (t) (d) (m) (m) (m) (d) | δ-CH3 γ′-CH3 γ-CH2 γ-CH2 β-CH α-CH |
| Leucine | Leu | 0.959 1.709 3.744 | (d) (m) (t) | δ-CH3, δ′-CH3 γ-CH, β-CH2 α-CH |
| Lysine | Lys | 1.462 1.703 1.883 3.003 | (m) (m) (m) (t) | γ-CH2 δ-CH2 β-CH2 ε-CH2 |
| Phenylalanine | Phe | 7.317 7.367 7.411 3.994 3.273 3.131 | (d) (t) (d) (m) (m) (m) | -CH -CH -CH α-CH β-CH2 β-CH2 |
| Proline | Pro | 2.03 2.352 3.333 3.415 4.145 | (m) (m) (m) (m) (m) | γ-CH2 β-CH2 δ′-Ch2 δ″-CH2 α-CH |
| Threonine | Thr | 1.33 3.587 4.257 | (d) (d) (m) | γ-CH3 α-CH β-CH |
| Tyrosine | Tyr | 6.887 7.182 3.943 3.205 3.052 | (d) (d) (m) (m) (m) | -CH -CH α-CH β-CH2 β-CH2 |
| Valine | Val | 0.985 1.041 2.272 3.613 | (d) (d) (m) (d) | γ-CH3 γ′-CH3 β-CH α-CH |
| Peptides | ||||
| Glutathione | GSH | 2.166 2.554 2.958 3.780 3.787 4.577 8.393 8.587 | (m) (m) (dd) (s) (t) (m) | β-CH2 (Glu) γ-CH2 (Glu) β′-CH2 (Cys) α″-CH (Gly) α-CH (Glu) α′-CH (Cys) -NH (Gly) -NH (Cys) |
| Lysine-containing peptide b | LysP | 1.462 1.703 3.003 | (m) (m) (t) | γ-CH2 δ-CH2 ε-CH2 |
| Tyrosine-containing peptide | TyrP | 6.813 7.112 | (br) (br) | -CH -CH |
| Organic acids | ||||
| Acetate | Ac | 1.919 | (s) | -CH3 |
| Citrate | Cit | 2.68 2.811 | (d) (d) | -CH2 -CH2 |
| Formic acid | For | 8.45 | (s) | -CH |
| Fumarate | Fum | 6.519 | (s) | CH=CH |
| Lactate | Lac | 1.33 4.121 | (d) (q) | β-CH3 α-CH |
| Succinate | Suc | 2.405 | (s) | -CH2 |
| Amines | ||||
| β-Alanine | β-Ala | 2.57 3.18 | (t) (t) | α-CH2 β-CH2 |
| Creatine | Cre | 3.03 3.934 | (s) (s) | -CH3 -CH2 |
| Taurine | Tau | 3.264 3.421 | (t) (t) | SO3H-CH2 NH2-CH2 |
| Choline-containing compounds | ||||
| Choline | Cho | 3.208 3.528 4.067 | (s) (m) (m) | -N+(CH3)3 N-CH2 O-CH2 |
| Glycerophosphocholine | GPC | 3.233 3.695 4.338 | (s, br) (m) (m) | -N+(CH3)3 N-CH2 O-CH2 |
| Phosphocholine | PC | 3.224 3.605 4.166 | (s) (m) (m) | -N+(CH3)3 N-CH2 O-CH2 |
| Phosphatidylcholine b | PLC | 3.273 | (s, br) | -N+(CH3)3 |
| Nucleobases, nucleosides, and nucleotides | ||||
| Adenosine phosphate c,d | AXP | 8.62 8.228 | (s) (s) | 8-CH 2-CH |
| Hypoxanthine | Hxn | 8.188 8.208 | (s) (s) | 8-CH 2-CH |
| Inosine/Adenosine d | Ino/Ado | 8.235 8.358 6.101 4.781 4.471 | (s) (s) (d) (t) (m) | 8-CH 2-CH 1′-CH (Rib) 2′-CH (Rib) 3′-CH (Rib) |
| 1-Methylnicotinamide e | 1-MNA | 9.283 8.982 8.897 4.48 | (s) (s) (d) (s) | 2-CH 6-CH 4-CH N+-CH3 |
| NAD+ | NAD+ | 9.325 9.117 8.804 8.43 8.166 8.139 6.074 | (s) (d) (d) (s) (t) (s) (d) | 2-CH (Nic) 6-CH (Nic) 4-CH (Nic) 2′-CH (Ade) 5-CH (Nic) 8′-CH (Ade) 1-CH (Rib) |
| NADP+ | NADP+ | 9.305 | (s) | 2-CH (Nic) |
| Nicotinamide e | NA | 8.933 8.706 8.235 7.582 | (s) (d) (d) (dd) | 2-CH 6-CH 4-CH 5-CH |
| Uridine monophosphate c | UMP | 8.14 5.998 | (d) (d) | 6-CH (Ura) 5-CH (Ura) |
| Uracil | Ura | 7.534 5.797 | (d) (d) | 6-CH 5-CH |
| Uridine | Urd | 7.897 5.894 5.922 4.357 4.229 4.123 3.828 | (d) (d) (d) (m) | 6-CH (Ura) 5-CH (Ura) 1′-CH (Rib) 2′,3′-CH (Rib) 4′-CH (Rib) 5a′-CH2 (Rib) 5b′-CH2 (Rib) |
| Uridine triphosphate | UTP | 7.965 5.967 5.985 4.375 4.282 | (d) (d) (d) (m) | 6-CH (Ura) 5-CH (Ura) 1′-CH (Rib) 2′,3′-CH (Rib) 4′-CH (Rib) |
| Nucleotide-/phosphate-sugars | ||||
| Ribose-5-Phosphate | R5P | 5.388 5.257 4.129 | (dd) (d) | 1-CH 1-CH 2-CH |
| UDP-N-Acetyl-glucosamine | UNGlc | 5.515 2.079 4.378 4.289 5.963 5.985 7.969 | (dd) (s) (d) (d) (d) | 1-CH (Glc) Ac-CH3 2′,3′-CH (Rib) 4′-CH (Rib) 5-CH (Ura) 1′-CH (Rib) 6-CH (Ura) |
| UDP-N-Acetyl-galactosamine | UNGal | 5.548 2.085 4.378 4.289 5.963 5.985 | (dd) (s) (d) (d) | 1-CH (Gal) Ac-CH3 2′,3′-CH (Rib) 4′-CH (Rib) 5-CH (Ura) 1′-CH (Rib) |
| UDP- Glucose/UDP- Glucuronic acid d | UGlc(A) | 5.612 | (dd) | 1-CH (Glc(A)) |
| Lipids | ||||
| Fatty acids | FA | 0.867 1.192 1.302 | (br) (br) (br) | ω-CH3 (-CH2)n (-CH2)n |
| Fatty acids (saturated) | sFA | 0.883 1.615 | (t) (br) | ω-CH3 β-CH2- |
| Lipids b | Lip | 0.936 1.293 1.628 2.073 2.292 | (t) (br) (br) (br) (br) | ω-CH2- (-CH2)n β-CH2 -CH2-CH= α-CH2 |
| Others | ||||
| Ethanol | Eth | 1.193 3.668 | (t) (q) | -CH3 -CH2 |
| Polyethylene glycol f | PEG | 3.711 | (s) | -CH2 |
| Polypropylene glycol f | PPG | 1.16 | (br) | -CH3 |
Disclaimer/Publisher’s Note: The statements, opinions and data contained in all publications are solely those of the individual author(s) and contributor(s) and not of MDPI and/or the editor(s). MDPI and/or the editor(s) disclaim responsibility for any injury to people or property resulting from any ideas, methods, instructions or products referred to in the content. |
© 2023 by the authors. Licensee MDPI, Basel, Switzerland. This article is an open access article distributed under the terms and conditions of the Creative Commons Attribution (CC BY) license (https://creativecommons.org/licenses/by/4.0/).
Share and Cite
Vermathen, M.; Kämpfer, T.; Nuoffer, J.-M.; Vermathen, P. Intracellular Fate of the Photosensitizer Chlorin e4 with Different Carriers and Induced Metabolic Changes Studied by 1H NMR Spectroscopy. Pharmaceutics 2023, 15, 2324. https://doi.org/10.3390/pharmaceutics15092324
Vermathen M, Kämpfer T, Nuoffer J-M, Vermathen P. Intracellular Fate of the Photosensitizer Chlorin e4 with Different Carriers and Induced Metabolic Changes Studied by 1H NMR Spectroscopy. Pharmaceutics. 2023; 15(9):2324. https://doi.org/10.3390/pharmaceutics15092324
Chicago/Turabian StyleVermathen, Martina, Tobias Kämpfer, Jean-Marc Nuoffer, and Peter Vermathen. 2023. "Intracellular Fate of the Photosensitizer Chlorin e4 with Different Carriers and Induced Metabolic Changes Studied by 1H NMR Spectroscopy" Pharmaceutics 15, no. 9: 2324. https://doi.org/10.3390/pharmaceutics15092324