
Investigating the Influence of Processing Conditions on Dissolution and Physical Stability of Solid Dispersions with Fenofibrate and Mesoporous Silica

Abstract
:1. Introduction
2. Materials and Methods
2.1. Preparation of SDs
2.2. Characterization
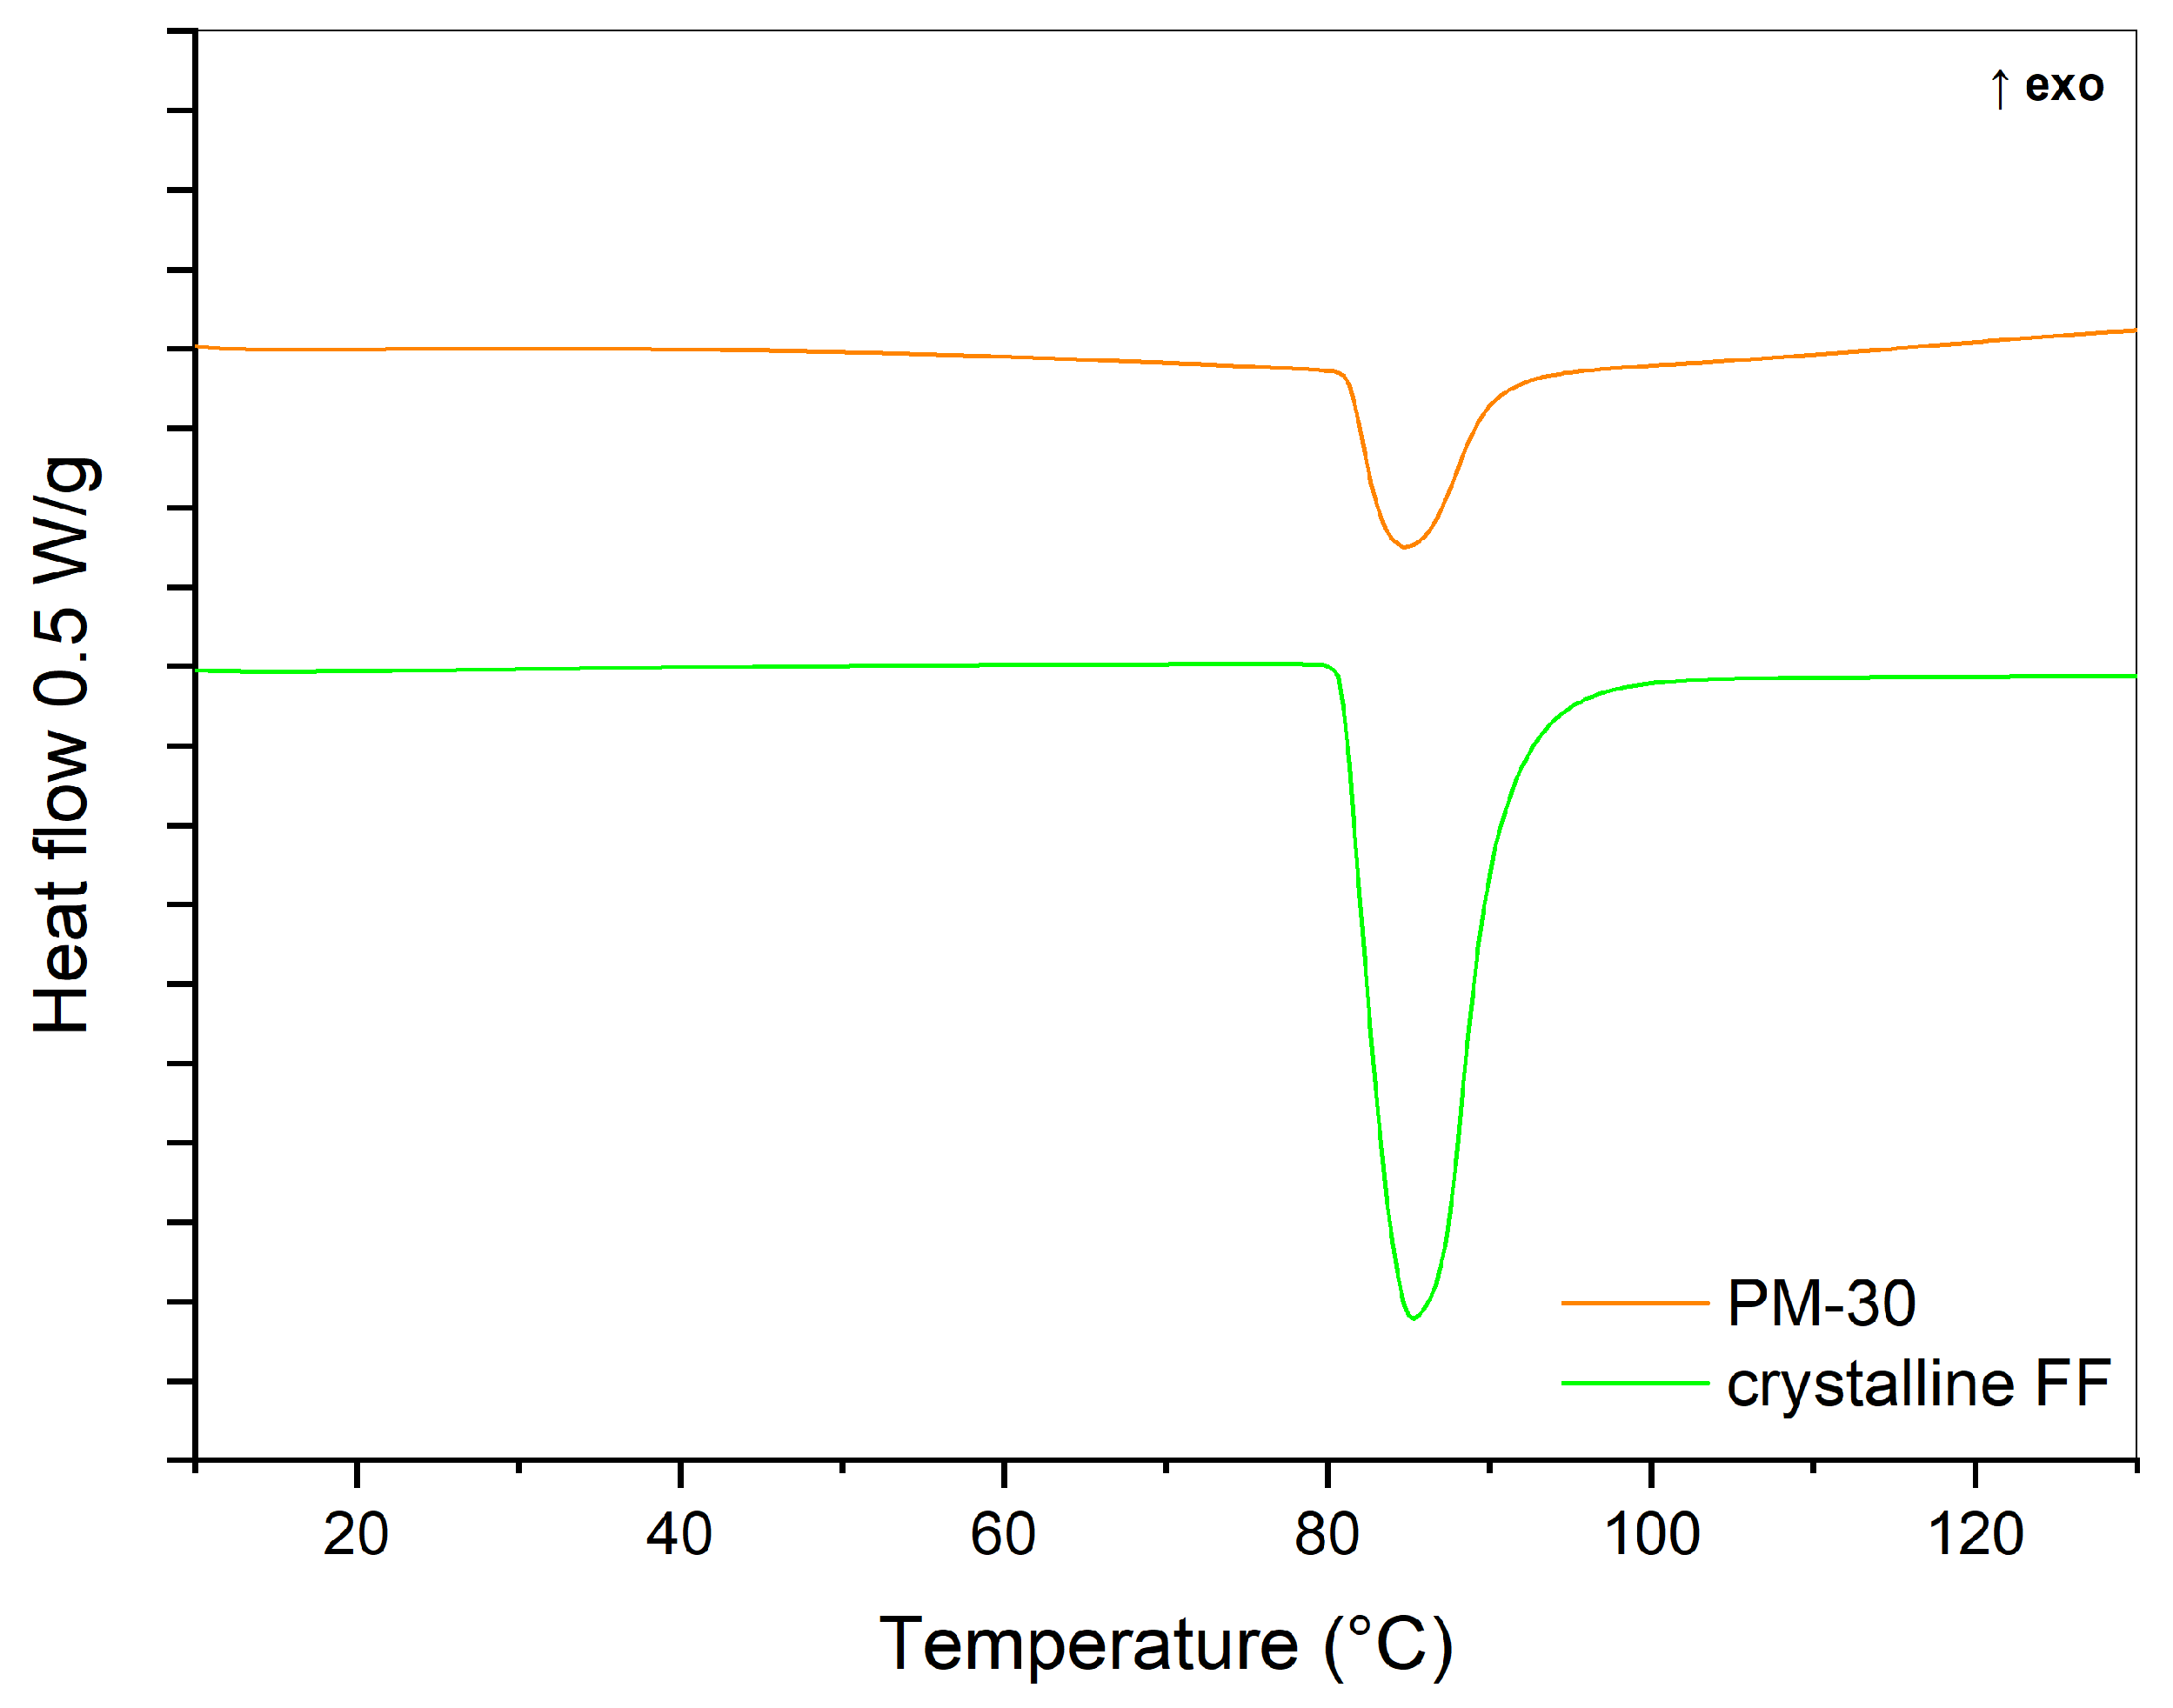
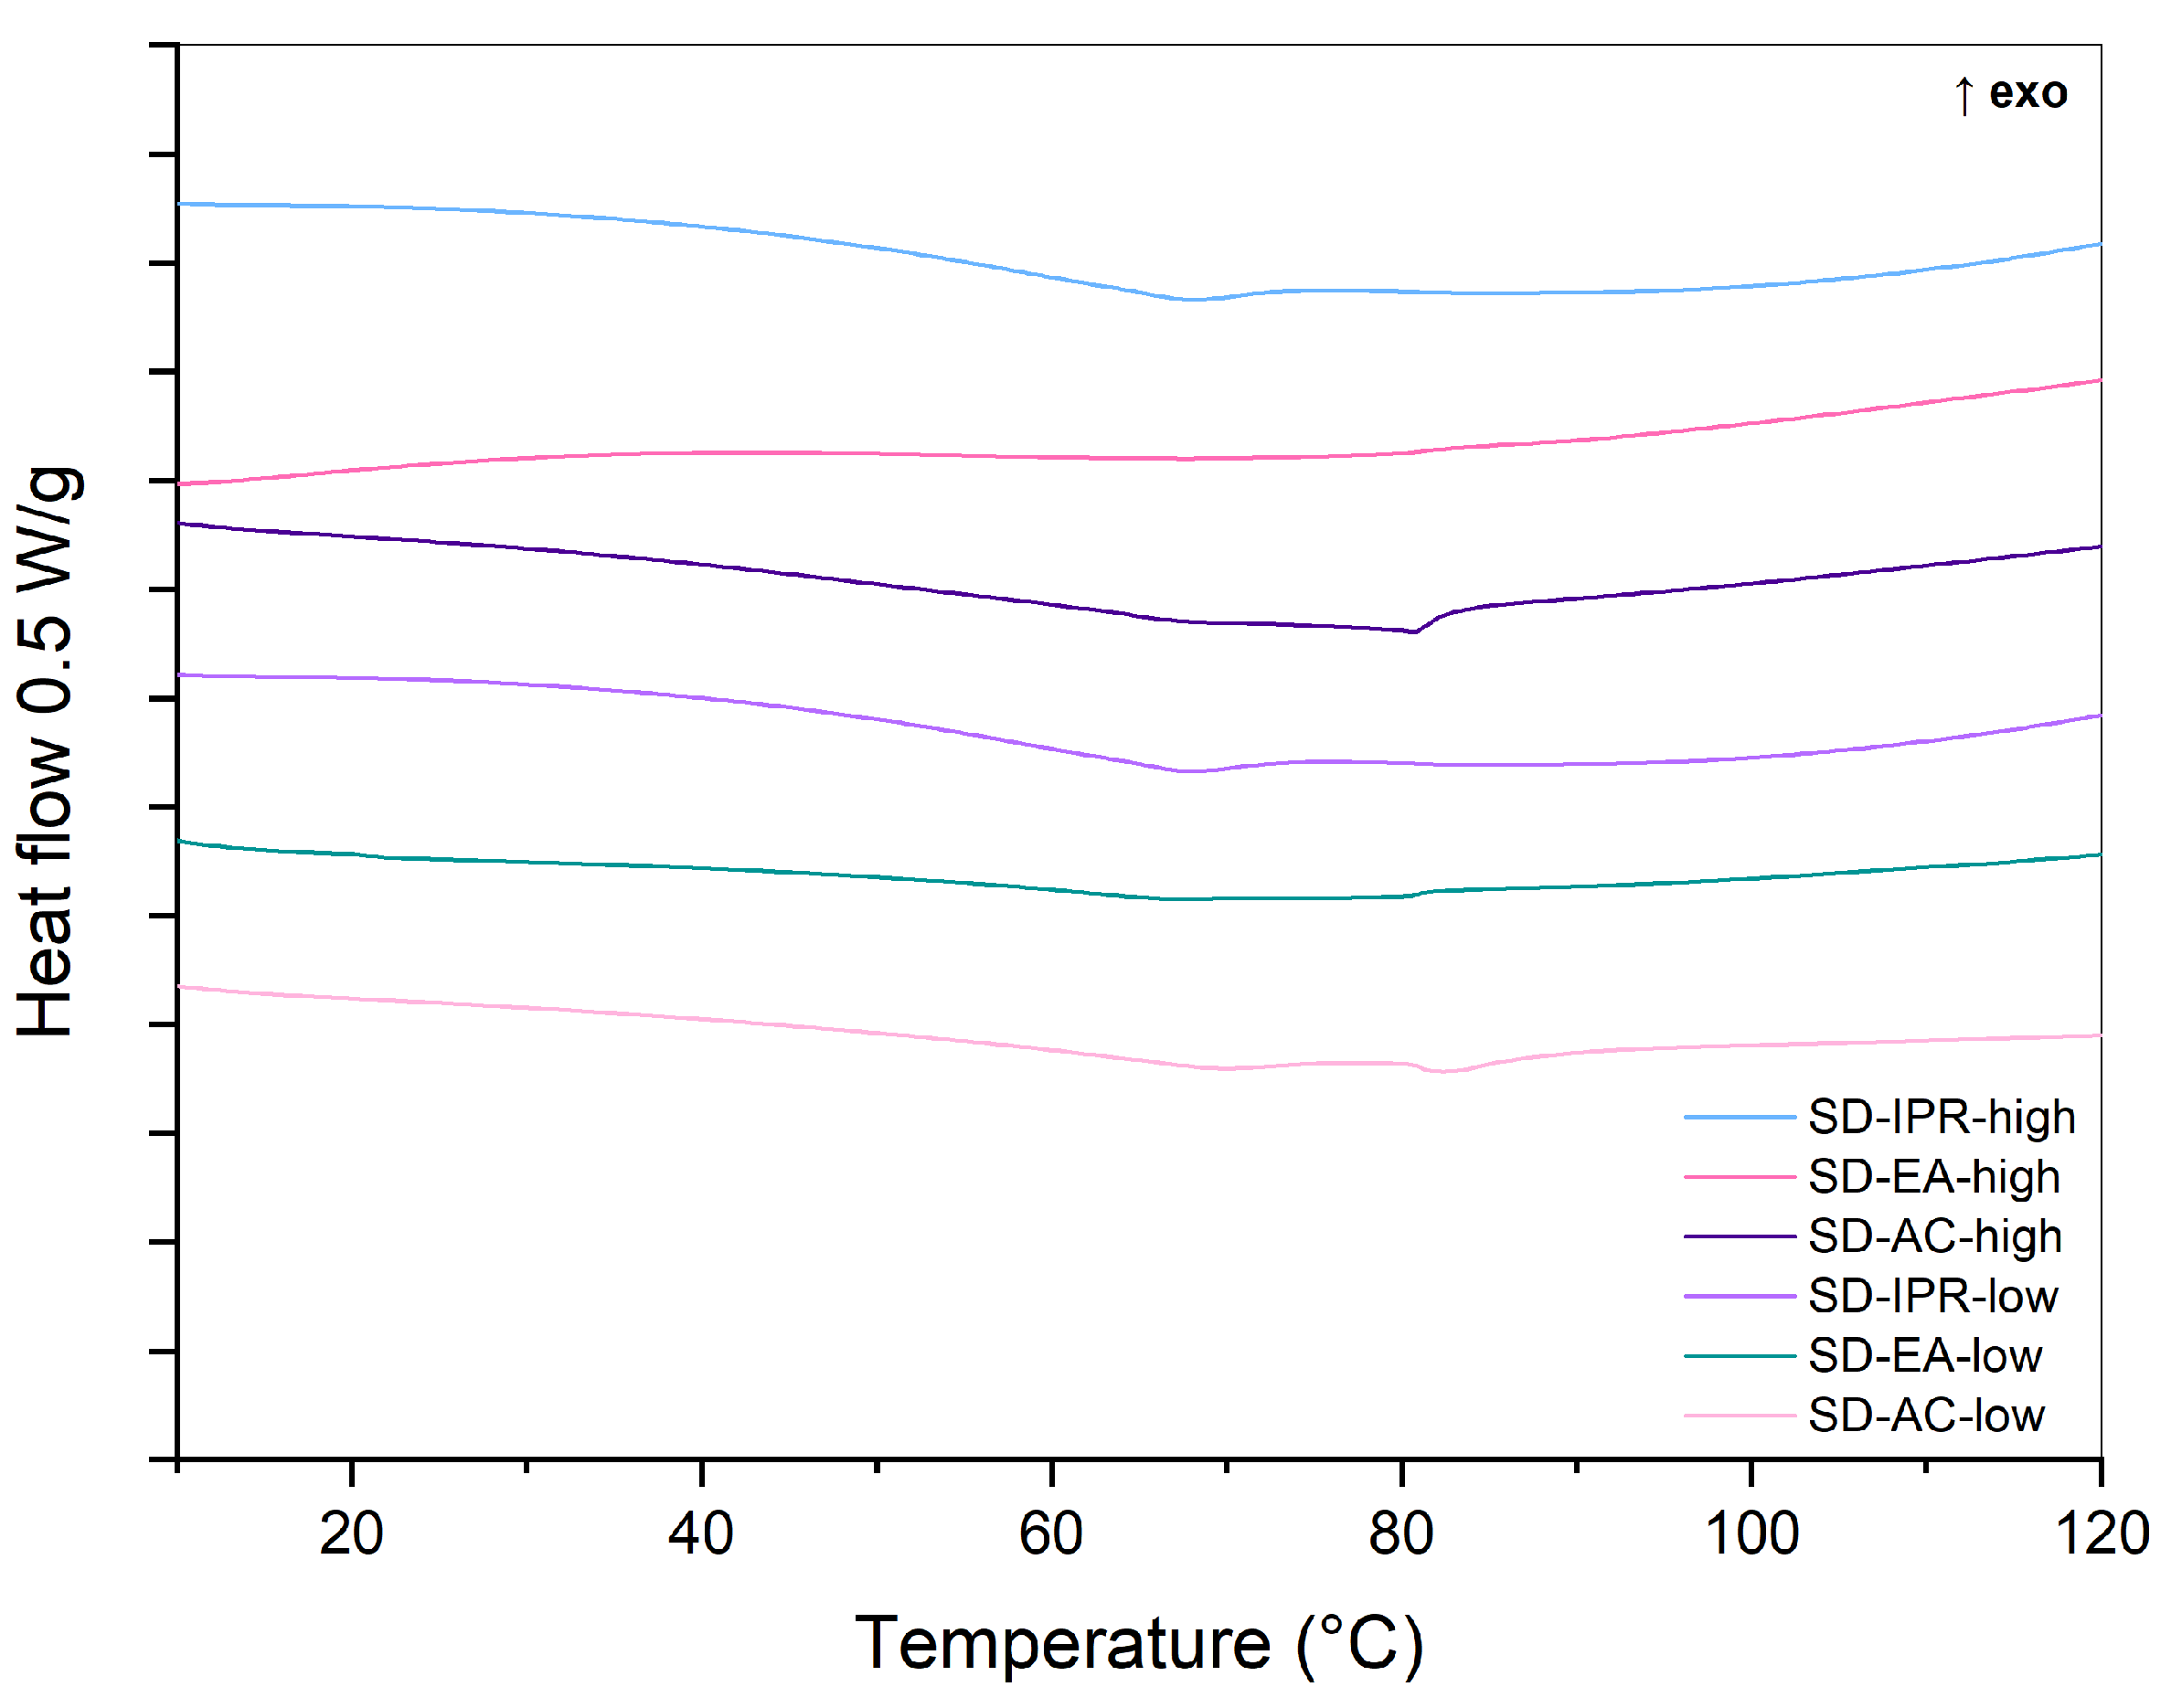
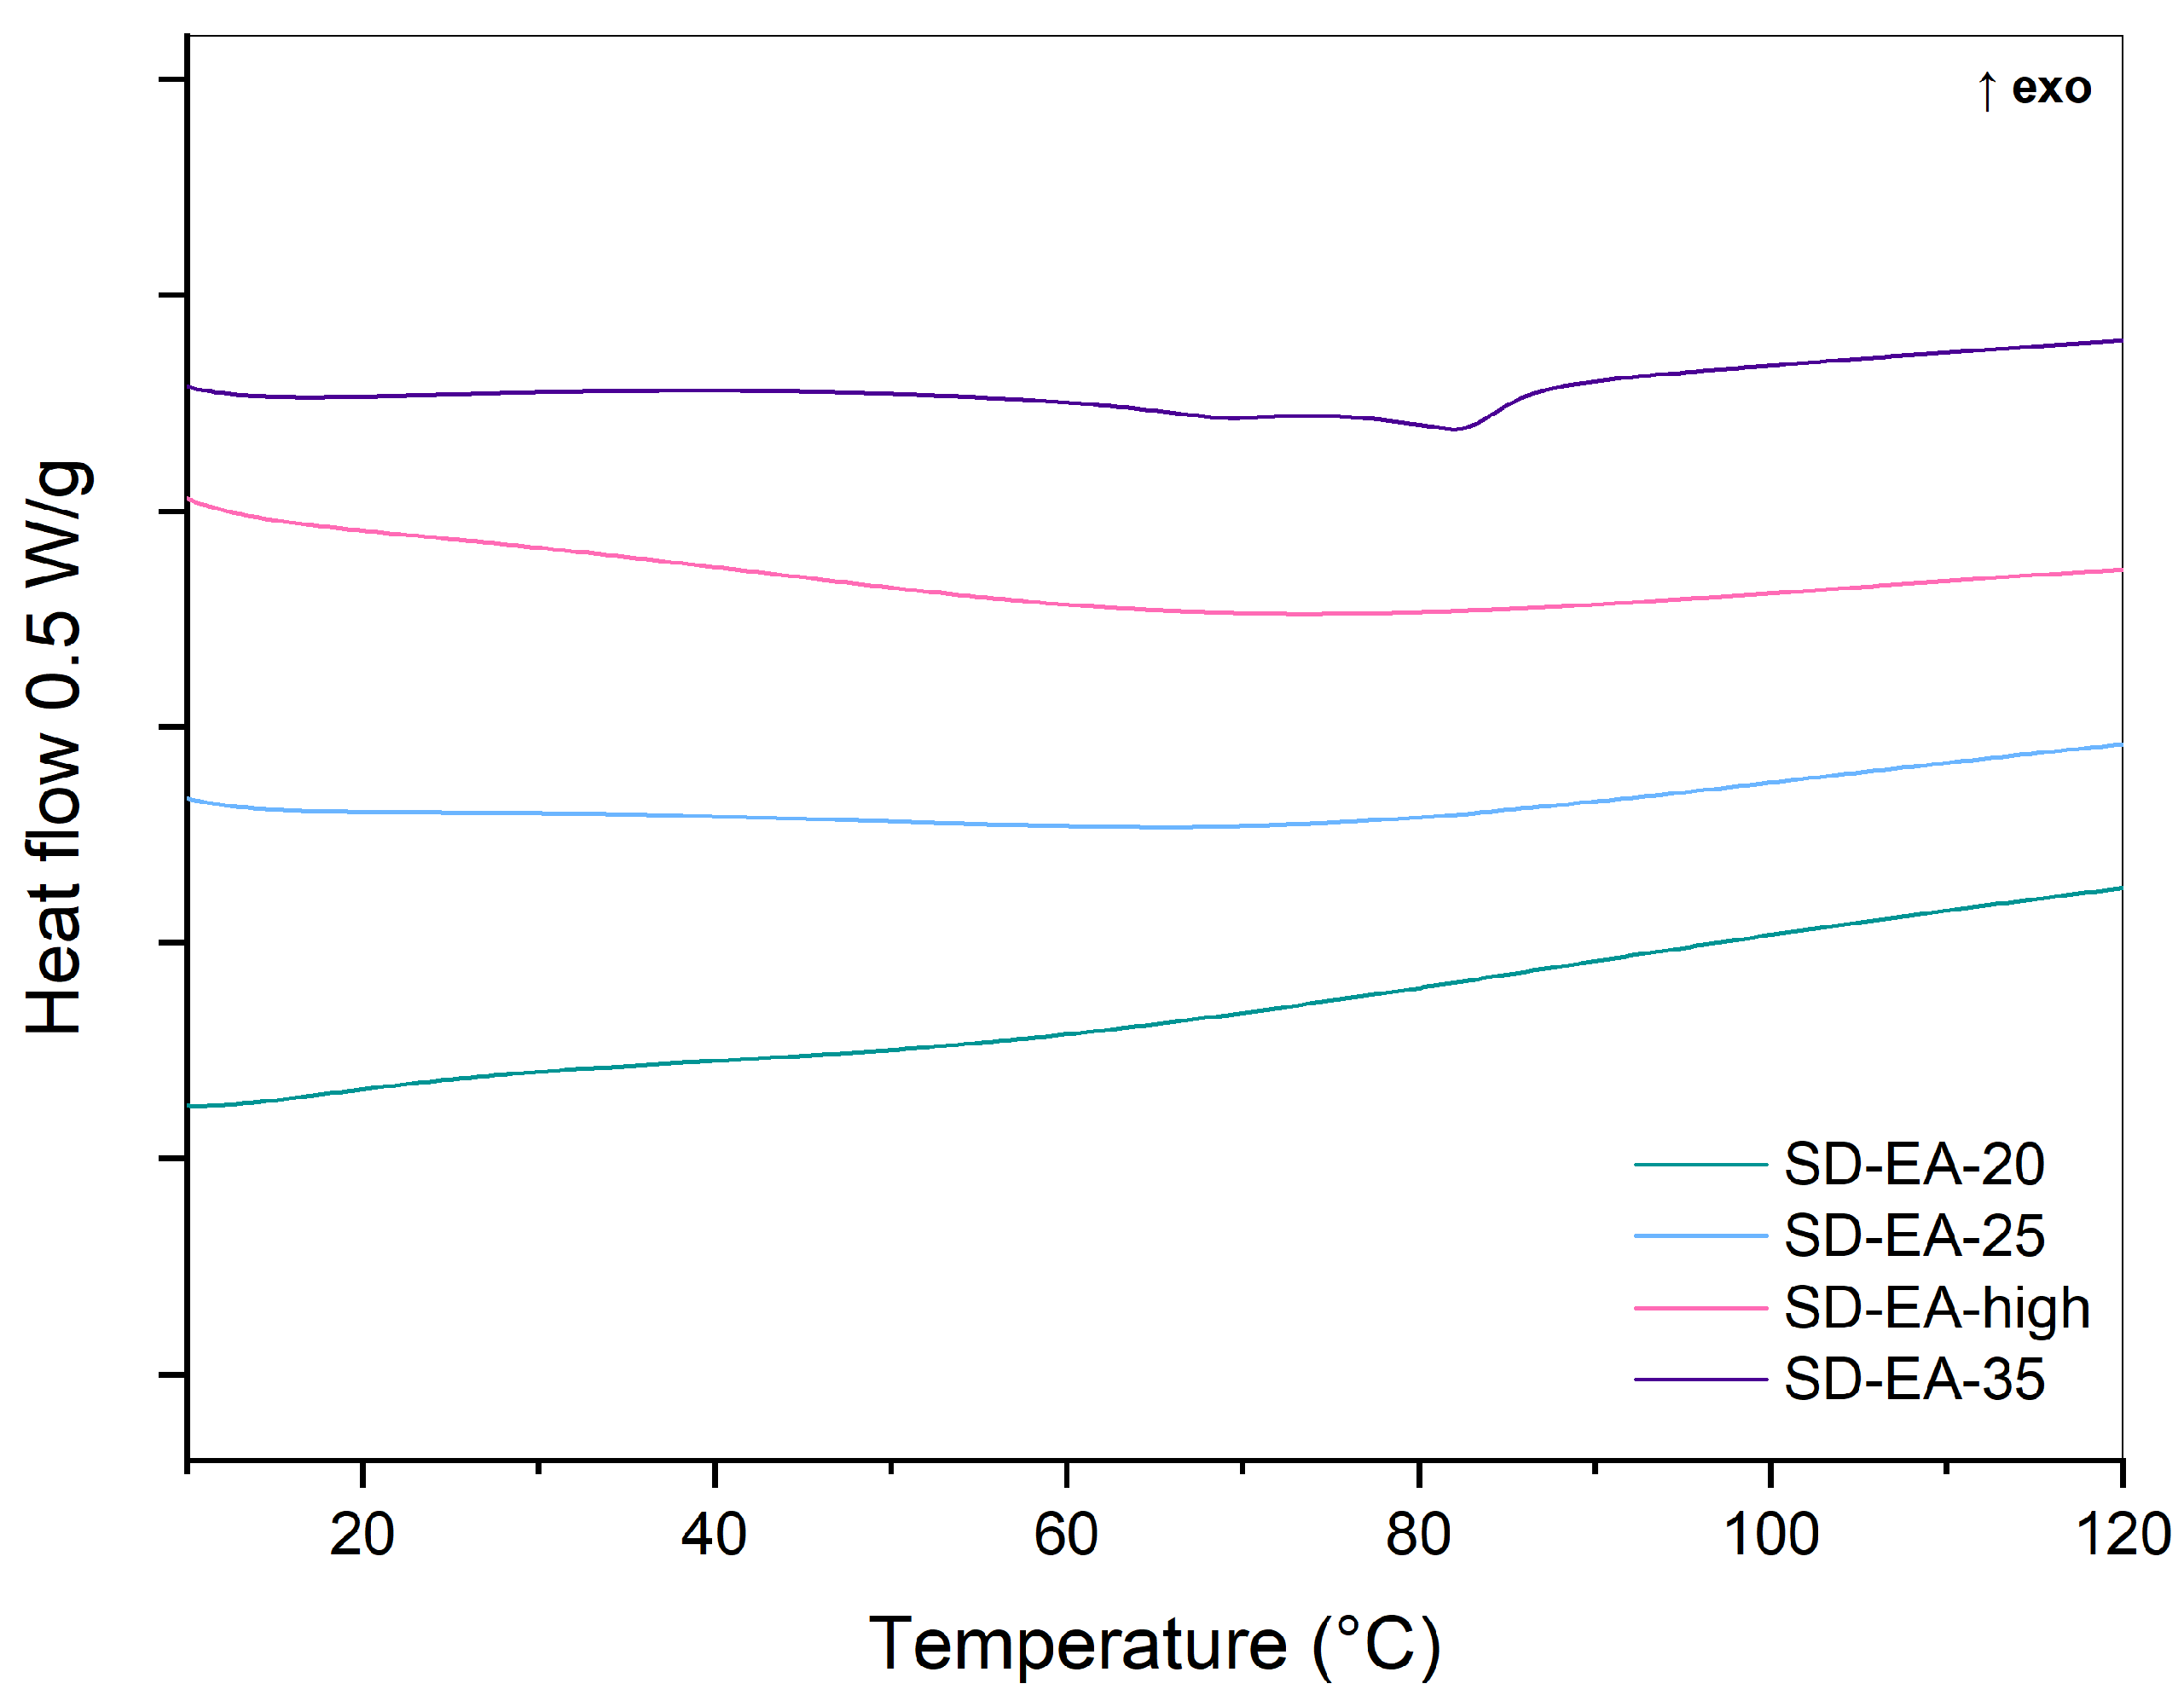
2.2.1. DSC
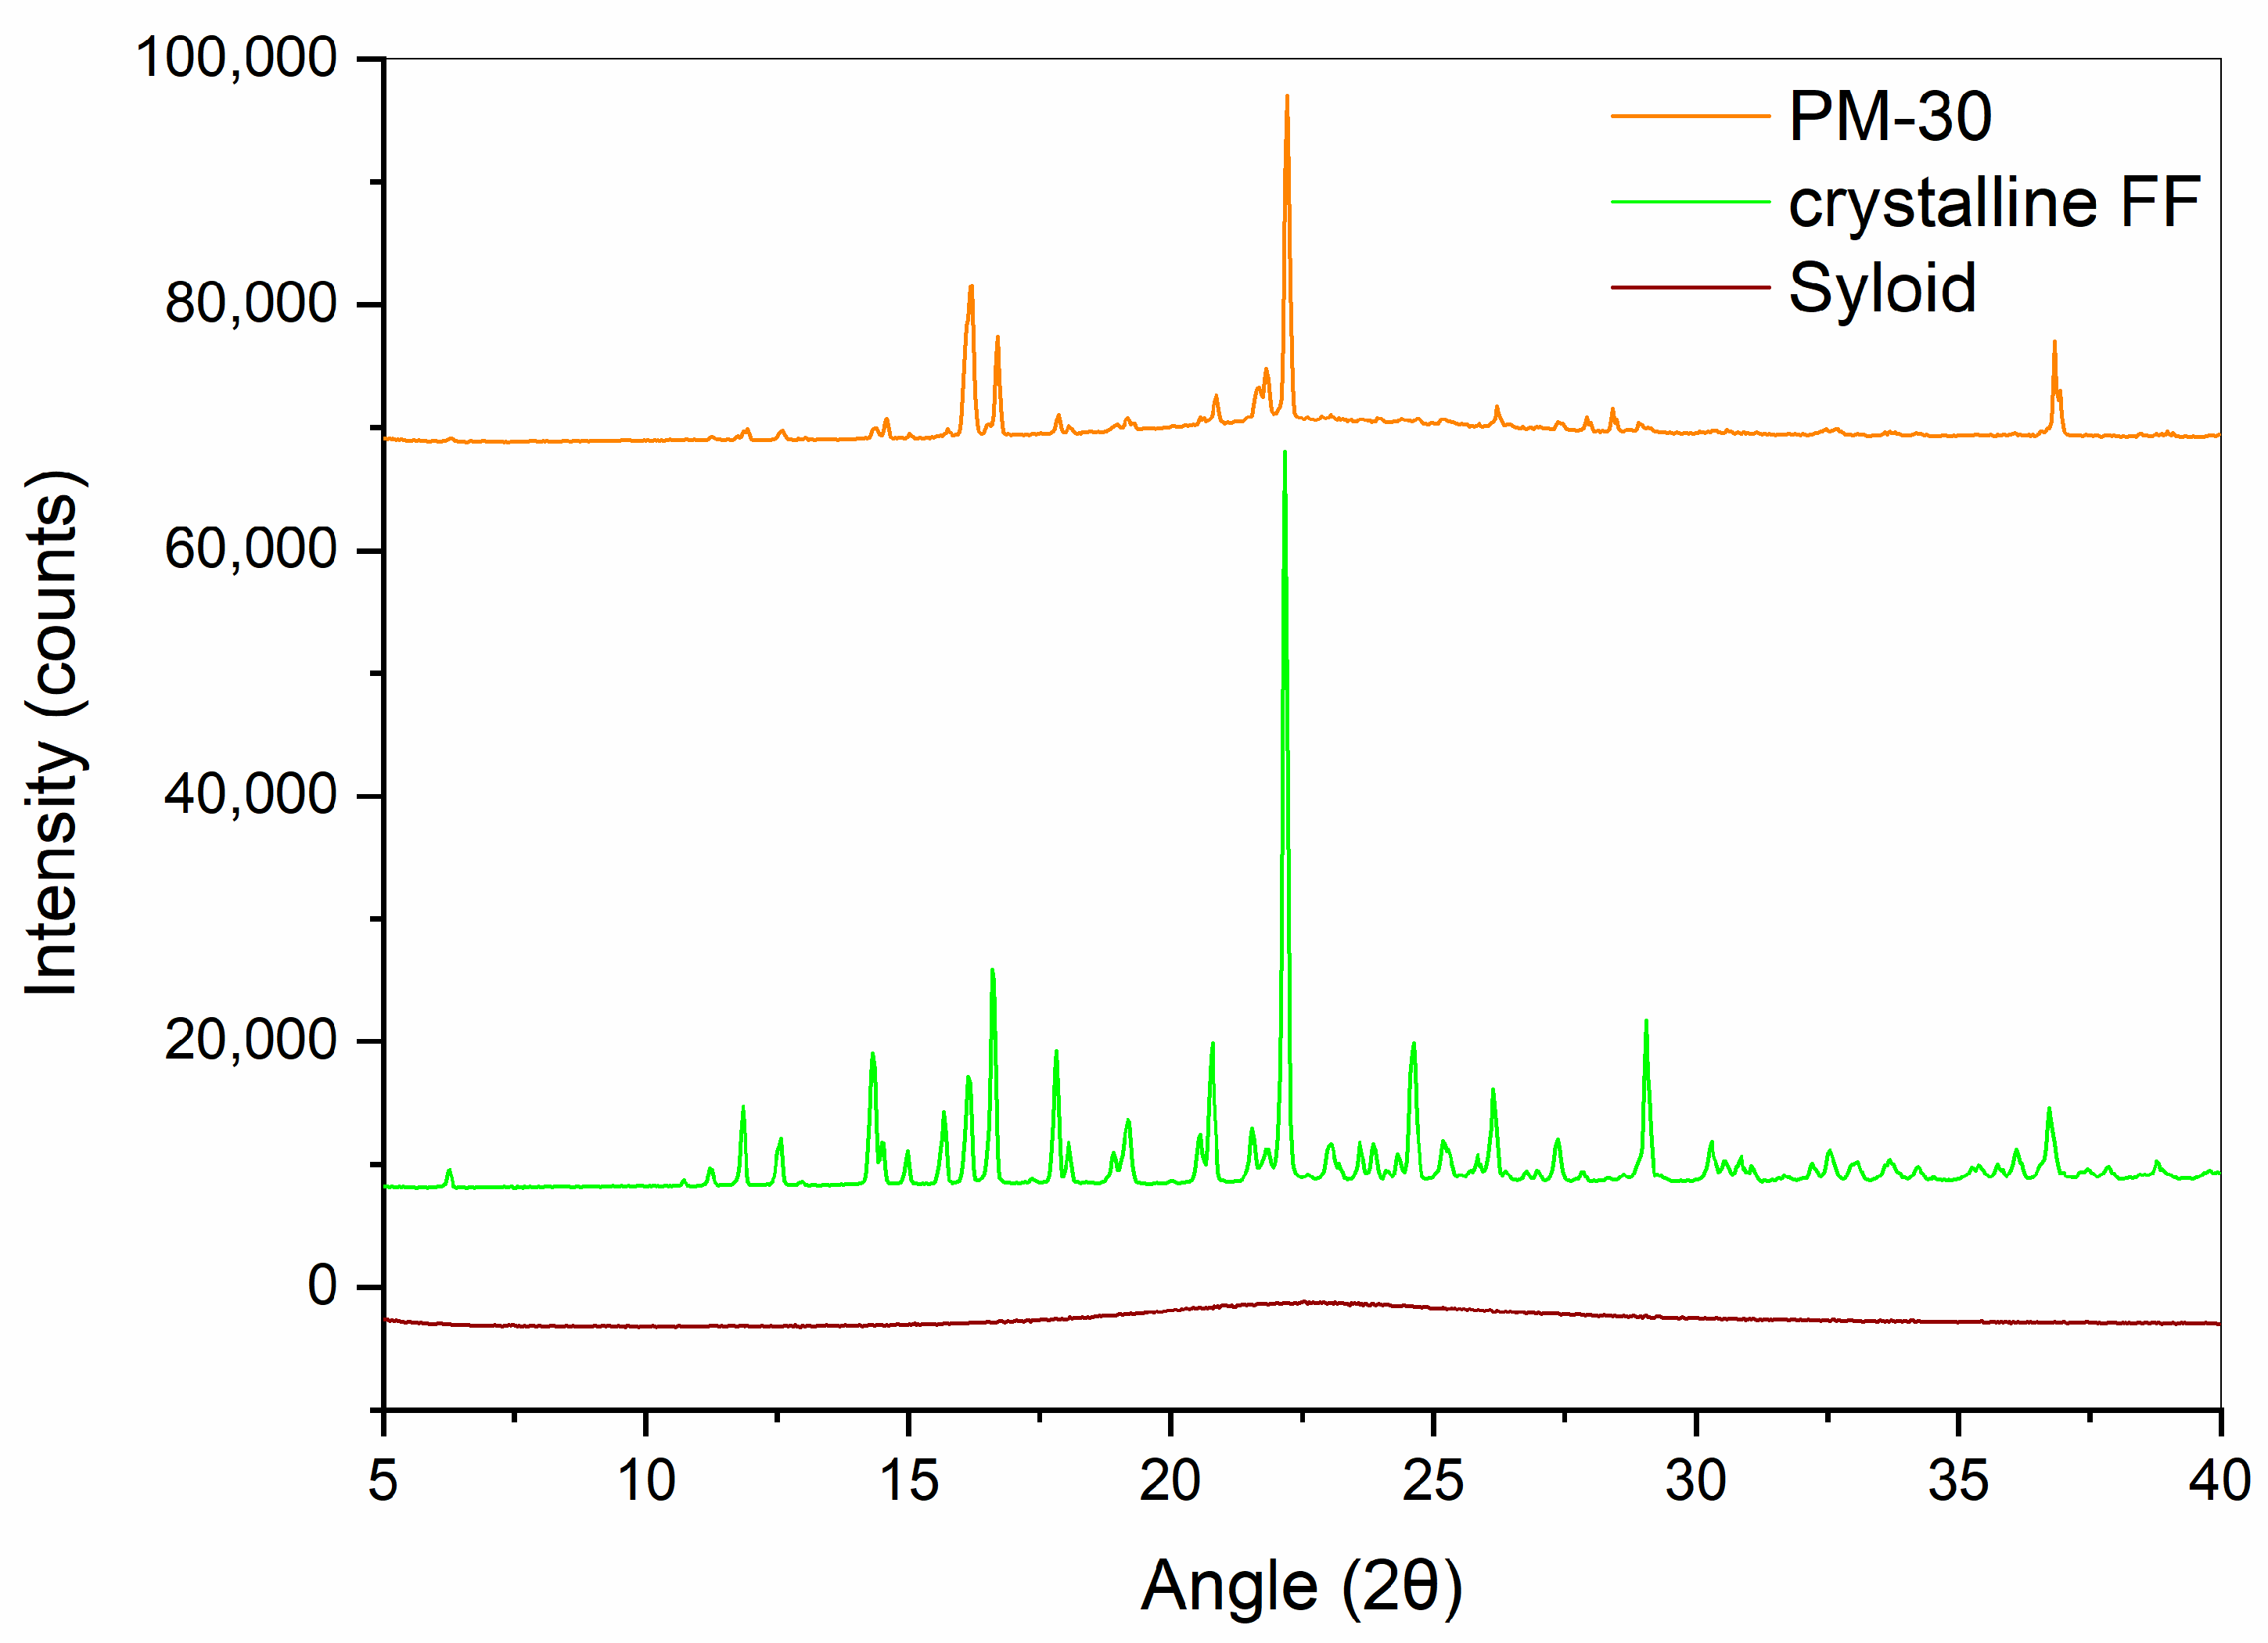
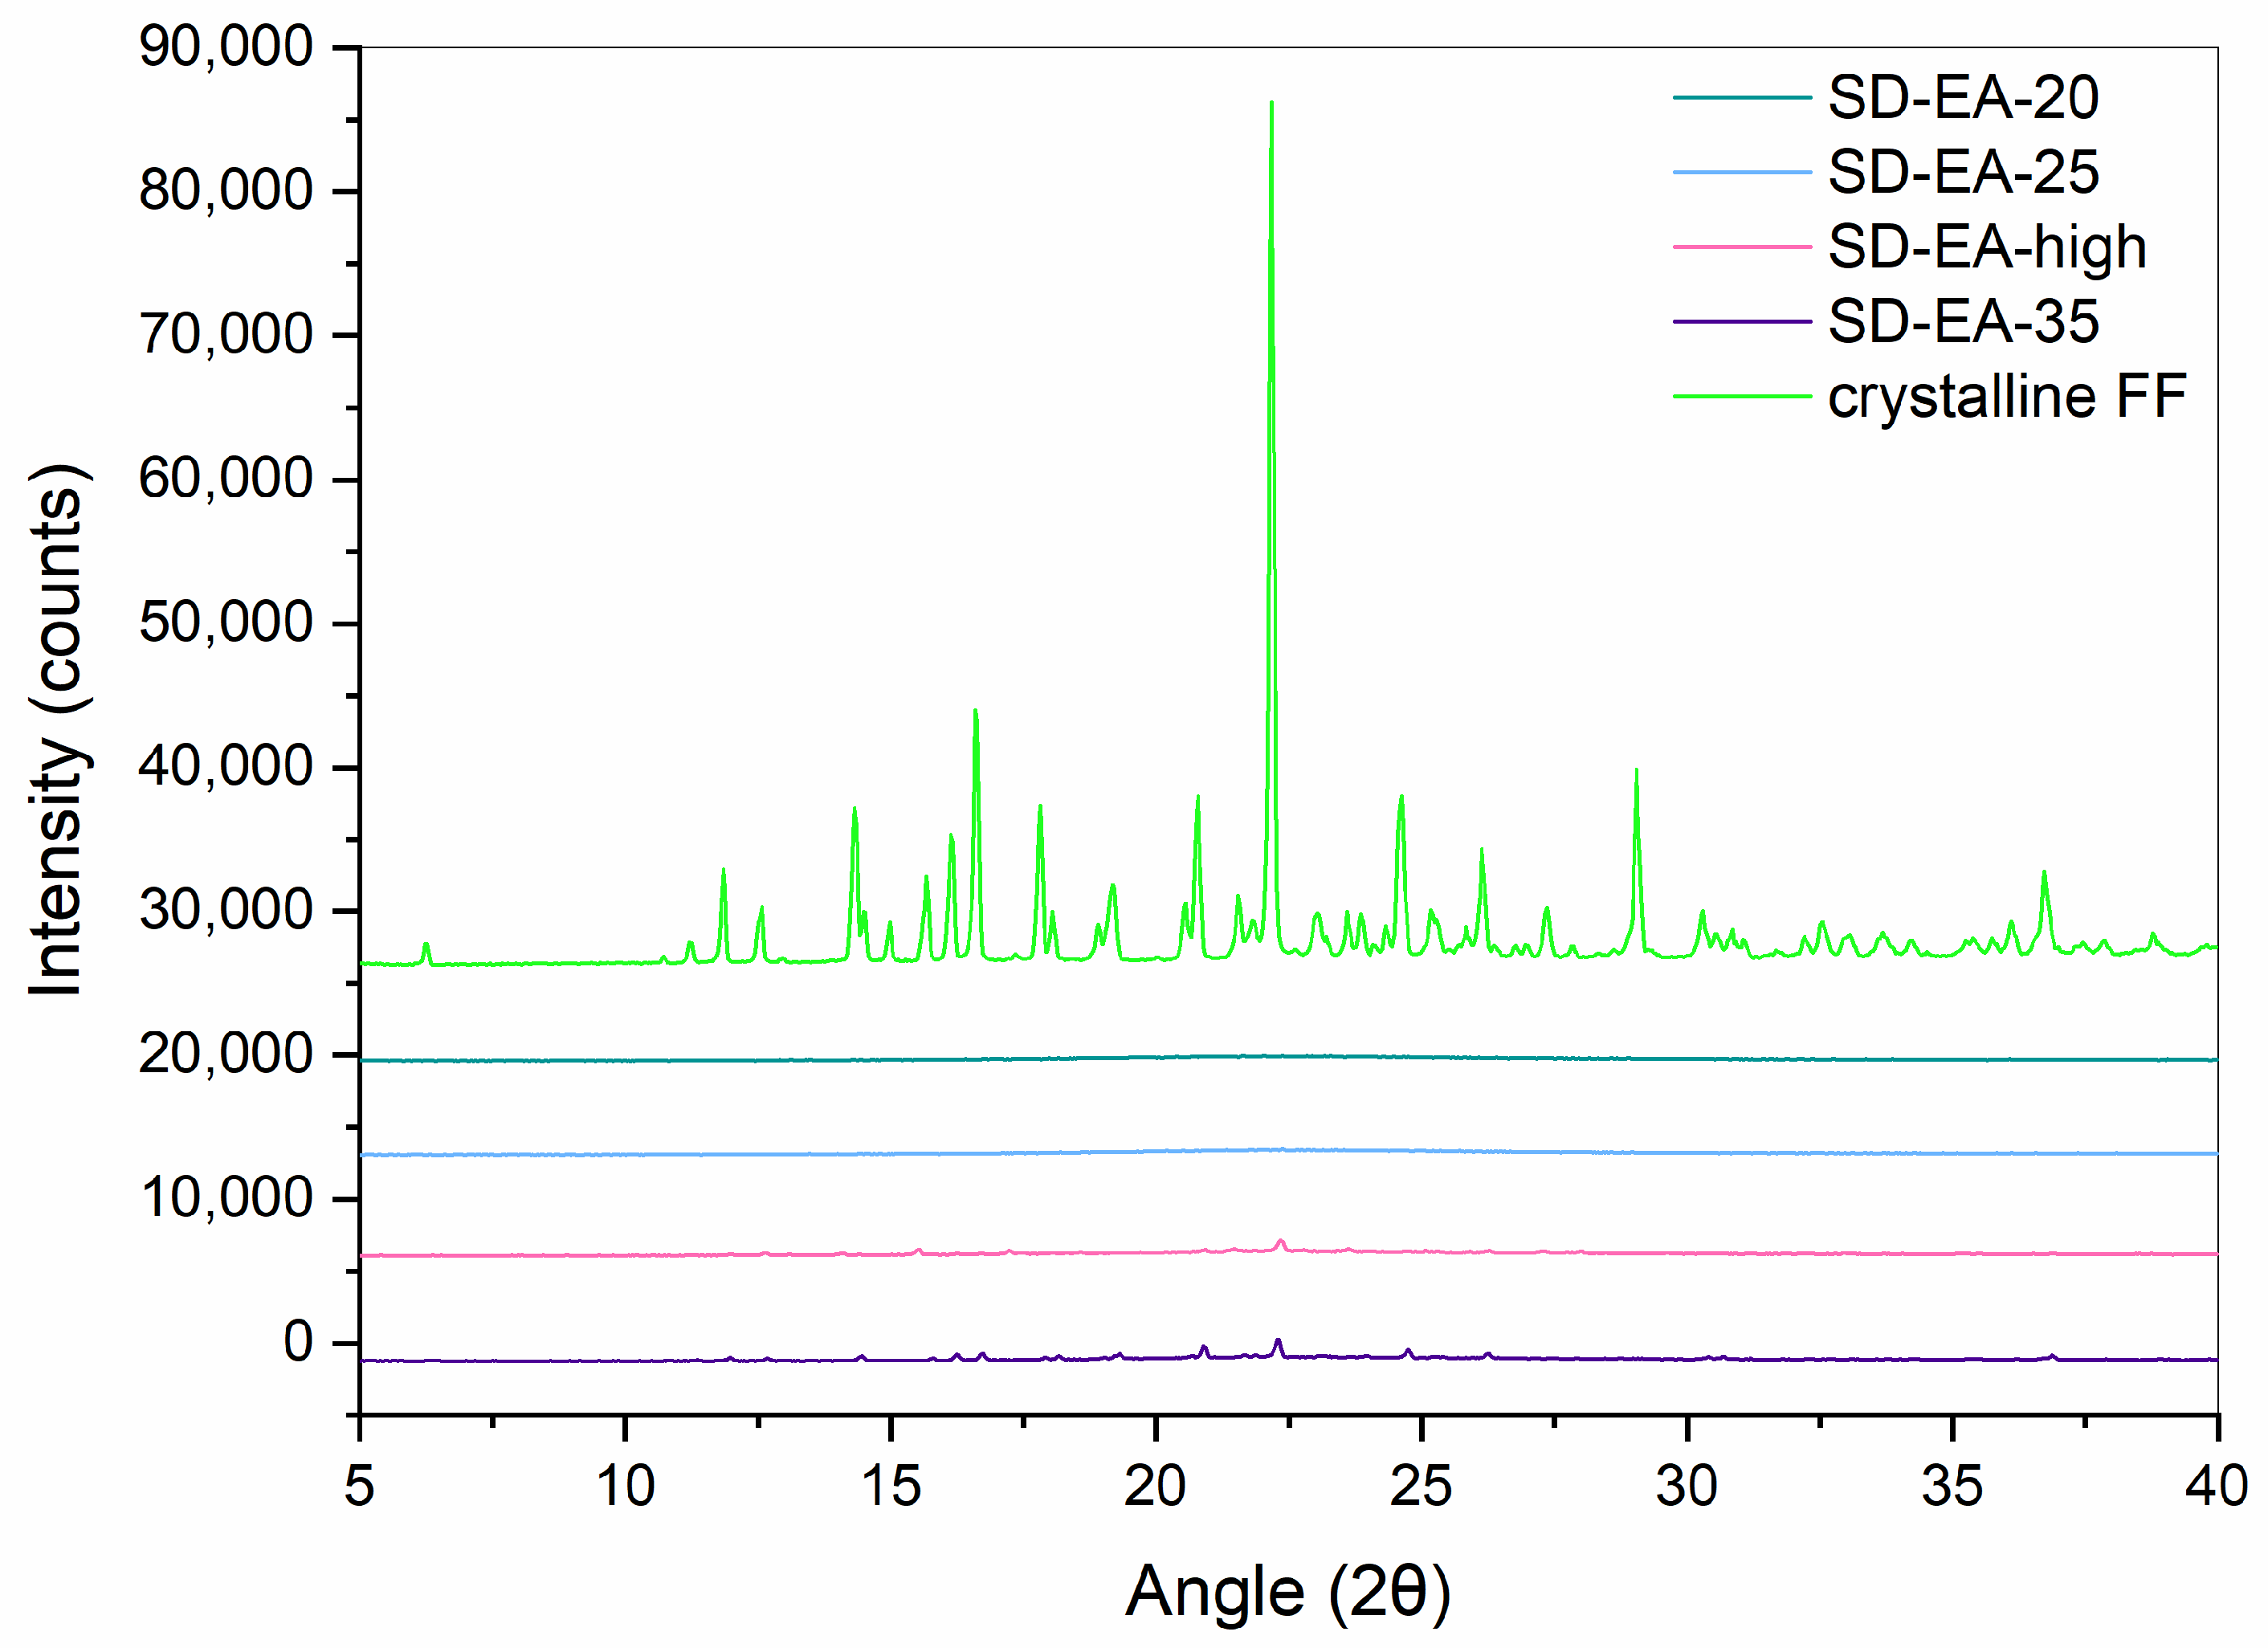
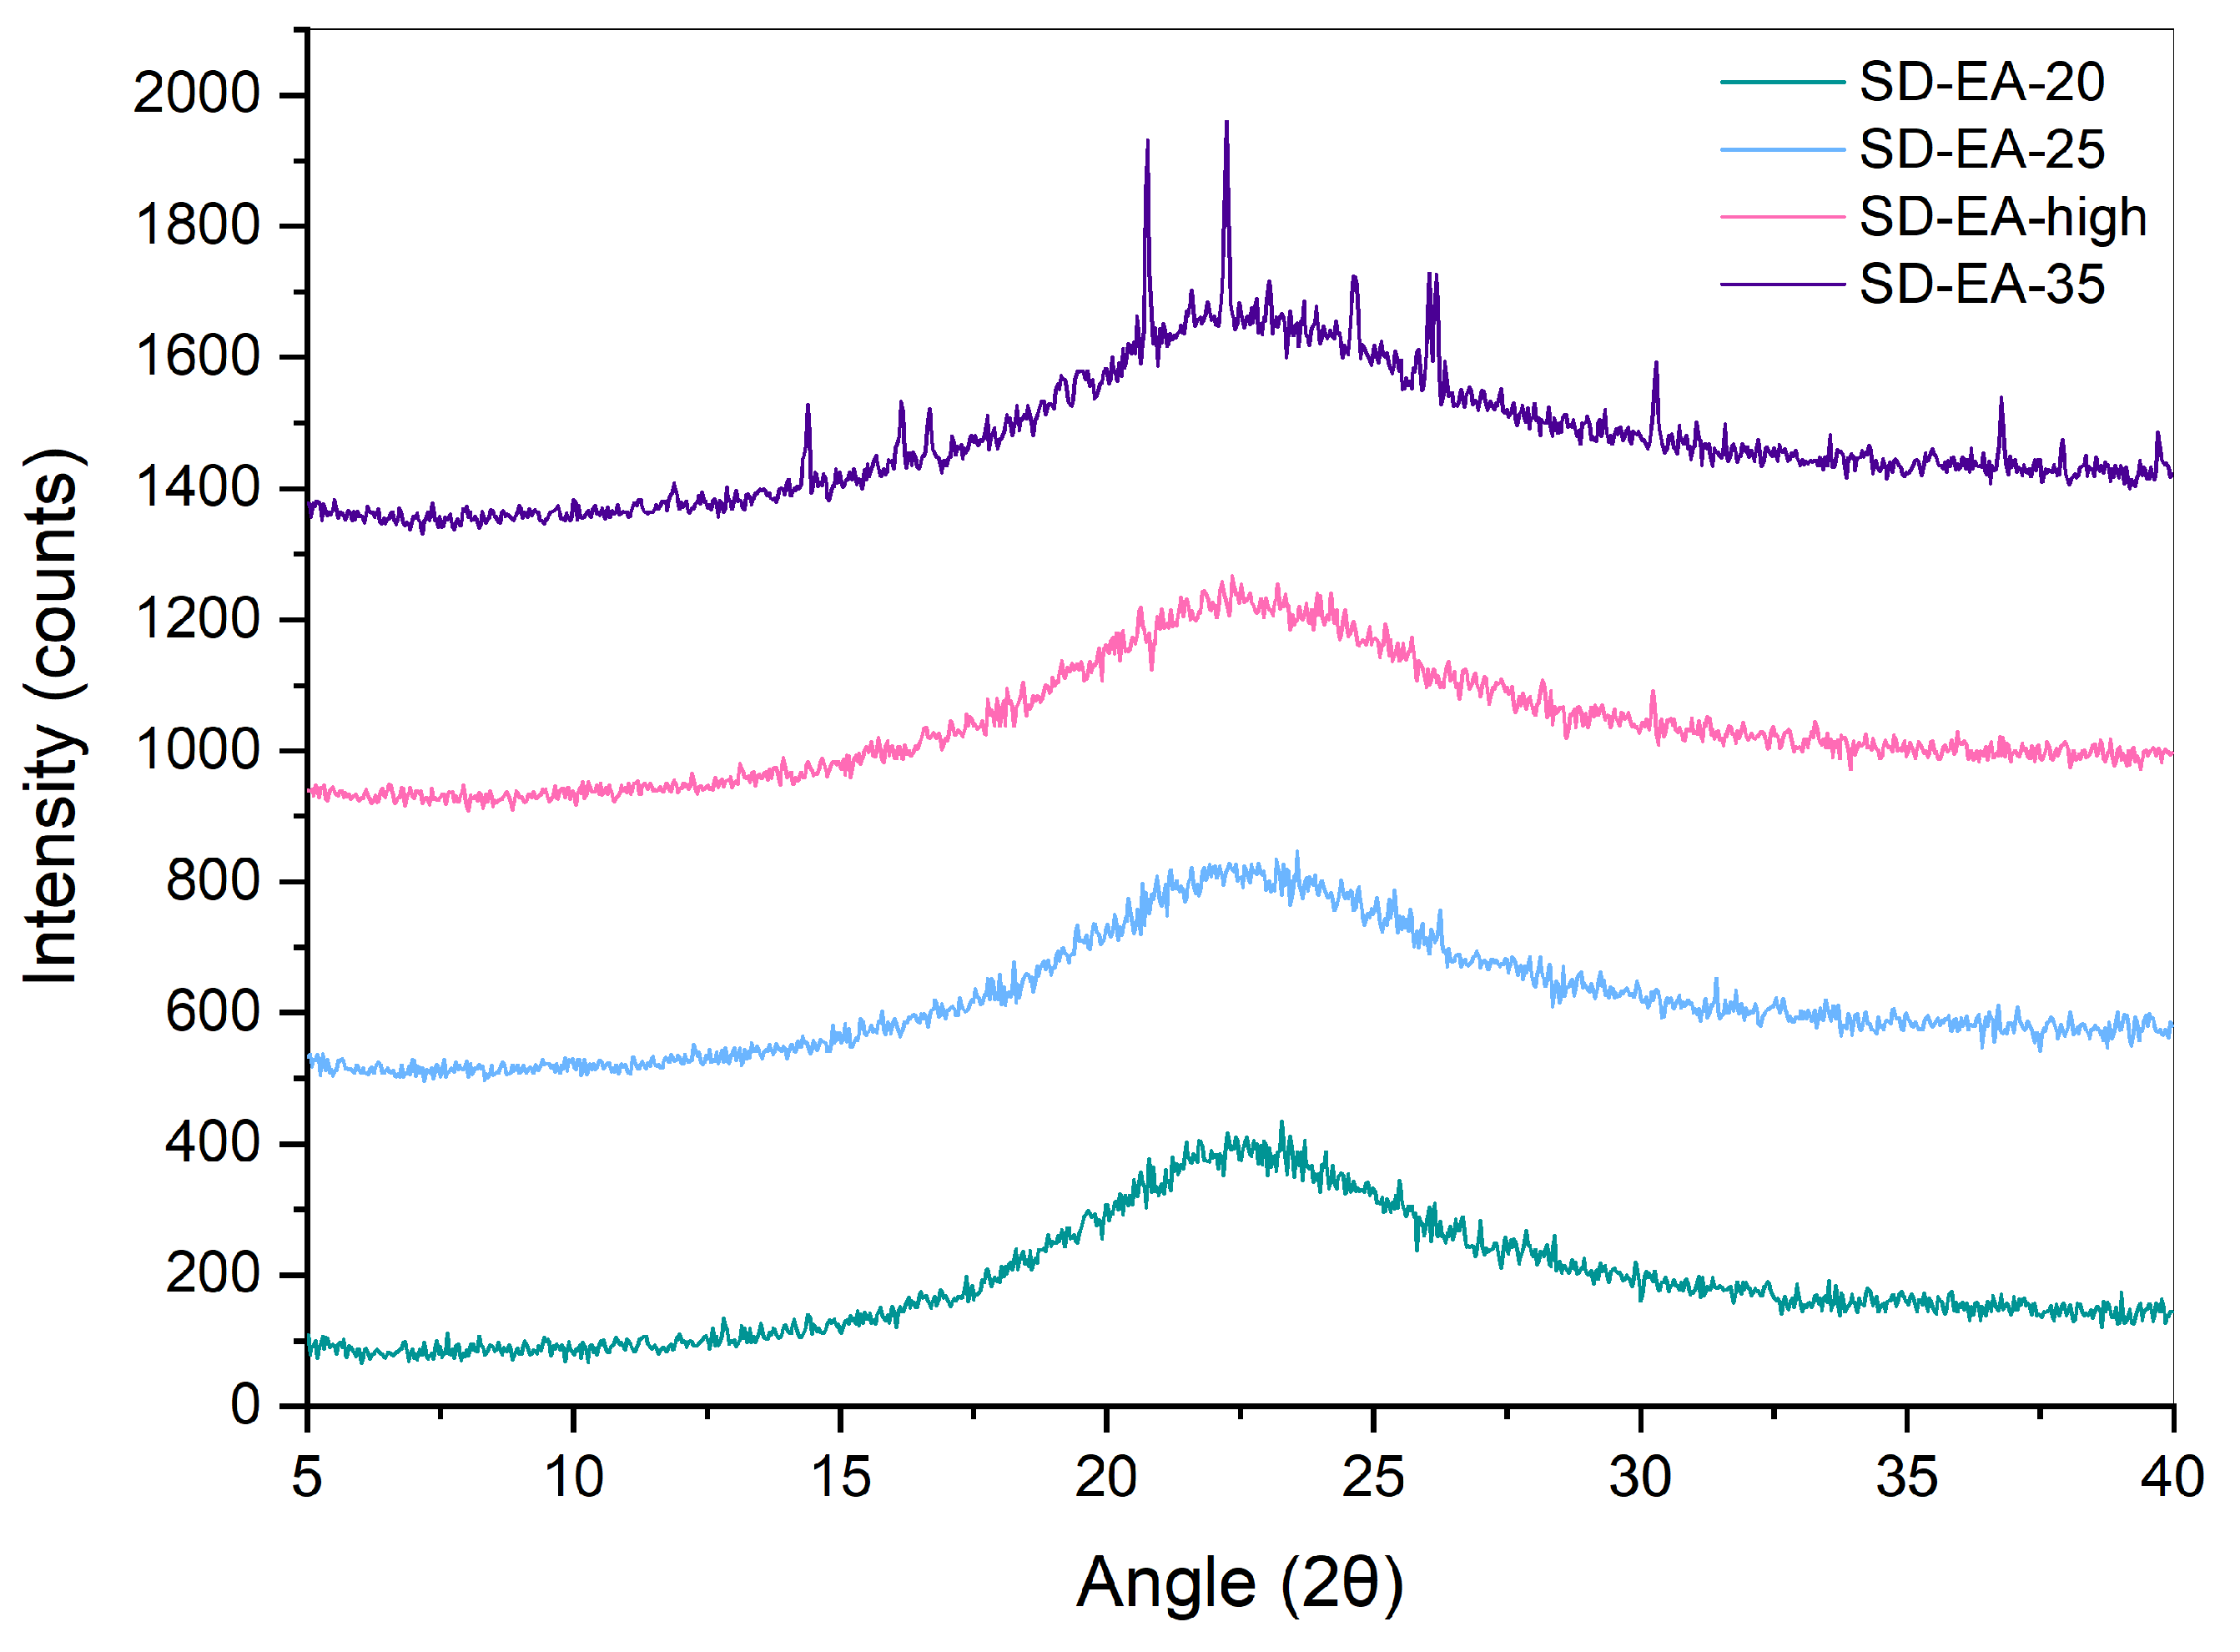
2.2.2. XRPD
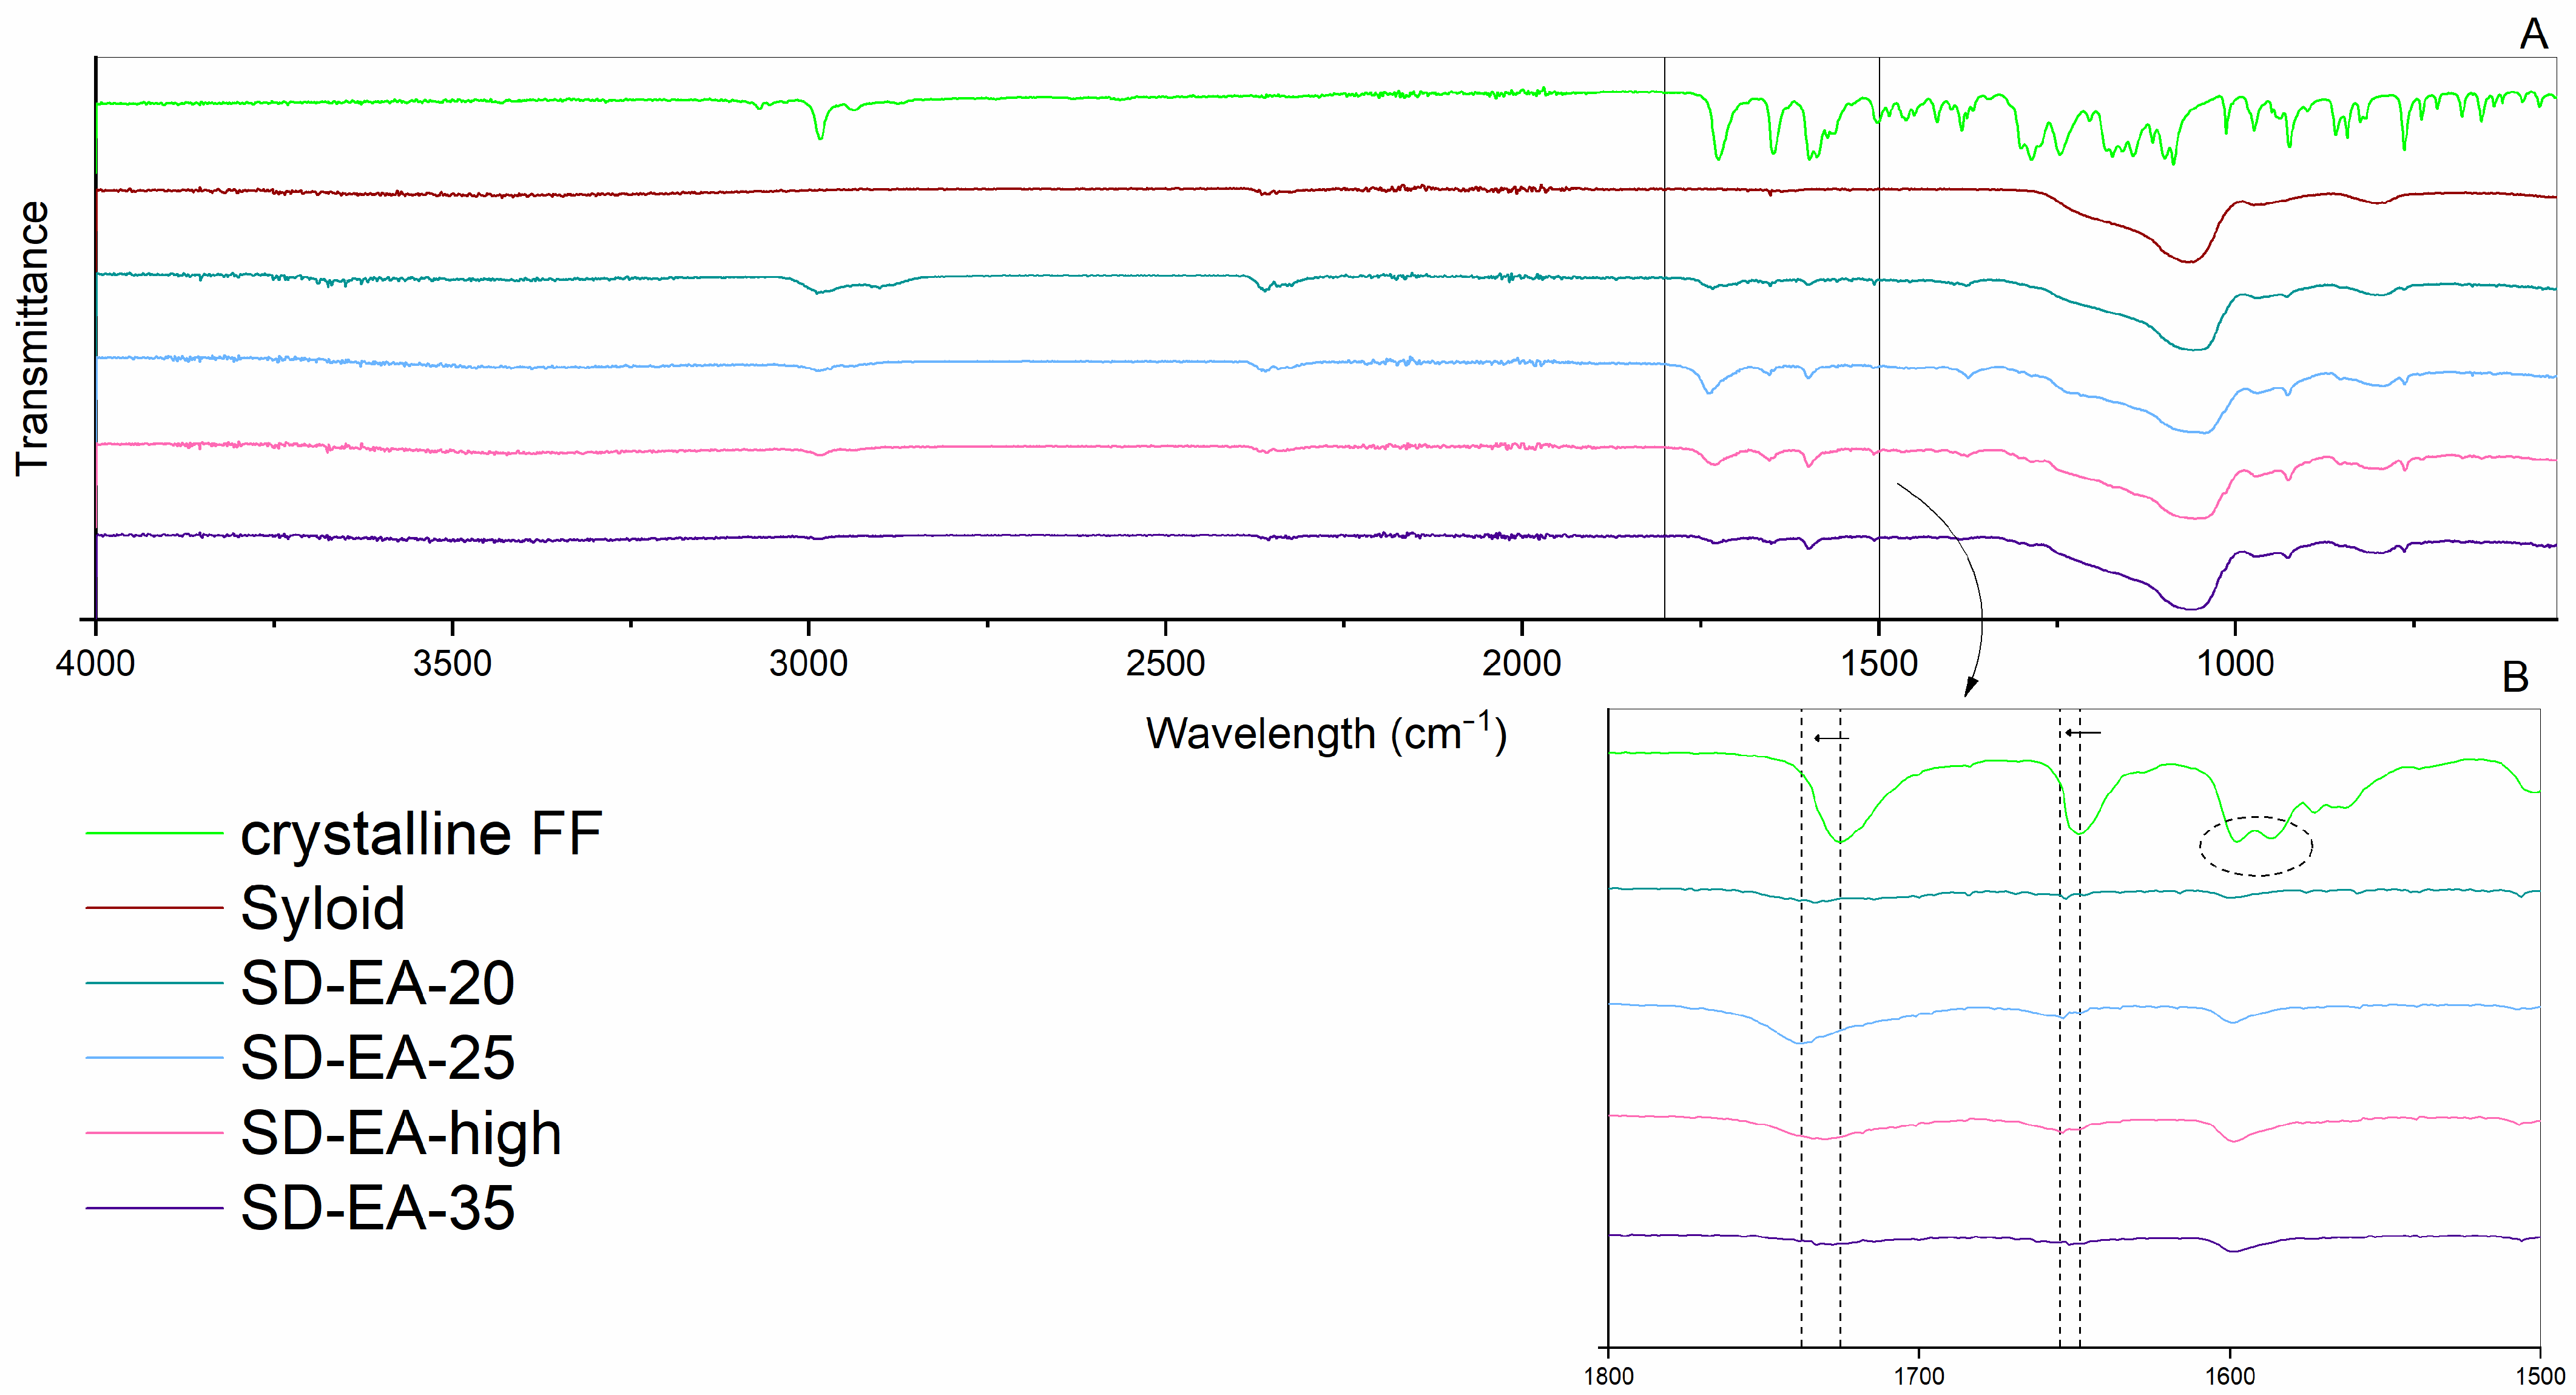
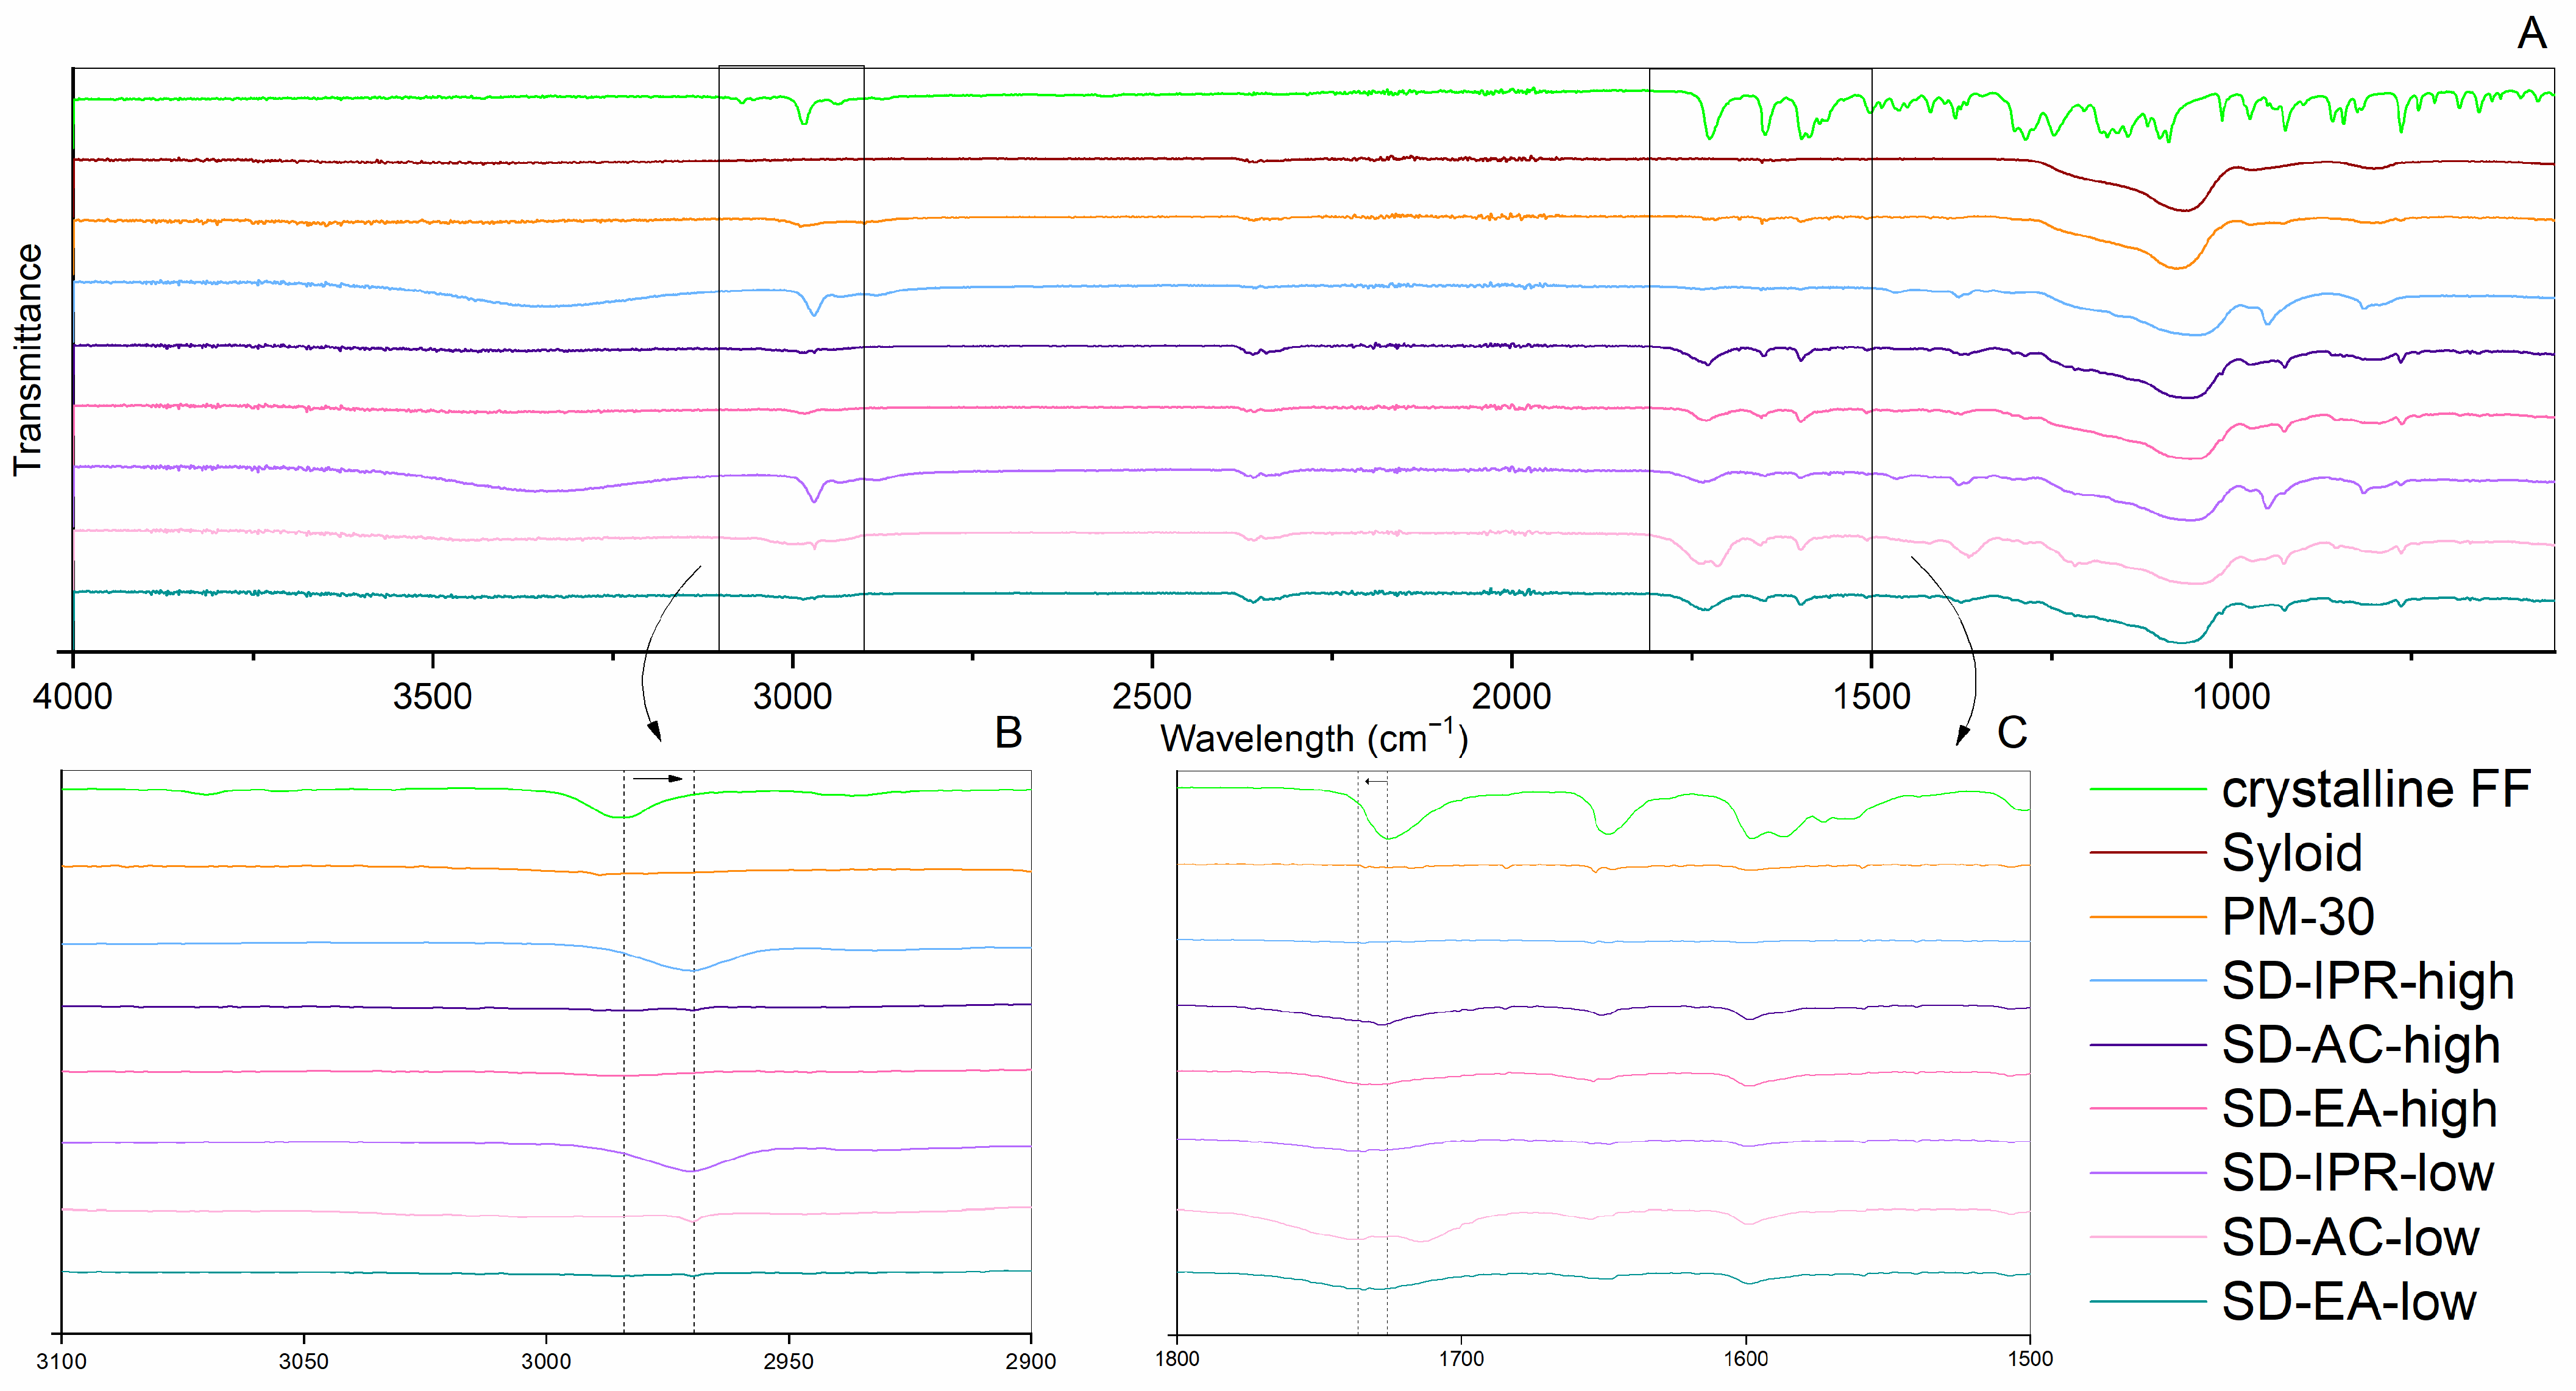
2.2.3. ATR FTIR
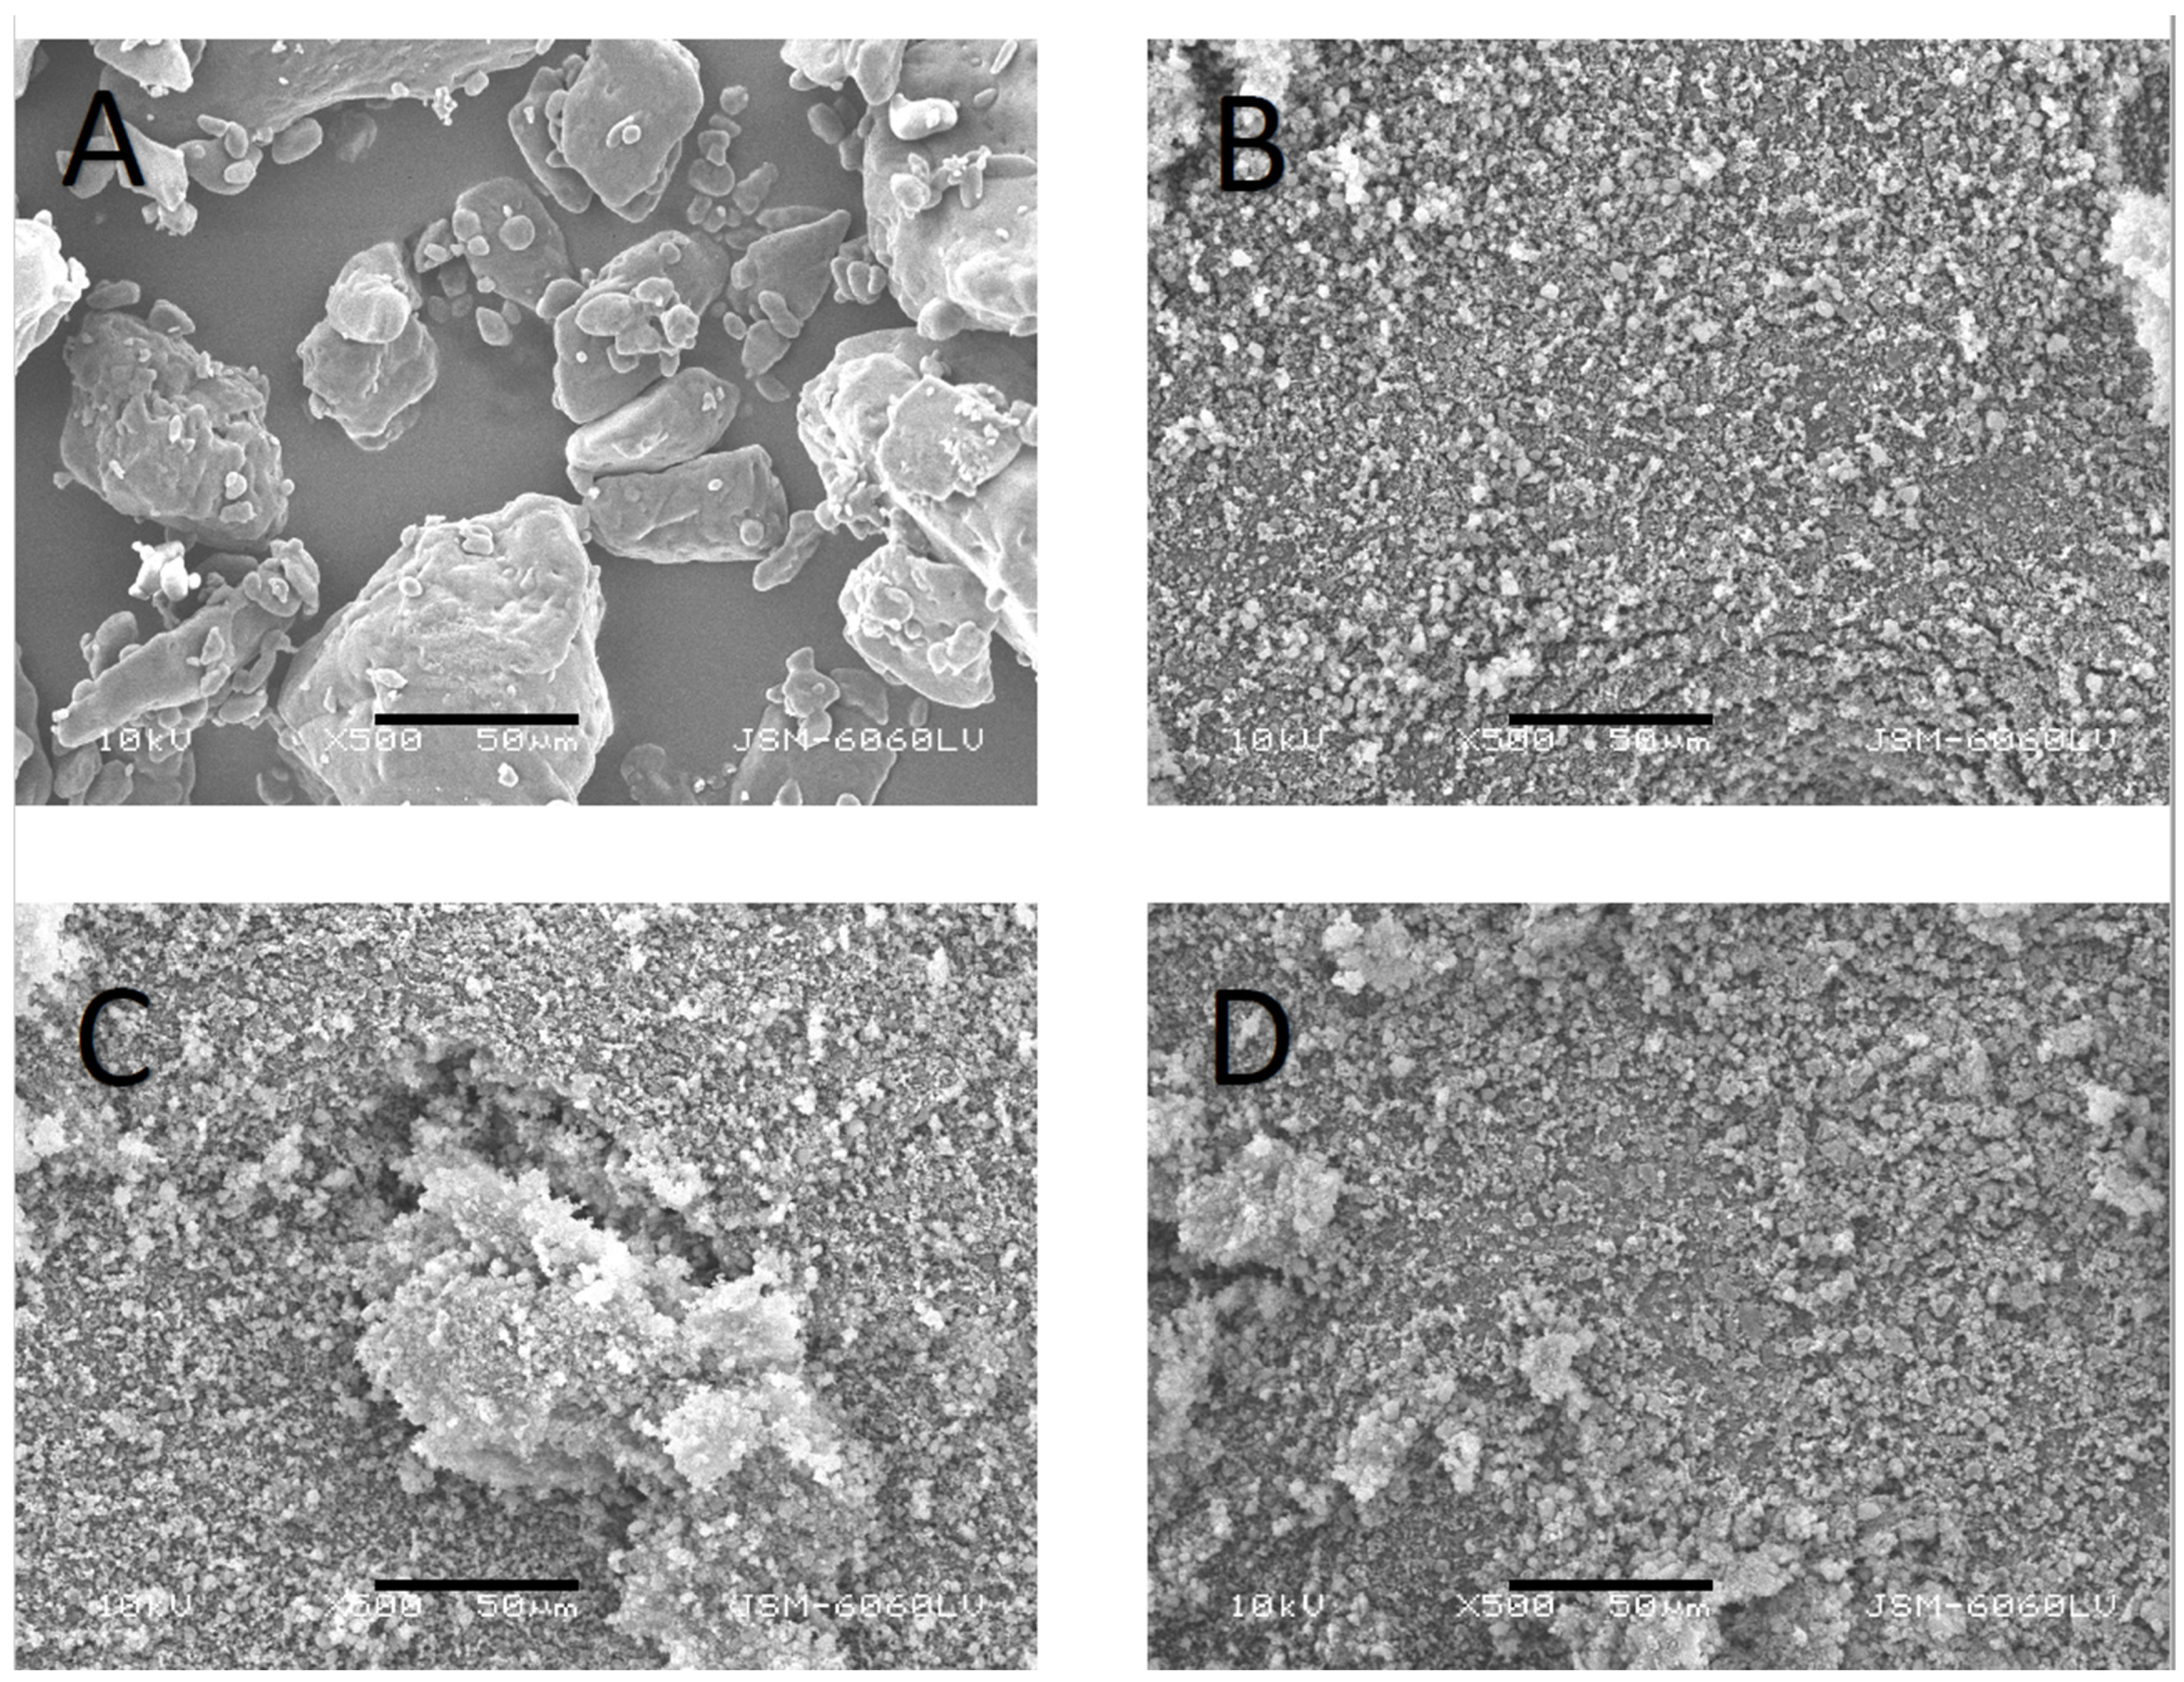
2.2.4. Particle Size and Morphology
2.2.5. Nitrogen Adsorption Studies
2.2.6. Determination of FF Content
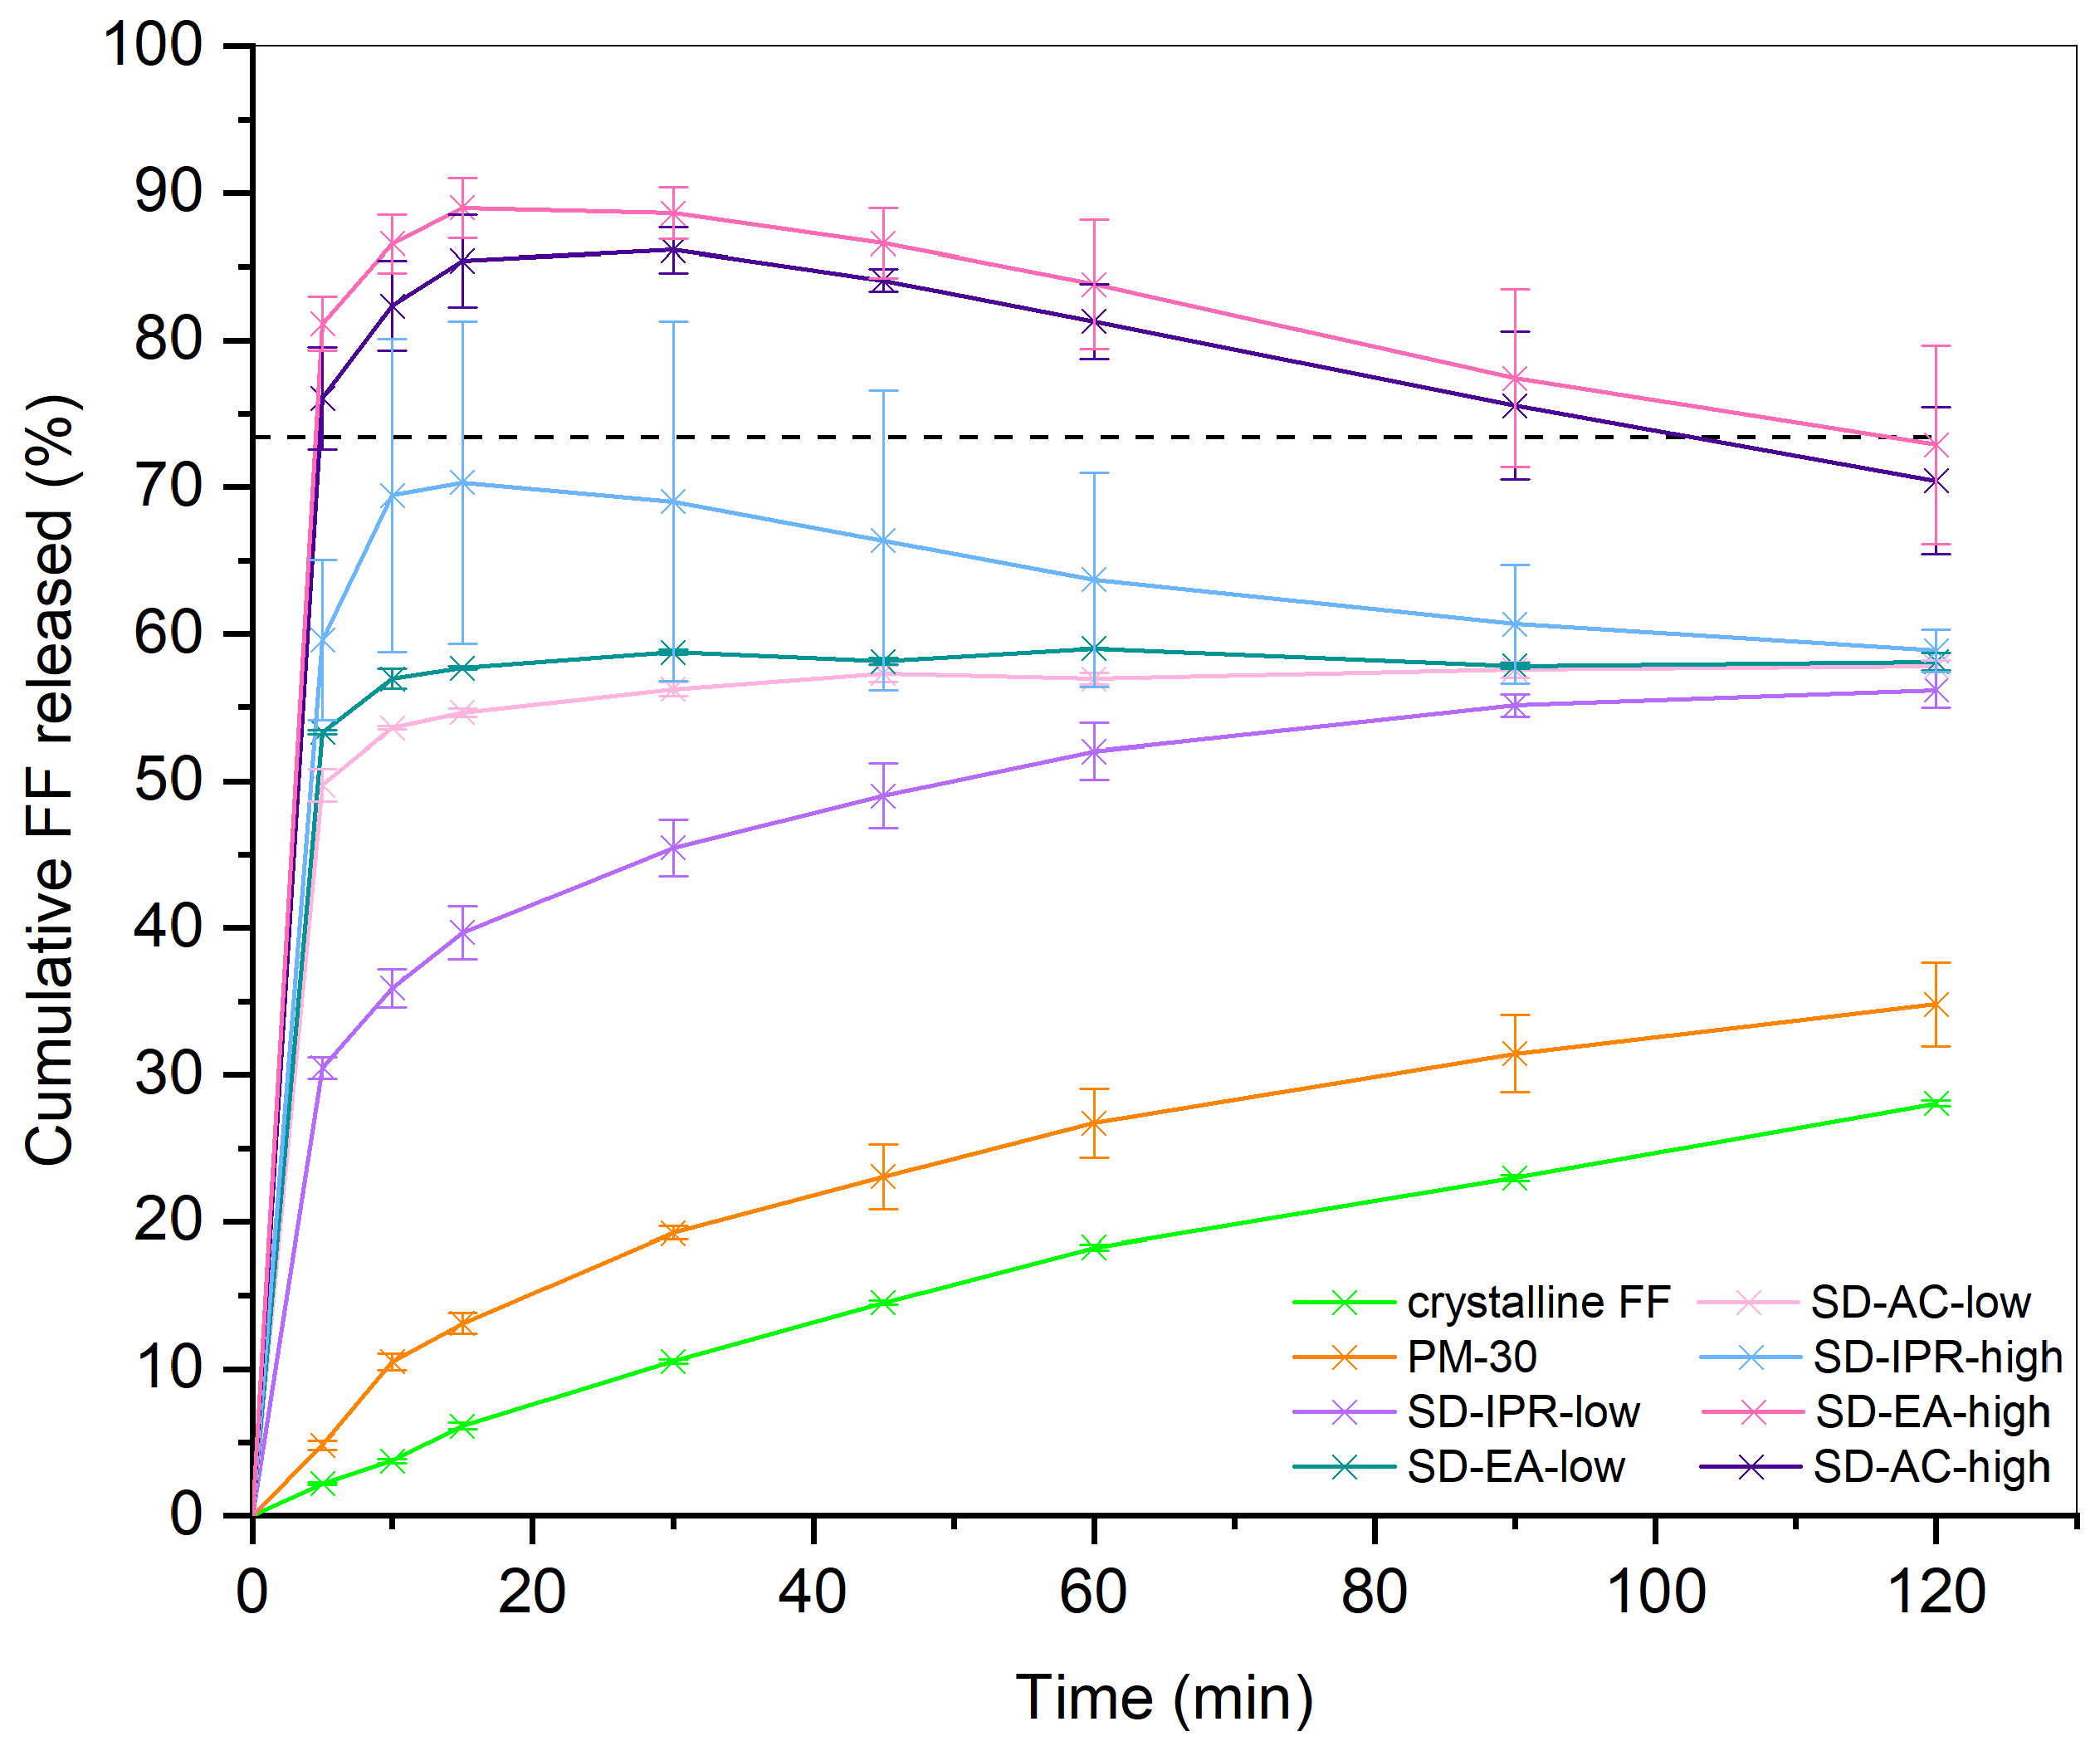
2.2.7. Drug Release from SDs
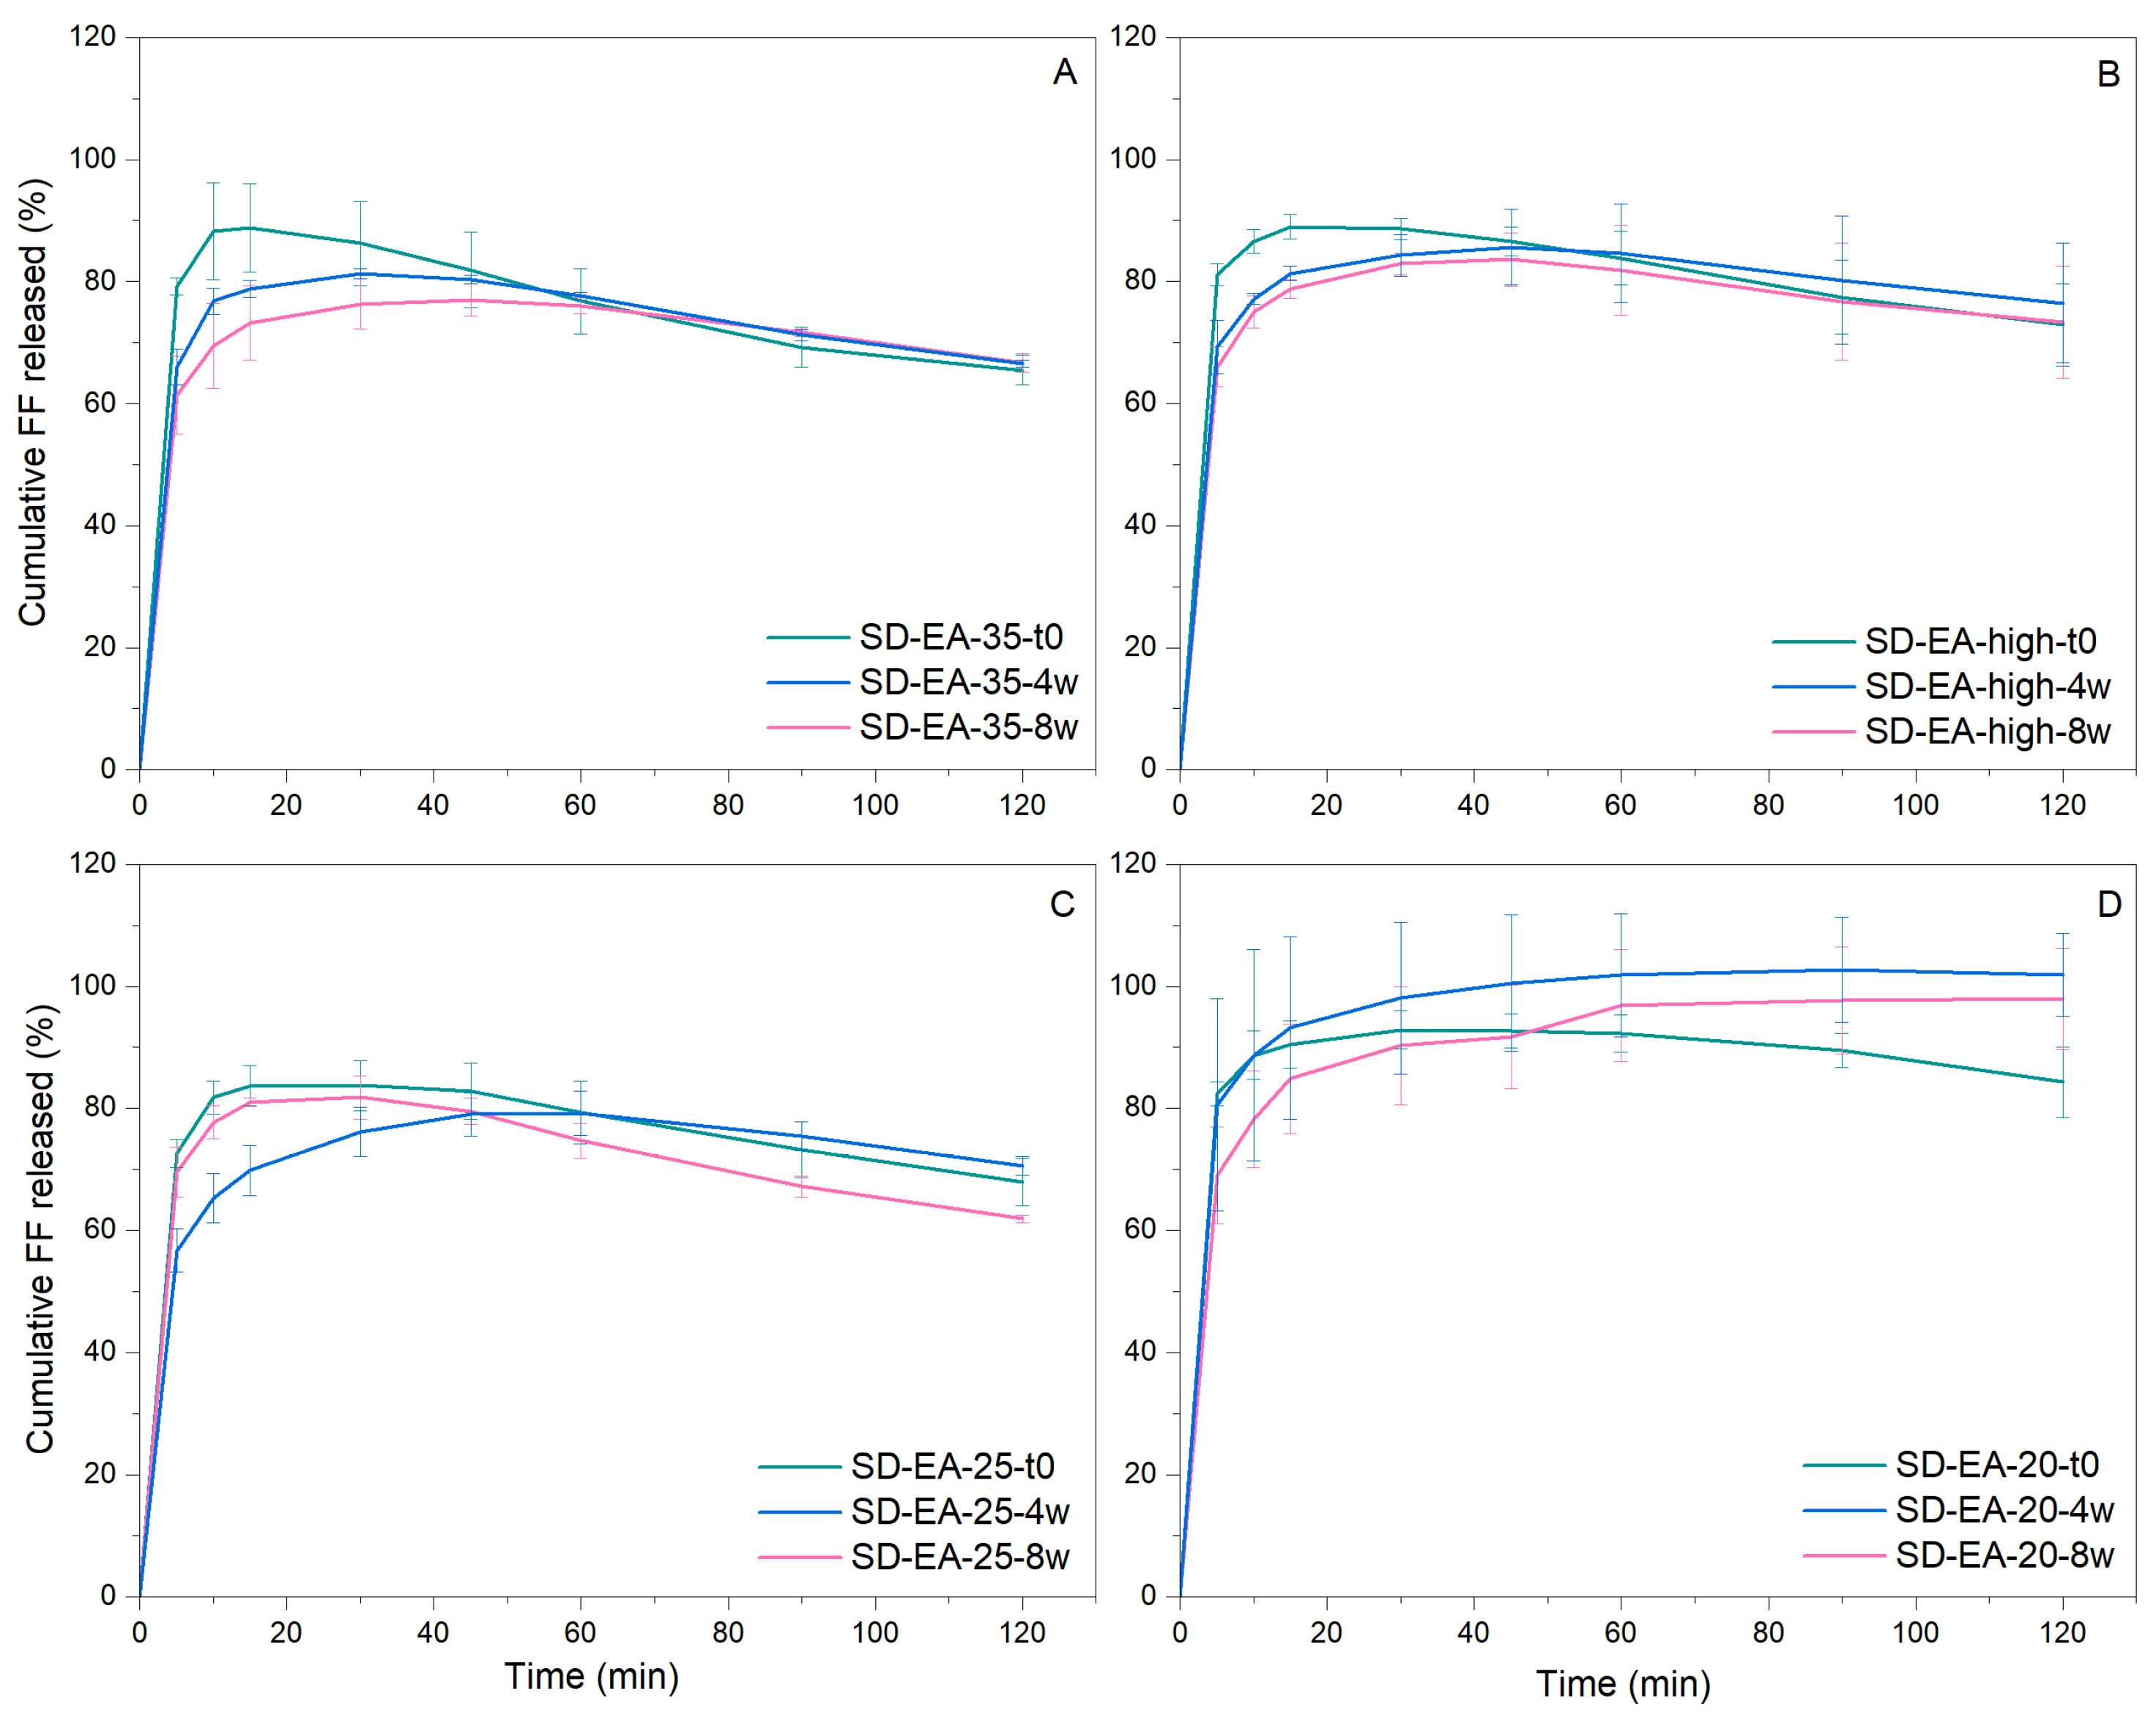
2.3. Physical Stability
3. Results and Discussion
3.1. Particle Size and Morphology of FF, Syloid, PM, and SD Particles
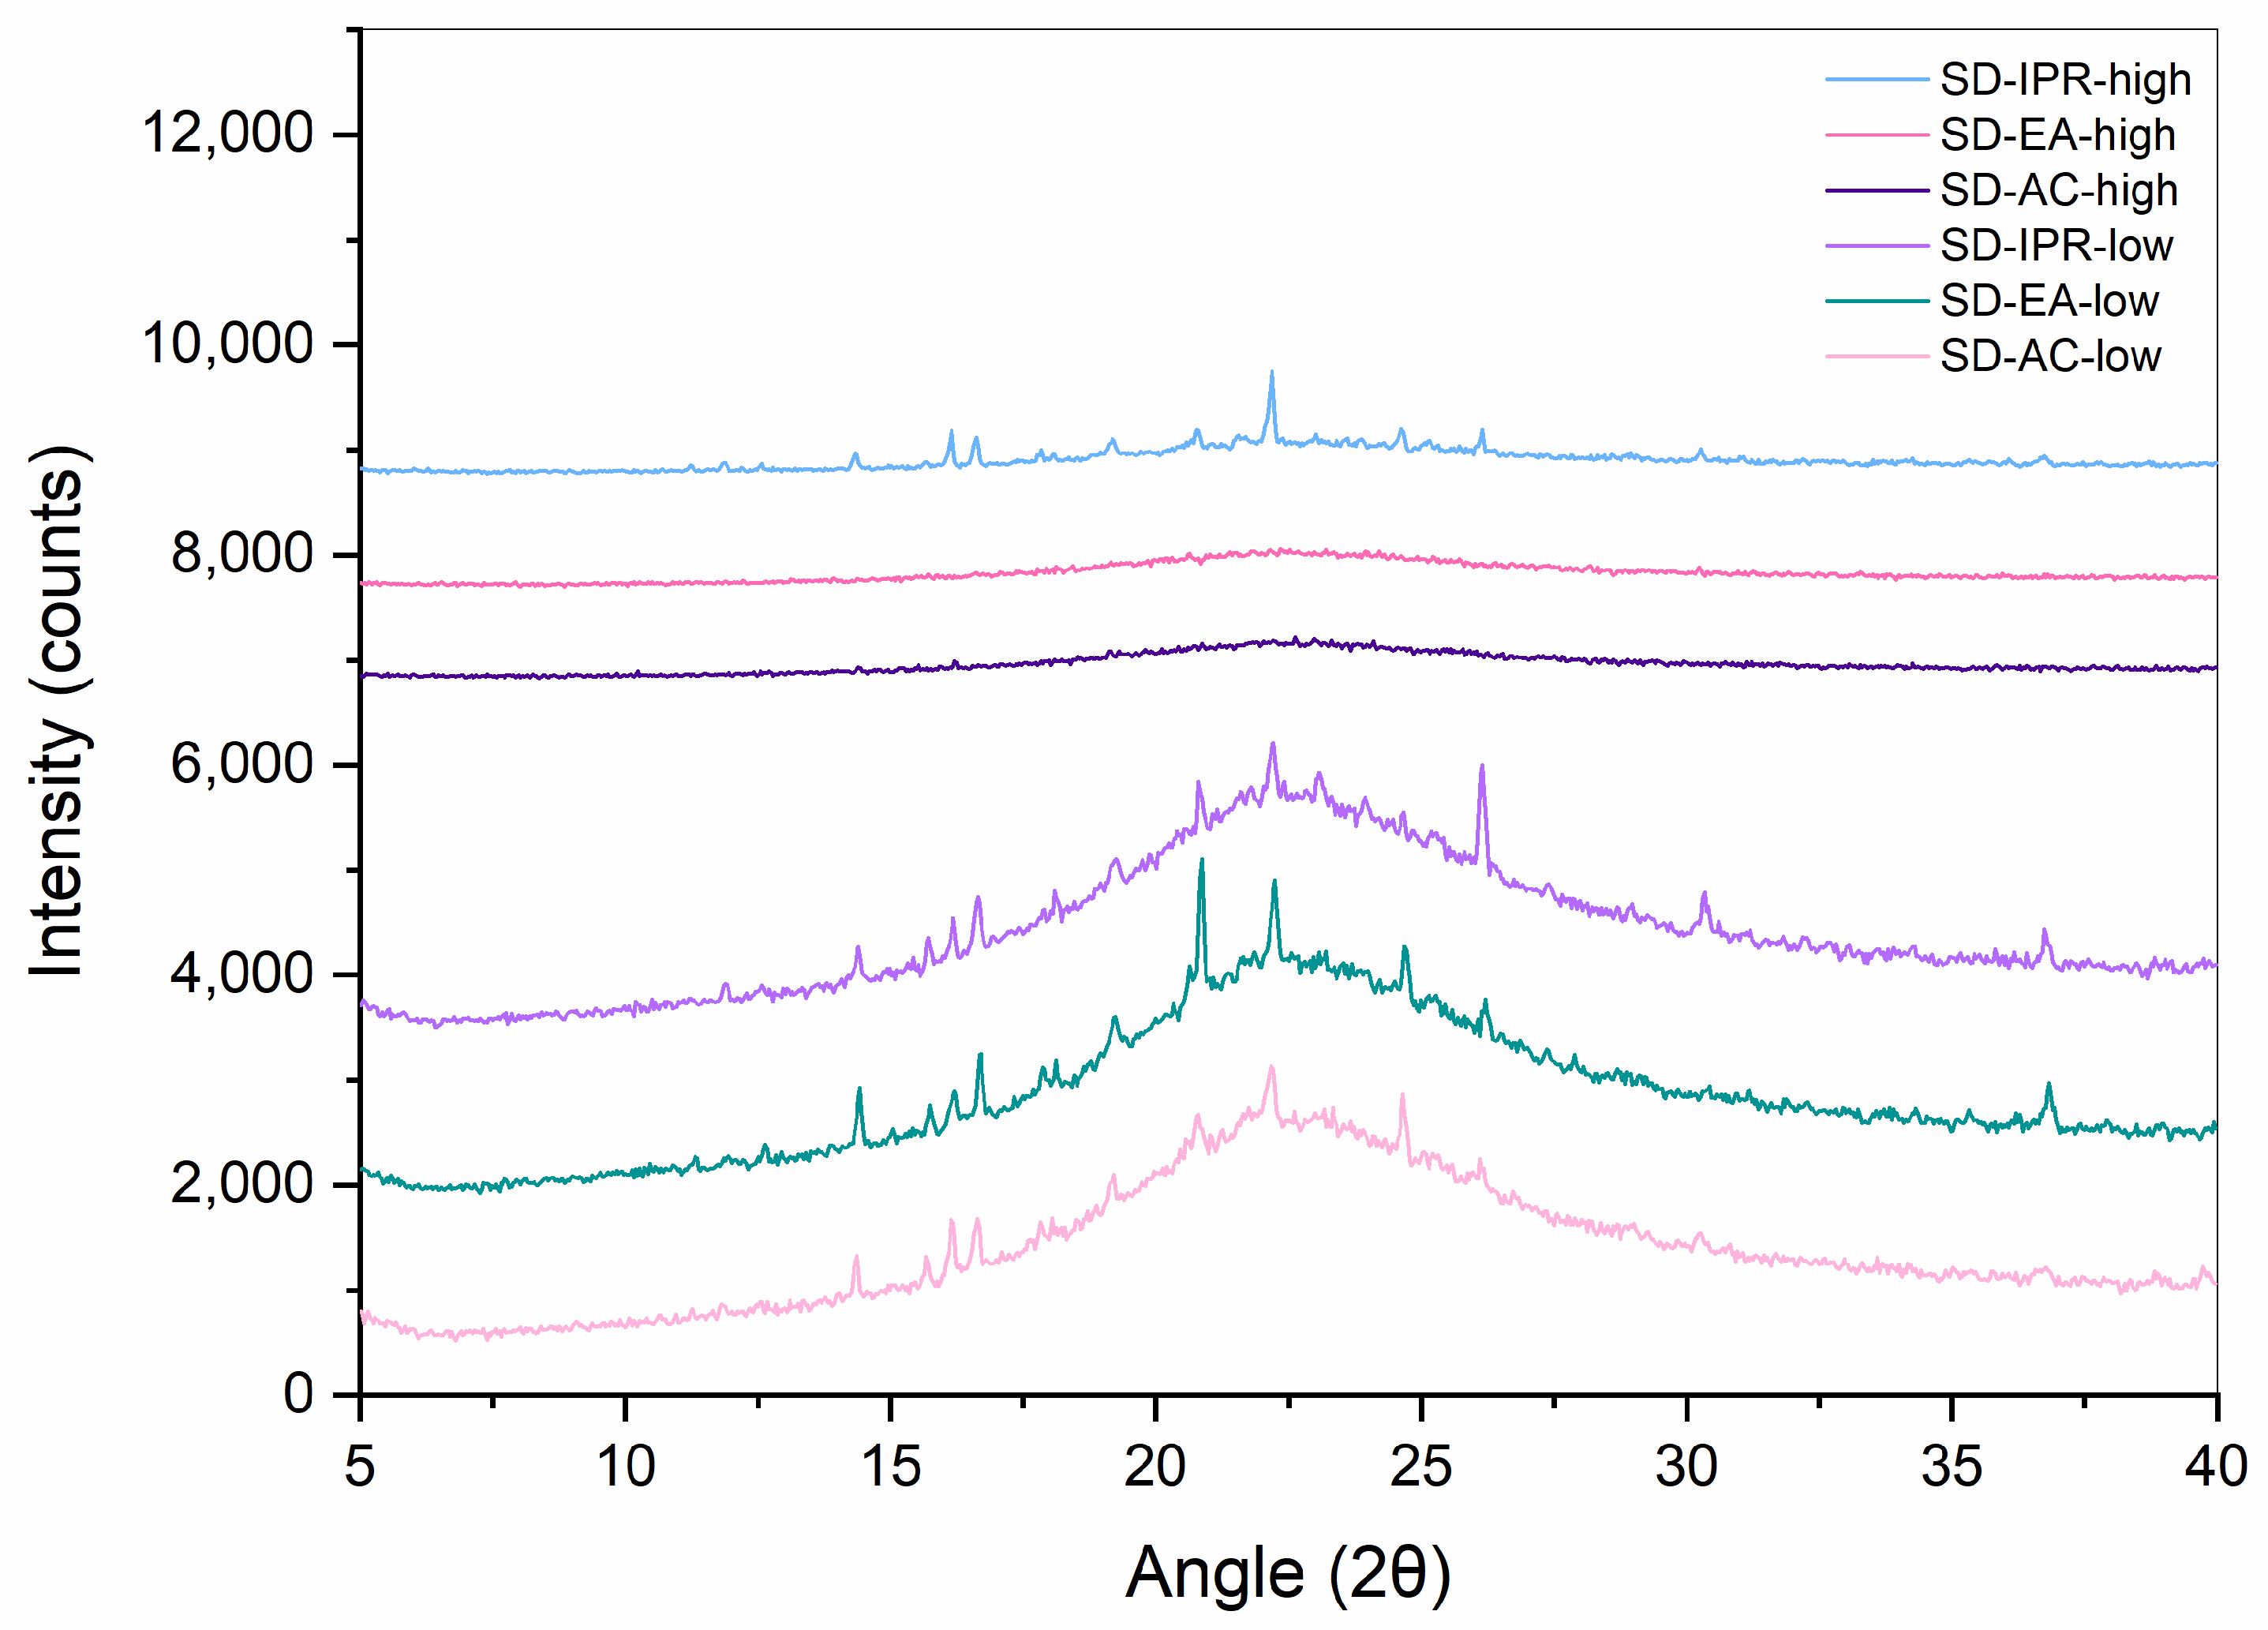
3.2. Influence of Solvent Type and Solvent Temperature on Physico-Chemical Properties and Dissolution
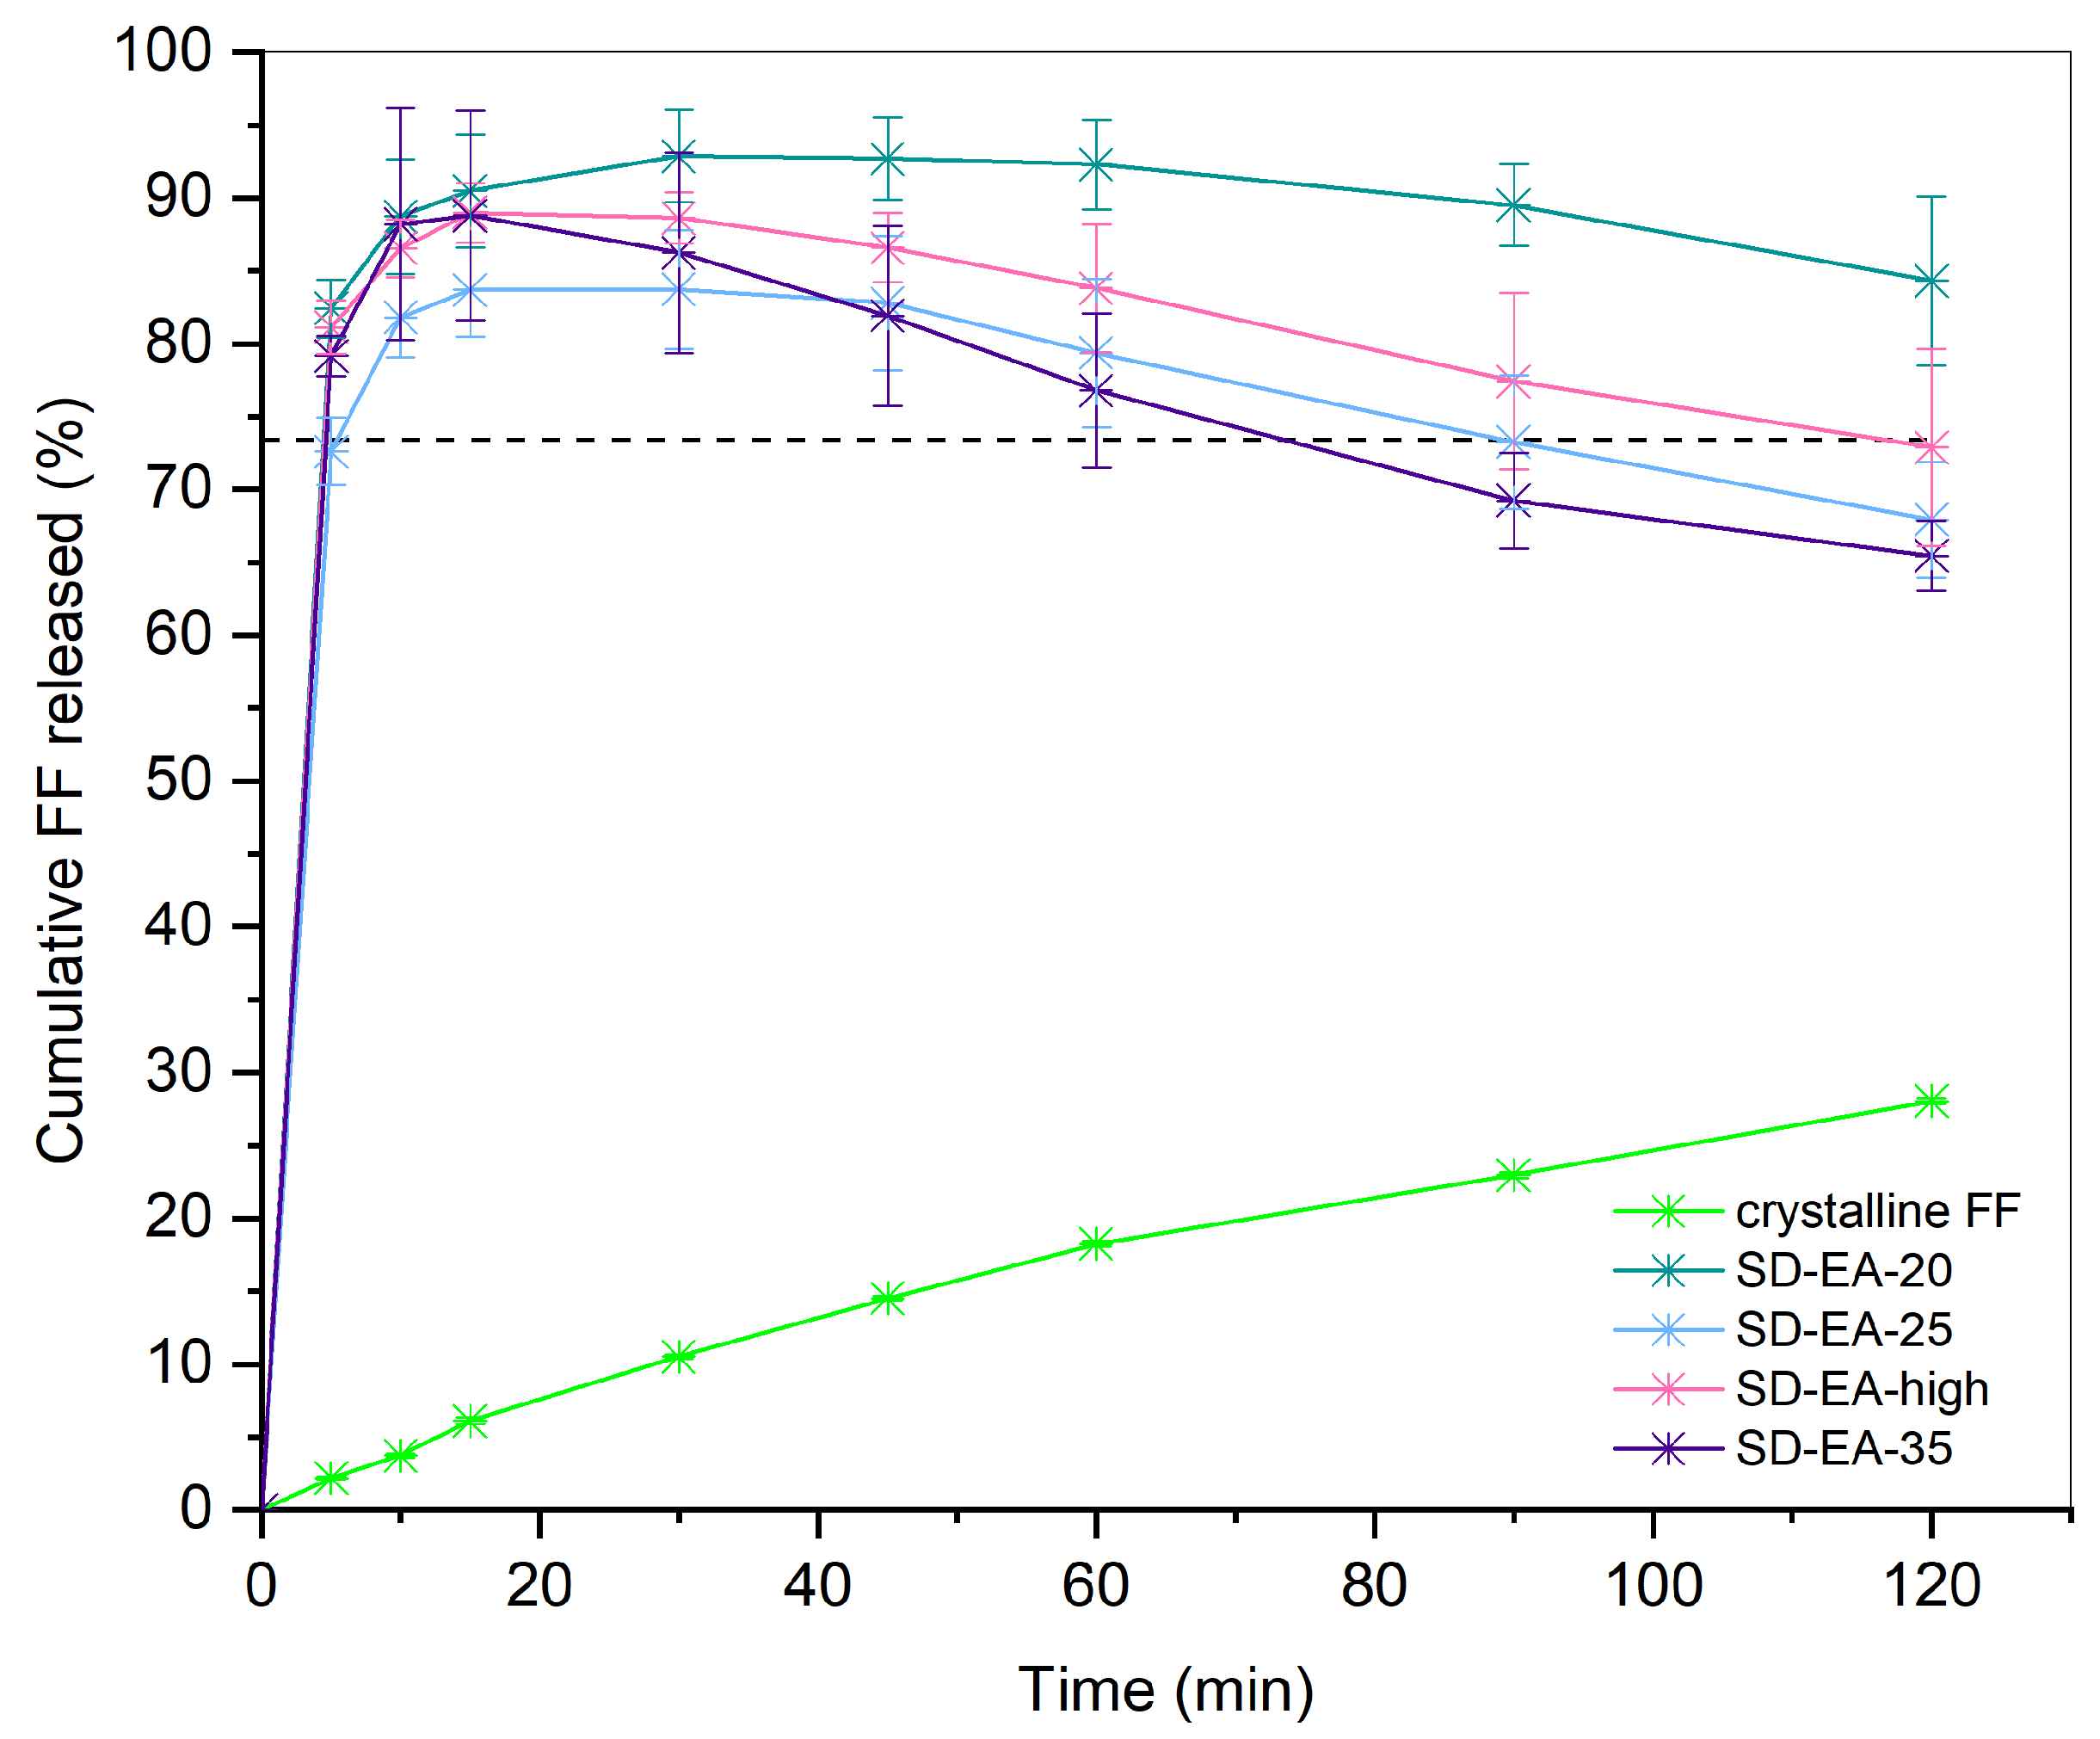
3.3. Influence of FF to Syloid Ratio on Physico-Chemical Properties and Dissolution
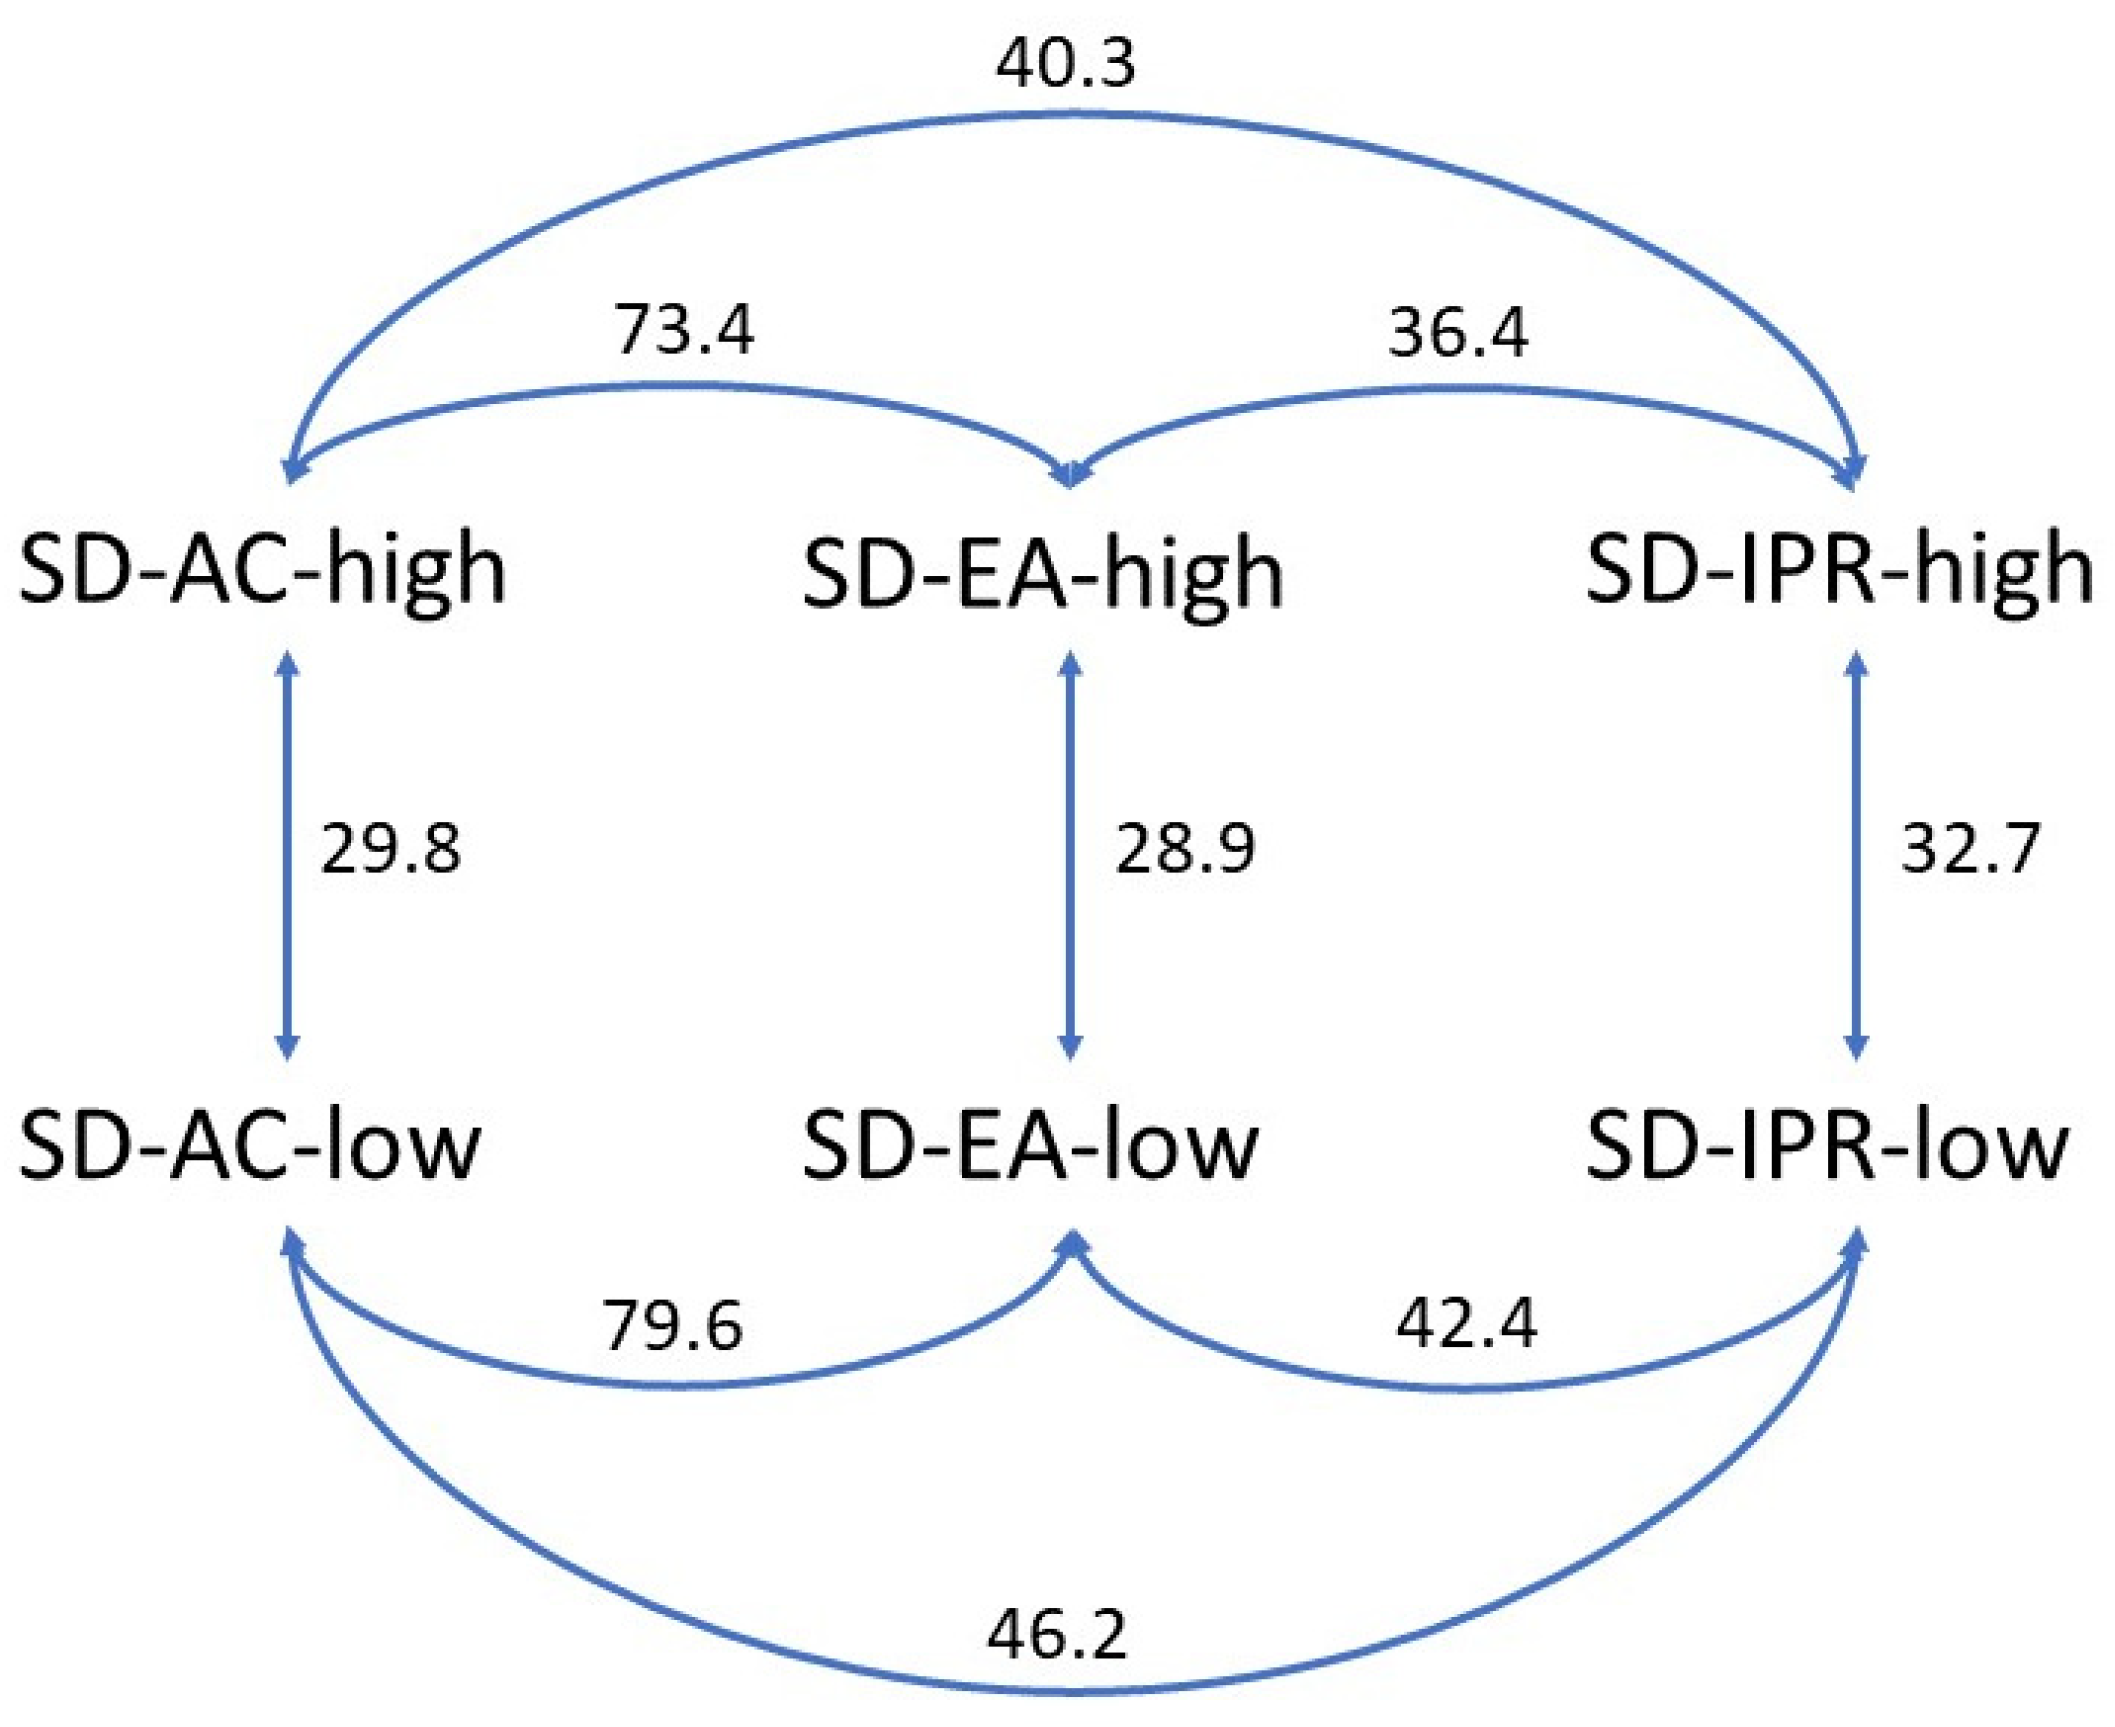
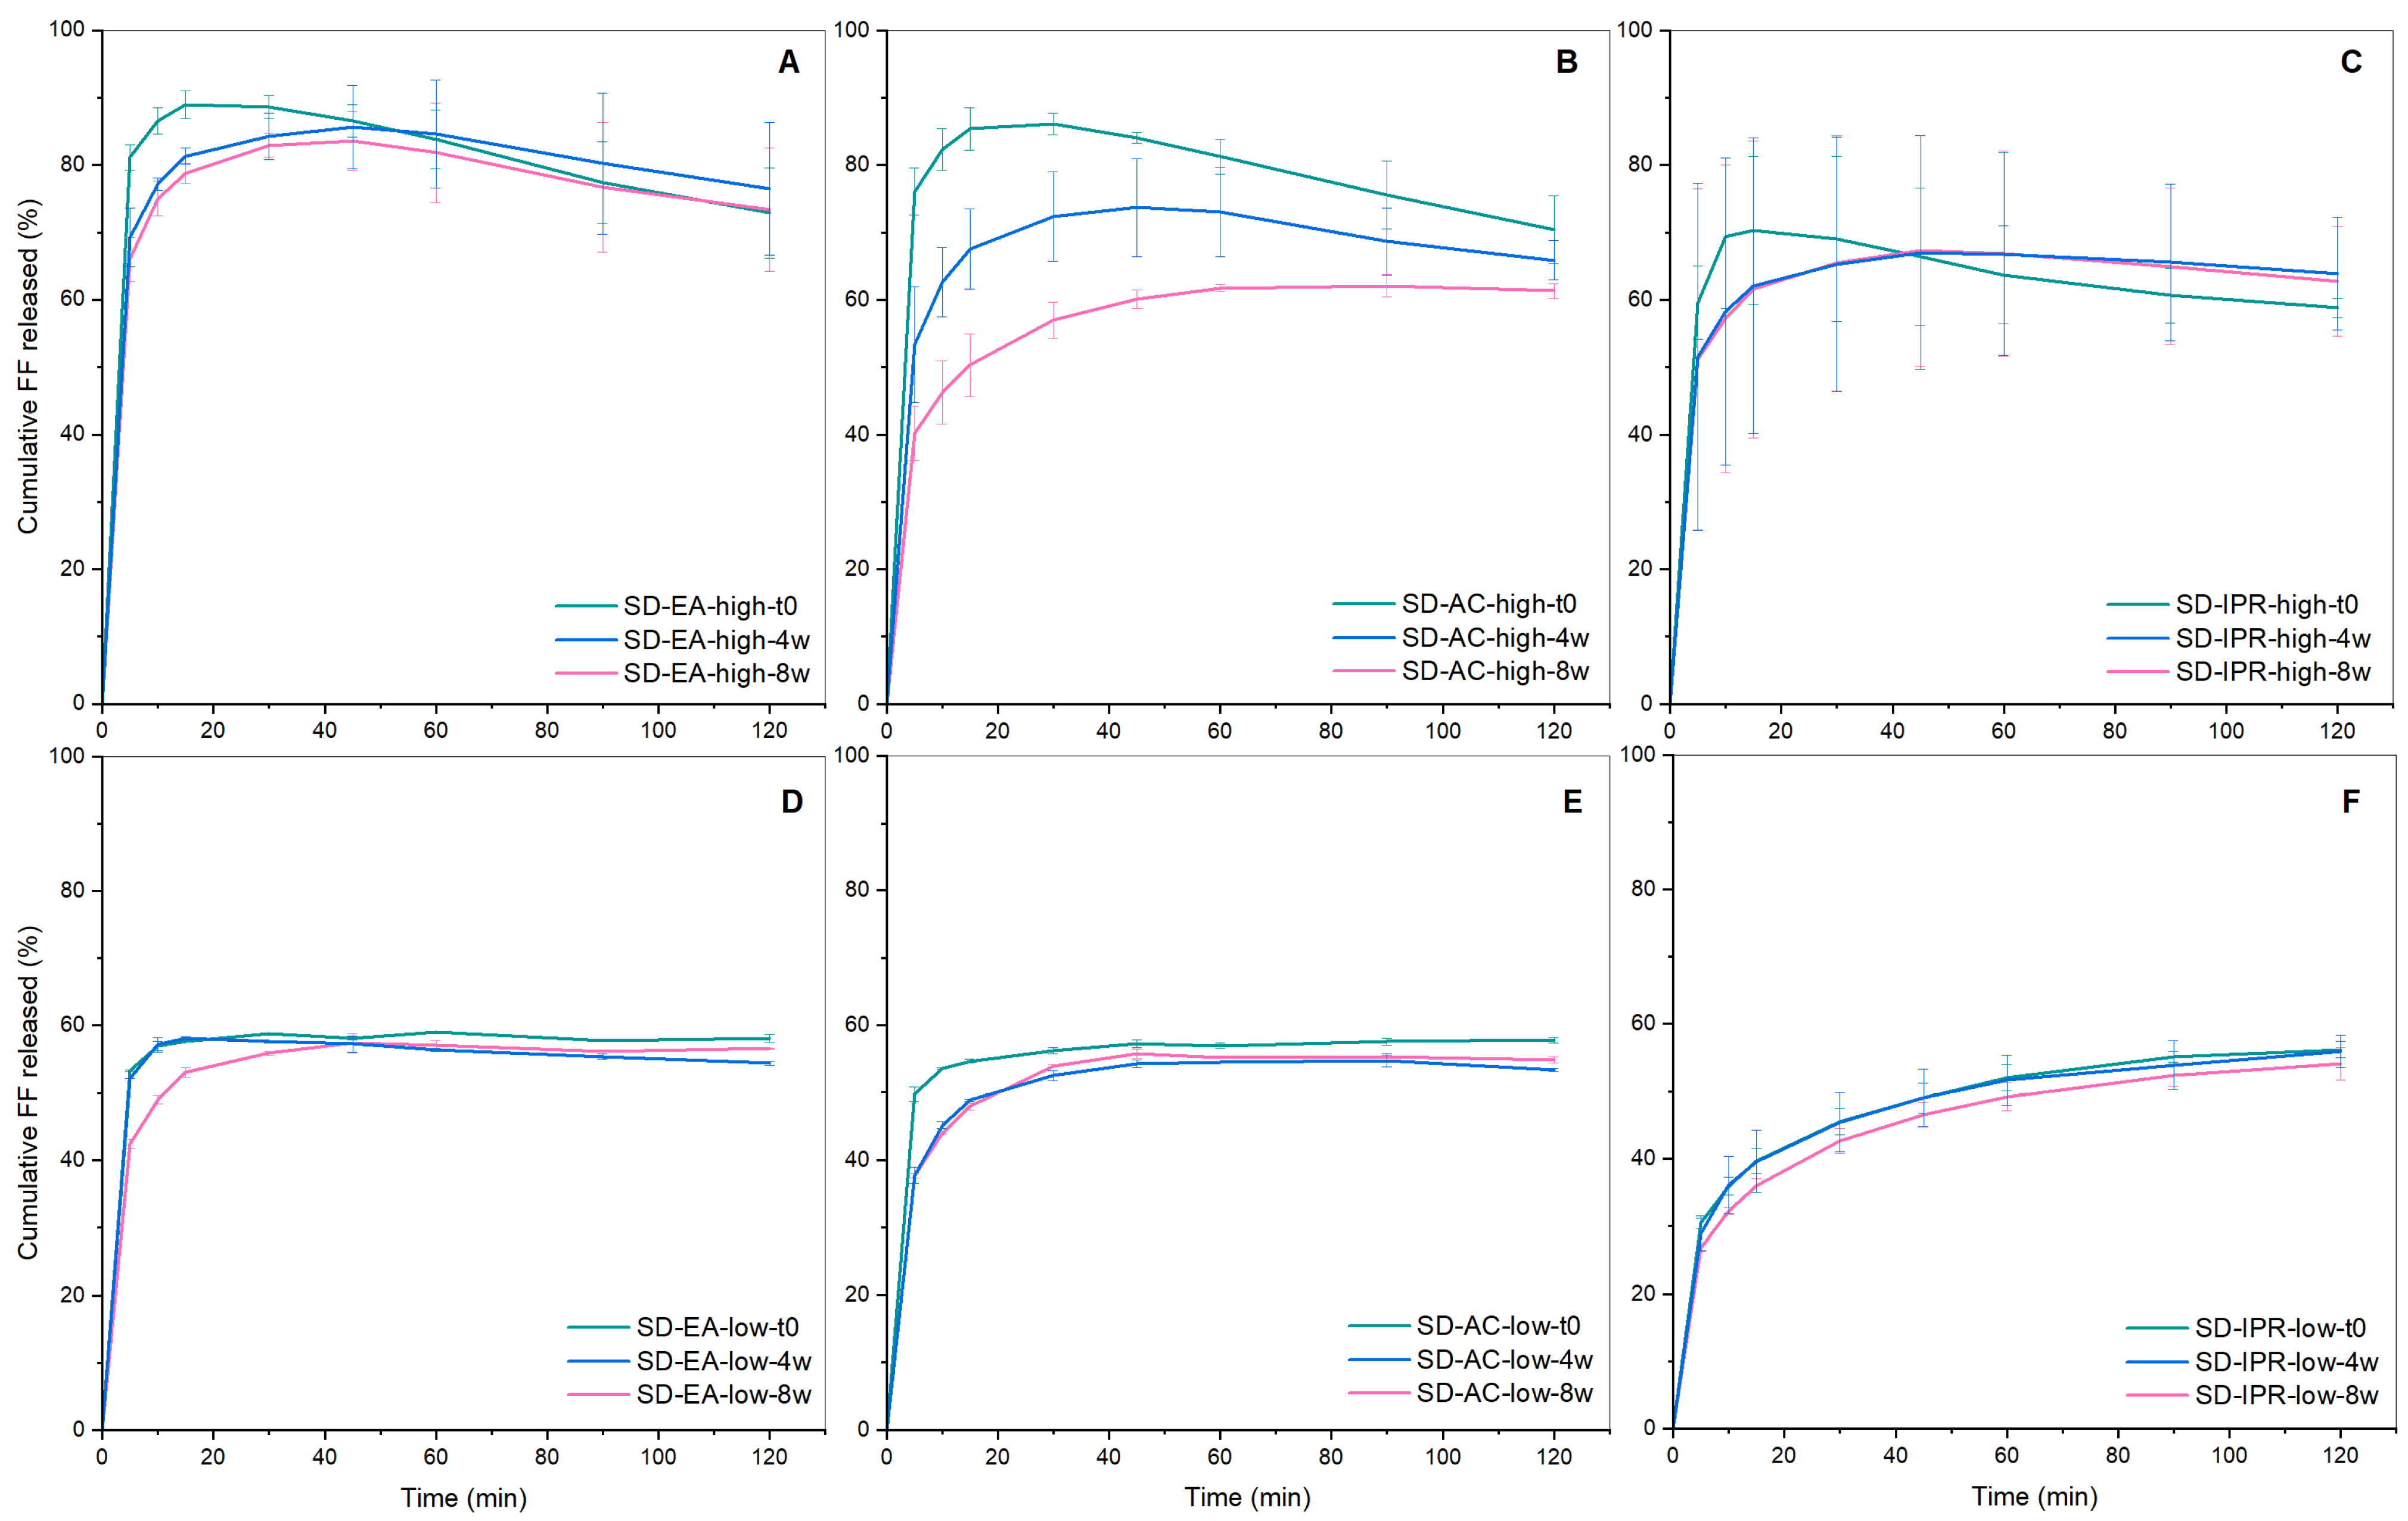
3.4. Physical Stability
4. Conclusions
Author Contributions
Funding
Institutional Review Board Statement
Informed Consent Statement
Data Availability Statement
Acknowledgments
Conflicts of Interest
References
- Šoltys, M.; Kovačík, P.; Dammer, O.; Beránek, J.; Štěpánek, F. Effect of Solvent Selection on Drug Loading and Amorphisation in Mesoporous Silica Particles. Int. J. Pharm. 2019, 555, 19–27. [Google Scholar] [CrossRef] [PubMed]
- Azad, M.; Moreno, J.; Davé, R. Stable and Fast-Dissolving Amorphous Drug Composites Preparation via Impregnation of Neusilin® UFL2. J. Pharm. Sci. 2018, 107, 170–182. [Google Scholar] [CrossRef] [PubMed]
- Baumgartner, A.; Planinšek, O. Application of Commercially Available Mesoporous Silica for Drug Dissolution Enhancement in Oral Drug Delivery. Eur. J. Pharm. Sci. 2021, 167, 106015. [Google Scholar] [CrossRef] [PubMed]
- Chaudhari, S.P.; Gupte, A. Mesoporous Silica as a Carrier for Amorphous Solid Dispersion. Br. J. Pharm. Res. 2017, 16, 1–19. [Google Scholar] [CrossRef]
- Laitinen, R.; Löbmann, K.; Strachan, C.J.; Grohganz, H.; Rades, T. Emerging Trends in the Stabilization of Amorphous Drugs. Int. J. Pharm. 2013, 453, 65–79. [Google Scholar] [CrossRef] [PubMed]
- Price, J.D. The Developability Classification System (DCS): Enabling an Optimized Approach for Formulation of Poorly Soluble Molecules. Available online: https://www.sigmaaldrich.com/deepweb/assets/sigmaaldrich/marketing/global/documents/363/277/wp8954en-solubility-mk.pdf (accessed on 27 November 2023).
- Sironi, D.; Rosenberg, J.; Bauer-Brandl, A.; Brandl, M. Dynamic Dissolution-/Permeation-Testing of Nano- and Microparticle Formulations of Fenofibrate. Eur. J. Pharm. Sci. 2017, 96, 20–27. [Google Scholar] [CrossRef]
- Yousaf, A.M.; Kim, D.W.; Oh, Y.-K.; Yong, C.S.; Kim, J.O.; Choi, H.-G. Enhanced Oral Bioavailability of Fenofibrate Using Polymeric Nanoparticulated Systems: Physicochemical Characterization and in Vivo Investigation. Int. J. Nanomed. 2015, 10, 1819–1830. [Google Scholar] [CrossRef] [PubMed]
- Zhang, J.; Wu, C.-Y.; Pan, X.; Wu, C. On Identification of Critical Material Attributes for Compression Behaviour of Pharmaceutical Diluent Powders. Materials 2017, 10, 845. [Google Scholar] [CrossRef] [PubMed]
- Baumgartner, A.; Planinšek, O. Effect of Process Parameters in High Shear Granulation on Characteristics of a Novel Co-Processed Mesoporous Silica Material. Eur. J. Pharm. Sci. 2023, 188, 106528. [Google Scholar] [CrossRef]
- Planinšek, O.; Kovačič, B.; Vrečer, F. Carvedilol Dissolution Improvement by Preparation of Solid Dispersions with Porous Silica. Int. J. Pharm. 2011, 406, 41–48. [Google Scholar] [CrossRef]
- Genina, N.; Hadi, B.; Löbmann, K. Hot Melt Extrusion as Solvent-Free Technique for a Continuous Manufacturing of Drug-Loaded Mesoporous Silica. J. Pharm. Sci. 2018, 107, 149–155. [Google Scholar] [CrossRef] [PubMed]
- Vialpando, M.; Albertini, B.; Passerini, N.; Bergers, D.; Rombaut, P.; Martens, J.A.; Van Den Mooter, G. Agglomeration of Mesoporous Silica by Melt and Steam Granulation. Part I: A Comparison between Disordered and Ordered Mesoporous Silica. J. Pharm. Sci. 2013, 102, 3966–3977. [Google Scholar] [CrossRef]
- Limnell, T.; Santos, H.A.; Mäkilä, E.; Heikkilä, T.; Salonen, J.; Murzin, D.Y.; Kumar, N.; Laaksonen, T.; Peltonen, L.; Hirvonen, J. Drug Delivery Formulations of Ordered and Nonordered Mesoporous Silica: Comparison of Three Drug Loading Methods. J. Pharm. Sci. 2011, 100, 3294–3306. [Google Scholar] [CrossRef] [PubMed]
- Sun, W.-J.; Aburub, A.; Sun, C.C. A Mesoporous Silica Based Platform to Enable Tablet Formulations of Low Dose Drugs by Direct Compression. Int. J. Pharm. 2018, 539, 184–189. [Google Scholar] [CrossRef] [PubMed]
- Escriche-Navarro, B.; Escudero, A.; Lucena Sánchez, E.; Sancenón, F.; García-Fernández, A.; Martínez-Máñez, R. Mesoporous Silica Materials as an Emerging Tool for Cancer Immunotherapy. Adv. Sci. 2022, 9, 2200756. [Google Scholar] [CrossRef] [PubMed]
- Xu, Q.; Yang, Y.; Lu, J.; Lin, Y.; Feng, S.; Luo, X.; Di, D.; Wang, S.; Zhao, Q. Recent Trends of Mesoporous Silica-Based Nanoplatforms for Nanodynamic Therapies. Coord. Chem. Rev. 2022, 469, 214687. [Google Scholar] [CrossRef]
- Mazzotta, E.; De Santo, M.; Lombardo, D.; Leggio, A.; Pasqua, L. Mesoporous Silicas in Materials Engineering: Nanodevices for Bionanotechnologies. Mater. Today Bio 2022, 17, 100472. [Google Scholar] [CrossRef]
- Maleki, A.; Kettiger, H.; Schoubben, A.; Rosenholm, J.M.; Ambrogi, V.; Hamidi, M. Mesoporous Silica Materials: From Physico-Chemical Properties to Enhanced Dissolution of Poorly Water-Soluble Drugs. J. Control. Release 2017, 262, 329–347. [Google Scholar] [CrossRef]
- Hussain, T.; Waters, L.J.; Parkes, G.M.B.; Shahzad, Y. Microwave Processed Solid Dispersions for Enhanced Dissolution of Gemfibrozil Using Non-Ordered Mesoporous Silica. Colloids Surf. A Physicochem. Eng. Asp. 2017, 520, 428–435. [Google Scholar] [CrossRef]
- Ahern, R.J.; Hanrahan, J.P.; Tobin, J.M.; Ryan, K.B.; Crean, A.M. Comparison of Fenofibrate-Mesoporous Silica Drug-Loading Processes for Enhanced Drug Delivery. Eur. J. Pharm. Sci. 2013, 50, 400–409. [Google Scholar] [CrossRef]
- Lai, J.; Lin, W.; Scholes, P.; Li, M. Investigating the Effects of Loading Factors on the In Vitro Pharmaceutical Performance of Mesoporous Materials as Drug Carriers for Ibuprofen. Materials 2017, 10, 150. [Google Scholar] [CrossRef] [PubMed]
- Jia, Z.; Lin, P.; Xiang, Y.; Wang, X.; Wang, J.; Zhang, X.; Zhang, Q. A Novel Nanomatrix System Consisted of Colloidal Silica and pH-Sensitive Polymethylacrylate Improves the Oral Bioavailability of Fenofibrate. Eur. J. Pharm. Biopharm. 2011, 79, 126–134. [Google Scholar] [CrossRef] [PubMed]
- Khanfar, M.; Al-Nimry, S. Stabilization and Amorphization of Lovastatin Using Different Types of Silica. AAPS PharmSciTech 2017, 18, 2358–2367. [Google Scholar] [CrossRef] [PubMed]
- Pardhi, V.; Chavan, R.B.; Thipparaboina, R.; Thatikonda, S.; Naidu, V.; Shastri, N.R. Preparation, Characterization, and Cytotoxicity Studies of Niclosamide Loaded Mesoporous Drug Delivery Systems. Int. J. Pharm. 2017, 528, 202–214. [Google Scholar] [CrossRef] [PubMed]
- Brunauer, S.; Emmett, P.H.; Teller, E. Adsorption of Gases in Multimolecular Layers. J. Am. Chem. Soc. 1938, 60, 309–319. [Google Scholar] [CrossRef]
- Lippens, B.C.; de Boer, J.H. Studies on Pore Systems in Catalysts: V. The t Method. J. Catal. 1965, 4, 319–323. [Google Scholar] [CrossRef]
- Barrett, E.P.; Joyner, L.G.; Halenda, P.P. The Determination of Pore Volume and Area Distributions in Porous Substances. I. Computations from Nitrogen Isotherms. J. Am. Chem. Soc. 1951, 73, 373–380. [Google Scholar] [CrossRef]
- Moore, J.W.; Flanner, H.H. Mathematical Comparison of Dissolution Profiles. Pharm. Technol. 1996, 20, 64–74. [Google Scholar]
- Maulvi, F.A.; Dalwadi, S.J.; Thakkar, V.T.; Soni, T.G.; Gohel, M.C.; Gandhi, T.R. Improvement of Dissolution Rate of Aceclofenac by Solid Dispersion Technique. Powder Technol. 2011, 207, 47–54. [Google Scholar] [CrossRef]
- Waters, L.J.; Hussain, T.; Parkes, G.; Hanrahan, J.P.; Tobin, J.M. Inclusion of Fenofibrate in a Series of Mesoporous Silicas Using Microwave Irradiation. Eur. J. Pharm. Biopharm. 2013, 85, 936–941. [Google Scholar] [CrossRef]
- Heinz, A.; Gordon, K.C.; McGoverin, C.M.; Rades, T.; Strachan, C.J. Understanding the Solid-State Forms of Fenofibrate--a Spectroscopic and Computational Study. Eur. J. Pharm. Biopharm. 2009, 71, 100–108. [Google Scholar] [CrossRef] [PubMed]
- Matsumoto, K.; Nakai, Y.; Yonemochi, E.; Oguchi, T.; Yamamoto, K. Effect of Pore Size on the Gaseous Adsorption of Ethenzamide on Porous Crystalline Cellulose and the Physicochemical Stability of Ethenzamide after Storage. Chem. Pharm. Bull. 1998, 46, 314–318. [Google Scholar] [CrossRef]
- Mohanty, S.; Sahoo, S.; Patra, S.; Tripathy, S. Design and Development of Fenofibrate Solid Dispersions for Solubility Enhancement. J. Pharm. Negat. Results 2022, 980–990. [Google Scholar] [CrossRef]
- Wen, T.; Niu, B.; Wu, Q.; Zhou, Y.; Pan, X.; Quan, G.; Wu, C. Fenofibrate Solid Dispersion Processed by Hot-Melt Extrusion: Elevated Bioavailability and Its Cell Transport Mechanism. Curr. Drug Deliv. 2019, 16, 538–547. [Google Scholar] [CrossRef] [PubMed]
- Girgsdies, F. Peak Profile Analysis in X-ray Powder Diffraction; Fritz-Haber-Institut der MPG: Berlin, Germany, 2015. [Google Scholar]
- Shi, X.; Shao, Y.; Sheng, X. A New Polymorph of Fenofibrate Prepared by Polymer-Mediated Crystallization. J. Cryst. Growth 2018, 498, 93–102. [Google Scholar] [CrossRef]
- Figari, G.; Gonçalves, J.L.M.; Diogo, H.P.; Dionísio, M.; Farinha, J.P.; Viciosa, M.T. Understanding Fenofibrate Release from Bare and Modified Mesoporous Silica Nanoparticles. Pharmaceutics 2023, 15, 1624. [Google Scholar] [CrossRef] [PubMed]
- Jamadar, S.; Pore, Y.; Sayyad, F. Formation of Amorphous Telmisartan Polymeric Microparticles for Improvement of Physicochemical Characteristics. Part. Sci. Technol. 2014, 32, 512–519. [Google Scholar] [CrossRef]
- Wang, L.; Cui, F.D.; Sunada, H. Preparation and Evaluation of Solid Dispersions of Nitrendipine Prepared with Fine Silica Particles Using the Melt-Mixing Method. Chem. Pharm. Bull. 2006, 54, 37–43. [Google Scholar] [CrossRef]
- Watterson, S.; Hudson, S.; Svärd, M.; Rasmuson, Å.C. Thermodynamics of Fenofibrate and Solubility in Pure Organic Solvents. Fluid Phase Equilibria 2014, 367, 143–150. [Google Scholar] [CrossRef]
- Sadeghi, M.; Rasmuson, Å.C. Solubility of Salicylic Acid, Salicylamide, and Fenofibrate in Organic Solvents at Low Temperatures. J. Chem. Eng. Data 2020, 65, 4855–4861. [Google Scholar] [CrossRef]
- Illustrated Glossary of Organic Chemistry. Available online: https://www.chem.ucla.edu/~harding/IGOC/D/dielectric_constant.html (accessed on 5 January 2024).
- Hillerström, A.; Andersson, M.; Samuelsson, J.; van Stam, J. Solvent Strategies for Loading and Release in Mesoporous Silica. Colloid Interface Sci. Commun. 2014, 3, 5–8. [Google Scholar] [CrossRef]
- Physical Properties of Solvents. Available online: https://www.sigmaaldrich.com/deepweb/assets/sigmaaldrich/marketing/global/documents/614/456/labbasics_pg144.pdf (accessed on 5 January 2024).
- Kovačič, B.; Vrečer, F.; Planinšek, O. Solid Dispersions of Carvedilol with Porous Silica. Chem. Pharm. Bull. 2011, 59, 427–433. [Google Scholar] [CrossRef] [PubMed]
- Le, T.-T.; Elzhry Elyafi, A.K.; Mohammed, A.R.; Al-Khattawi, A. Delivery of Poorly Soluble Drugs via Mesoporous Silica: Impact of Drug Overloading on Release and Thermal Profiles. Pharmaceutics 2019, 11, 269. [Google Scholar] [CrossRef] [PubMed]
- Dening, T.J.; Taylor, L.S. Supersaturation Potential of Ordered Mesoporous Silica Delivery Systems. Part 1: Dissolution Performance and Drug Membrane Transport Rates. Mol. Pharm. 2018, 15, 3489–3501. [Google Scholar] [CrossRef] [PubMed]
- Jelić, D. Thermal Stability of Amorphous Solid Dispersions. Molecules 2021, 26, 238. [Google Scholar] [CrossRef] [PubMed]
- Siracusa, V. Food Packaging Permeability Behaviour: A Report. Int. J. Polym. Sci. 2012, 2012, 302029. [Google Scholar] [CrossRef]
- McCarthy, C.A.; Ahern, R.J.; Dontireddy, R.; Ryan, K.B.; Crean, A.M. Mesoporous Silica Formulation Strategies for Drug Dissolution Enhancement: A Review. Expert Opin. Drug Deliv. 2016, 13, 93–108. [Google Scholar] [CrossRef] [PubMed]
- Mellaerts, R.; Roeffaers, M.B.J.; Houthoofd, K.; Van Speybroeck, M.; De Cremer, G.; Jammaer, J.A.G.; Van den Mooter, G.; Augustijns, P.; Hofkens, J.; Martens, J.A. Molecular Organization of Hydrophobic Molecules and Co-Adsorbed Water in SBA-15 Ordered Mesoporous Silica Material. Phys. Chem. Chem. Phys. 2011, 13, 2706–2713. [Google Scholar] [CrossRef]
- Mellaerts, R.; Houthoofd, K.; Elen, K.; Chen, H.; Van Speybroeck, M.; Van Humbeeck, J.; Augustijns, P.; Mullens, J.; Van den Mooter, G.; Martens, J.A. Aging Behavior of Pharmaceutical Formulations of Itraconazole on SBA-15 Ordered Mesoporous Silica Carrier Material. Microporous Mesoporous Mater. 2010, 130, 154–161. [Google Scholar] [CrossRef]


| Formulation | Type of Formulation | FF Mass (g) | Syloid Mass (g) | Theoretical FF Content (%) | Solvent | Solvent Evaporation Temperature (°C) |
|---|---|---|---|---|---|---|
| SD-EA-high | SD | 2.4 | 5.6 | 30 | Ethyl acetate | 77 ± 2 |
| SD-EA-low | SD | 2.4 | 5.6 | 30 | Ethyl acetate | 40 ± 2 |
| SD-AC-high | SD | 2.4 | 5.6 | 30 | Acetone | 56 ± 2 |
| SD-AC-low | SD | 2.4 | 5.6 | 30 | Acetone | 40 ± 2 |
| SD-IPR-high | SD | 2.4 | 5.6 | 30 | Isopropanol | 82 ± 2 |
| SD-IPR-low | SD | 2.4 | 5.6 | 30 | Isopropanol | 40 ± 2 |
| SD-EA-20 | SD | 1.6 | 6.4 | 20 | Ethyl acetate | 77 ± 2 |
| SD-EA-25 | SD | 2.0 | 6.0 | 25 | Ethyl acetate | 77 ± 2 |
| SD-EA-35 | SD | 2.8 | 5.2 | 35 | Ethyl acetate | 77 ± 2 |
| PM-30 | Physical mixture | 2.4 | 5.6 | 30 | - | - |
| Sample | SSA (m2/g) | Pore Volume (mL/g) | Average Pore Diameter (nm) |
|---|---|---|---|
| Syloid | 289 | 1.40 | 18.6 |
| SD-EA-20 | 198 | 1.05 | 17.8 |
| SD-EA-25 | 155 | 0.90 | 18.8 |
| SD-EA-high | 163 | 0.82 | 17.2 |
| SD-EA-35 | 143 | 0.77 | 18.2 |
Disclaimer/Publisher’s Note: The statements, opinions and data contained in all publications are solely those of the individual author(s) and contributor(s) and not of MDPI and/or the editor(s). MDPI and/or the editor(s) disclaim responsibility for any injury to people or property resulting from any ideas, methods, instructions or products referred to in the content. |
© 2024 by the authors. Licensee MDPI, Basel, Switzerland. This article is an open access article distributed under the terms and conditions of the Creative Commons Attribution (CC BY) license (https://creativecommons.org/licenses/by/4.0/).
Share and Cite
Baumgartner, A.; Dobaj, N.; Planinšek, O. Investigating the Influence of Processing Conditions on Dissolution and Physical Stability of Solid Dispersions with Fenofibrate and Mesoporous Silica. Pharmaceutics 2024, 16, 575. https://doi.org/10.3390/pharmaceutics16050575
Baumgartner A, Dobaj N, Planinšek O. Investigating the Influence of Processing Conditions on Dissolution and Physical Stability of Solid Dispersions with Fenofibrate and Mesoporous Silica. Pharmaceutics. 2024; 16(5):575. https://doi.org/10.3390/pharmaceutics16050575
Chicago/Turabian StyleBaumgartner, Ana, Nina Dobaj, and Odon Planinšek. 2024. "Investigating the Influence of Processing Conditions on Dissolution and Physical Stability of Solid Dispersions with Fenofibrate and Mesoporous Silica" Pharmaceutics 16, no. 5: 575. https://doi.org/10.3390/pharmaceutics16050575