Personalised and Coordinated Demand-Responsive Feeder Transit Service Design: A Genetic Algorithms Approach

1
School of Transportation, Nantong University, Nantong 226019, China
2
Nantong Research Institute for Advanced Communication Technologies, Nantong 226019, China
3
College of Civil Engineering, Hebei University of Technology, Tianjin 300401, China
*
Author to whom correspondence should be addressed.
Future Internet 2018, 10(7), 61; https://doi.org/10.3390/fi10070061
Submission received: 21 May 2018
/
Revised: 6 June 2018
/
Accepted: 19 June 2018
/
Published: 1 July 2018
Abstract
:The purpose of this work is to create an efficient optimization framework for demand-responsive feeder transit services to assign vehicles to cover all pickup locations to transport passengers to a rail station. The proposed methodology features passengers placing a personalized travel order involving the subway schedule chosen by passengers and windows of service time, etc. Moreover, synchronous transfer between the shuttle and feeder bus is fully accounted for in the problem. A mixed-integer linear programming model is formulated to minimize the total travel time for all passengers, which consists of ride-time for vehicles from the pickup locations to the rail station and wait-time for passengers taking the subway beforehand. Different from conventional methods, the proposed model benefits from using a real distribution of passenger demand aggregated from cellular data and travel time or the distance matrix obtained from an open GIS tool. A distributed genetic algorithm is further designed to obtain meta-optimal solutions in a reasonable amount of time. When applied to design a feeder bus system in Nanjing City, China, case study results reveal that the total travel time of the proposed model was reduced by 2.46% compared to the traditional model. Sensitivity analyses were also further performed to investigate the impact of the number of vehicles on the output. Finally, the difference in results of Cplex, standard GA, and the proposed algorithm were compared to prove the validity of the algorithm.
1. Introduction
Demand-responsive feeder transit services (DRTs), assigning buses to cover all pickup locations to transport passengers to the rail station, can provide a door-to-door type of service for the first/last mile access to link residential areas and a major fixed-route transit network [1,2]. Compared to fixed-route feeder transit services (FRTs), DRTs can catch each passenger’s personalized desires in low-density residential areas by using a cell phone app to place a travel order involving pickup or drop-off locations, windows of time service, and the predetermined subway schedule to provide a lower operating cost and a higher service level [3]. Therefore, DRTs have attracted the widespread attention of domestic and foreign scholars.
The passengers’ travel orders are the input to the design process of the DRT model. In general, they are willing to choose their own subway schedule, except for the pickup or drop off locations, the boarding time window, etc. Obviously, the passengers’ personalized subway schedules affect the route-building process. However, the DRT model has not been integrated with personalized travel [4]. Therefore, it is necessary to reveal the impact of the subway schedule chosen by passengers on the design process of the feeder bus route in order to trade off operation cost and service level.
Another major motivation of this paper is to address DRTs with the synchronous coordination of rail transit. Few studies have examined this problem, but many examined the synchronous transfer between the shuttle and the feeder bus [5,6]. Without the loss of generality, it is only relevant to the wait-time for passengers taking the subway beforehand, being an important part of total travel time, and it has an impact on the design process of the feeder bus route to the change in ride-time. Obviously, the synchronous transfer between the shuttle and the feeder bus may reduce the total travel time for all passengers. Hence, it is very important to find the optimal relation between the feeder bus routing and the synchronous coordination of rail transit in order to trade off wait-time and ride-time.
The main contribution of this paper is to present an efficient optimization framework for DRTs with personalized travel orders using a cell phone app and synchronous coordination of rail transit to improve the service level. This study will pay attention to the following critical research tasks: (1) coordinating the process of designing the feeder transit routing and the schedule, considering the synchronous transfer between the shuttle and the feeder bus; (2) based on the division of the problem into several sub-problems, developing a distributed genetic algorithm to efficiently find meta-optimal solutions to the proposed mode; and, finally, (3) a numeric case study is used to illustrate the application and feasibility of the proposed methodology.
The remainder of this paper is organized as follows: The related studies of DRTs are introduced in Section 2. Section 3 describes the problem of the proposed methodology and formulates the mathematic model of the DRT. Section 4 presents a distributed genetic algorithm for resolving the model. Section 5 and Section 6 display and discuss a case study to illustrate the proposed methodology, as well as remarks and possible future work.
2. Literature
DRTs, integrating both of the vehicle routing problem (VRP) and the pickup and delivery problem (PDP) [7,8], are used to provide door-to-door transportation services wherein vehicles are assigned to visit some locations to pick up or deliver passengers [9,10,11]. However, the distinct differences between VRPs, PDPs, and DRTs result in DRTs addressing more issues and having more complexity than VRPs and PDPs. Compared to FRTs, DRTs are more suitable in low population density areas, especially those places with a weak traffic infrastructure [11,12]. There have been numerous studies on DRTs in recent years, which can be divided into two main categories: analytic approaches and network approaches [13,14].
The analytic approach reveals the optimal relation between route spacing, the operating headway, and the stop space in the service area, where the shape geometry of the street and the demand distribution of these places are required. The first analytical approach was proposed by Wirasinghe [15] to design the DRT during a peak-period demand in the Calgary (South Corridor) DRT system. Based on this, Kuah and Perl further studied the influencing factors of bus-stop spacing on the DRT model [16,17]. Chowdhury further extended the DRT model with coordinated routes, where the stochastic feeder vehicle arrivals at transfer stations were considered [18]. However, the analytic approach has not been widely used to deal with DRTs, due to the fact that two model inputs, i.e., the shape geometry of the street and the demand distribution of these places, are regarded as the most significant limitations [14].
The network approaches represent the service that assigns bus routes to visit the pickup locations, where each location is assumed to be concentrated as a node and the links between these nodes represent the segments of bus routes. There are two typical network approaches to the DRT model, i.e., the feeder-bus network design optimization model proposed by Kuah and Perl [17] and extended by Chang and Chang [19], Martins and Pato [20], Kuan, Ong, and Ng [14], Mohaymany and Gholami [21], and the heuristic feeder route generation algorithm (HFRGA) proposed by Shrivastava and Dhingra [22], and also extended by Shrivastava and O’Mahony [23,24,25]. Chen et al. [26] proposed a two-phase mode to cope with DRT FBNDP. Deng et al. [27] proposed a model to solve the multi-level cost structure (passengers’ cost and operators’ cost) of M-to-M DRT. Pan et al. [28] presented a bi-level model to serve the maximum number of passengers in the feeder transit system in the upper level and to obtain the optimal operational cost for transit operators in the lower level. Yu et al. [29] presented a bi-level nonlinear MIP model to optimize the flexible feeder dedicated transit from bus stops to rail stations, and vice versa. Sun et al. [30] constructed a multi-objective MIP model in establishing coordination between rail and bus lines. Yan et al. [31] used a robust MIP model to minimize the sum of the operator cost and its variability, following a weighting process of the cost components. Sun et al. [32] presented a MIP model for DRT that considered passengers’ multiple time windows and their satisfaction.
Although existing studies have successfully studied a variety of DRTs, the two key issues deserve further investigation:
(1) Few of the studies take the synchronous transfer of rail transit and personalized travel (the subway schedule chosen by passengers) into account. In the case, it implies a neglect of the integrated operation of the feeder bus routing and the schedule considering synchronous transfer between the shuttle and the feeder bus to minimize the total ride-time and wait-time for all passengers.
(2) DRTs, as extensions of the VRP and PDP, are NP-hard problems, and should be resolved by an efficient algorithm.
3. Methodology
3.1. Research Framework
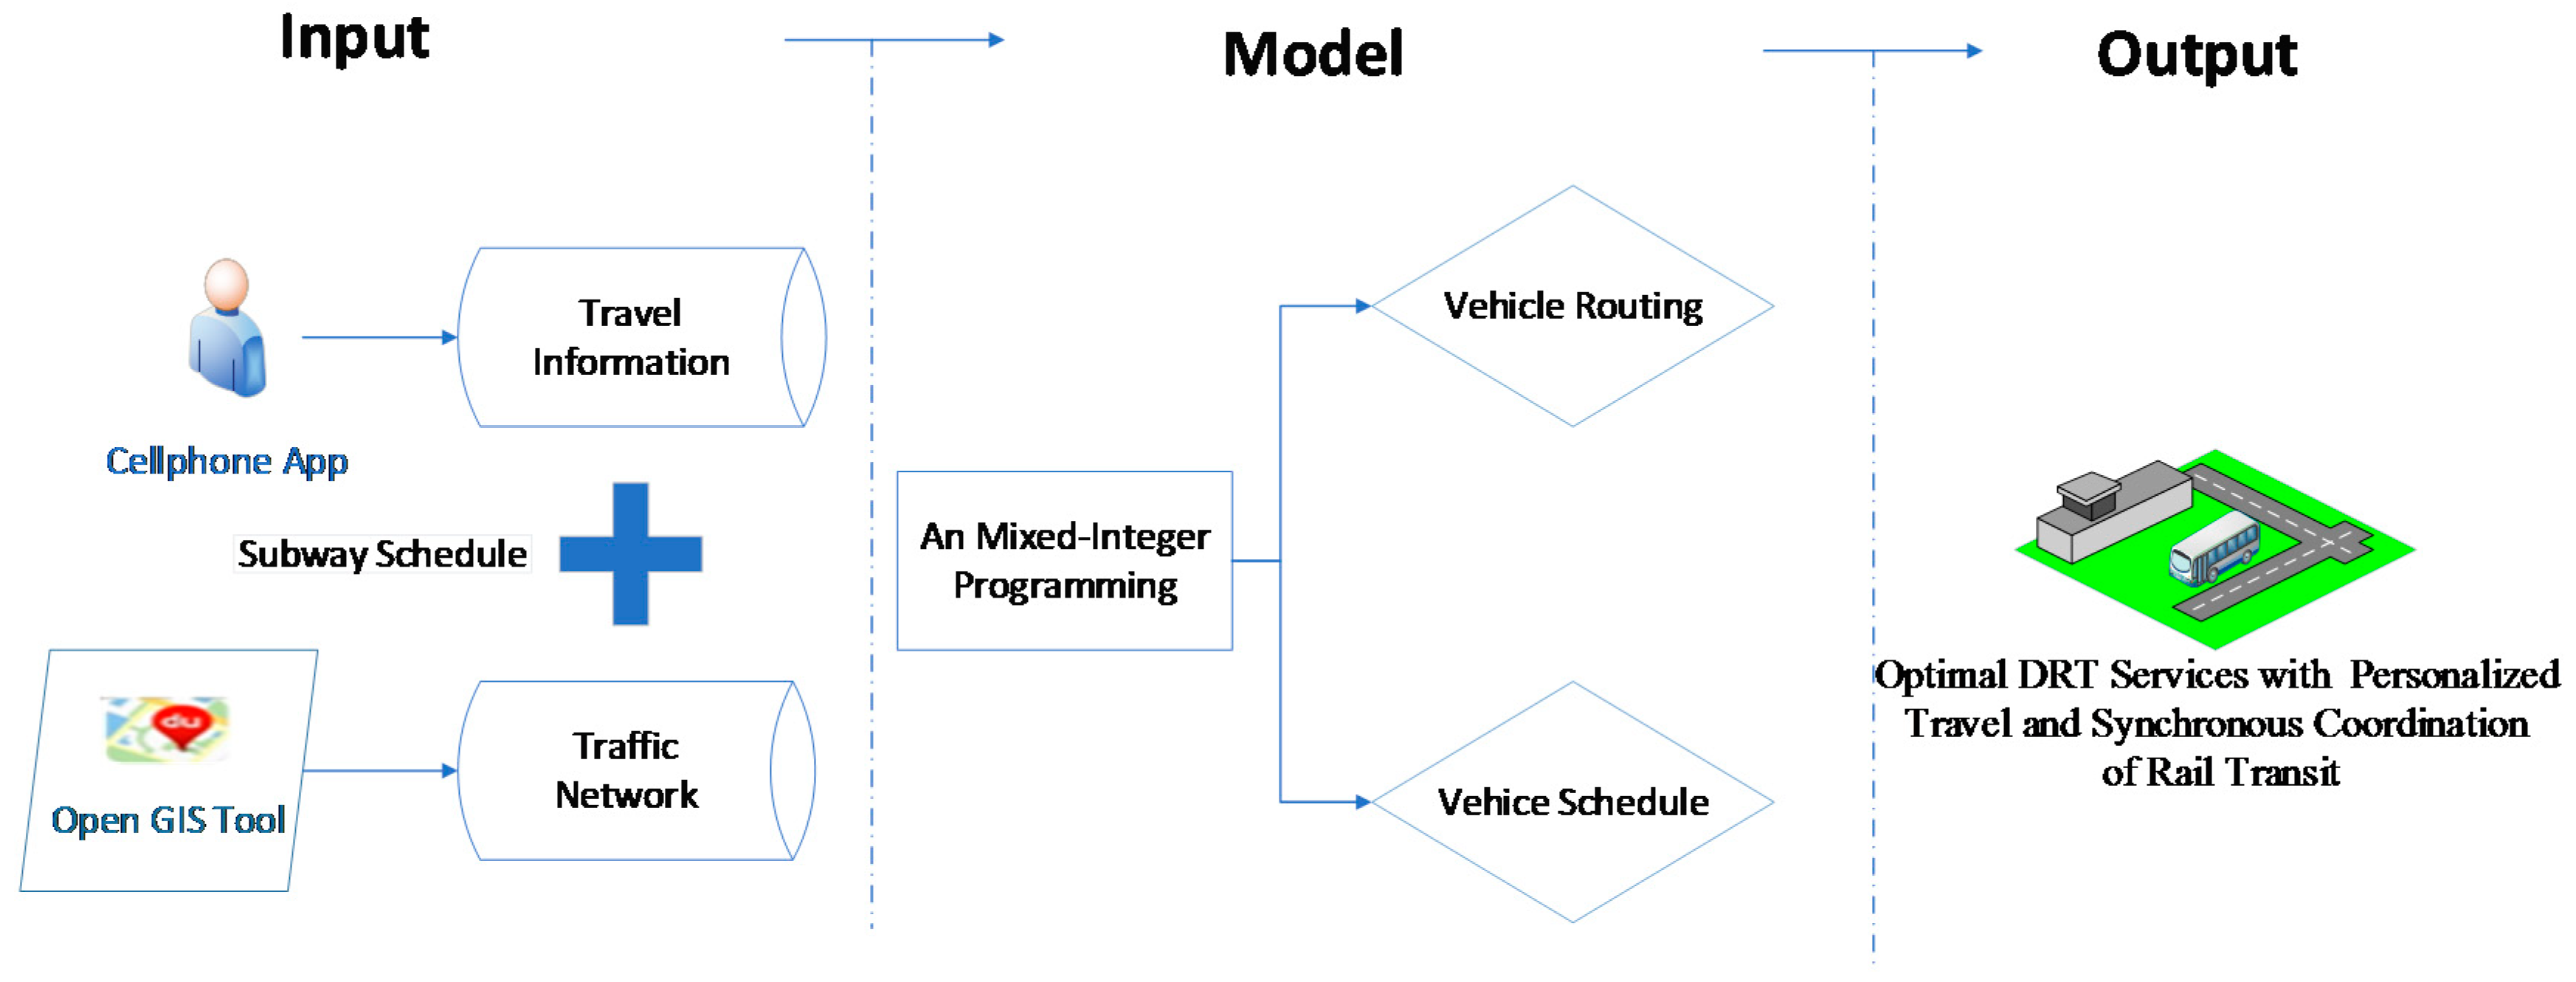
The main objective of this paper is to create a DRT model, in which the feeder bus route, starting at the bus depots and ending at the rail station, are designed to assign vehicles to cover all pickup locations to transport passengers to the rail station. Passengers place some travel orders by using a cell phone app that involves pickup or drop off locations, the boarding time window, and the predetermined subway schedule. The open GIS tool is used to calculate the real traffic distances and times between bus depots, demand points, and rail stations in the study area. During the process of designing the DRT model, a mixed-integer programming model is presented to reveal the optimal relationship of design efficiency between the feeder bus routing and the schedule considering the synchronous transfer between the shuttle and the feeder buses. The research framework graph of the proposed methodology can be better described in Figure 1.
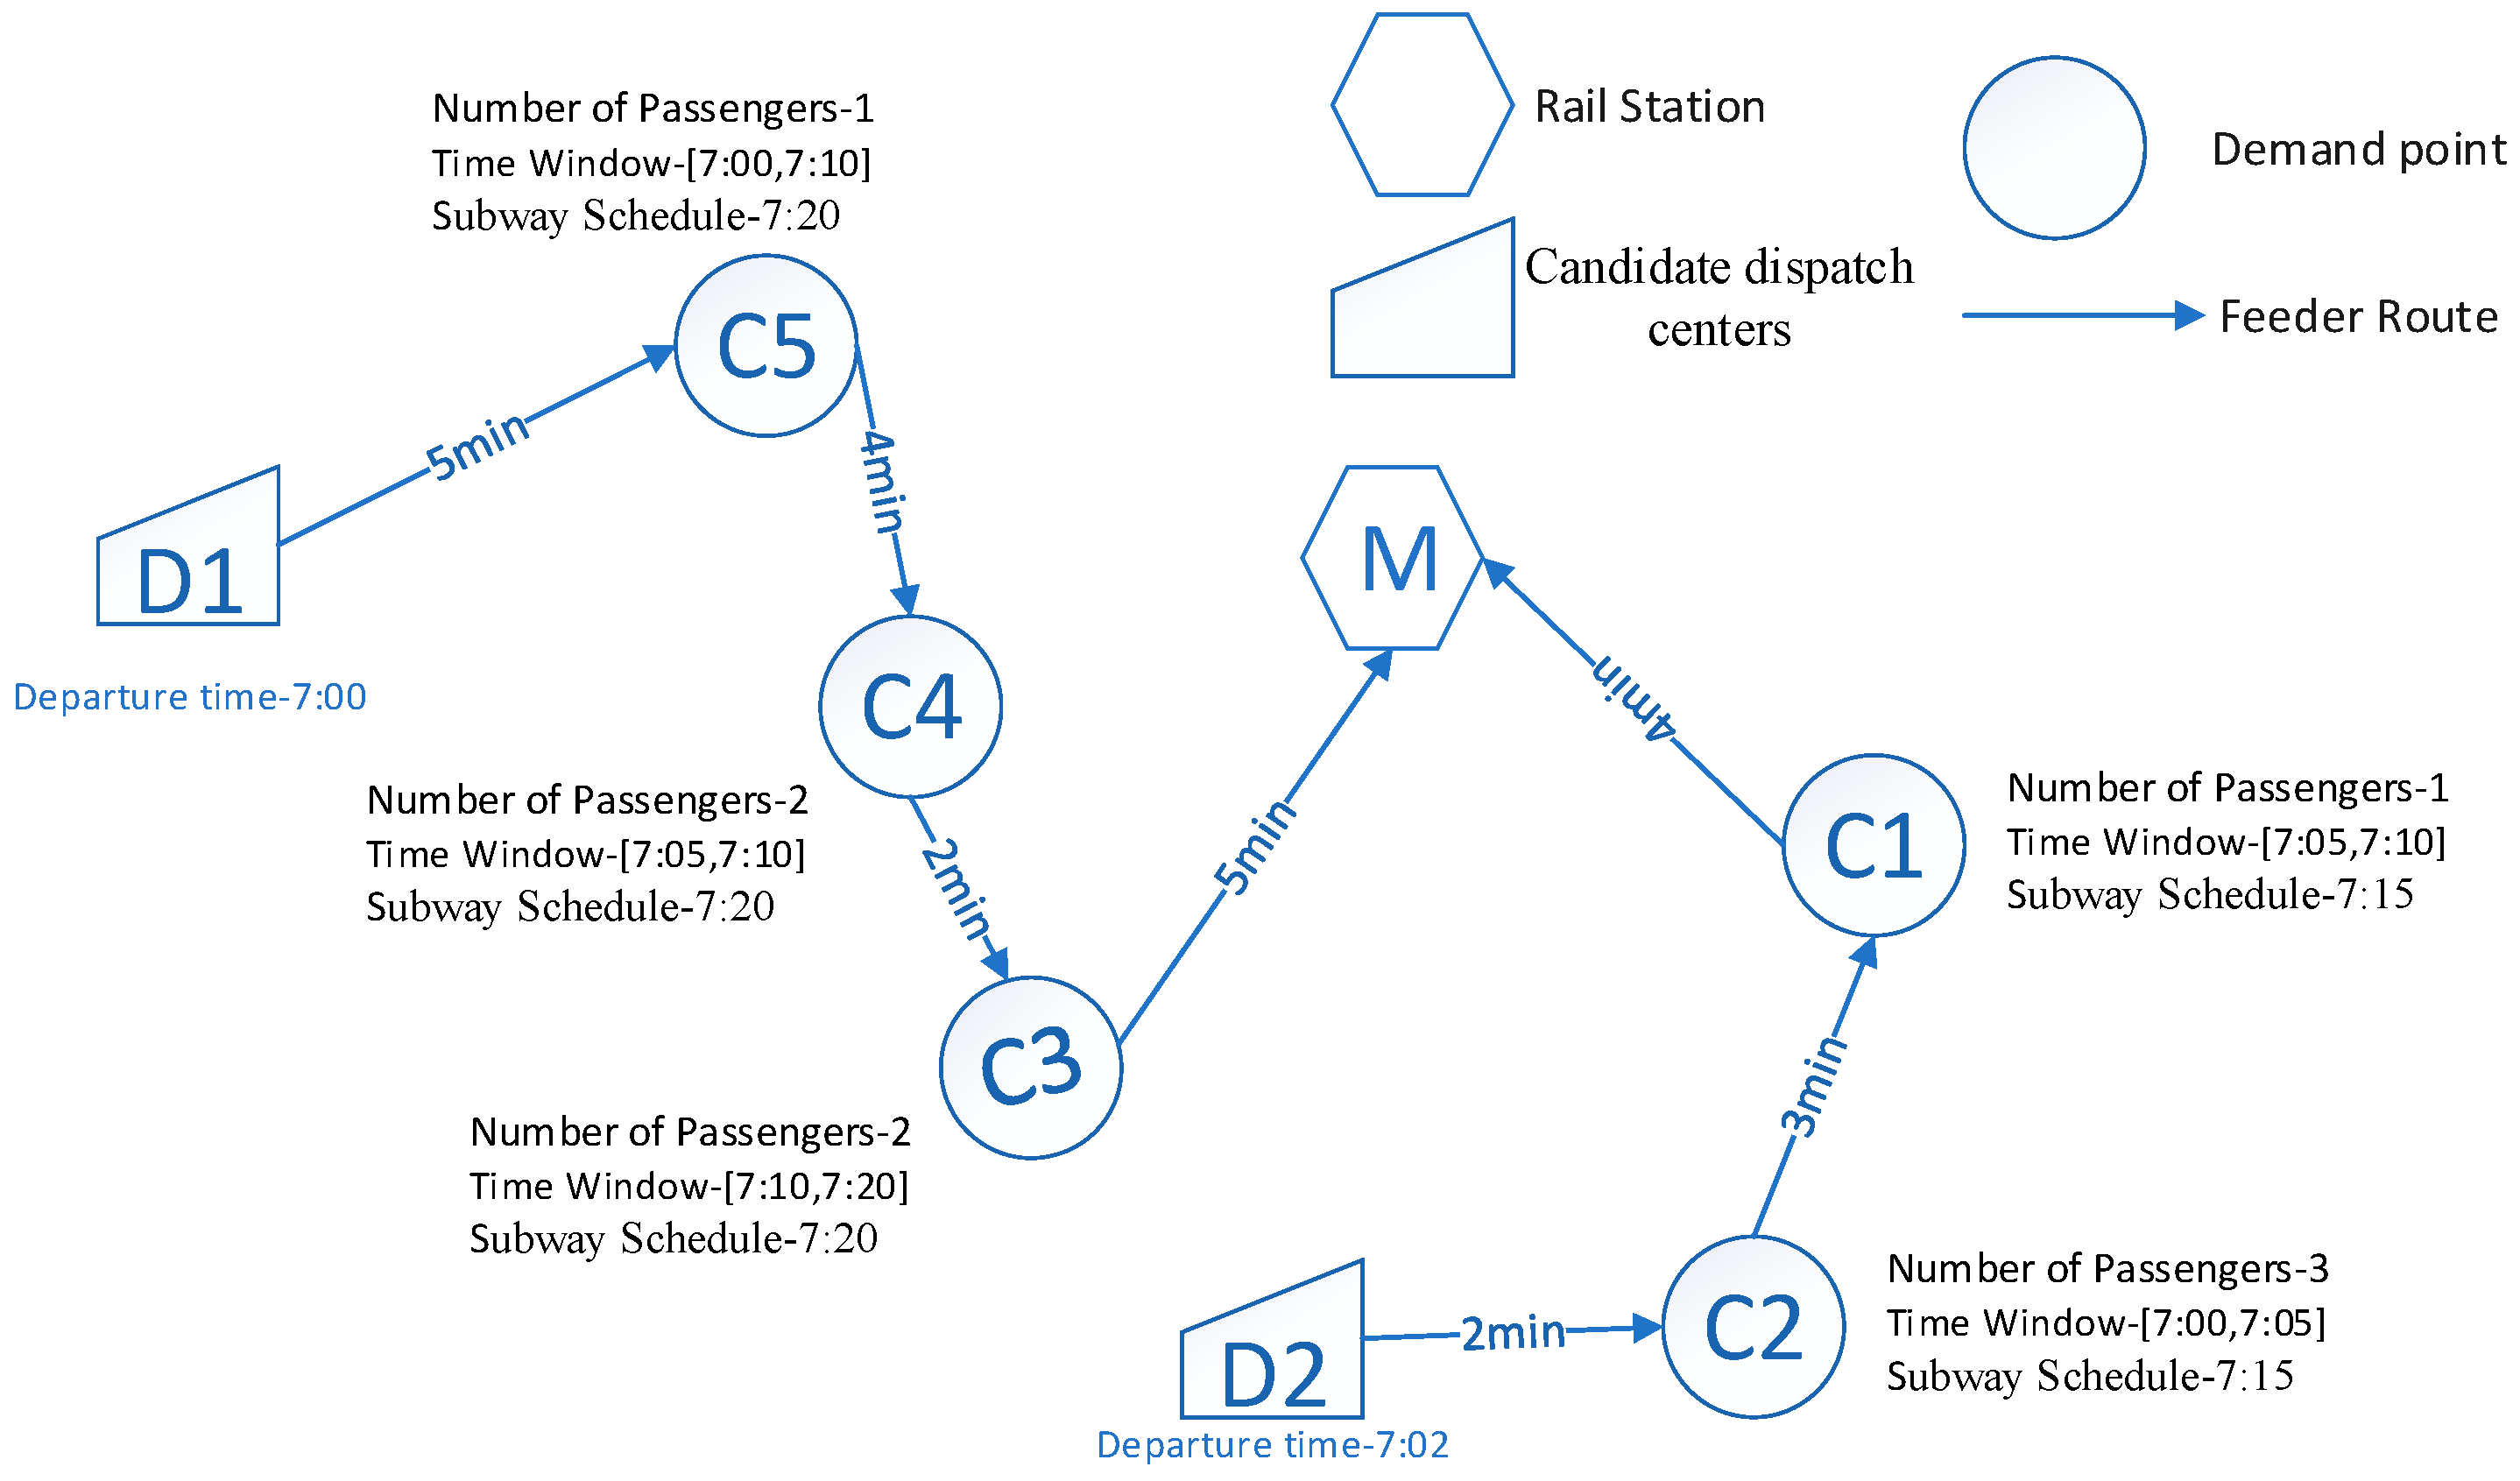
Here, we provide Figure 2 in order to better explain the principle and scope of the proposed methodology. The study area has one rail station (M), two bus depots (D1 and D2), and five demand points (C1, C2, … , C5). Two schedules of the rail station are 7:15 and 7:20. Walking time for passengers from the drop-off point of the rail station to the subway platform is 3 min. There are a number of boarding passengers located at each demand point with their time windows and a preferred subway schedule. For instance, at demand point C2 of Figure 2, we see 3; this means that three passengers will board the vehicle at this point. These passengers have preferred windows of service and subway schedules, i.e., [7:00, 7:05] and [7:05, 7:10] and 7:15. In the instance, two feasible DCR routes are yielded in the optimization process. Route 1 is illustrated by a solid line [D1(7:10)–C5(7:05)–C4(7:09)–C3(7:11)–M(7:16)] and Route 2 is also illustrated by a solid line [D2(7:02)–C2(7:04)–C1(7:07)–M(7:11)]. Take vehicle 2 as an example: The vehicle departs from D2 at the time of 7:02, and arrives at demand points C2 and C1 at the times of 7:04 and 7:07 to pick up three passengers and one passenger, respectively; finally, the vehicle returns back to M at 7:11. In this case, the ride-times of C2 and C1 are 7 min and 4 min, and the wait-time for both of them is 1 min. Thus, the total ride-time and wait-time for all passengers in vehicle 2 are 3 × 7 + 1 × 4 = 25 min and 4 × 1 = 4 min.
The objective is to find a feeder bus routing and schedule that simultaneously minimizes the total travel time for all passengers, which includes two terms: the first term deals with riding time for passengers from pick-up locations to the rail station and the second one is related to wait-time for passengers taking the subway beforehand. To ensure that our methodology fits well with the real-world situations, the following assumptions should be considered:
- (1)
- The pickup locations, the number of passengers, the boarding time window, and the predetermined subway schedule are collected by using a cell phone app.
- (2)
- The travel distance or time between demand points, bus depots, and rail stations in the real traffic network are easily obtained by using the Open GIS tool.
- (3)
- The demand point can only be visited by one feeder bus.
3.2. Model Formulation
3.2.1. Notation
To facilitate the model presentation, all definitions and notations used hereafter are summarized in Table 1.
3.2.2. Formulation
The proposed problem can be formulated as the following mixed integer program (MIP):
Minimize:
In our model, the objective function is given by Equation (1) to minimize the total ride-time for vehicles from the demand points to the rail station and the total wait-time for passengers taking the subway beforehand. The objective could not only reduce the total operational cost for the designed feeder bus system, but also increase residents’ travel convenience.
The constraint described by Equations (2) guarantees that each feeder bus covers at least one demand point. The constraint described by Equation (3) guarantees each demand point is only visited by one feeder bus, which aims to avoid undesirable competition among bus routes and further increase the whole system efficiency. The constraints described be Equations (4) and (5) guarantee that each feeder bus eventually starts at a bus depot and ends at a rail station. The constraint described by Equation (6) guarantees each demand point is not served by different vehicles at the same time. The constraint described by Equation (7) is used for sub-tour elimination in the vehicle routing. The constraint described by Equation (8) is used for calculating the arrival time of the next node covered by the vehicles after visiting the previous node. The constraint described by Equation (9) guarantees that a feeder bus arrives at the demand point in the boarding time windows. The constraint described by Equation (10) is used for determining the number of passengers on the feeder bus when the vehicle visits a demand point. The constraint described by Equation (11) guarantees that the number of passengers loaded at each pickup location on each feeder bus should not be more than the vehicle capacity. The constraints described by Equations (12) and (13) guarantee that the total travel distance and time of each feeder bus should satisfy its upper and lower limits. The constraint described by Equation (14) guarantees that the passengers of the demand points picked up by a feeder bus choose the same subway schedule at the rail station.
4. A GA-Based Heuristic Algorithm
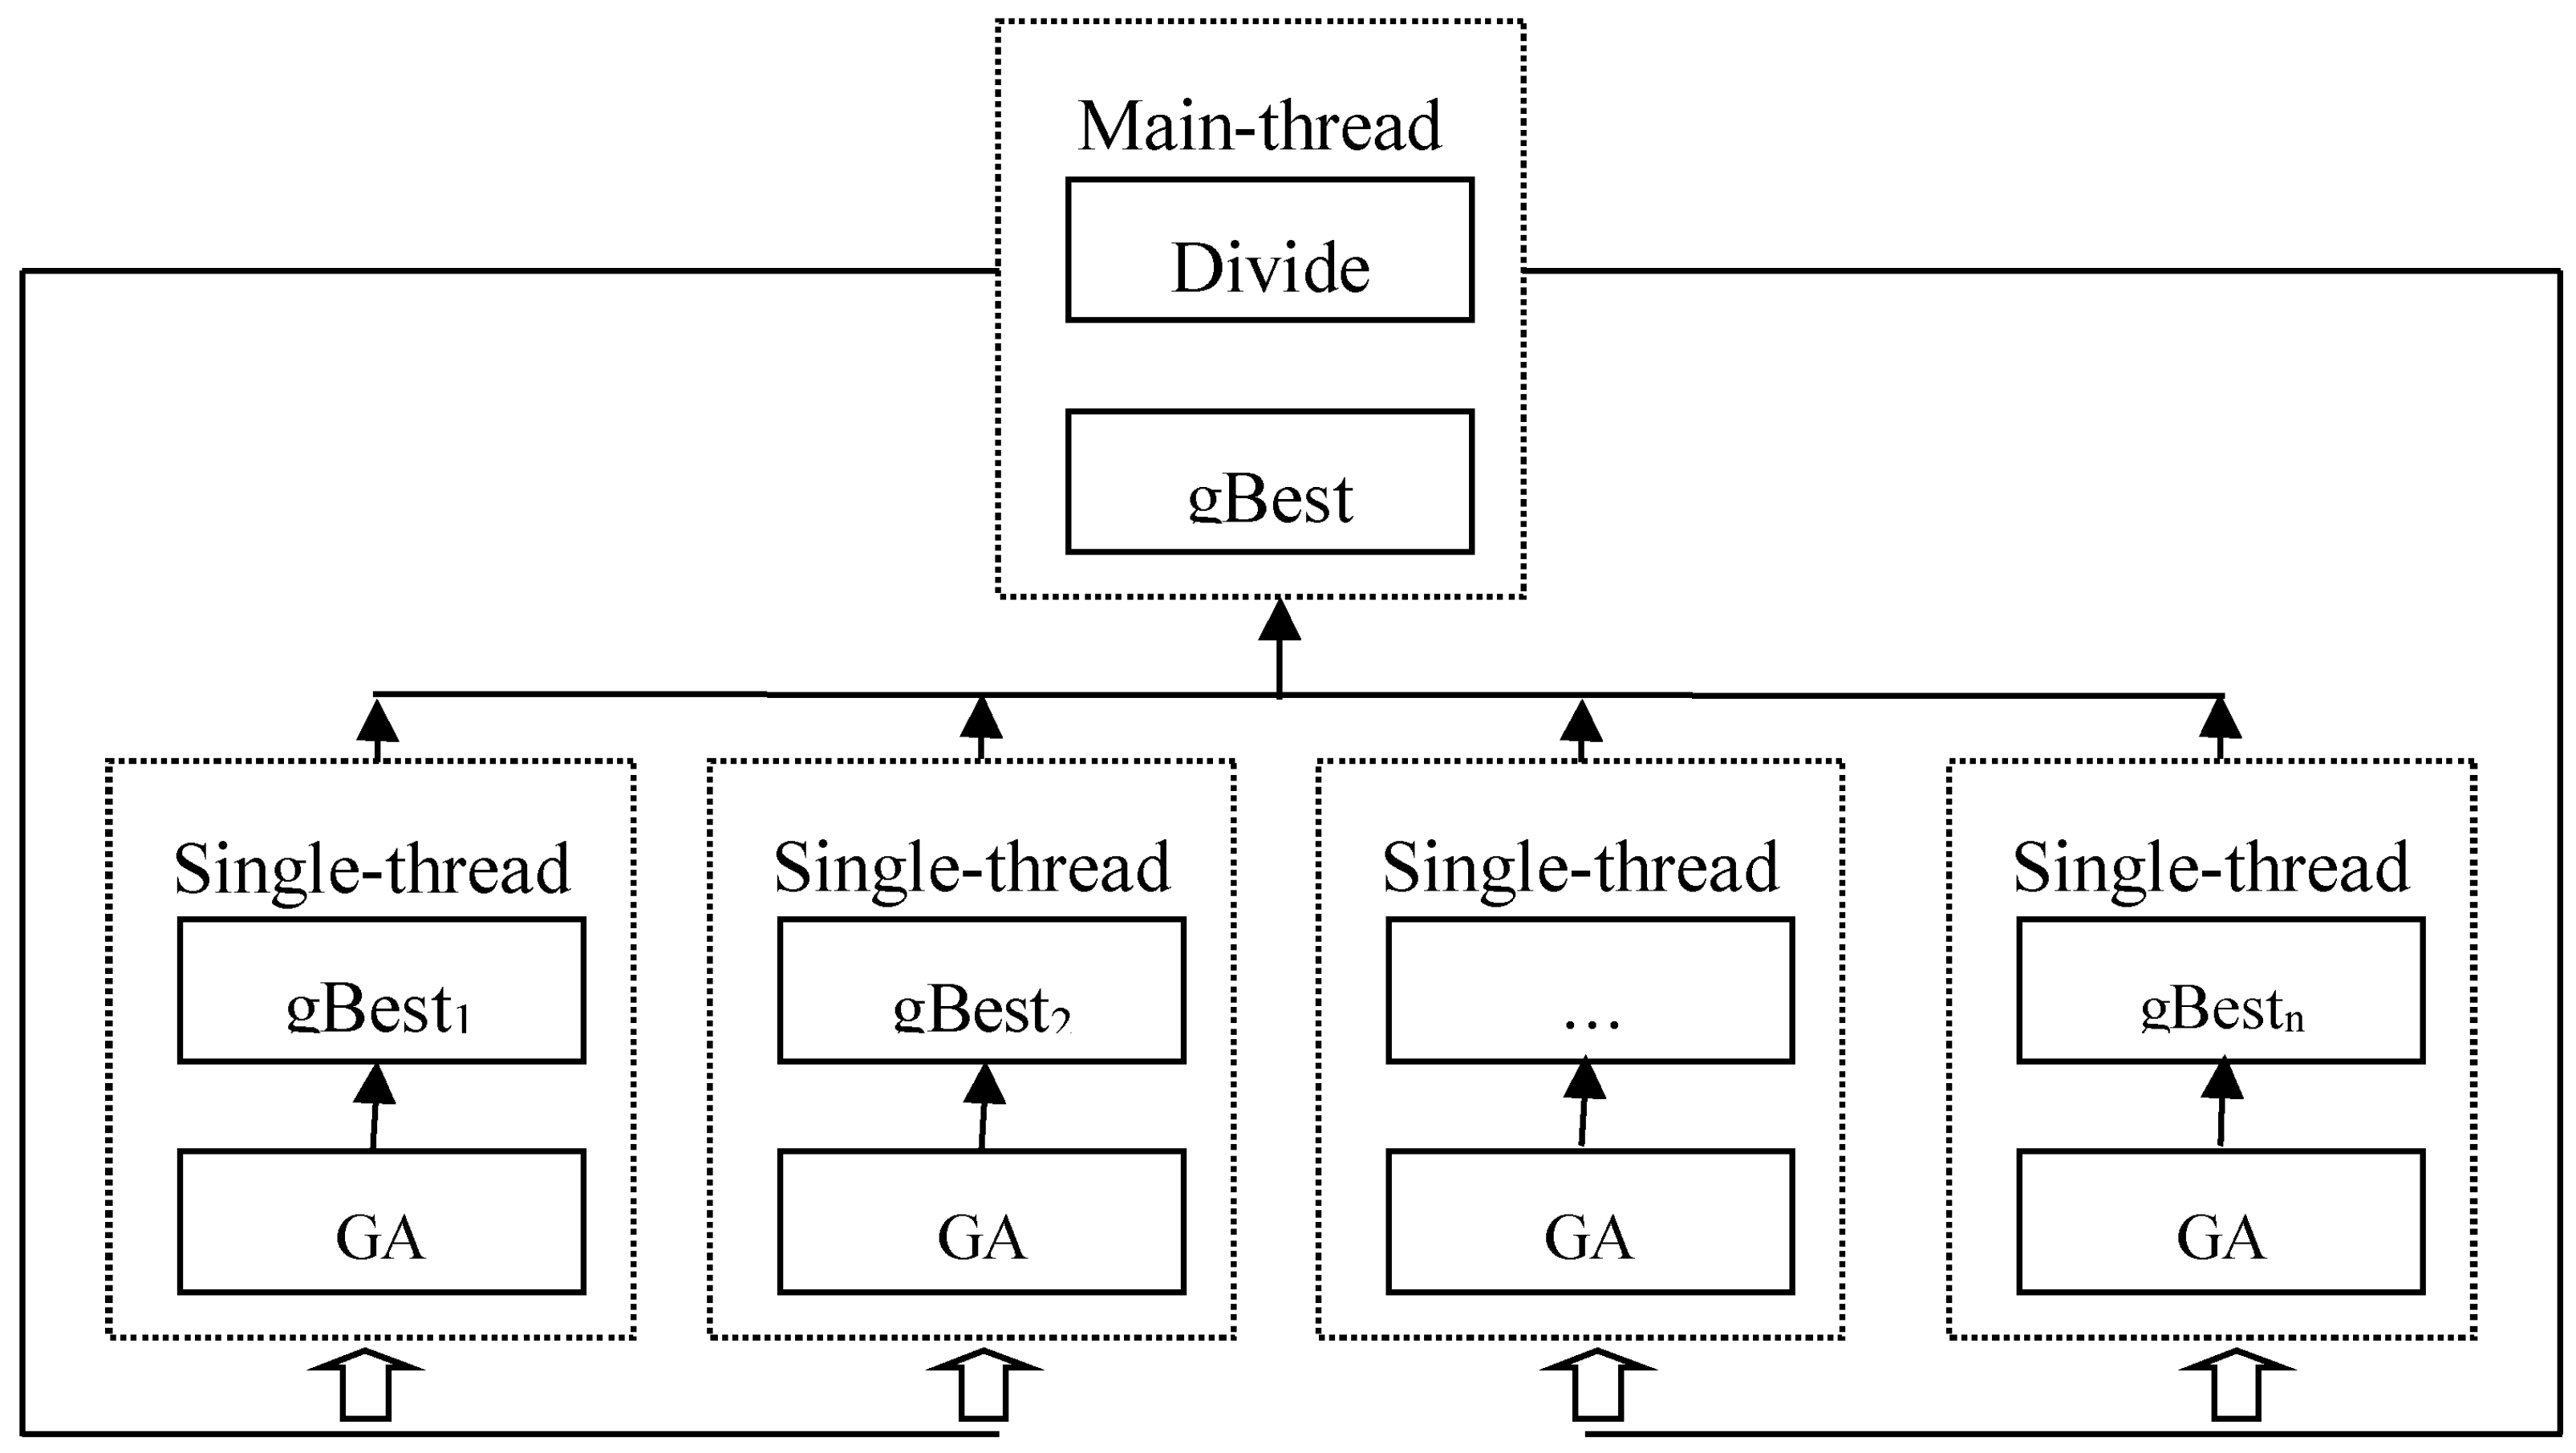
The DCR model is an extension of the NP-hard problem related to VRP and PDP; the exact algorithm could not be solved for a large-scale instance within an acceptable time. Thus, a GA-based heuristic approach is further developed to efficiently yield acceptable solutions [33,34]. According to the characteristics of the problem, all passengers can be divided into several groups using Equation (14), when they place their personalized travel orders. In this case, the passengers in each group choose the same subway schedule at the rail station , and the design process of the feeder bus routes servicing passengers in each group, i.e., the three core variables , , and , do not affect each other. In order to solve the large-scale problem [35,36], this paper designs a distributed parallel genetic algorithm, shown in Figure 3. Based on the main working thread dividing the problem into sub-problems and providing the data for the sub-problems, the single-population GA is run independently by single working threads to calculate , , and of (gBesti), and the optimal solution to the original problem is found by the main working thread in order to summarize the calculation results of the single-population GA, executed concurrently with multiple working threads.
4.1. Coding of GA Chromosomes
An efficient coding structure of chromosomes to the solution plays a key role in the process of GA searching. In our study, the main body of the proposed model is composed of designing routes and schedules that correspond to () and (), respectively. Therefore, if we use a two-dimensional vector to represent solutions to this model, it could be further decomposed into three parts, and explained as follows:
- (1)
- The first part of the GA chromosome, (the vector of integer variables) is used to represent the decision of the feeder bus route. The element () is the number of the demand point, and the element () is the number of the vehicle, i.e., .
- (2)
- The second part of the GA chromosome, (the vector of real variables) is used to represent the decision of schedule of the feeder bus. The element denotes the departure time of feeder bus k leaving the bus depot.
4.2. Fitness Evaluation
The objective function is used to evaluate the fitness of the candidate solutions. Note that the candidate solutions satisfy constraints described by Equations (2)–(7) and may violate constraints described by Equations (9), (11)–(14). To deal with this problem, we include those constraints as penalty terms into the function of the fitness evaluation. In this case, poor solutions will be abandoned and good solutions have more opportunities to be selected into the next generation in the genetic operations of the GA. Thus, the modified fitness function in our study is given by:
4.3. A Heuristic Algorithm of Generating the Initial Population
Many complicated factors influencing the DRT model results in difficulty in randomly generating a feasible solution to this problem. The quality of the solution found depends highly on the selection of the initial population, thus it is important to design a heuristic algorithm to generate the initial population. As mentioned above, and determine , and the objective function leads to the generation of a viable individual to arrange vehicles to visit a series of feasible adjacent notes () until all the nodes are traversed. The procedures are explained as follows:
- Step 1.
- For , if , find all pairs of feasible adjacent nodes, i.e., .
- Step 2.
- Let denote the set of feeder buses, and each vehicle is randomly and initially placed at the nodes .
- Step 3.
- For each vehicle , find the next feasible nodes in , according to the constraints described by Equations (11)–(13),and randomly select a pair . Let and , and continue to step 4.
- Step 4.
- If , turn to the step 2; otherwise, the algorithm is terminated to output the result.
4.4. Genetic Operators
Selection, crossover, and mutation are three basic operations of GA. The selection operation selects the good individuals from the current parent population to breed the next generation, a combination of the roulette and the elite retention strategy is generally adopted. The crossover operation exchanges some genes of parental chromosomes to generate diversified individuals. The mutation operations can avoid some loss of genetic information due to the selection and crossover operation and maintain the diversity of the populations.
In order to avoid the crossover and mutation operation, destroying the feasible spatial structure of the chromosomes, we do not directly manipulate the chromosomes and decode them into vehicle paths. After randomly choosing one of the possible adjacent node pairs, we exchange part of the vehicle path genes of the parental chromosome, remove duplicates, and replenish missing genes. By following the constraints of Equations (11)–(13) these operations would generate a new chromosome. Obviously, the crossover and mutation operators in this paper will not destroy the feasible chromosomes.
4.5. Stopping Criteria
A preset maximal number of generations are reached; or, the difference between the minimum evaluation values between two adjacent generations is less than a threshold.
5. Numerical Example
5.1. Example Description
The model is applied to a real-world case that aims to design a feeder bus system for Nanjing City in China. The geographical space distribution of six bus depots (D1–D6), fifteen demand points (C1–C15) and one rail station(M), which are separately denoted as blue balloons, yellow balloons, and the purple balloon, as shown in Figure 4. The travel distance and time matrix are generated from the Open GIS tool. Using the demand collected from cell phone data exploration, the number of passengers, their preferred boarding time windows, and the subway schedule chosen in the demand points are shown in Table 2. Key input parameters of our model used in the case study are listed as follows:
- Number of bus routes: 3;
- Route capacity: Q = 10 people;
- Maximum and minimum length of the vehicle route: = 3 km and = 25 km;
- Maximum travel time of the feeder bus route: = 25 min;
- Walking time for passengers from the drop-off point of the rail station to the subway platform: Tw = 3 km; and
- The parameters of the hybrid algorithm: the number of maximum iterations = 500, the number of chromosomes = 40, the crossover rate = 0.7, and the mutation rate = 0.1.
5.2. Results
Table 3 and Figure 5 show the routing and scheduling plan of the feeder buses. They travel a total distance of 5 km, 4.4 km, and 4.5 km, and their total travel times are 19.9 min, 17.8 min, and 17.5 min, respectively. Taking route 1 as an example, an empty vehicle leaves depot D1 at 6:09. The vehicle firstly arrives at C3 to pick up one passenger at 6:12; then, this vehicle visits C12, at which three passengers are loaded at 6:16; then this vehicle visits C9, C11, and C14, where one passenger, two passengers, and three passengers at 6:18, 6:23, and 6:26 are loaded, respectively; finally, this vehicle visits M to deliver all passengers at 6:29. All passengers would spend 3 min walking from the drop-off point of the rail station to the subway platform. Since they chose a subway schedule at about 6:36, all of them will wait for the train at the subway platform from 6:32 to 6:36. In this case, the time of the vehicle visiting each demand point is shown in Table 4. It can be seen from Table 2, Table 3 and Table 4 that the total ride-times and wait-times of the three routes have been obtained.
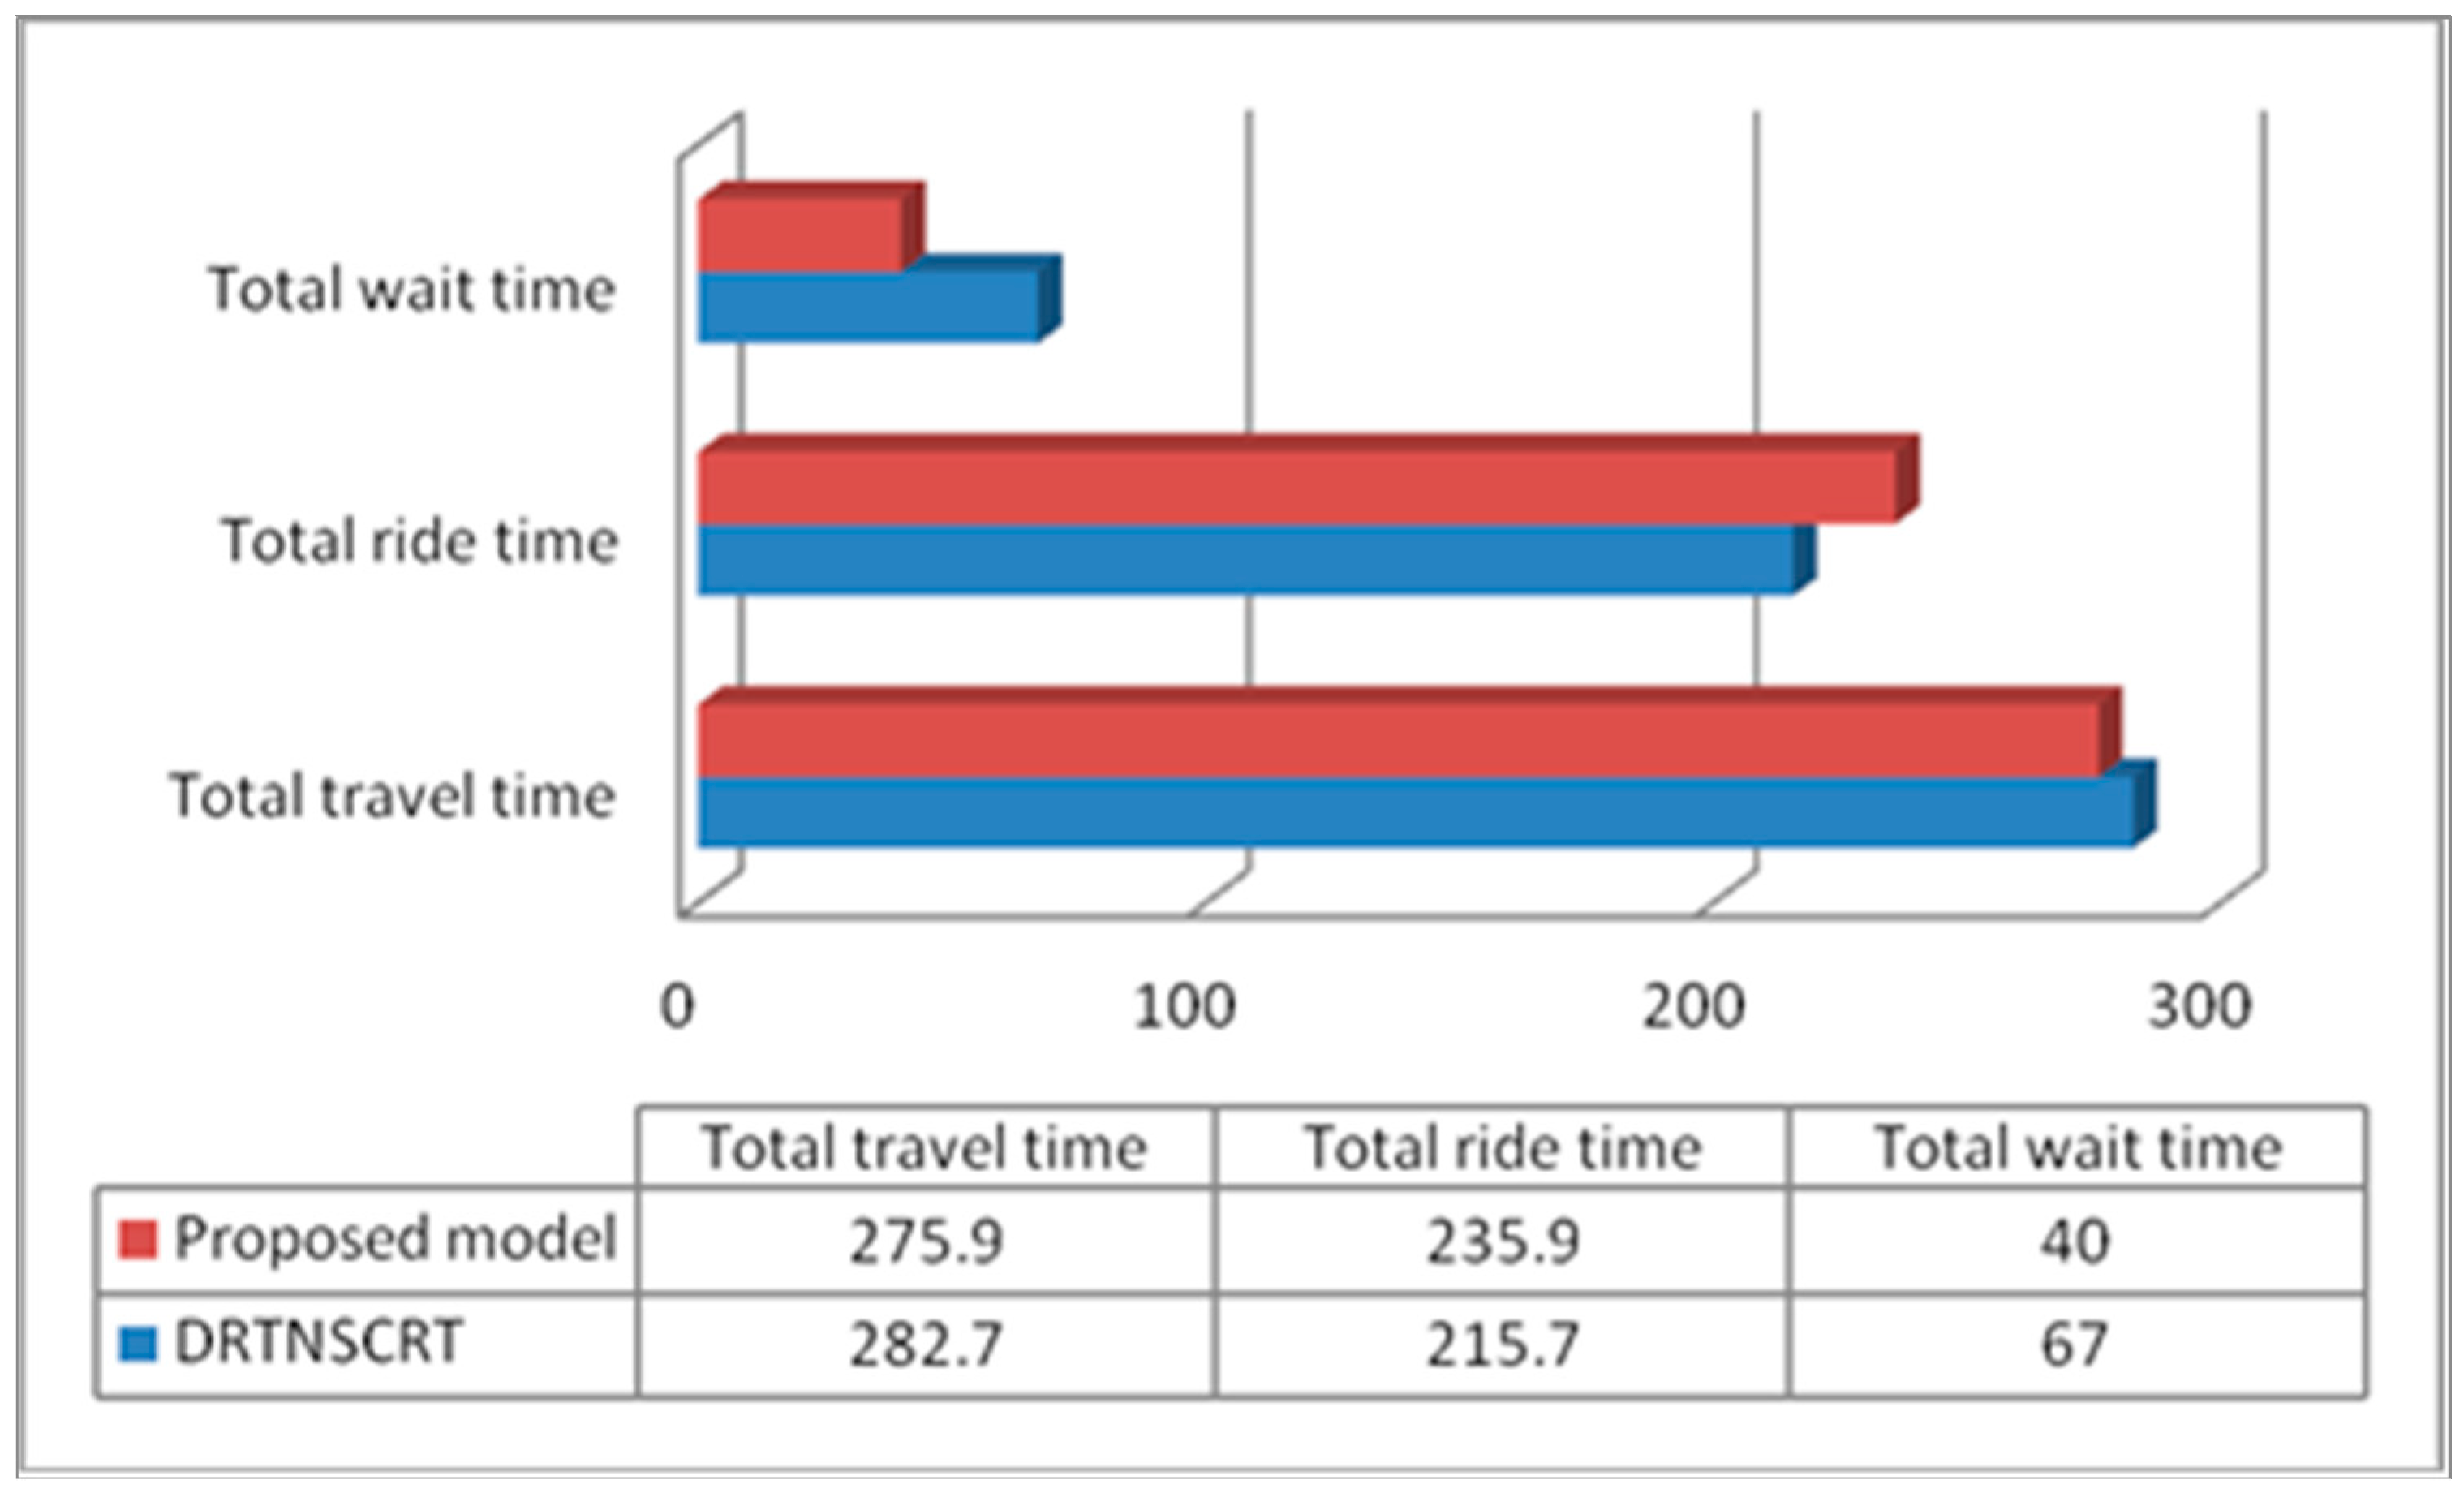
Furthermore, our DRT model has unique features compared to the traditional ones. Figure 6 reveals the difference between our model and the traditional one with no synchronous coordination of rail transit (DRTNSCRT). Compared with DRTNSCRT, the total ride-time of this DRT model is significantly increased by 9.36%, but the total wait-time is significantly reduced by 67.5%, which results in the total travel time of proposed model being reduced by 2.46%. The reason is that the strong constraint (Equation (14)) that takes the synchronous coordination of rail transit into account may result in the vehicle spending more ride-time visiting all demand points, but passengers are saved from waiting at the rail station for their subway schedules. Therefore, it is very important to design feeder bus routing with the synchronous coordination of rail transit in practical applications.
5.3. Sensitivity Analysis
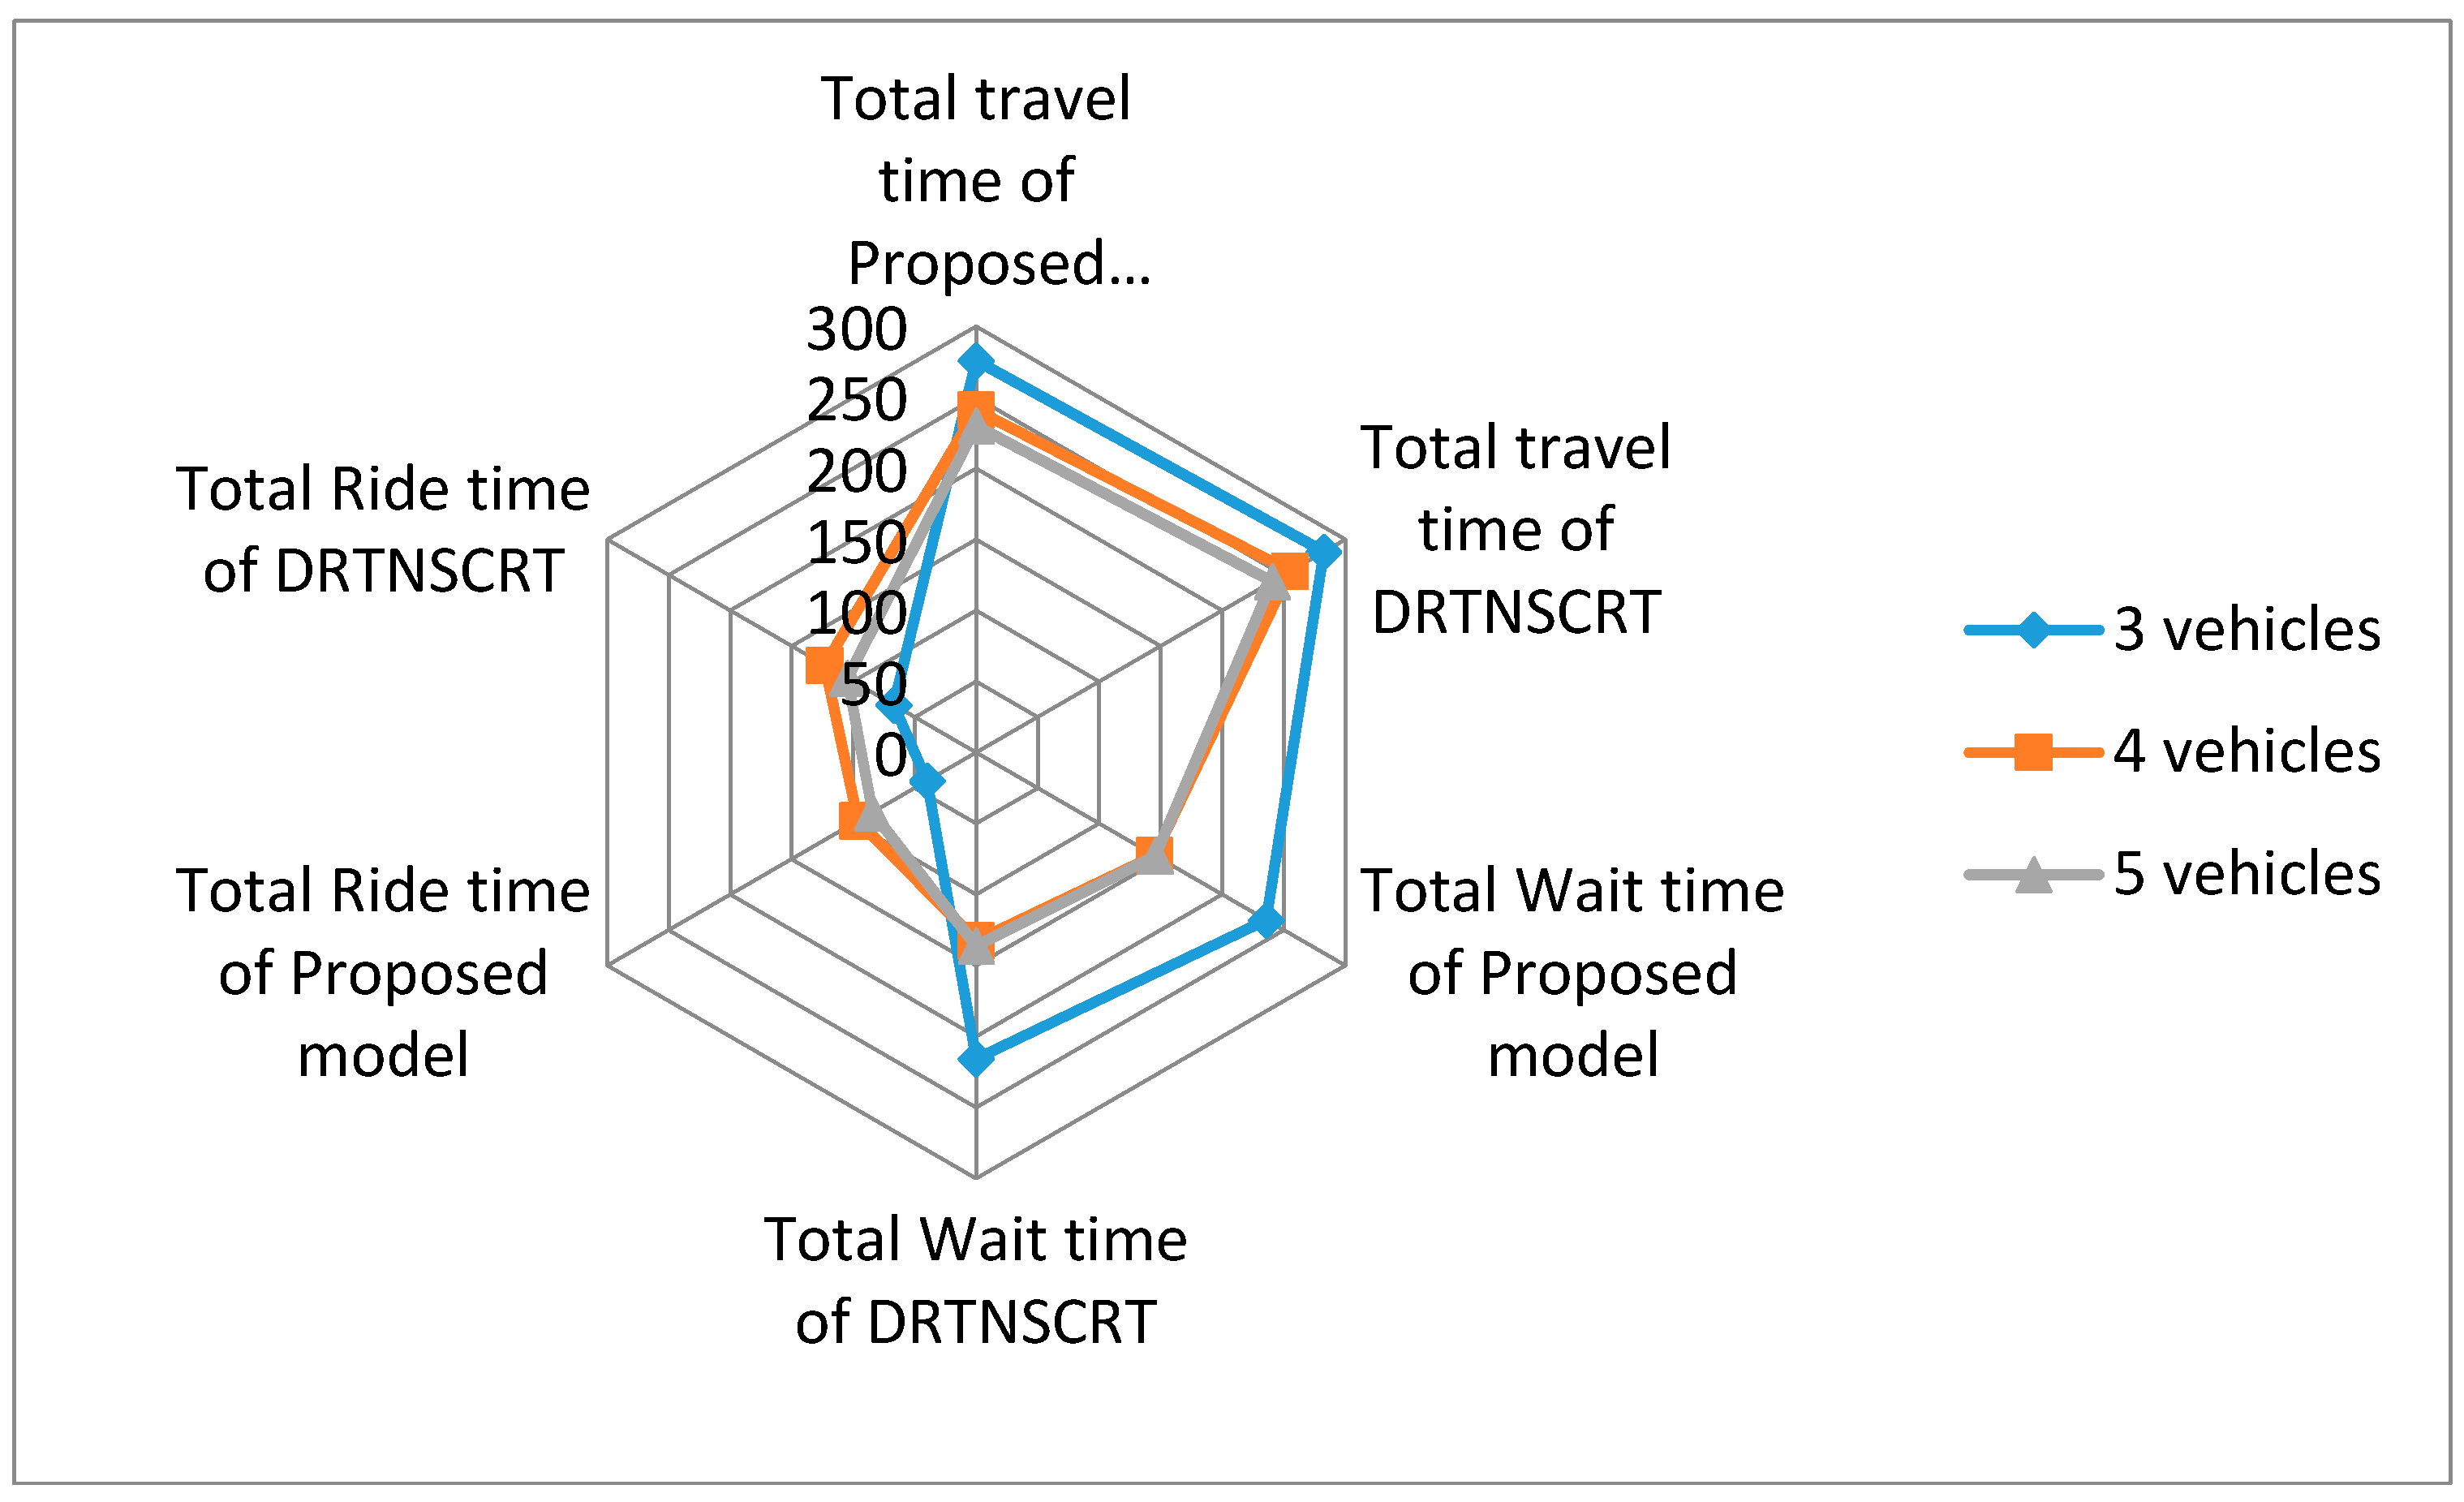
The comparison of the model’s performance for different numbers of feeder buses is shown in Table 5. As the number increases, vehicles starting at the depot and ending at the rail station result in the number of demand points covered by each vehicle being reduced, but there is an increase of invalid travel distance and time. However, the ride time for the vehicles from the demand points to the rail station is reduced. This also reveals that the proposed algorithm is efficient and feasible in solving the speed and solution quality. In the case of the three scenarios of three, four, and five vehicles, the calculation time of the proposed algorithm is 5.6 times, 28.6 times, and 326.2 times more than that of Cplex, respectively. In Figure 7, we also analyse the differences between the proposed model and the DRTNSCRT models under three scenarios of three, four, and five vehicles. The results are consistent with the results of Figure 6; i.e., the total travel time of the proposed model is better than that of the DRTNSCRT models.
Additionally, the comparison of the improved GA and the standard GA is shown in Table 6. The improved GA is better than the standard GA in solving the quality problem. As the test scale increases, the differences between the algorithms also gradually show upward trends of 3.7%, 6.4%, and 11.3%, respectively. This is because each sub-problem has fewer chromosome genes, in which the crossover and the mutation are operated more efficiently, and it is easier to jump out of the local optimum when the problem is divided into several sub-problems. Similarly, since each sub-problem operates independently, the more sub-problems there are, the faster the solution converges.
6. Conclusions
The main contribution of this paper is to create a novel optimization methodology for DRTs with personalized travel and the synchronous coordination of rail transit, to reveal the relation between the ride-time for vehicles from the pickup locations to the rail station, and the wait-time for passengers taking the subway beforehand. In contrast to existing studies, the proposed methodology reflects: (1) an integration process for designing the DRT routing and schedule, considering synchronous transfer between the shuttle and feeder bus; and (2) a distributed GA developed to efficiently resolve the proposed mode. Results show that the total ride-time of the proposed model is significantly increased by 9.36%, but the total wait-time is significantly reduced by 67.5%, which results in the total travel time of our model being reduced by 2.46% compared to the traditional DRT model. Additionally, the difference in optimal solutions between the proposed GA, standard GA, and the use of Cplex is about 5–7%, but the calculation speed is proved acceptable, which proves the validity of the algorithm.
Note that this research is based on key hypotheses of pedestrian boarding places (demand points) being bus stops and the stable OD table. It neglects the integrated assignment of demand points to selected stops, and the dynamic setting with time-varying traffic conditions. Therefore, this model is very useful at the stage of strategic demand-responsive transit service for vehicles visiting demand points directly. However, the model can not deal with demand points located at one way streets or left-turn only intersections in real traffic network. Extending the model to simultaneously select optimal stops in candidates with assignments of pedestrians to these selected stops with time-varying OD is a worthwhile further work.
Author Contributions
B.S. and M.W. conceived and designed the experiments; C.Y. performed the experiments; H.W. and Z.X. analyzed the data; M.W. contributed reagents/materials/analysis tools; B.S. wrote the paper.
Funding
This paper is funded by Jiangsu Provincial Government Scholarship Program; the National Natural Science Foundation of China (61503201); Natural Science Foundation of the Jiangsu Province in China (BK20161280); the Humanities and Social Sciences Foundation of the Ministry of Education in China (16YJCZH086); Natural Science Foundation of the Jiangsu High Education (17KJB520029); Nantong Science and Technology Innovation Program (GY12016020,GY12016019); the Science and Technology Key Research and Development Project of Huai’an City (HAS2015015); the Open Fund for the Key Laboratory for Traffic and Transportation Security of Jiangsu Province(TTS2016-01); Nantong University-Nantong Joint Research Centre for Intelligent Information Technology (KFKT2017B08); and the Project of Excellent Graduate Innovation in Hebei Province (2016348).
Conflicts of Interest
The authors declared that they have no conflicts of interest to this work.
References
- Ceder, A. Stepwise multi-criteria and multi-strategy design of public transit shuttles. J. Multi-Criteria Decis. Anal. 2009, 16, 21–38. [Google Scholar] [CrossRef]
- Fu, L.P.; Liu, Q.; Calamai, P.; Zhu, S.L. Real-time optimization model for dynamic scheduling of transit operations. Transp. Res. Rec. 2003, 1857, 48–54. [Google Scholar] [CrossRef]
- Savelsbergh, A.L.M. An extended demand responsive connector. EUROJ. Transp. Logist. 2017, 6, 25–50. [Google Scholar]
- Shen, J.X.; Yang, S.Q.; Gao, X.M.; Qiu, F. Vehicle routing and scheduling of demand-responsive connector with on-demand stations. Adv. Mech. Eng. 2017, 9, 1–10. [Google Scholar] [CrossRef]
- Maral, S.; Saeed, K.; Iraj, M.; Nezam, M.A. A partial delivery bi-objective vehicle routing model with time windows and customer satisfaction function. Mediterr. J. Soc. Sci. 2016, 7, 101–111. [Google Scholar]
- Azi, N.; Gendreau, M.; Potvin, J.Y. An exact algorithm for a single-vehicle routing problem with time windows and multiple routes. Eur. J. Oper. Res. 2007, 178, 755–766. [Google Scholar] [CrossRef]
- Laporte, G. Fifty years of vehicle routing. Transp. Sci. 2009, 43, 408–416. [Google Scholar] [CrossRef]
- Parragh, S.N.; Doerner, K.F.; Hartl, R.F. A survey on pickup and delivery problems. J. Betriebswirtsch. 2008, 58, 21–51. [Google Scholar] [CrossRef]
- Savelsbergh, M.W.P.; Sol, M. The general pickup and delivery problem. Transp. Sci. 1995, 29, 17–29. [Google Scholar] [CrossRef]
- Desaulniers, G.; Desrosiers, J.; Erdmann, A.; Solomon, M.M.; Soumis, F. VRP with pickup and delivery. In The Vehicle Routing Problem; Toth, P., Vigo, D., Eds.; SIAM Monographs on Discrete Mathematics and Applications: Philadelphia, PA, USA, 2002. [Google Scholar]
- Cordeau, J.F.; Laporte, G. The dial-a-ride problem: Models and algorithms. Ann. Oper. Res. 2007, 153, 29–46. [Google Scholar] [CrossRef]
- Cordeau, J.; Laporte, G.; Potvin, J.Y.; Savelsbergh, M. Chapter 7 transportation on demand. Handb. Oper. Res. Manag. Sci. 2007, 14, 429–466. [Google Scholar]
- Hurdle, V.F. Minimum cost locations for parallel public transit lines. Transp. Sci. 1973, 7, 340–350. [Google Scholar] [CrossRef]
- Kuan, S.N.; Ong, H.L.; Ng, K.M. Solving the Feeder Bus Network Design Problem by Genetic Algorithms and Ant Colony Optimization. Adv. Eng. Softw. 2006, 37, 351–359. [Google Scholar] [CrossRef]
- Wirasinghe, S.C. Nearly Optimal Parameters for a Rail/Feeder-bus System on a Rectangular Grid. Transp. Res. A 1980, 14, 33–40. [Google Scholar] [CrossRef]
- Kuah, G.K.; Perl, J. Optimization of Feeder Bus Routes and Bus-stop Spacing. J. Transp. Eng. 1988, 114, 341–354. [Google Scholar] [CrossRef]
- Kuah, G.K.; Perl, J. The Feeder-bus Network-design Problem. J. Oper. Res. Soc. 1989, 40, 751–767. [Google Scholar] [CrossRef]
- Chowdhury, S.M.; Chien, S.I.J. Intermodal transit system coordination. Transp. Plan. Technol. 2002, 25, 257–287. [Google Scholar] [CrossRef]
- Chang, Y.H.; Chang, B.W. Developing an Integrated Operational Plan between Metro Systems and Feeder-bus Services. J. Chin. Inst. Transp. 1997, 10, 41–72. [Google Scholar]
- Martins, L.C.; Pato, M.V. Search Strategies for the Feeder Bus Network Design Problem. Eur. J. Oper. Res. 1998, 106, 425–440. [Google Scholar] [CrossRef]
- Mohaymany, A.S.; Gholami, A. Multimodal Feeder Network Design Problem: Ant Colony Optimization Approach. J. Transp. Eng. 2010, 136, 323–331. [Google Scholar] [CrossRef]
- Shrivastava, P.; Dhingra, S.L. Development of Feeder Routes for Suburban Railway Stations Using Heuristic Approach. J. Transp. Eng. 2001, 127, 334–341. [Google Scholar] [CrossRef]
- Shrivastava, P.; O’Mahony, M. A Model for Development of Optimized Feeder Routes and Coordinated Schedules: A Genetic Algorithms Approach. Transp. Policy 2006, 13, 413–425. [Google Scholar] [CrossRef]
- Shrivastava, P.; O’Mahony, M. Design of Feeder Route Network Using Combined Genetic Algorithm and Specialized Repair Heuristic. J. Public Transp. 2007, 10, 109–133. [Google Scholar] [CrossRef] [Green Version]
- Shrivastava, P.; O’Mahony, M. Use of Hybrid Algorithm for Modeling Coordinated Feeder Bus Route Network at Suburban Railway Station. J. Transp. Eng. 2009, 135, 1–8. [Google Scholar] [CrossRef]
- Chen, C.; Zhang, D.; Zhou, Z.H.; Li, N.; Atmaca, T.; Li, S. B-Planner: Night bus route planning using large-scale taxi GPS traces. In Proceedings of the 2013 IEEE International Conference on Pervasive Computing and Communications (PerCom), San Diego, CA, USA, 18–22 March 2013; pp. 225–233. [Google Scholar]
- Deng, L.B.; Gao, W.; Zhou, W.L.; Lai, T.Z. Optimal design of feeder-bus network related to urban rail line based on transfer system. Procedia-Soc. Behav. Sci. 2013, 96, 2383–2394. [Google Scholar] [CrossRef]
- Pan, S.; Yu, J.; Yang, X.; Liu, Y.; Zou, N. Designing a Flexible Feeder Transit System Serving Irregularly Shaped and Gated Communities: Determining Service Area and Feeder Route Planning. J. Urban Plan. Dev. 2014, 141, 0401–4028. [Google Scholar] [CrossRef]
- Yu, Y.; Machemehl, R.; Hakimi, S. Real-Time Optimization of Passenger Collection for Commuter Rail Systems; Technical report 600451-00082-1; Center of Transportation Research, University of Texas at Austin, National Technical Information Service: Springfield, VA, USA, 2014. [Google Scholar]
- Sun, Y.; Sun, X.; Li, B.; Gao, D. Joint optimization of a rail transit route and bus routes in a transit corridor. Procedia-Soc. Behav. Sci. 2013, 96, 1218–1226. [Google Scholar] [CrossRef]
- Yan, Y.; Liu, Z.; Meng, Q.; Jiang, Y. Robust optimization model of bus transit network design with stochastic travel time. J. Transp. Eng. 2013, 139, 625–634. [Google Scholar] [CrossRef]
- Sun, B.; Wei, M.; Zhu, S.L. Optimal Design of Demand-Responsive Feeder Transit Services with Passengers’ Multiple Time Windows and Satisfaction. Future Internet 2018, 10, 30–45. [Google Scholar] [CrossRef]
- Wei, M.; Sun, B.; Sun, R. Expected value model of bus gas station site layout problem with fuzzy demand in supplementary fuel using genetic algorithm. Clust. Comput. 2017, 1, 1–10. [Google Scholar] [CrossRef]
- Wei, M.; Sun, B. Bi-level programming model for multi-modal regional bus timetable and vehicle dispatch with stochastic travel time. Clust. Comput. 2017, 20, 1–11. [Google Scholar] [CrossRef]
- Nandy, A.; Chakraborty, D.; Shah, M.S. Optimal Sensors/Actuators Placement in Smart Structure Using Island Model Parallel Genetic Algorithm. Int. J. Comput. Methods 2017, 1, 184–187. [Google Scholar] [CrossRef]
- Yang, D.; Liu, Z.; Shu, T.; Yang, L.; Ouyang, J.; Shen, Z. An Improved Genetic Algorithm for Multiobjective Optimization of Helical Coil Electromagnetic Launchers. IEEE Trans. Plasma Sci. 2017, 99, 1–7. [Google Scholar] [CrossRef]
Figure 1.
Research framework.

Figure 2.
Graphical representation of the integrated DRT problem.

Figure 3.
The framework of the distributed genetic algorithm for solving large scale problems.

Figure 4.
Spatial distribution of bus depots, demand points. and rail stations (map resource: Google).
Figure 4.
Spatial distribution of bus depots, demand points. and rail stations (map resource: Google).

Figure 5.
The result of three feeder bus routes.

Figure 6.
Result comparison of the proposed model and traditional DRTs.

Figure 7.
Three-scenario comparison between the proposed and the DRTNSCRT models.


Table 1.
Parameters and variables in the mathematical model.
| Indices | |
| Node(demand point, bus depot and rail station) index | |
| Feeder bus index | |
| Subway schedule trip index | |
| Sets | |
| I | Set of demand points |
| K | Set of feeder buses |
| Set of bus depots | |
| Set of rail transit stations | |
| Set of subway schedule trips at rail station ; | |
| Parameters | |
| Number of passengers at the demand point ; | |
| The boarding time window of the demand point ; | |
| The subway schedule trip p of rail station m chosen by passengers at demand points ; , , | |
| Distance from the node i to node ; | |
| Travel time from the node i to node ; | |
| Depature time of subway schedule trip p at rail station m; , | |
| Walking time for passengers from the drop-off point of the rail station to the subway platform | |
| Maximum travel time of feeder bus route | |
| and | Maximum and minimum travel mileage of feeder bus |
| Q | Maximum capacity of feeder bus |
| A very large fixed value | |
| Decision Variables | |
| Whether the node i precedes the node on the vehicle k, or not; , | |
| Whether the node i is covered by the vehicle k, or not; , | |
| The time of vehicle k arriving the node ; | |
| Number of passengers at node assigned to vehicle k; | |
| An auxiliary (real) variable for sub-tour elimination constraint in vehicle k; | |
Table 2.
Basic information of demand points.
| Demand Point | qi (Person) | Time Window | Preferred Subway Schedule |
|---|---|---|---|
| C1 | 1 | 6:10–6:20 | 6:28 |
| C2 | 2 | 6:20–6:30 | 6:32 |
| C3 | 1 | 6:10–6:20 | 6:36 |
| C4 | 3 | 6:10–6:20 | 6:32 |
| C5 | 2 | 6:15–6:25 | 6:28 |
| C6 | 3 | 6:15–6:25 | 6:28 |
| C7 | 1 | 6:20–6:30 | 6:32 |
| C8 | 2 | 6:20–6:30 | 6:32 |
| C9 | 1 | 6:10–6:20 | 6:36 |
| C10 | 3 | 6:20–6:30 | 6:28 |
| C11 | 2 | 6:20–6:30 | 6:36 |
| C12 | 3 | 6:10–6:20 | 6:36 |
| C13 | 1 | 6:00–6:10 | 6:28 |
| C14 | 3 | 6:10–6:20 | 6:36 |
| C15 | 2 | 6:20–6:30 | 6:32 |
Table 3.
Routing and scheduling plan of each feeder bus.
| Vehicle | Sequence of Demand Points Visited by the Vehicle | Travel Distance (km) | Travel Time (min) | Number of Passengers | Wait-Time (min) |
|---|---|---|---|---|---|
| V1 | D1(6:09)-C3(6:12)-C12(6:16)-C9(6:18)-C11(6:23)-C14(6:26)-M(6:29) | 5.0 | 19.9 | 10 | 4 |
| V2 | D3(6:07)-C13(6:09)-C5(6:15)-C6(6:16)-C1(6:19)-C10(6:23)-M(6:25) | 4.4 | 17.8 | 10 | 0 |
| V3 | D5(6:11)-C15(6:14)-C4(6:19)-C2(6:21)-C7(6:24)-C8(6:26)-M(6:29) | 4.5 | 17.5 | 10 | 0 |
Table 4.
The time of the vehicle visiting the demand points.
| Demand Point | Boarding Time | Ride-Time | Wait-Time | Vehicle |
|---|---|---|---|---|
| C3 | 6:12 | 17 | 4 | V1 |
| C9 | 6:18 | 11 | 4 | |
| C11 | 6:23 | 6 | 4 | |
| C12 | 6:16 | 13 | 4 | |
| C14 | 6:26 | 3 | 4 | |
| C1 | 6:19 | 6 | 0 | V2 |
| C5 | 6:15 | 10 | 0 | |
| C6 | 6:16 | 9 | 0 | |
| C10 | 6:23 | 2 | 0 | |
| C13 | 6:09 | 16 | 0 | |
| C2 | 6:21 | 8 | 0 | V3 |
| C4 | 6:19 | 10 | 0 | |
| C7 | 6:24 | 5 | 0 | |
| C8 | 6:26 | 3 | 0 | |
| C15 | 6:14 | 15 | 1 |
Table 5.
Comparison of the models and algorithm performance among three scenarios.
| Scenario | Objective(min) | Average Caculate Time (min) | Total Ride Time (min) | Total Wait Time (min) | Total Route Mileages (km) | Total Route Times(min) | ||
|---|---|---|---|---|---|---|---|---|
| Cplex | Improved GA | Cplex | Improved GA | |||||
| 3 Vehicles | 275.9 | 295.2 | 20.1 | 3.6 | 235.9 | 40 | 13.9 | 55.2 |
| 4 Vehicles | 241.2 | 253.3 | 120.2 | 4.2 | 145.2 | 96 | 14.3 | 57.0 |
| 5 Vehicles | 230.0 | 246.1 | 1500.3 | 4.6 | 145.7 | 84.3 | 18.1 | 72.1 |
Table 6.
Comparison of different algorithms.
| Number of Demand Points | Improved GA | Standard GA | Difference | ||||||
|---|---|---|---|---|---|---|---|---|---|
| Iteration Times of Convergence | Best Solution | Worst Solution | Average Solution | Iteration Times of Convergence | Best Solution | Worst Solution | Average Solution | ||
| 50 | 67 | 416.1 | 438.7 | 423.3 | 112 | 416.1 | 449.2 | 438.9 | 3.7% |
| 100 | 87 | 785.2 | 868.2 | 827.6 | 197 | 792.7 | 902.6 | 880.6 | 6.4% |
| 200 | 104 | 1442.7 | 1566.4 | 1506.5 | 345 | 1472.3 | 1728.6 | 1676.7 | 11.3% |
© 2018 by the authors. Licensee MDPI, Basel, Switzerland. This article is an open access article distributed under the terms and conditions of the Creative Commons Attribution (CC BY) license (http://creativecommons.org/licenses/by/4.0/).
Share and Cite
MDPI and ACS Style
Sun, B.; Wei, M.; Yang, C.; Xu, Z.; Wang, H. Personalised and Coordinated Demand-Responsive Feeder Transit Service Design: A Genetic Algorithms Approach. Future Internet 2018, 10, 61. https://doi.org/10.3390/fi10070061
AMA Style
Sun B, Wei M, Yang C, Xu Z, Wang H. Personalised and Coordinated Demand-Responsive Feeder Transit Service Design: A Genetic Algorithms Approach. Future Internet. 2018; 10(7):61. https://doi.org/10.3390/fi10070061
Chicago/Turabian StyleSun, Bo, Ming Wei, Chunfeng Yang, Zhihuo Xu, and Han Wang. 2018. "Personalised and Coordinated Demand-Responsive Feeder Transit Service Design: A Genetic Algorithms Approach" Future Internet 10, no. 7: 61. https://doi.org/10.3390/fi10070061
Note that from the first issue of 2016, this journal uses article numbers instead of page numbers. See further details here.