EV Aggregators and Energy Storage Units Scheduling into Ancillary Services Markets: The Concept and Recommended Practice

1
Department of Electrical Engineering, King Fahd University of Petroleum & Minerals, Dhahran 31261, Saudi Arabia
2
Department of Energy Engineering, An-Najah National University, Nablus 97300, Palestine
*
Author to whom correspondence should be addressed.
World Electr. Veh. J. 2020, 11(1), 8; https://doi.org/10.3390/wevj11010008
Submission received: 6 November 2019
/
Revised: 17 December 2019
/
Accepted: 19 December 2019
/
Published: 27 December 2019
Abstract
:In this paper, optimization of Electric Vehicle (EV) batteries and dedicated energy storage unit charging profiles were conducted for the sake of bidding into day-ahead ancillary service markets. The aim of the optimization is to provide the maximum operational profits for both the EV aggregator and dedicated energy storage unit administrator. Ancillary service algorithms were then introduced to simulate the response of the EV batteries and dedicated energy storage units. Results showed that the usage of dedicated energy storage units for bidding into the ancillary services markets is more profitable than the case of operating an EV aggregator.
1. Introduction
Electric vehicles (EVs) have received wide attention in recent years due to the huge contribution of conventional vehicles to carbon dioxide emitted worldwide [1]. In addition, EVs are considered cost effective and environmentally-friendly. One type of EV recently available on the market is plug-in hybrid electric vehicles (PHEV) [2]. However, EVs have some disadvantages like the high capital cost compared to cars with an internal combustion engine (ICE) [3] and the potential impact on the electrical grid. The latter is caused by the unregulated charging of EVs in the grid [4]. The integration of PHEV into future grid architecture will most likely occur through the so-called vehicle-to-grid (V2G) system [3,4,5]. With this architecture, electric vehicles can be treated as energy storage units, which can be beneficial for the grid and EV owners [6]. The charging approaches of V2G can be unidirectional where EVs are treated as controlled loads, which gives the grid operators more flexibility in postponing the charging process to off-peak periods [7,8]. Meanwhile, the charging process of EVs can be also bidirectional, which allows the EVs to charge and discharge their batteries and supply the grid with power [7,8].
In general, the participation of EVs into the electricity market is usually done through an aggregator, who acts as an intermediary between a considerable number of EVs and the electricity market [9,10,11]. This practice decreases the uncertainty of the available power and gives more flexibility for EV owners who participate in the electricity market to opt out during their commitment toward the market [12]. Thus, an optimization should be undertaken for the EV market. The aim of the optimization is to optimally select the charging strategies and bidding in the electricity markets. This leads to achieving the maximum profit by the aggregator. Many studies have been conducted to find the most suitable bidding strategies for an aggregator into the electricity market. In [13,14], unidirectional V2G bidding regulation and responsive reserves were investigated. This work was extended in [15] for bidirectional V2G. The degradation cost of batteries that results from the discharging process was taken into account. The results showed that all participants benefited from the suggested strategy. In addition, in [16], a model of a plugin electric vehicle (PEV) aggregation was developed for use in the electricity market. The proposed model considers the uncertainties of the handled data such as driver behavior, electricity prices, and the activated quantity of reserve by the system operator. In [17], the bidding strategy problem was analyzed for an electric vehicle aggregator. A stochastic model was also proposed here to consider the uncertainty of the electricity market data. In [18], the authors formulated a stochastic model for day-ahead energy resource scheduling integrated with the dynamic electricity pricing for EVs to address the challenges brought by the demand and renewable sources uncertainty. Meanwhile, in [19], the problem of the optimal scheduling problem of plug-in electric vehicle aggregators in the electricity market considering the uncertainties of market prices, availability of vehicles, and status of being called by the Independent system operator (ISO) in the reserve market was reviewed. The impact of the market price and reserve market uncertainties on the electric vehicle scheduling problem was characterized through a stochastic programming framework. Similar research was presented in [20,21,22,23], where the main aim of the authors was to develop an EV aggregator model that first handled the uncertainty of the input data and then optimized the participation process in the electricity market to maximize the profit yielded. In [24], techniques that incentivize self-interested EV aggregators to report their energy requirements truthfully to a third-party coordinator were proposed where the proposal was assumed to be able to employ a day-ahead bidding algorithm to optimize the global bids on their behalf, extending the benefits of smart bidding to groups of competing EV aggregators. In [25], a market-based participation of ESS to support large-scale RE penetration for the procurement of energy and Ancillary Services (AS) using a virtual power plant (VPP) in a deregulated environment was proposed. On the other hand, artificial intelligence was utilized in other research [26,27,28]. These methods used optimization algorithms to solve the problem with specific objective functions.
However, another possible option for using EV aggregation to provide ancillary services is to use a dedicated energy storage unit instead of the methodologies proposed in the above-mentioned research. This option would reduce the sources of uncertainty in the problem and also relax the optimization constraints, but it also raises other operational and planning concerns that should be studied. These two options need to be investigated both from operational and planning aspects in order to find the most profitable option. In this work, we mainly focus on the operational aspects of this interesting case study since it will the corner stone for a wider study that takes both operational and planning aspects into account. Thus, in this paper, we mainly aimed to find the optimal scheduling for an aggregation of EVs into the day-ahead ancillary services market with the objective of maximizing the operational profits. The same optimization algorithm was then used to find the optimal scheduling for dedicated energy storage in order to find the most profitable option while only taking the operational aspects into account. Both options were assumed to have the same power and energy capacities to ensure the fairness of the operational comparison between them. The operational nature of both options was taken into account while writing the objective functions and their constraints for each case. The day-ahead optimization algorithm uses forecasted hourly prices and deployment signals and by finding the day-ahead optimal charging profiles for each case, the hourly expected power draw and state of charge (SOC) for each EV battery for the EV aggregator option and for the dedicated energy storage unit can be found. The daily expected profits for each option can be found based on the optimization results as well. The optimization results for each day are then used as inputs for ancillary service algorithms that aim to simulate the response of the EVs’ batteries and dedicated energy storage unit to 5-min dispatch signals so they start to provide regulation and responsive reserve services while following the charging schedules that are provided by the day-ahead optimization. The ancillary services algorithms calculate the actual power draw for each battery (whether it is an EV battery or dedicated storage unit) after providing the regulation and responsive reserve services, and the resulting actual power draw is then used to calculate the actual state of charge (SOC) for each of the received dispatched signals. The ancillary services algorithms then calculate the actual operational profits for each option based on the actual power draw of all EVs for the case of the EV aggregator and the actual power draw of the dedicated energy storage unit and also based on the actual prices of energy and ancillary services. The optimal charging schedules, regulation up, regulation down, and responsive reserve capacities for the EV aggregator and energy storage units were compared and analyzed for a test day to ensure that the results are logical and follow the optimization algorithm constraints for each option. The expected and actual power draws for each option were also analyzed for the same test day. The expected and actual profits for each option was then analyzed to determine which option was the most profitable while only taking the operational aspects into account. Finally, the EV charging costs for EV owners were calculated for the cases where these EV owners did not participate in the EV aggregation program and when they did participate in the EV aggregation program to be able to determine whether they would benefit financially or not from EV aggregators.
2. Problem Formulation
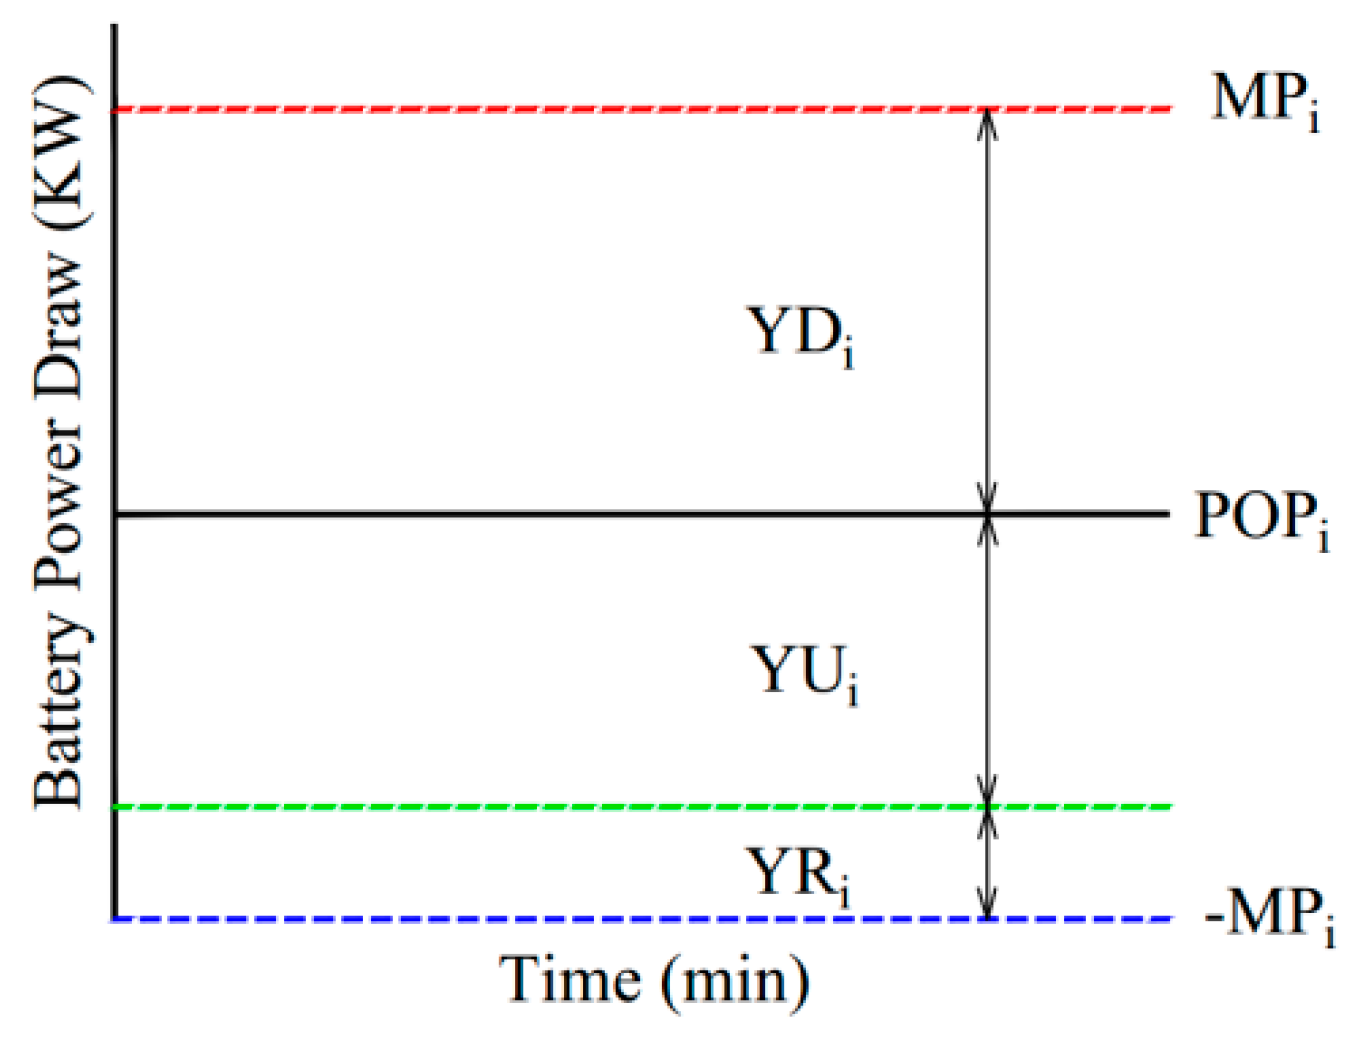
Any battery, “whether it is an EV battery or dedicated battery”, can perform regulation up, regulation down, and responsive reserve services by changing its scheduled charging rate, called the preferred operating point (POP). The POP of each battery is assigned by the EV aggregator administrator for the first option or by the dedicated batteries administrator for the second option; therefore the optimal POP should be scheduled for each hour. The capacities of each battery to perform regulation up (YUi), regulation down (YDi), and responsive reserve (YRi) services must also be optimally assigned. The relationship between the four operational parameters can be explained using Figure 1. From Figure 1, it is clear that the regulation up, regulation down, and responsive reserve capacities of the ith battery at hour t (YUi, YDi, and YRi) are governed by the POP for that hour and by the maximum charger power rate MP. The optimal assignment of these operational parameters for each battery at any hour makes the battery charging schedule and services bidding into the ancillary services markets optimal for the two options.
2.1. EV Aggregator’s Objective Function
The EV aggregator seeks maximum profits like any other investment. Therefore, the income and cost functions for the EV aggregator need to be formulated. For an EV aggregator, the expected income sources for any given day are the revenue from participating in the ancillary services markets (the regulation and responsive reserve markets), the revenue from selling energy to the EV owners in order to charge their EVs, and the revenue from selling energy back to the grid when discharging the EV fleet batteries. This can be expressed mathematically as
where PD, PU, and PR are the forecasted price of regulation down, regulation up, and responsive reserve, respectively. Meanwhile, RD, RY, and RR are the aggregator’s capacity of regulation down, regulation up, and responsive reserve. FP is a conservative estimation of the final power draw, while β is the energy tariff charged to the customer and E [.] is the expected value. Finally, P indicates the energy price. On the other hand, the second part of Equation (1) represents the aggregator’s revenue from selling energy to the EV owner. The third part of Equation (1) represents the revenue that resulted only when the energy was sold to the market by the aggregator.
The aggregator’s capacity of providing regulation up for an hour t is calculated as:
where YU is the minimum additional power draw (how much the charging rate can go below POP in order to perform regulation up service) for all EV fleet cars NEV at hour t. Similarly, RD and RR are defined as functions of YD and YR, respectively.
Since the EV aggregator optimizes the EV parameters in advance, the actual power draw of the EVs is not known. Thus, the expected power draw of each car is used instead. The expected power draw of any EV at hour t E[FPit] is a function of the decision variables POP, YD, YU, and YR of that EV at hour t. It is also a function of the expected regulation up, regulation down, and responsive reserve capacities that will be dispatched at that hour, as shown in Equation (3). The calculation of ExU, ExD, and ExR is discussed in [13].
The cost sources of the EV aggregator mainly come from buying the energy that is needed to charge the EV fleet from the energy market. The EV battery degradation cost that is needed to be paid to the EV owners is also considered as a source of cost here. The daily expected cost equation of the EV aggregator is given as follows:
The first part of the cost equation is the EV fleet charging cost that is paid by the aggregator to the energy market, which is the multiplication of the positive expected power draw of the ith EV E[FPit] at hour t (which indicates a charging process) by the forecasted energy price per kWh at hour t Pt. The second part of the cost equation represents the EV battery degradation cost that is needed to be paid to the EV owners whenever their EV battery is discharged back to the grid by the EV aggregator when dispatching regulation and/or responsive reserve services. The degradation cost is calculated by multiplying a more conservative estimate of the negative expected power draw of the ith EV (which, indicates a discharging process) at hour t E[NFPit] by the battery discharging cost per kWh (DCi). E[NFPit] is considered as a more conservative estimation of the power draw because it only depends on the regulation up and responsive reserve services, as seen in Equation (5).
The division by the efficiency is done to obtain the battery efficiency losses when discharging is taken into account. The battery discharging cost equation DCi for any EV is given as follows:
The first part represents the battery chemistry degradation cost, and the second part is included to prevent round trip efficiency abuse by the aggregator [12]. The third part of the cost equation is the cost of buying energy from EV owners when discharging their EVs to sell the energy to the market when dispatching regulation and/or responsive reserve services. This cost is calculated by multiplying the negative power draw of the ith EV E[FPit] at hour t by the fixed charging tariff β.
The lithium-ion battery discharge cost is 0.042 $/kWh when the battery replacement cost is 312 $/kWh, so for a certain battery replacement cost BatC, the battery chemistry degradation cost BatC is normalized by 312 and then multiplied by 0.042 [13]. The second term in Equation (6) is included to prevent round trip efficiency abuse by the aggregator. This abuse happens from the fact that first, the aggregator makes money from selling energy to the EVs. The second fact is that the battery is not 100% efficient. If the battery efficiency is assumed to be 90% and the aggregator is going to charge a certain EV with, say, 4 kWh, the meter will read 4 kWh, but the EV battery will only get 3.6 kWh. The owner is obliged to pay for the original 4 kWh so he loses 0.4 kWh. In the case of discharging, if the aggregator needs to discharge the EV in order to get 4 kWh, the EV battery needs to be discharged by an amount of 4.44 kWh so that the meter can read 4 kWh. The aggregator will pay for the meter reading, which means that the EV owner loses another 0.44 kWh, so the total loss is 0.84 kWh. Therefore, the aggregator can simply keep charging and discharging the EVs, which will allow an increment of its profits. The second term in Equation (6) has been added to remove the aggregator incentive of the continuous charging and discharging of the EVs.
It can be noted that parts of both the daily income and cost equations (Equations (1) and (4)) are conditioned by the EV battery charging and discharging status. In order to take these conditions into account, the daily income and cost equations can be rewritten as [13]:
Note that the availability coefficient Av is assigned for each EV at hour t in order to ensure that the EV is performing V2G services only when it is available. The possibility of the unexpected departure of EVs for each hour is taken into account by calculating the percentage of the remaining EVs to perform V2G for each hour (EVPert). EVPert is a function of the accumulated probability of the unexpected departure of all EVs at hour t, A_Depit, which, in turn, is a function of the time of scheduled trips for each EV during the day (Equations (9) and (10)). In Equation (10), A_Dep is reset at the scheduled morning trip time MTrip and scheduled evening trip time ETrip because it is assumed that the availability of each EV at these two time slots is known with certainty.
The battery degradation cost is introduced as an epigraph decision variable Deg in the new daily cost equation (Equation (8)) and constraints will be included into the optimization problem for the calculation of the optimal Deg for any EV at any hour [15].
2.2. Optimization of EV Aggregator’s Operation
The complete profit maximization formulation for the EV aggregator operation case is given below:
and is subject to 14 constrains (Equations (12)–(15) and (18)–(27).
Constraint (12) implies that the degradation cost of any EV should be positive. However, careful look at Constraint (13) illustrates that this can only happen if the power draw is negative, which means that the EV is discharging as follows:
Constraints (14) and (15) are used to ensure that the battery SOC of any EV will be within the acceptable limits based on the battery energy capacity and the customer-defined minimum SOC set for driving purposes. The SOC of each EV is calculated cumulatively hour after hour by using the EV expected power draws at that hour multiplied by the corresponding compensation factor of the EV at that hour. The resulting number is added to the amount of energy that is lost in charging and discharging the EV battery due to the battery efficiency ρ. Battery efficiency ρ is calculated by using Equation (16). The SOC of any EV at hour t is the sum of all the energy that is stored in the EV battery from hour 1 until hour t. This amount is added to the initial SOC of the EV battery at hour 1 and subtracted from the energy that is required for the EV scheduled trips, as illustrated in Equation (17).
where
Constraints (16)–(22) are related to the relationship between the battery power limit, MP, and the decision variables POP, YD, YU, and YR
Constraint (23) is used to make sure that the EV does not violate the charger power limit when performing V2G services.
Constraints (24) and (25) are related to the relationship between the energy limit of each EV and the battery decision variables. Setting this relationship is important because it will limit the aggregator’s ability to bid ancillary service capacities that cannot be supported from its battery’s energy
Constraints (26) and (27) are used to ensure that there is sufficient energy for any scheduled trip for an EV.
Finally the compensation factor, Comp (28) for each EV at each hour is needed to leave a safety margin in the EVs that will allow them to over dispatch in case of the unexpected departure of some of the EVs in the fleet at a given hour. In order to achieve that, the EV aggregator needs to under schedule the capacity during optimization so that there is room for over dispatching when needed in real time. This process is needed to compensate for the lost capacity due to the unexpected departure of some EVs in the fleet.
2.3. Optimization of Dedicated Energy Storage Unit’s Operation
The relationships of income and cost for the case of using dedicated energy storage units are simplified versions from those of the EV aggregator case. Equations (7) and (8) can be used, but the part of making income from charging the battery needs to be omitted, which implies that the only source of income will be from bidding into regulation and responsive reserve markets. Additionally, due to the fact that the dedicated storage units are always available, there is no need to include a factor that represents the remaining storage units to be used at each hour (i.e., Compi = 1 and EVPer = 1 for all t). Thus, the second part of Equation (6) needs to be omitted for the case of using energy storage units due to the fact that there is no profit making from charging the energy storage units. Thus, the expected daily income and cost equations become,
2.4. Optimization of the Energy Storage Units’ Operation
The complete profit maximization formulation for the energy storage units’ operation case is
Subject to the aforementioned constraints.
The differences in the constraints of the energy storage case compared to the EV aggregator case are very limited. One difference is that there is no need to include the energy of the planned trips in the SOC. The SOC of the storage unit does not have to be almost fully charged at the end of the scheduling hour of the operational day. In this work, the energy storage unit was chosen to be at least half-charged at the end of the operational day. The formulations can be used for single or multiple energy storage units.
3. Ancillary Services Algorithms
As above-mentioned, the optimization problems for the cases that the EV aggregator and energy storage units can solve are to find the optimal charging point POP, regulation up capacity YU, regulation down capacity YD, and responsive reserve capacity YR of each storage unit. The EV is a storage unit for each hour during an operational day. This optimization is carried out one day ahead. Therefore, forecasted data of ancillary services, power prices, and ancillary deployment signals are used as inputs for the optimization problem.
The resulted capacities of regulation and responsive reserve services for each hour of the coming day will be a bid to the market. If the bids are accepted, the EV aggregator/energy storage unit administrator must respond to the dispatch signals that are received from the market. The ancillary services for each battery are performed by changing its charging rate around POP [29]. The POP of any battery (EV battery or the dedicated battery) can be positive or negative and the battery can provide regulation up and responsive reserve services by reducing its charging or increasing its discharging. It can provide regulation down service by increasing its charging or reducing its discharging.
The dispatching signal is assumed to be received once every 5 min. Three algorithms are introduced in this section that must work in a sequential manner. These algorithms are designed to respond to any number of market signals per hour (the number of market signals per hour is res in the algorithms). The first two algorithms are used to update the actual final power draw of each battery after performing regulation and responsive reserve services and the final algorithm uses the resulting final power draw to update the actual state of charge of the battery after performing the services as a response for a certain market signal during the hour. In this case, the battery should perform the services 12 times in each hour (res = 12). The three algorithms simulate the real time calculation of the battery power draw and SOC according to the actual data, actual prices, and actual dispatch signals, and the battery parameters that are obtained from the optimization, and depend on the forecasted data.
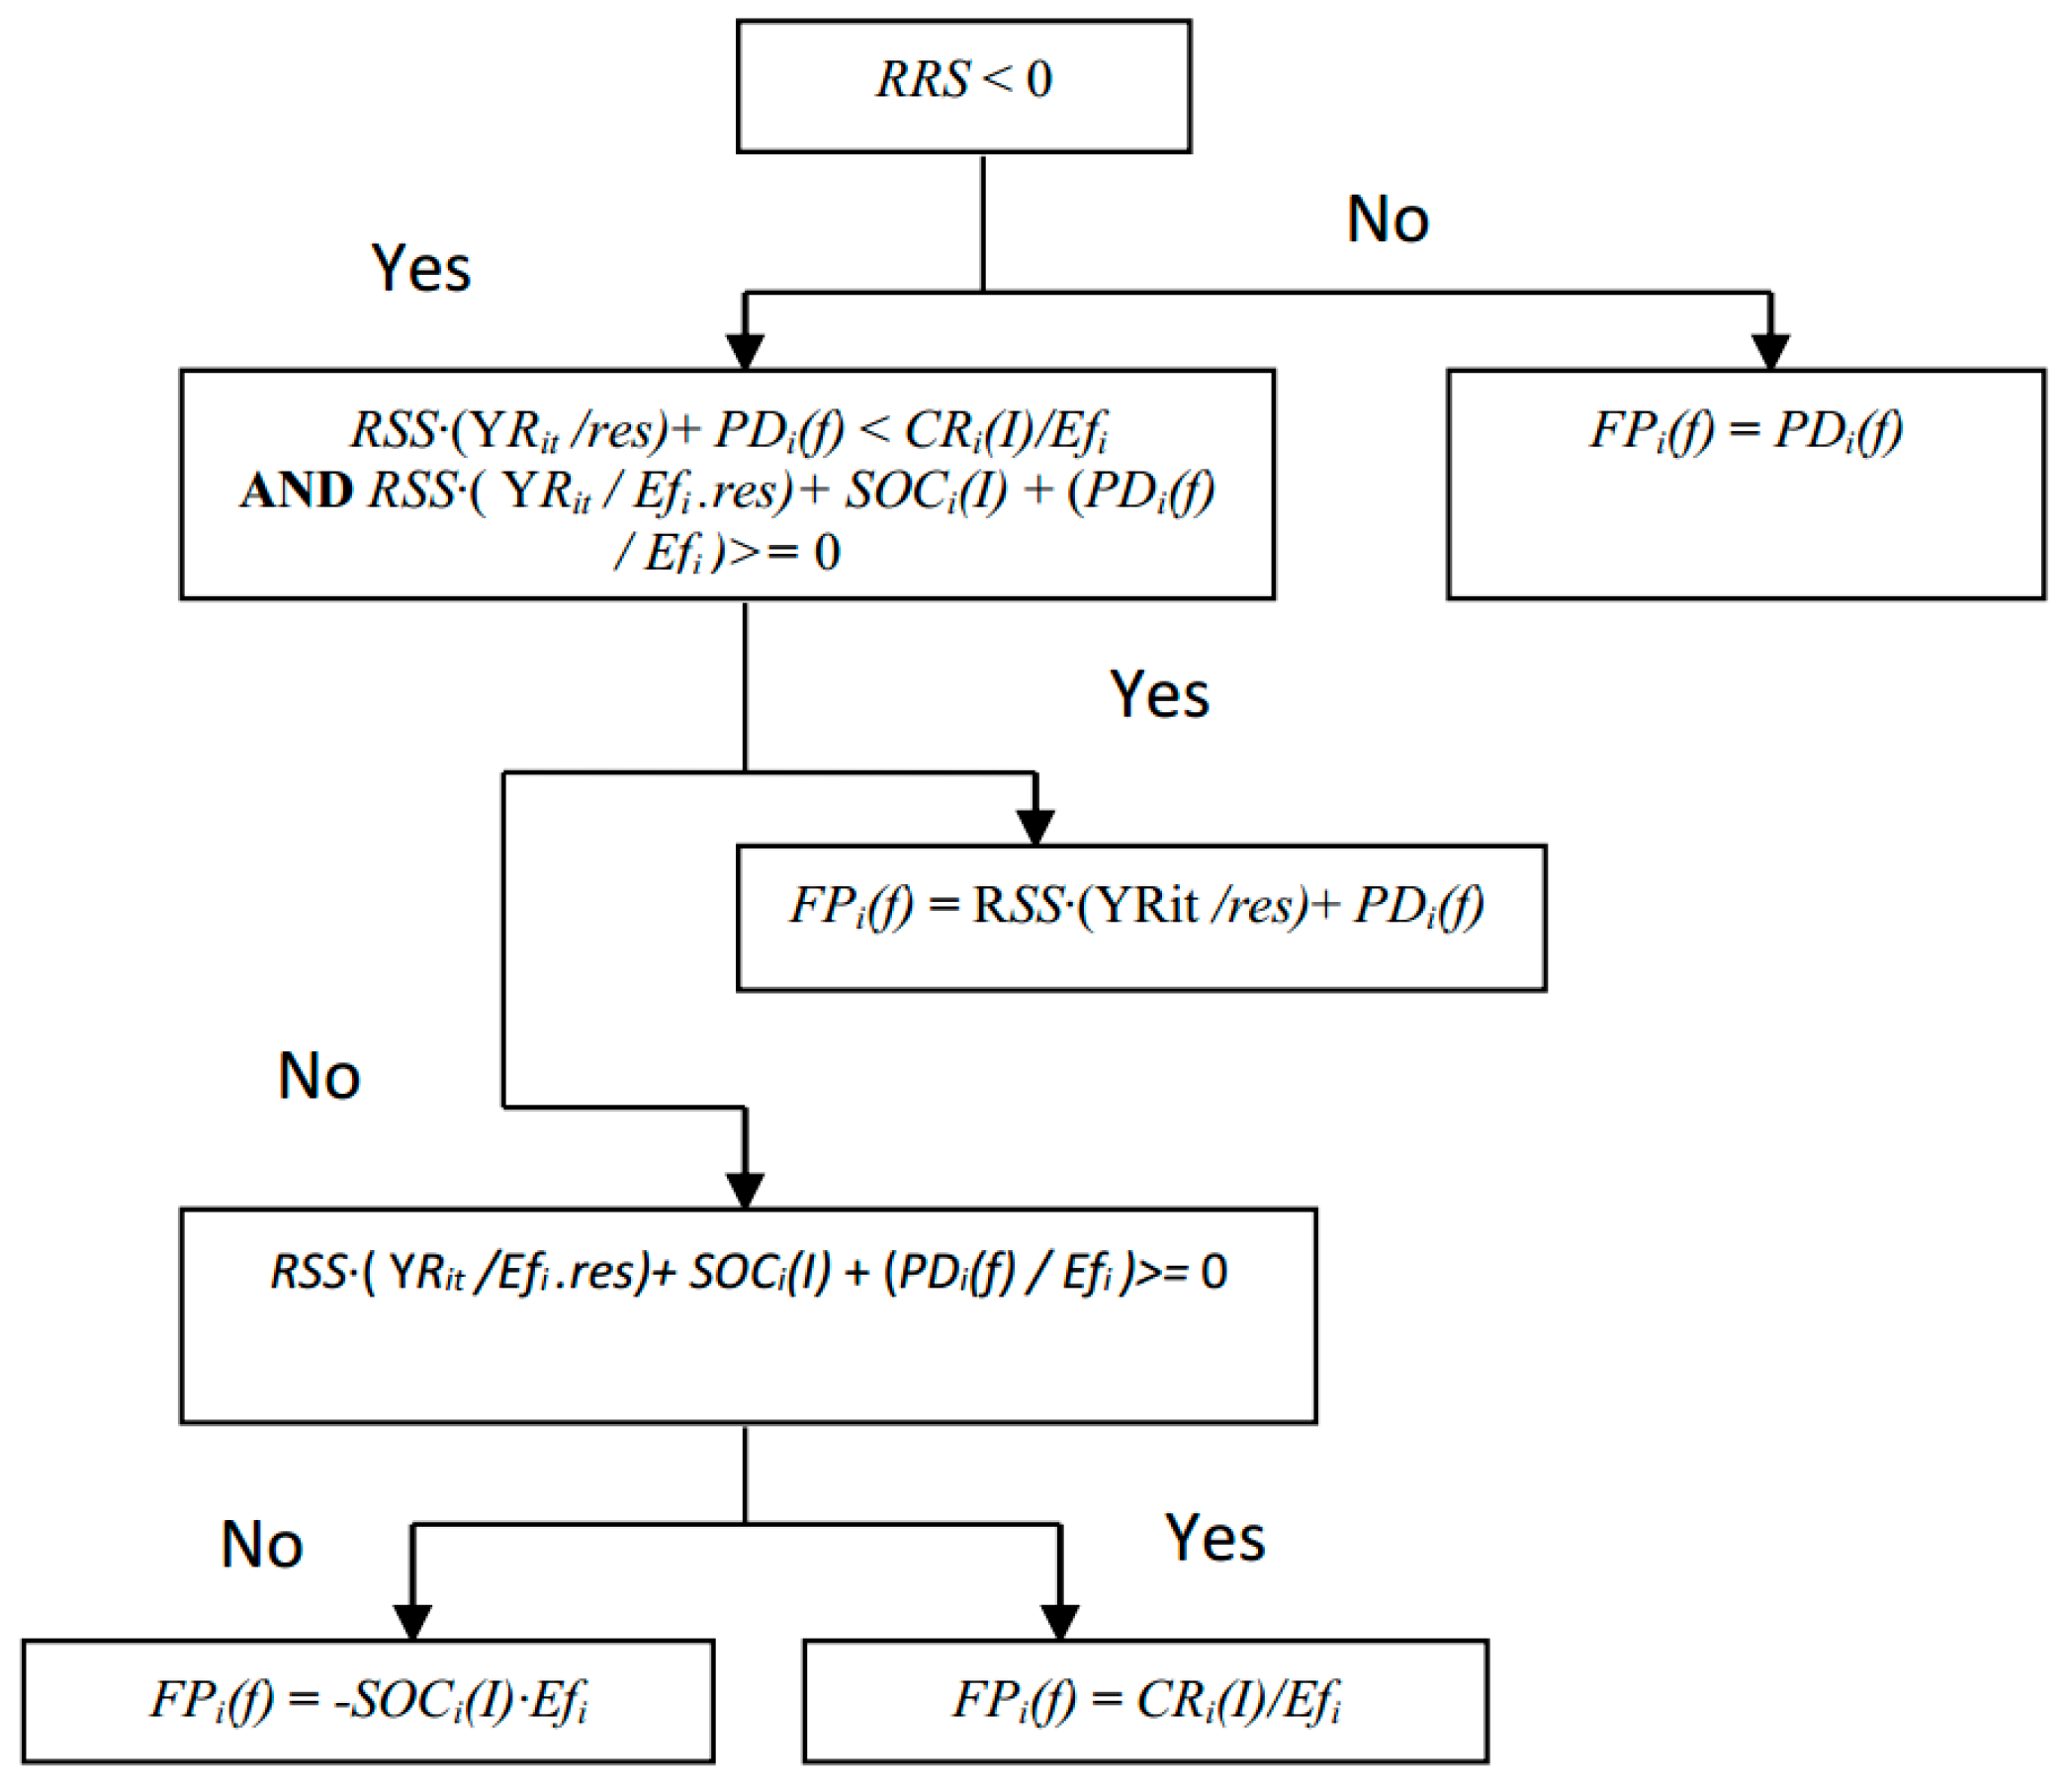
The first algorithm is the regulation services algorithm, which calculates the power draw of the battery after performing the regulation service. The algorithm is shown in Figure 2. It is clear from the algorithm that it uses the initial state of charge SOC and the initial remaining energy capacity CR of the battery. These initial values will also be used in the responsive reserve algorithm and will be updated after calculating the final power draw of the battery per res. The scheduled capacities of each battery that were calculated by the optimization are divided by the number of dispatch signals per hour res due to the fact that they are power quantities that have been optimized per hour. Therefore, if the POP of a certain battery at a certain hour is 3 kW, this battery can be charged with only 3 kW/res at each dispatch period.
The received signal is checked in order to define the type of regulation service needed (negative signal for regulation up and positive signal for regulation down). The assumed power draw of the battery from performing regulation service is checked to make sure that it does not cause overcharging (SOCi > Mci) or undercharging (SOCi < 0) for the battery. If overcharging or undercharging is to occur, the power draw PDi is not approved and needs to be adjusted. For the case of overcharging, the power draw must be limited to the remaining energy capacity of the battery CR. In the case of undercharging, the power draw PDi must be limited to the state of charge of the battery. The efficiency must be taken into account in both the charging and discharging cases. The algorithm takes the case of no regulation signal into account so that the power draw for that time span is simply the POP/res.
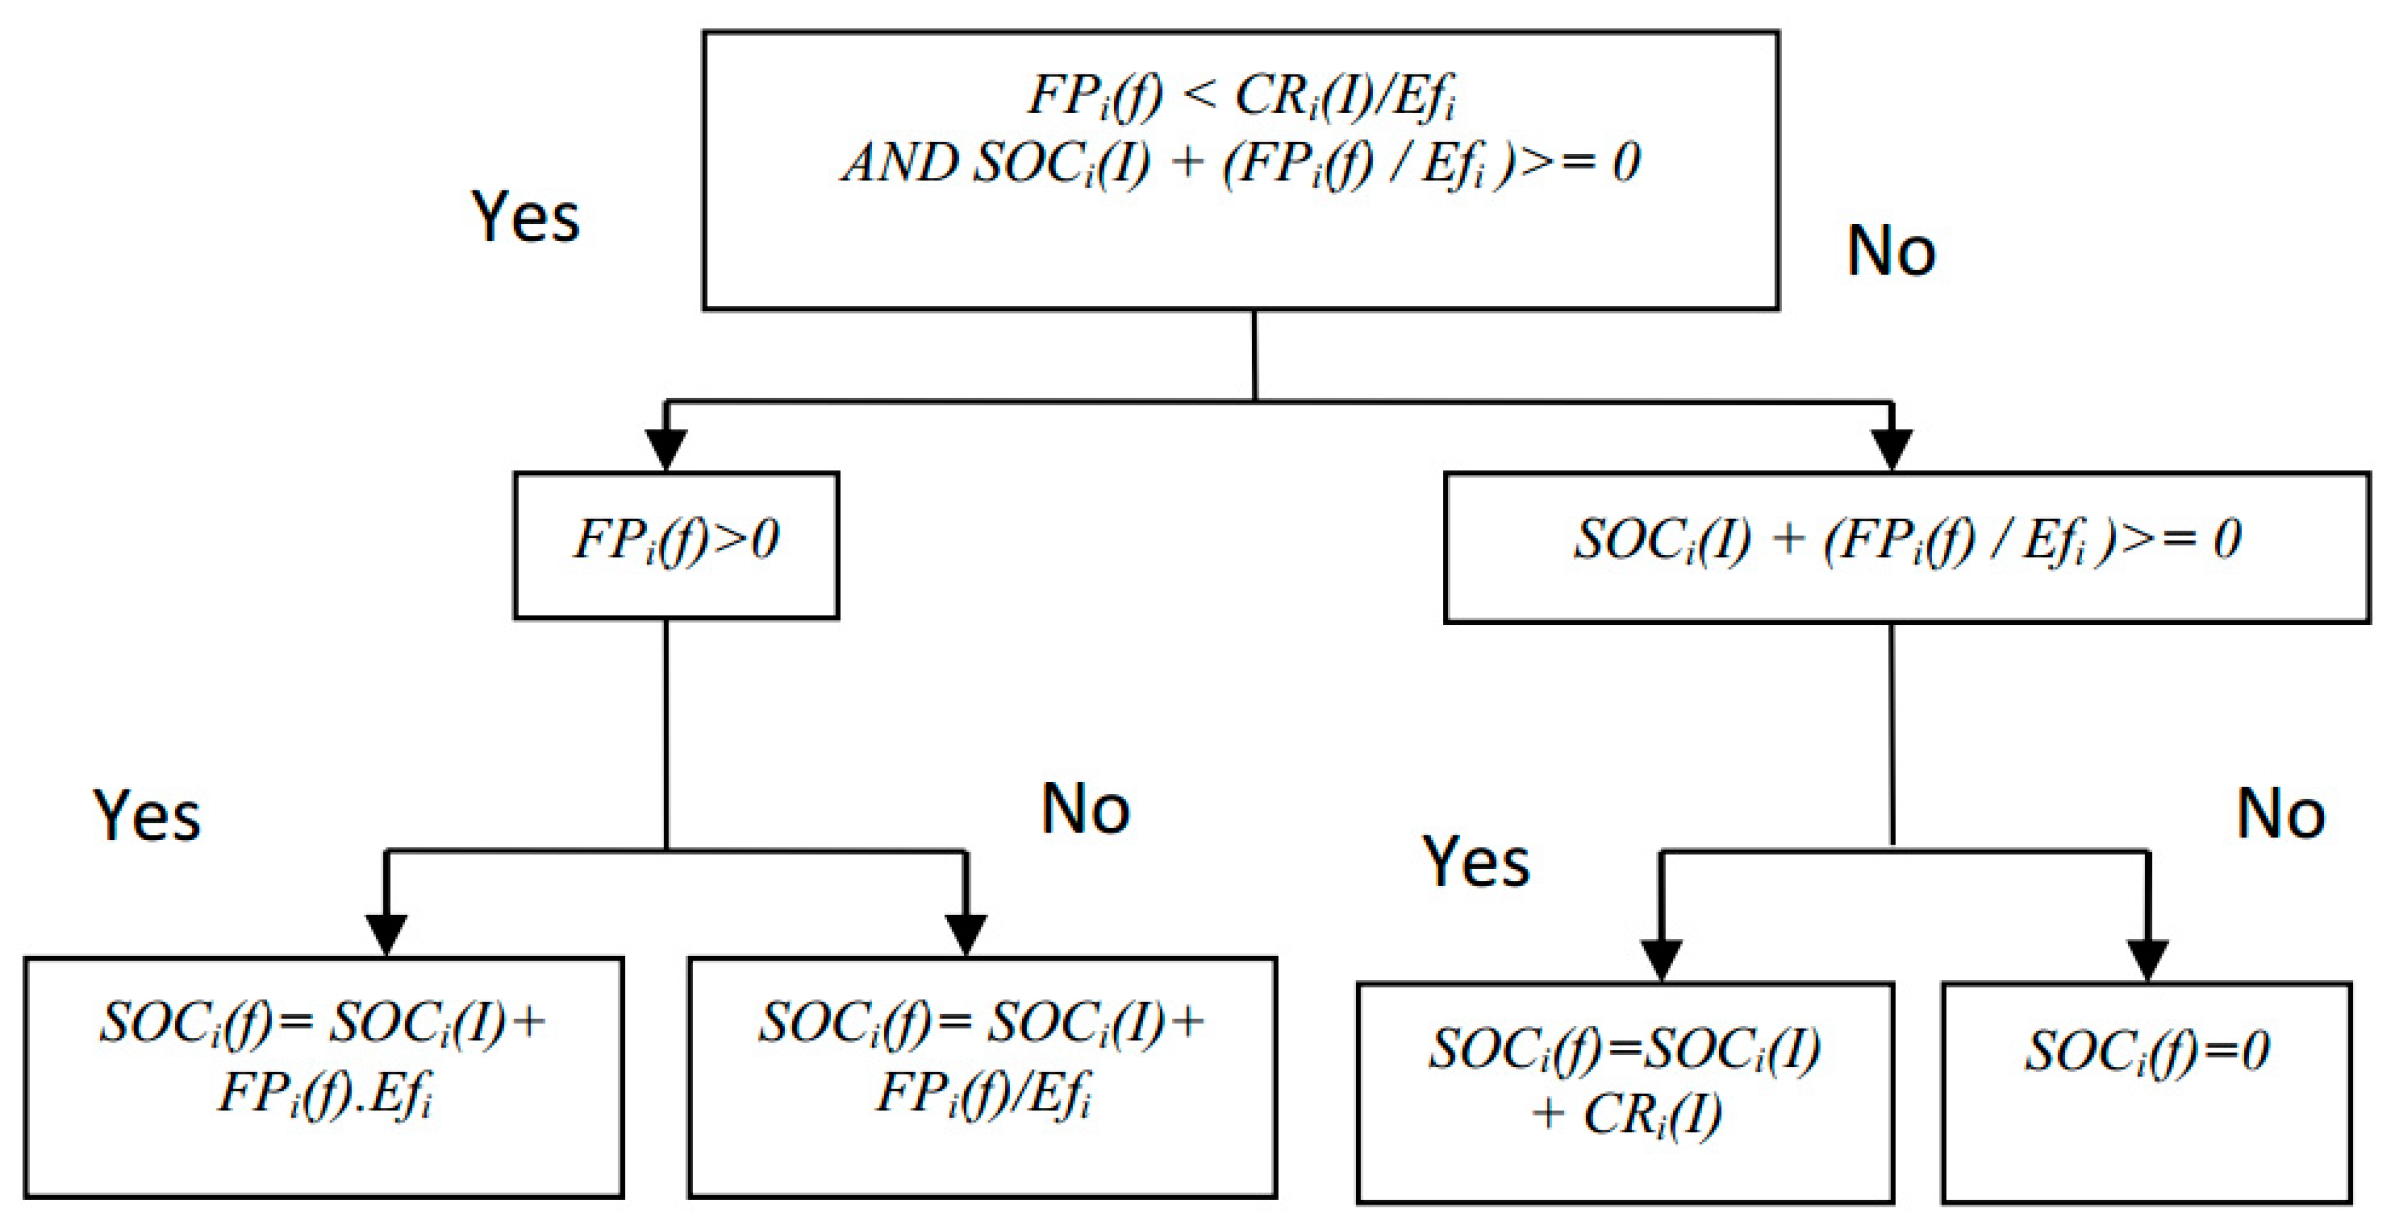
If the battery performs a responsive reserve service, the resulting power draw PDi(f) from the regulation service is now subjected to another algorithm that calculates the power draw. The algorithm is shown in Figure 3 and is very similar to the previous algorithm. The algorithm shows that in the case of no dispatch signal of a responsive reserve service, the final power draw FPi of the battery at a certain time span is the resulting power draw from performing the regulation service. The third algorithm comes after the power draw calculation, after performing the ancillary services. It is used to update the state of charge according the resulting power draw. The algorithm is shown in Figure 4. The final power draw is checked so it does not cause overcharging or undercharging for the battery. If there is no occurrence of undercharging and overcharging, the final power draw is then checked to see whether it is positive (charging) or negative (discharging), so that the SOC update will take the effect of the efficiency into account. If the final power draw is causing overcharging or undercharging, the final SOC of the battery will either be the maximum (overcharging case) or equal to zero (undercharging case).
4. Case Study
This case study was performed to assess the two suggested alternatives from the operational point of view. The optimizations and simulations were done for a group of 10,000 EVs for the EV aggregator option and one large battery for the dedicated storage unit option. The energy and power capacities of this large battery were determined by summing the energy and power capacities of the whole EV fleet, which means that this study case compared the two options when the battery capacities were equal. The case study was assumed to occur in Houston, Texas, which indicates that it must follow the Electric Reliability Council of Texas (ERCOT) market politics. The simulations were done from a period of three months from 21 July 2010 to 19 October 2010 and the energy prices, regulation and responsive reserve services, and the corresponding ancillary services deployment signals were taken from the ERCOT market archives [30]. The optimization problems were solved using the CVX toolbox, which was installed in the MATLAB environment [31]. All simulations were done using MATLAB.
The time horizon of each optimization in this study was 24 h, starting at 6:00 a.m. each day. During this time horizon, the EV aggregator made profits by participating in the ancillary services markets while charging its fleet, however, the profits were only made from participating in the ancillary service markets for the case of the dedicated energy storage unit. The optimizations and simulations were done on a daily basis. This indicates that for a certain day, the optimization will be done for the whole day and the results of the optimization will be used as inputs to the ancillary services algorithms to simulate the behavior of each EV in real time. The final actual SOC for each EV that resulted from the simulation for a certain day was used as the initial SOC for each EV in the optimization for the next day.
The optimization for each day used the hourly expected deployment of ancillary services and the forecasted prices of energy and ancillary services, while the simulation for that day used a five-minute resolution regulation and responsive reserve signals and the actual prices of energy and ancillary services. The expected hourly deployment signal was calculated as instructed in [15], and the forecasting of the prices was done using the ARIMA forecasting method. It should emphasize that the EVs can also follow ancillary service signals of a higher resolution [32]. For the case of the EV aggregator, it was assumed that the EV fleet consisted of three types of EVs: the Nissan Leaf (2011 Model) with 50%; Mitsubishi i-MiEV with 20%; and the Tesla Model S with 30%. The technical specifications of these three kinds of EVs can be found in [33,34,35]. It was also assumed that the charging and discharging efficiencies of all EVs were equal to 90% and that the charging rates were 240 V and 30 A.
The optimization and corresponding simulation for each day were done for a representative fleet that consisted of 100 EV profiles. The charging behavior of this minimized fleet was based on the original 10,000 fleet. The process of scaling down the size of the fleet was done by creating a histogram that represents the needed energy range for the morning or evening trip (which were almost equal) for all EVs from that histogram, and an identical histogram with the EV frequency numbers scaled down by a certain percentage was created (meaning that if the needed energy for the morning trip for 1000 EVs is between 1 and 2 kWh, in the case of a 10,000 EV fleet, 10 EVs will only be selected from this pool to represent the EVs with a needed trip energy between 1 and 2 kWh for a fleet of 100 EVs). The parameters of the selected EVs for creating the scaled down EV fleet also needs to be scaled properly so that it behaves like a 10,000 EV fleet. Such parameters are the power and energy capacity of each EV, and the probability of unexpected departure of each EV at any hour is used to calculate the compensation factor per EV and the percentage of remaining EVs to perform V2G service at each hour. EV driving profiles were created using the 2009 National Highway Travel Survey for urban Texas households [36]. Each driving profile had a morning trip that was between 7:00 and 9:00 a.m. and an evening trip time between 4:00 and 6:00 p.m. The driving profiles also contained the driving distances. The probability of the unexpected departure of any EV at any hour was assigned in a way that guaranteed that the summation of the probabilities during the whole day was equal for all EVs and in the same time. The probability of the unexpected departure for each EV at the hours of the planned trips and the last three hours of the day was zero. The corresponding availability matrix will always be one, except in the hours of planned trips for each EV.
For the case of using dedicated energy storage units, it was assumed that the administrator used a single battery with a power capacity that equaled the summation of the power capacities of all EVs in the EV fleet, with an energy capacity that equaled the summation of energy capacities of all EVs in the fleet, and with an initial SOC equal to the summation of the initial SOC of all EVs. The storage unit was always available. The used fixed tariff β was 0.05 $/kWh for the case of the EV aggregator and the battery replacement cost BatC was assumed to equal 200 $/kWh in both cases. The study considered that the aggregator and the energy storage administrator used existing infrastructure in its operation.
5. Results and Discussion
The operational comparison between the two options of EV aggregators and dedicated energy will be done by comparing the charging profiles and the power draw for both cases on a certain day. The charging profiles and power draw for a selected day were compared, then the quarterly profits for each case were also compared.
5.1. Charging Profiles
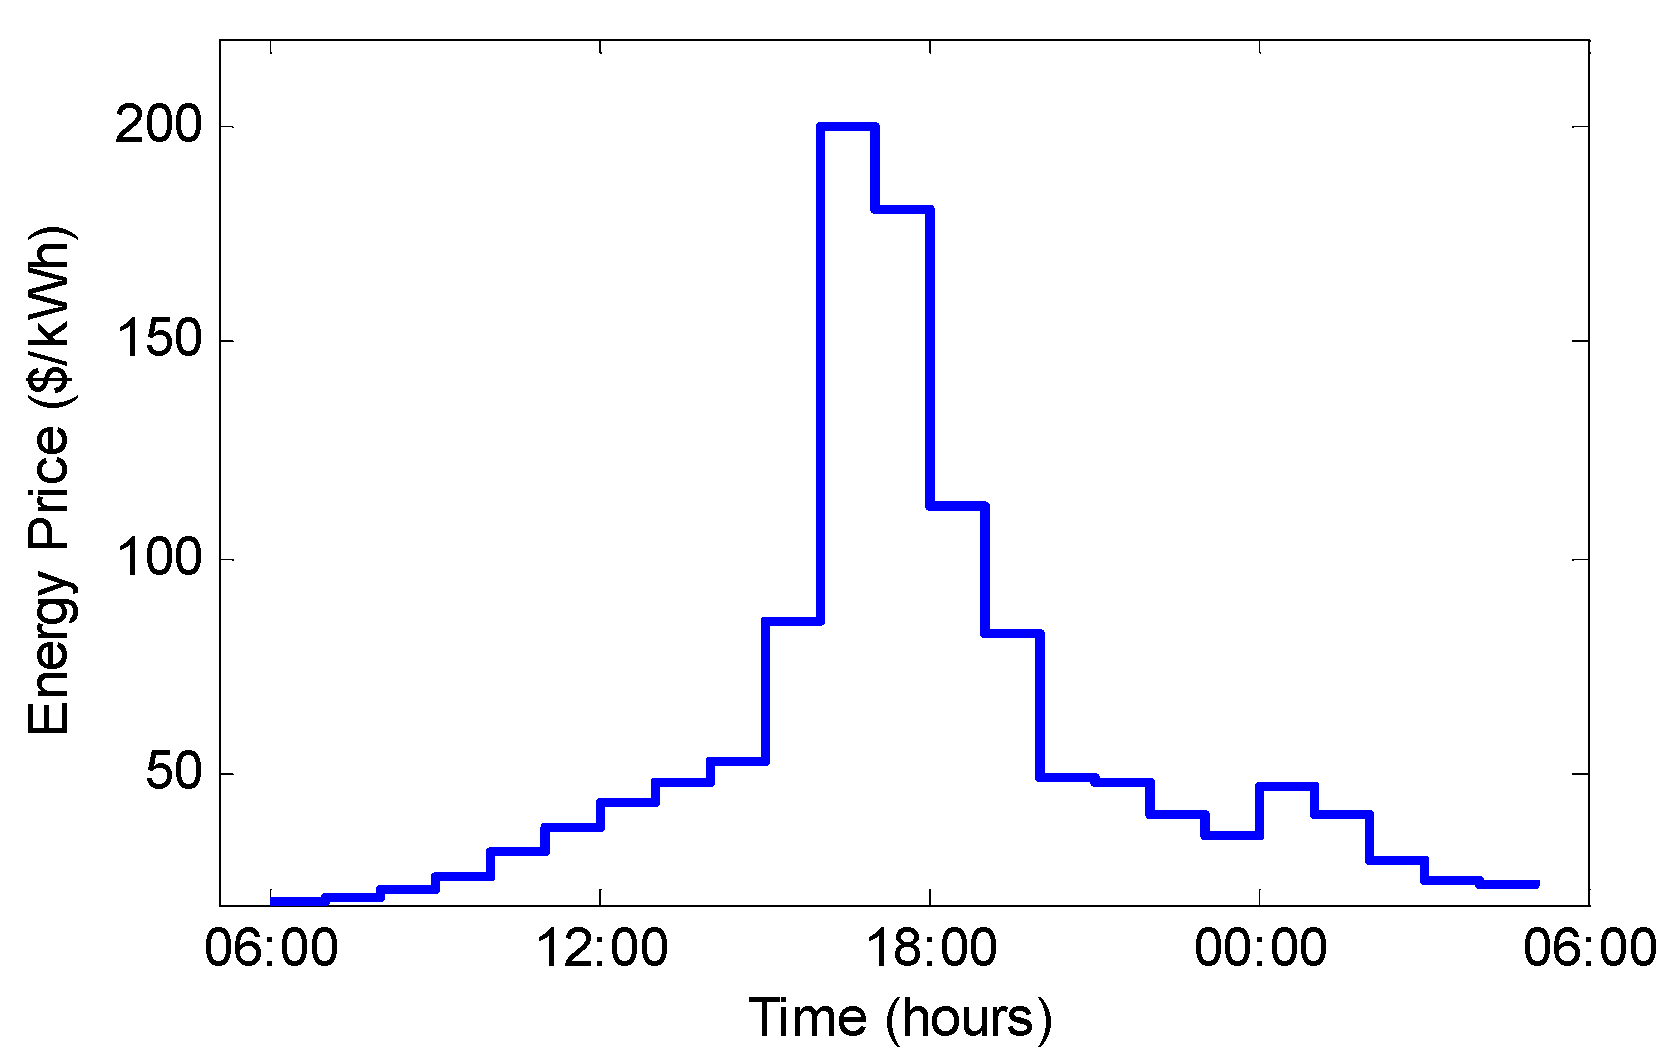
The charging profiles and EV power draw were compared for 2 August 2010, which was a randomly selected day. First, we checked the prices of the energy and ancillary services for the same day to help understand the charging profiles. The forecasted prices of the energy and ancillary services are shown in Figure 5 and Figure 6 for 2 August 2010.
The corresponding charging profiles for all of the EVs and for the dedicated energy storage unit on 2 August 2010 are shown in Figure 7, Figure 8, Figure 9 and Figure 10.
It can be seen from these figures that there are two important factors that affect the operational results of both cases. The first factor is the final SOC constraint, which affects the charging behavior of the case of the EV aggregator where the final SOC is almost the maximum. This was not the case for the dedicated energy storage unit. The final SOC constraint was less binding in this case (the final SOC is only supposed to be more than 50%), which gives more freedom in bidding in the ancillary services markets than the case of the EV aggregator where the charging process must be taken into account.
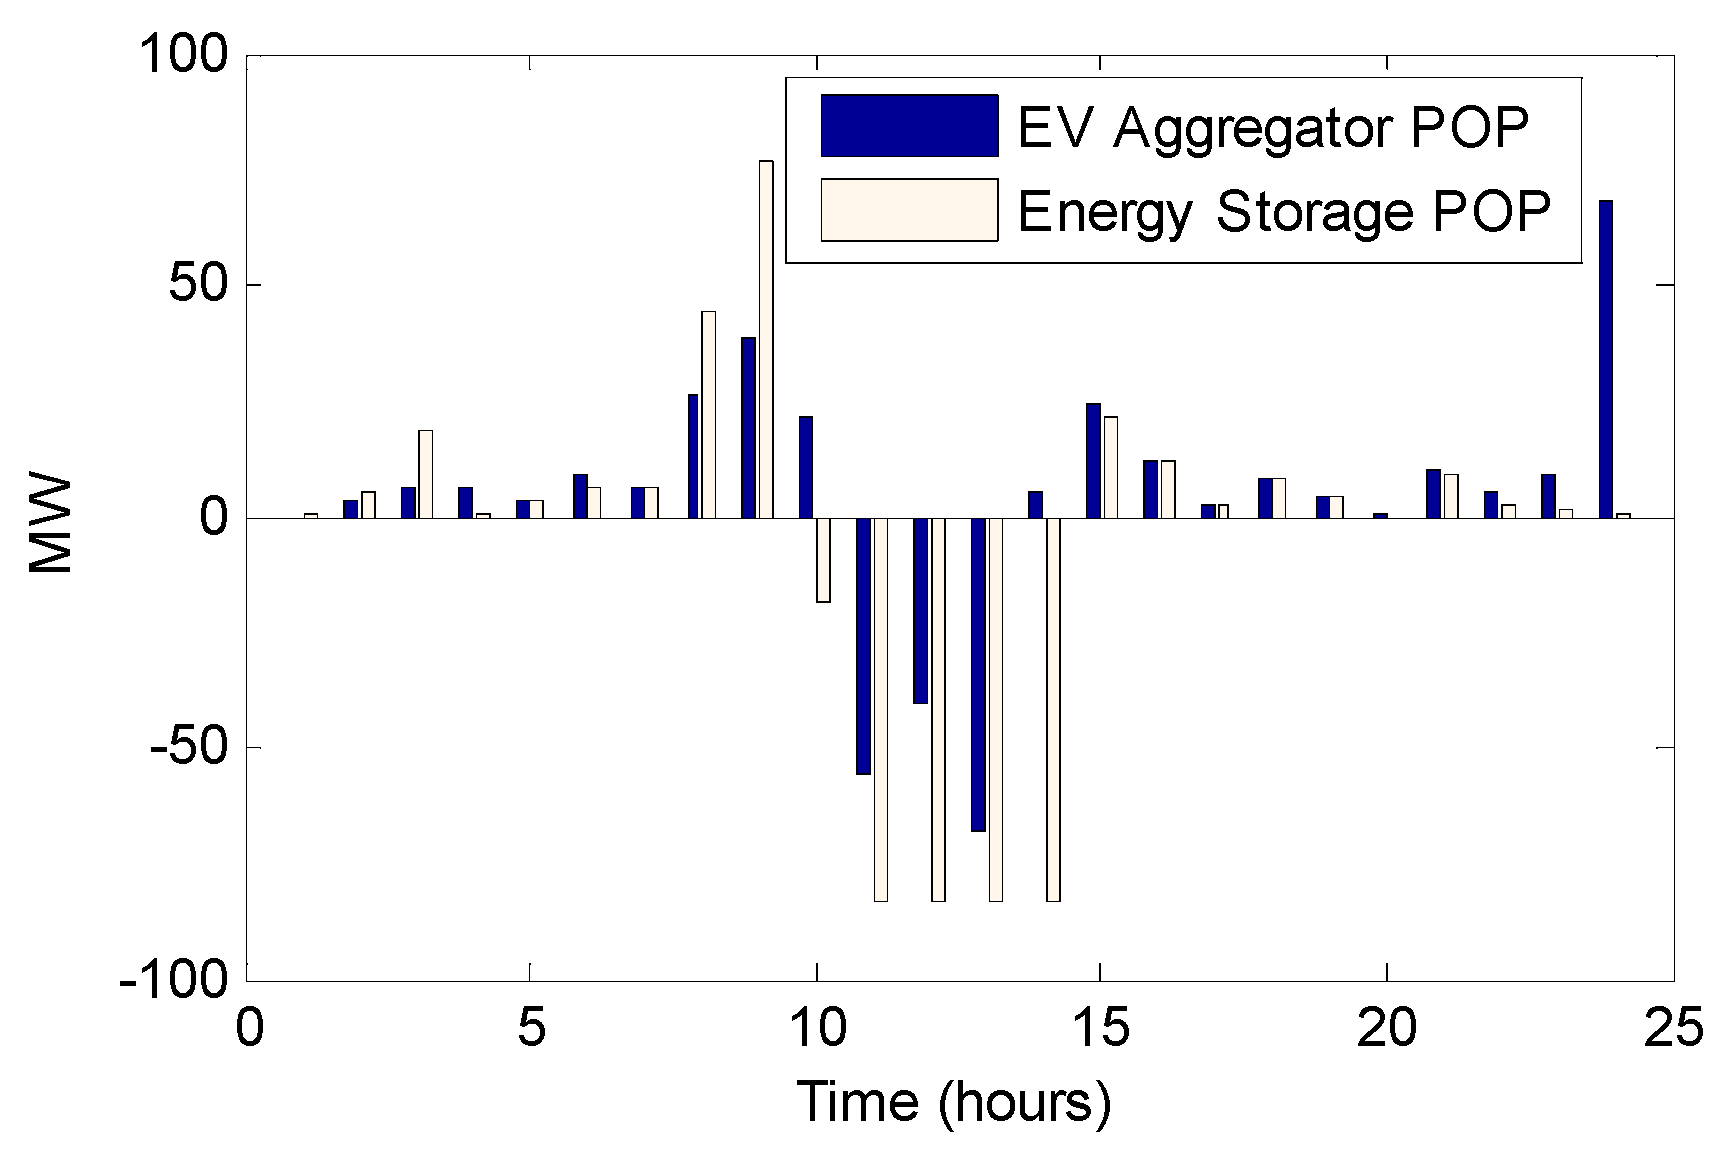
The second factor is the degradation cost. The assumed discharging cost for the case of the EV aggregator was higher than the discharging cost for the case of the dedicated energy storage as explained above. This allows the energy storage unit administrator to bid more in the regulation up and responsive reserve markets and to discharge the battery more when the energy price is high. The POP of both the EV aggregator and energy storage unit is shown in Figure 7, which shows that there is a close charging pattern for both cases, especially in the middle hours where both the EV aggregator and energy storage unit benefit from the high energy price by discharging their batteries, especially in the case of energy storage unit where the discharging cost was lower than the case of the EV aggregator. This encourages the energy storage unit administrator to charge its battery before the middle hours (at hours 13:00 and 14:00), so it can discharge more in the middle hours. The EV aggregator also charges its fleet at hours 13:00 and 14:00, and discharges its fleet in the middle hours, but at lower rates if compared to the energy storage unit case. The EV aggregator is obliged to charge more than the energy storage unit after the middle hours, especially in the last hour in order to fulfill the final SOC constraint while the energy storage unit is not in a hurry to do the same because of the low final SOC value needed.
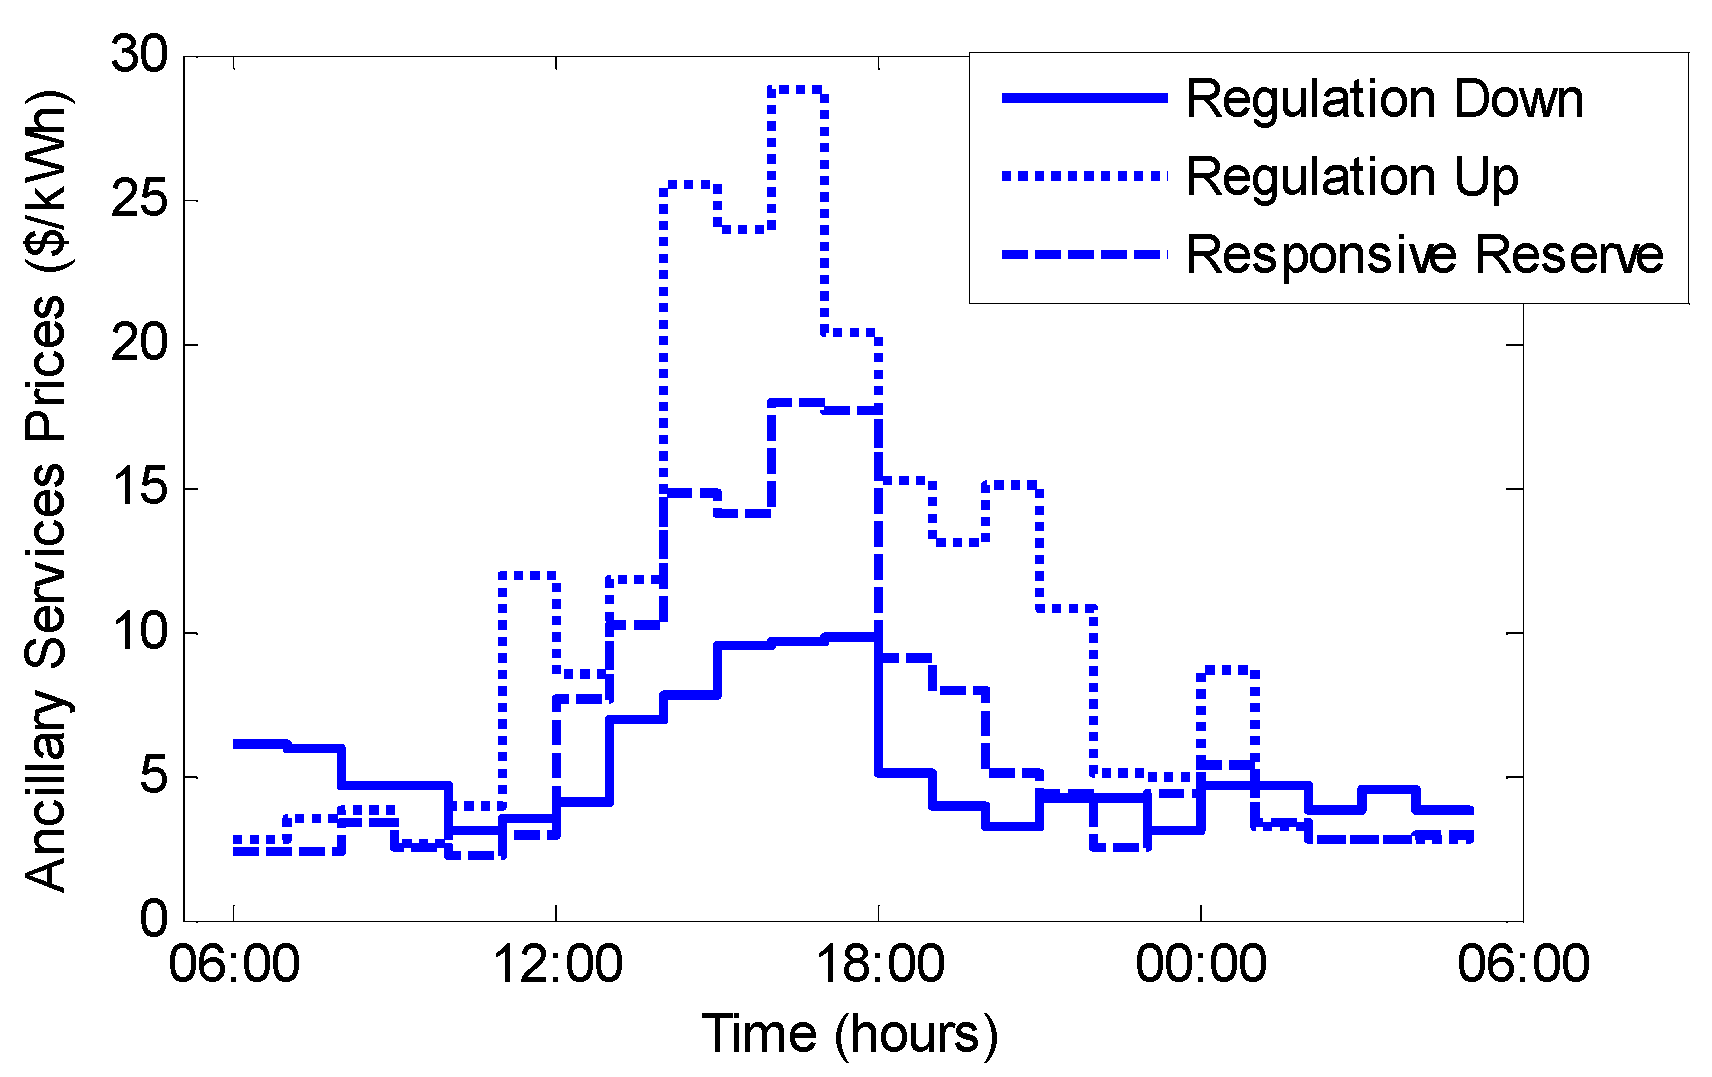
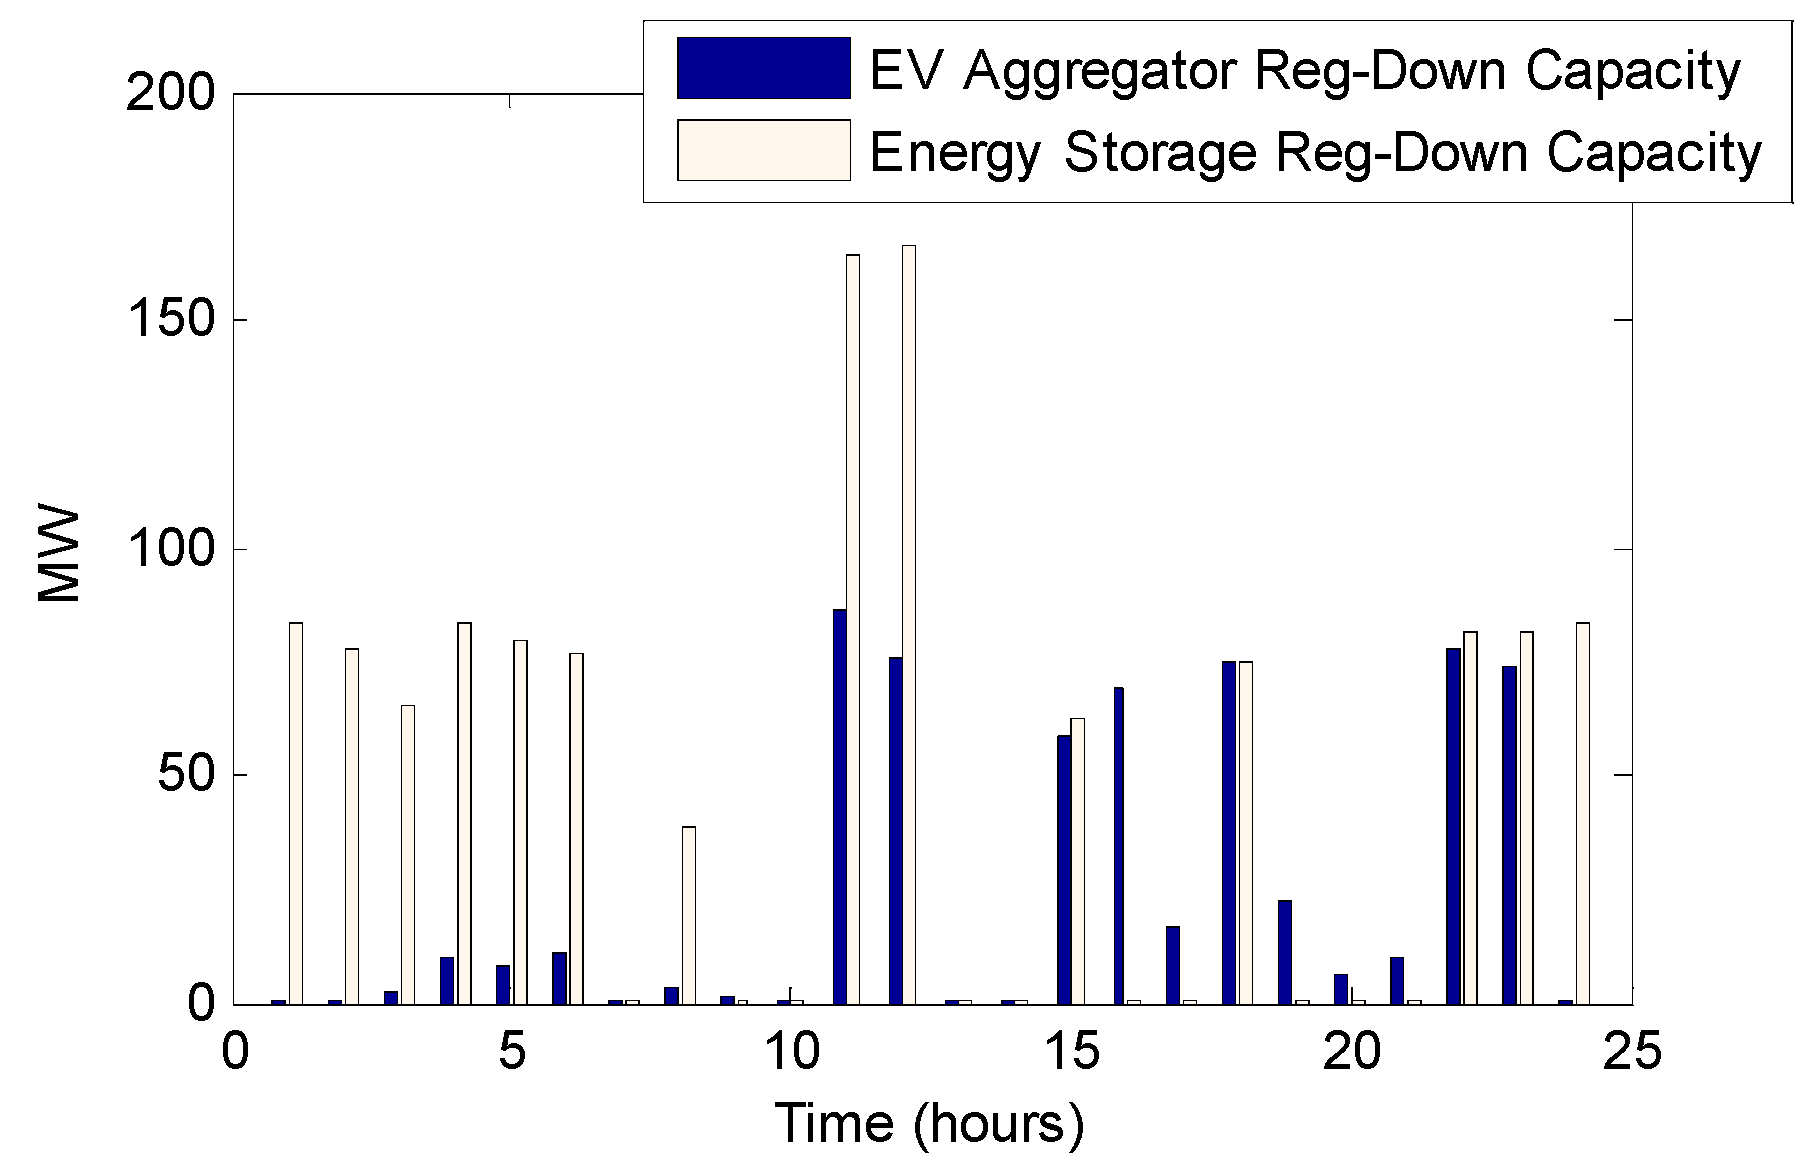
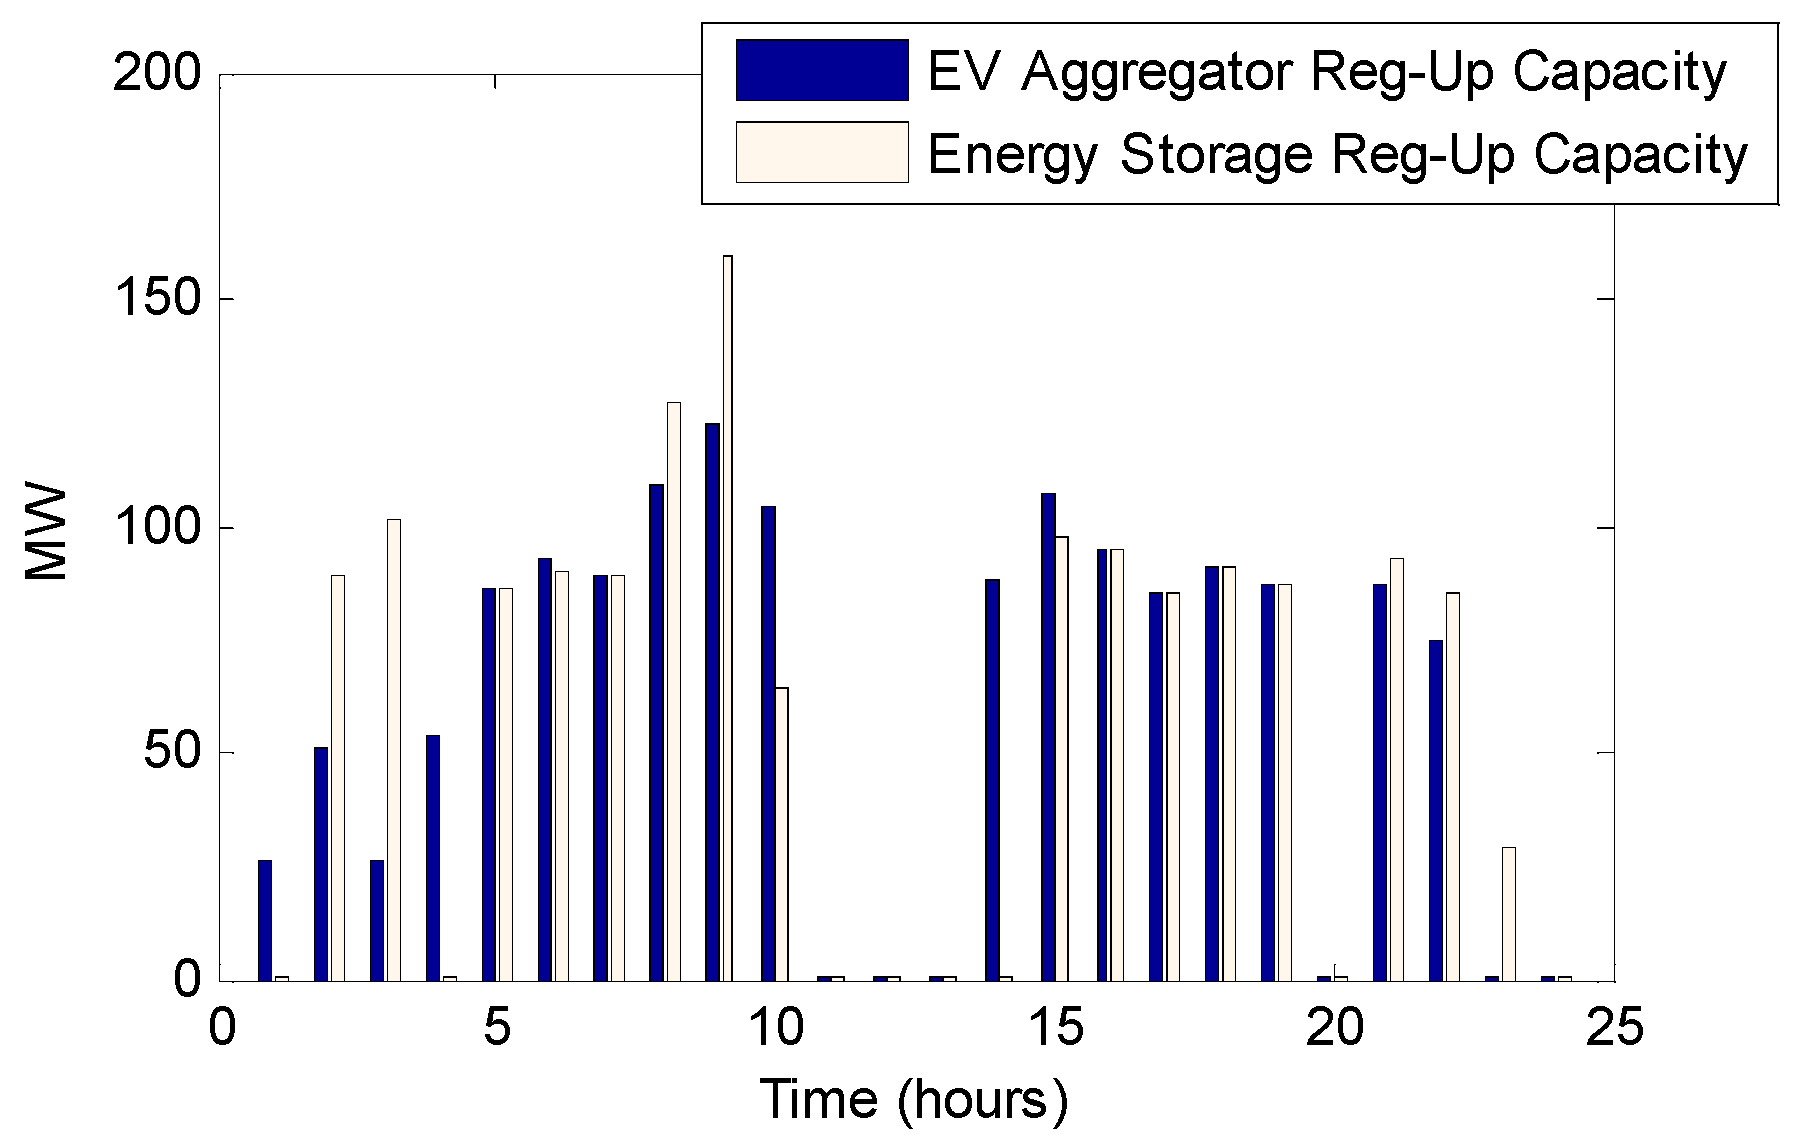
For the ancillary services bidding of both cases, it is clear from Figure 8 that the EV aggregator bids on more regulation down capacity after the middle hours where it is after charging its fleet, except in the last hour where the POP is very high, which leaves no room for bidding on regulation down capacity. The regulation down capacity bidding for the case of the energy storage unit is higher in the early hours while both the EV aggregator and energy storage unit bid high regulation down capacity at the middle hours. This is because of the high discharging rates in the middle hours, which leaves no room from providing regulation up and responsive reserve services, as shown in Figure 9 and Figure 10. Looking at the ancillary service prices in Figure 6 can help understand the ancillary services bidding that focuses more on regulation up service for both cases, as shown in the previous figures.
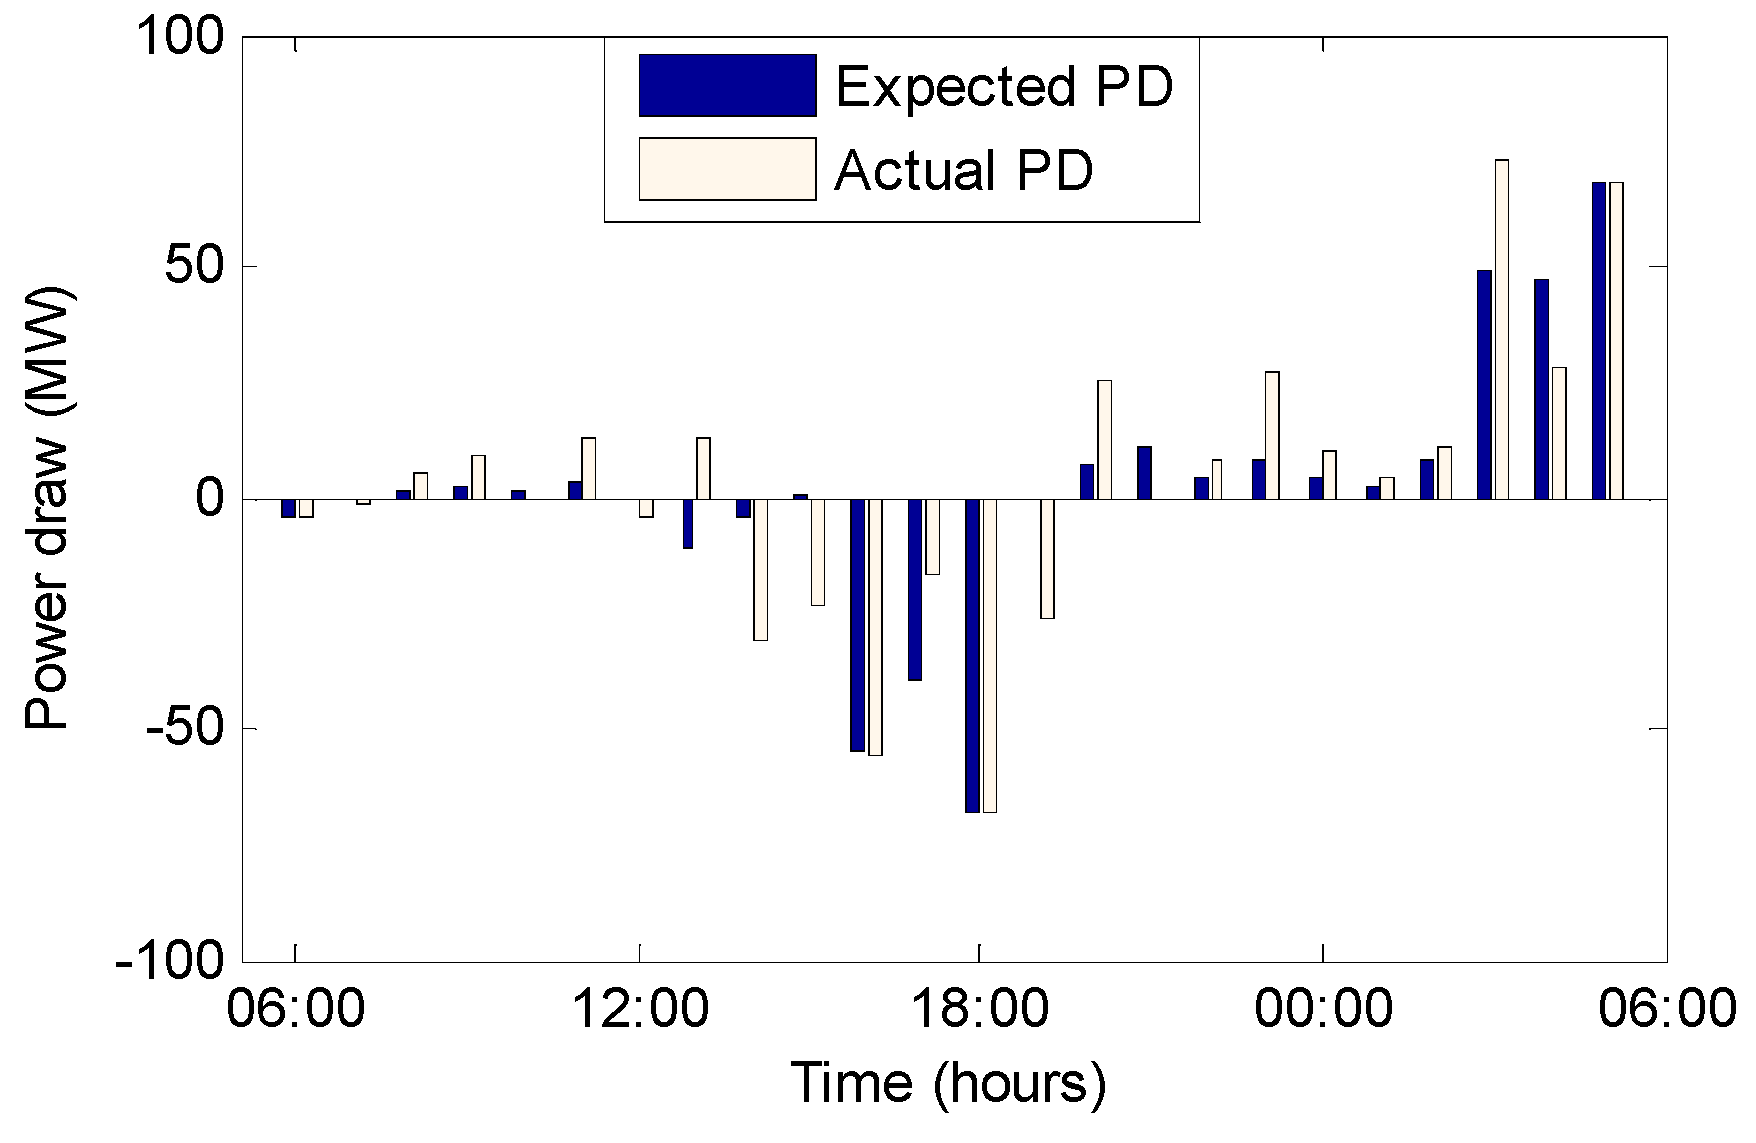
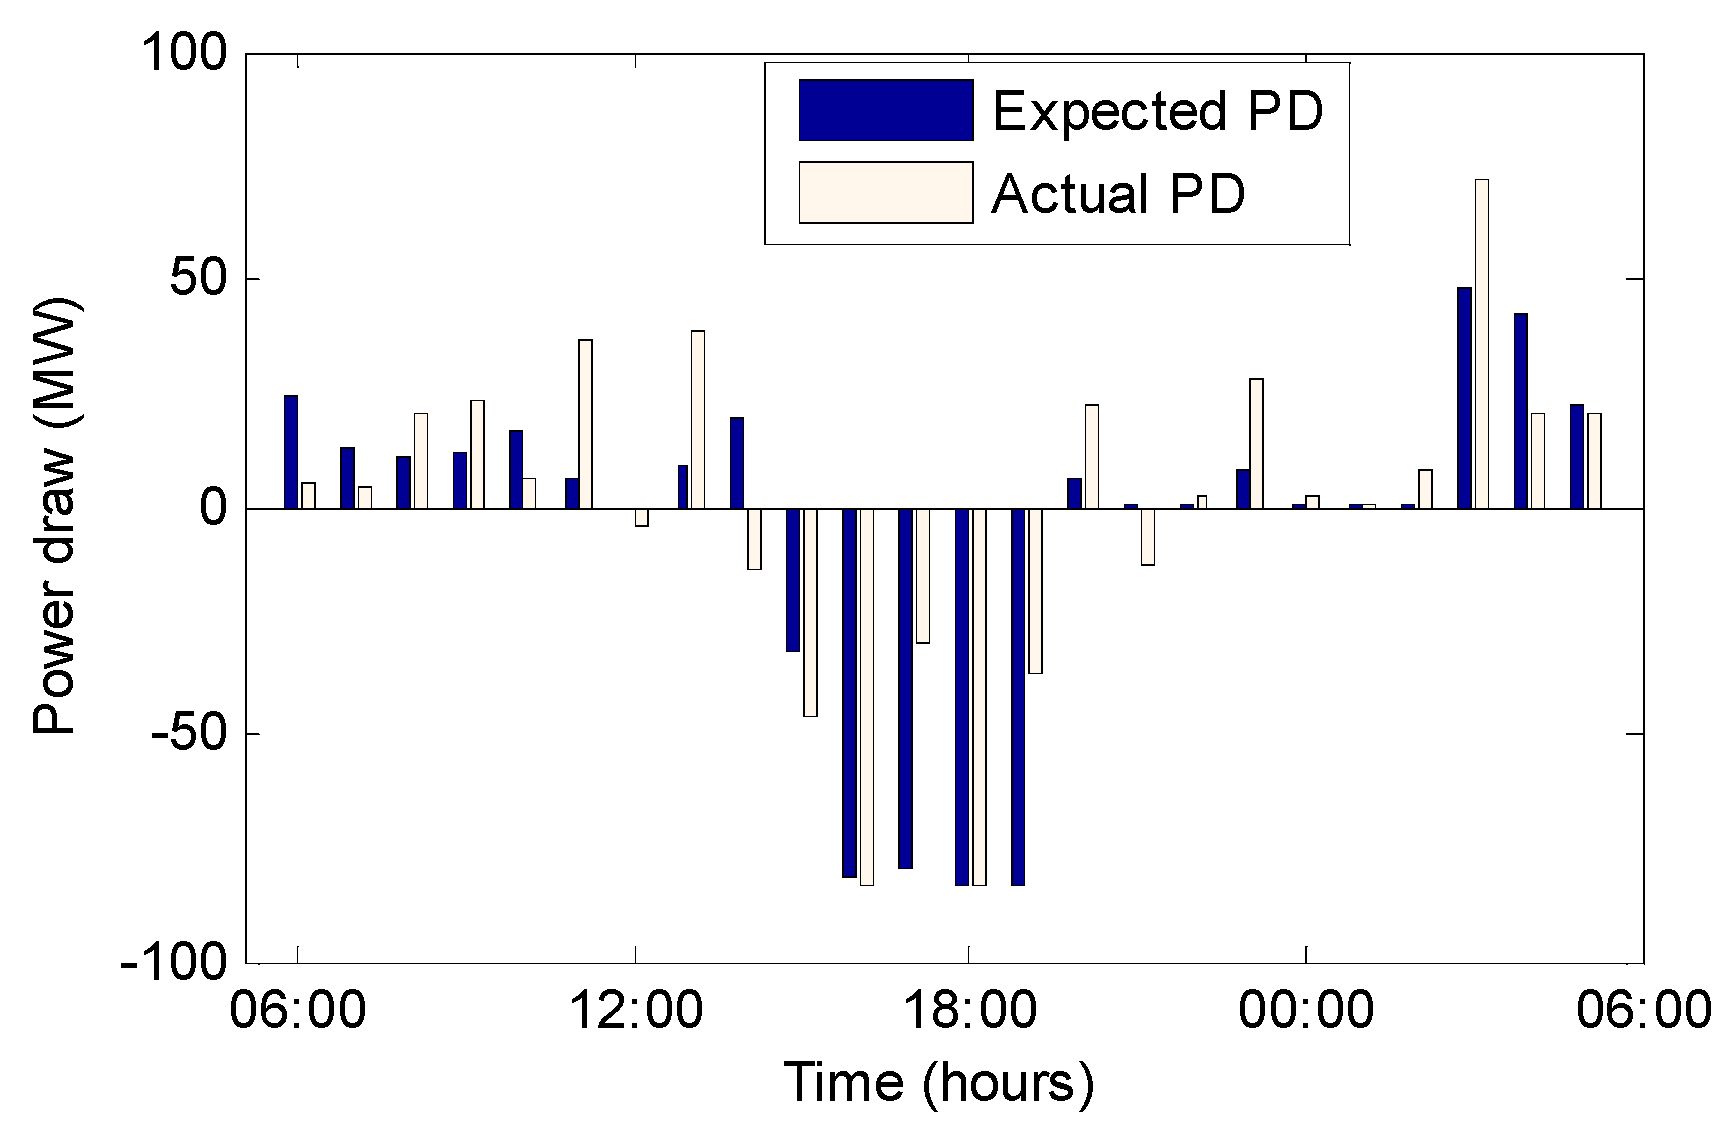
The regulation up prices are higher than the other two ancillary services prices, which explains the high bidding rates shown in Figure 6. In the middle hours, the low regulation up bidding is only an exception because both the EV aggregator and energy storage unit administrator are after profit from discharging their batteries. Another exception is the final hour for the EV aggregator, which cares about fully charging its EVs. The responsive reserve capacity bidding is found only at the beginning and final hours of the day, especially for the case of the EV aggregator where the low possibility of dispatching responsive reserves encourages it to bid while charging its fleet, especially in the final hour. The expected and actual power draw for the EV aggregator and energy storage unit are shown in Figure 11 and Figure 12. Both figures reflect the explanation of the charging profiles for the cases of the EV aggregator and energy storage unit.
5.2. Quarterly Results
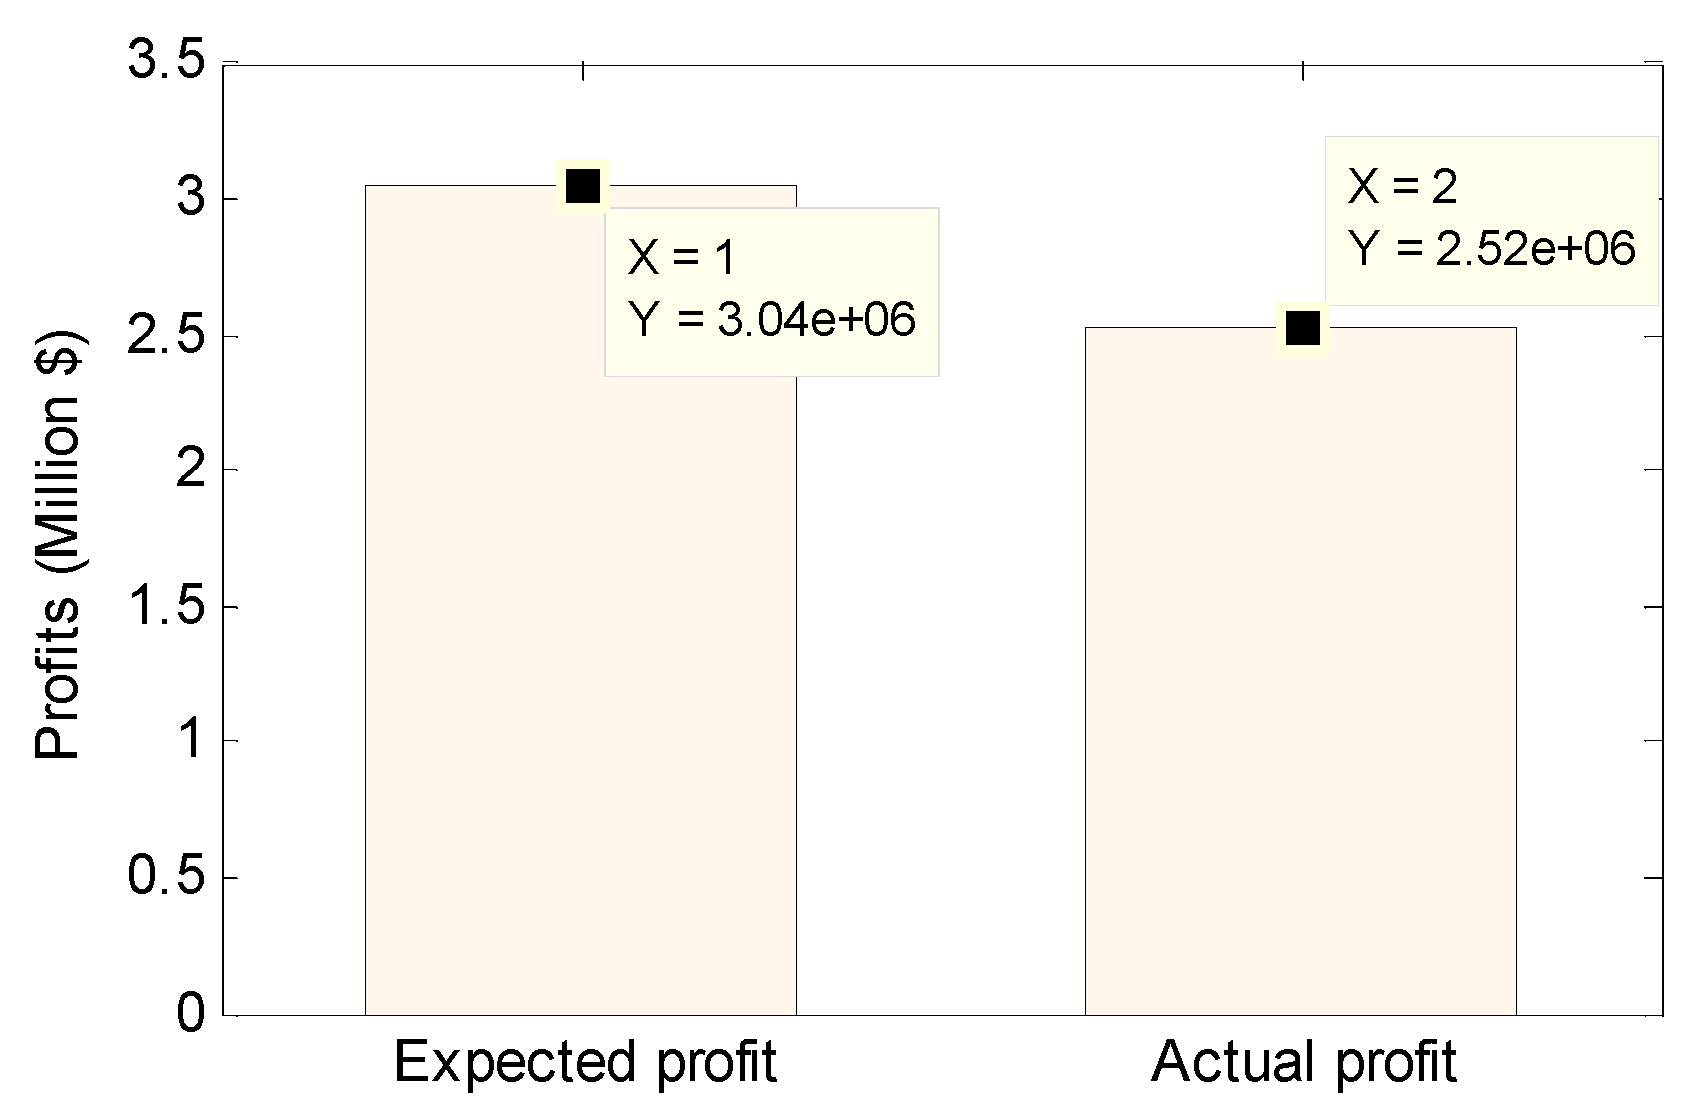
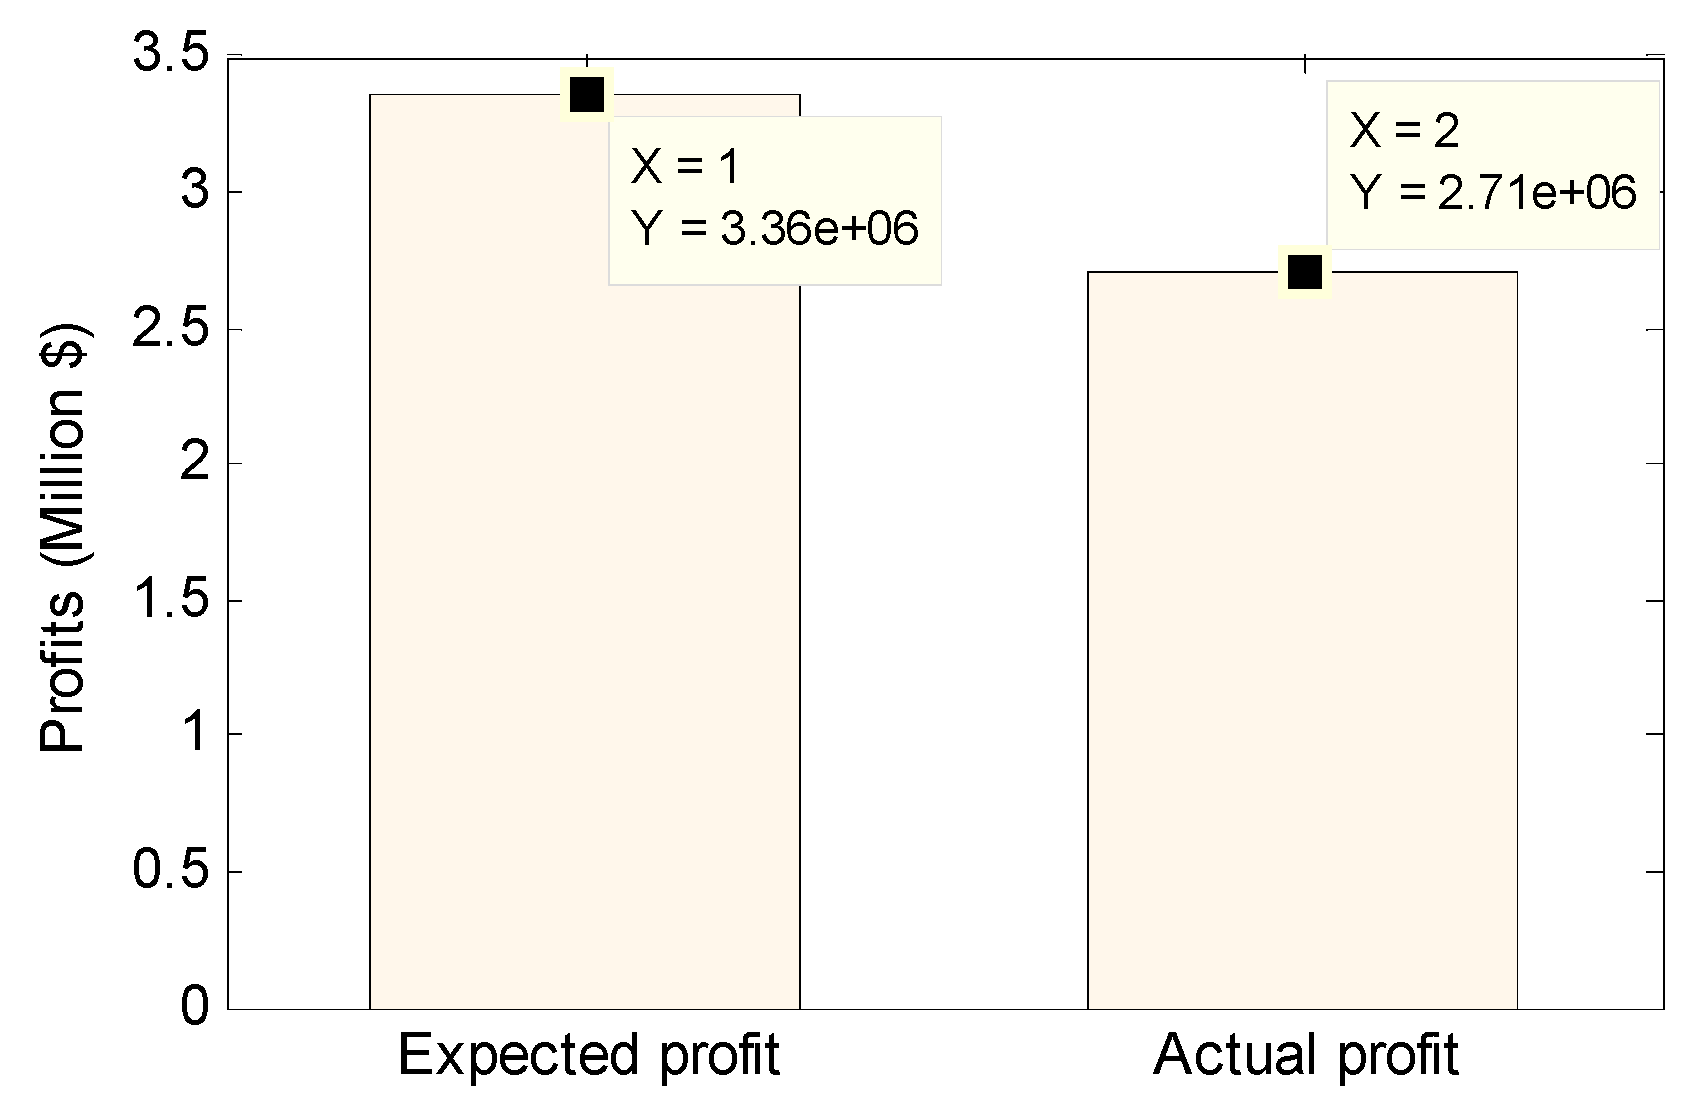
The market-based evaluation of any project in the first place is about its profits. This section compares the expected and actual quarterly operational profits for the cases of the EV aggregator and energy storage unit. The actual degradation cost for both cases were also compared. For the case of the EV aggregator, the EV charging cost paid by the EV owner is assumed to be lower than the original charging tariff. The low EV charging cost will create an incentive for the EV owners to participate in the EV aggregation program. The EV charging costs for the case of participating in the EV aggregation program were calculated and compared to the original case where the EV owners do not participate in the EV aggregation program. For the case of operating the EV aggregator, the expected and actual profits are shown in Figure 13, while the expected and actual profits for the case of operating the energy storage unit are shown in Figure 14. It can be seen from the figures that the expected profits were higher than the actual profits in both cases. Such a difference is logical because the expected profit calculation is based on the forecasted data, while the calculation of the actual profits depends on the actual data. The expected profits of the EV aggregator case was higher by a percentage of 17.1% than the actual profits, while it was higher by 19.33% for the case of the dedicated energy storage unit. The figures also show that operating a dedicated energy storage unit is more profitable than operating an EV aggregator. The profits from the energy storage unit case were $2.7094 million dollars, while the profits from operating the EV aggregator were $2.5232 million dollars, which indicates that the profits from the first case were higher by a percentage of 6.87%.
The comparison between the actual degradation costs for both cases is shown in Figure 12.
The interesting observation from Figure 15 is that although the energy storage unit option makes the highest profit and has a lower discharging cost, the actual degradation cost of this option is higher than the actual degradation cost of the EV aggregator option. The actual degradation cost of the EV aggregator option is $636,180, while it was $697,930 for the second option (higher by a percentage of 8.85%). This can be explained by the fact that the energy storage unit option did more discharging than the EV aggregator option.
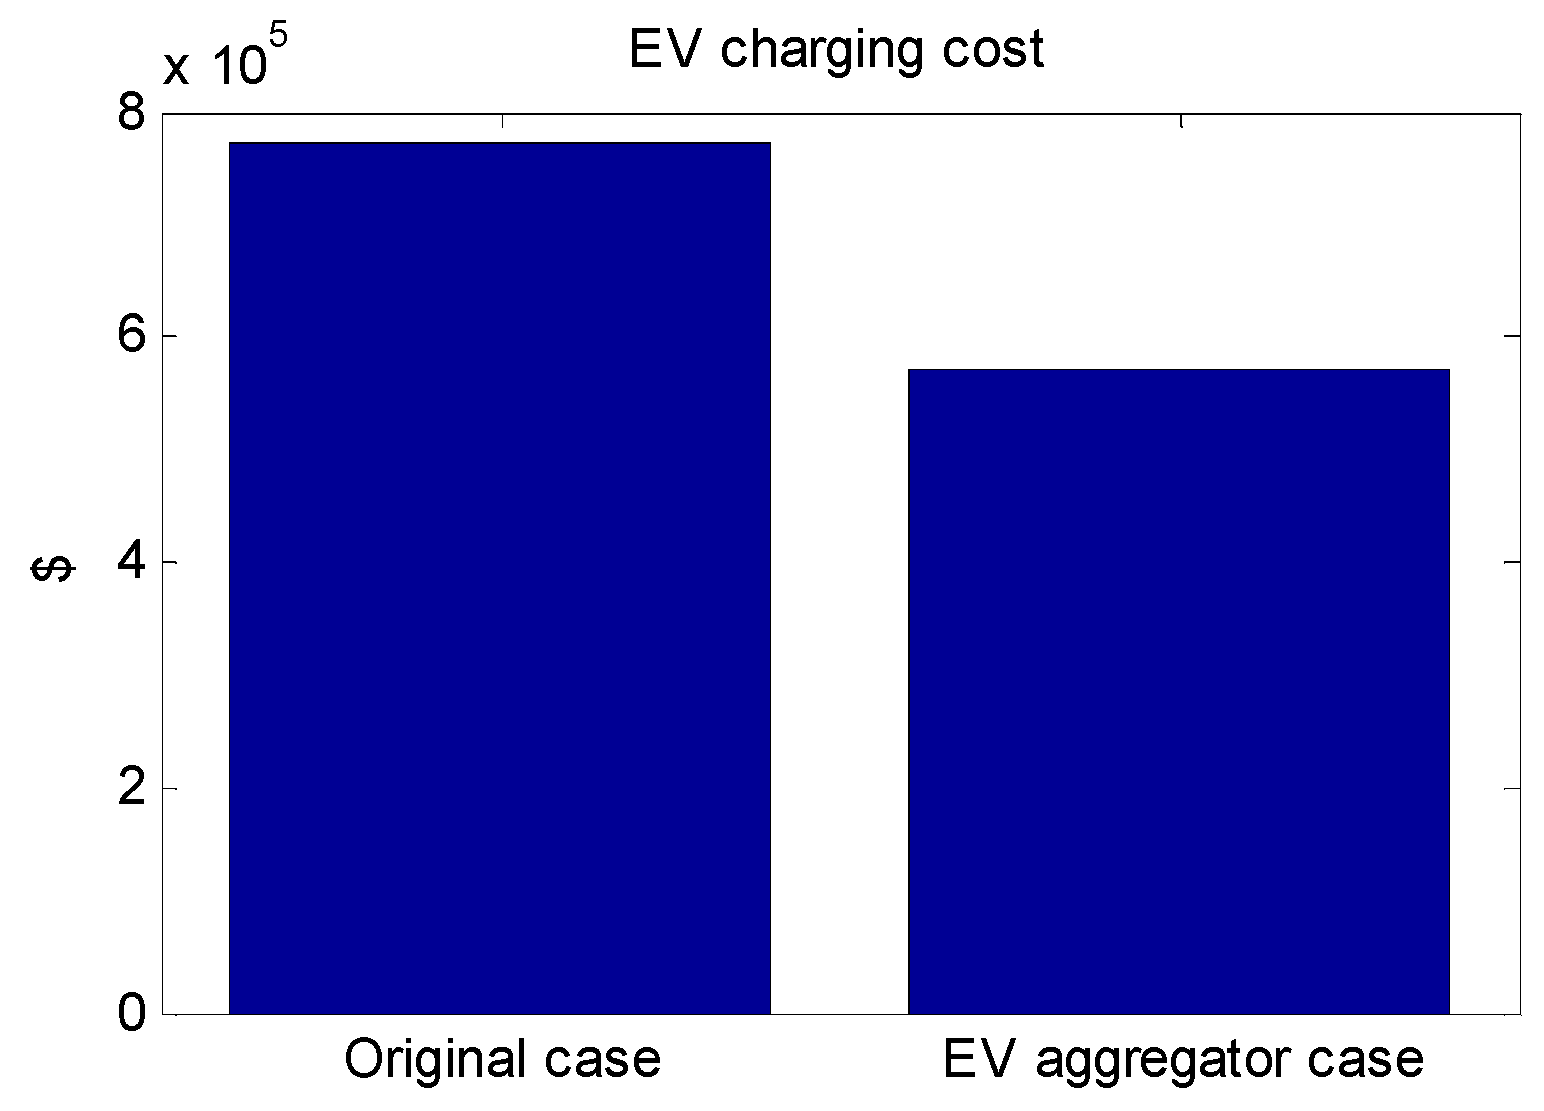
For the case of the EV aggregator, the EV charging costs that should be paid by the EV owners were calculated when EV owners participated in the EV aggregation program and were compared to the original case where there was no EV aggregation program. The EV charging costs for the case of no EV aggregation were calculated by finding the cost of buying the needed energy for daily scheduled trips based on the U.S electricity tariff (0.12 $/kWh). The comparison results are shown in Figure 16.
The results show that the EV charging costs that should be paid by the EV owner when no EV aggregation program is taken into account were higher than the EV charging costs when EV owners participated in the EV aggregation program by 26%. These results prove that EV owners are benefiting financially from their participation in the EV aggregation program, especially since they will also be paid for discharging their EV batteries while providing V2G services.
6. Conclusions
In this paper, an optimal strategy for bidding into the ancillary services market and charging batteries was introduced for two options: an EV aggregator and dedicated energy storage units. The selection of the optimal strategy for both options was based on the maximum operational profits that could be achieved. The formulation of the operational optimization problem and corresponding constraints is very important for the market-based evaluation of both options. The optimization problem for each option was solved and the charging profiles of both cases were discussed and compared. The operational profit results showed that when comparing the two options and assuming that both options have the same battery energy and power capacities, the use of dedicated energy storage units for bidding in the ancillary services market is more profitable than the case of operating an EV aggregator. The operational profit results of both options also showed a difference between the expected and actual profits for each option that resulted from the uncertainties of energy and ancillary service prices and deployment signals. This indicates the importance of taking the uncertainties into consideration while solving the optimization problem. Moreover, results showed that the best option to provide ancillary services is a dedicated energy storage unit as it is the most profitable option. It is clear that a comparison should include the planning aspects for both options to help determine the most feasible option for a fixed investment cost. Such work will be discussed in a future paper.
Author Contributions
Conceptualization, A.A. and T.K.; Methodology, A.A.; Validation, A.A. and T.K.; Writing original draft preparation, A.A. and T.K.; Writing—review and editing, T.K. All authors have read and agreed to the published version of the manuscript.
Funding
This research received no external funding.
Conflicts of Interest
The authors declare no conflict of interest.
Abbreviations
| i, t, d, w, y | Indices for EV, hour, day, week and year numbers |
| SOCI | Battery’s initial state of charge |
| SOC | State of charge |
| Trip | Accumulated energy needed for scheduled trips |
| POP | Preferred operating point |
| MP, MC | Maximum power (kW) and energy ratings (kWh) |
| YD, YU | Maximum/minimum additional power draw of EV |
| time | Operational daily time span in hours. |
| YR | Reduction in power available for spinning reserves |
| ρ | Energy discharged due to discharge efficiency |
| E[.] | Expected value |
| T1, T2 | Energy needed for scheduled morning/evening trip |
| FP | Final power draw |
| FP–- | A conservative estimation of the final power draw |
| Av | EV availability; 1 if EV is available, 0 otherwise |
| CR | Charge remaining to be supplied to an EV |
| EvPer | Expected % of EVs remaining to perform V2G |
| NY, NW | Number of years and number of weeks |
| Dep | Probability that an EV departs unexpectedly |
| Kw | Weighting factor of week w |
| A_Dep | Accumulated probability of unexpected departure |
| Y_P | The operational profit of one year |
| MTrip, ETrip | Scheduled morning and evening trip times |
| Inv_C | investment cost |
| In, C | Expected daily income and cost |
| M_C | Smart meter cost for each EV |
| P | Energy price |
| Com_C | Communications cost for each EV |
| PD, PU, PR | Forecasted price of regulation down, regulation up and responsive reserve. |
| Bi_C | Retrofit cost to support bidirectional V2G |
| RD, RU, RR | Aggregator’s capacity of regulation down, regulation up, and responsive reserve |
| T_P | Project’s total profit |
| β | Energy tariff charged to the customer |
| Dis_rate | Discount rate |
| ExD, ExU, ExR | Expected percentage of dispatched regulation down, regulation up, and responsive reserve |
| P_P | Percentage of participation of EV owners in aggregation |
| Deg | An epigraph variable to model battery degradation |
| T_EV | Total available EVs in the targeted region |
| DC | Discharging cost |
| P_EV | Number of participating EVs in aggregation |
| BatC | The battery replacement cost |
| NEV | Number of EVs usage profiles |
| Ef | Battery charging/discharging efficiency |
| Ch_C | Battery charger cost ($/kW) |
| Comp | Compensation factor for unplanned departures. |
| E_C | Battery energy capacity cost ($/kWh) |
| ISO | Independent system operator |
| AS | Ancillary Services |
References
- Hadley, S.W.; Tsvetkova, A.A. Potential Impacts of Plug-in Hybrid Electric Vehicles on Regional Power Generation. Electr. J. 2009, 22, 56–68. [Google Scholar] [CrossRef] [Green Version]
- International Energy Agency (IEA). The IEA World Energy Outlook 2011; IEA: Paris, France, 2011. [Google Scholar]
- Cao, Y.; Tang, S.; Li, C.; Zhang, P.; Tan, Y.; Zhang, Z.; Li, J. An Optimized EV Charging Model Considering TOU Price and SOC Curve. IEEE Trans. Smart Grid 2012, 3, 388–393. [Google Scholar] [CrossRef]
- Das, R.; Thirugnanam, K.; Kumar, P.; Lavudiya, R.; Singh, M. Mathematical Modeling for Economic Evaluation of Electric Vehicle to Smart Grid Interaction. IEEE Trans. Smart Grid 2014, 5, 712–721. [Google Scholar] [CrossRef]
- Stoeckl, G.; Witzmann, R.; Eckstein, J. Analyzing the capacity of low voltage grids for electric vehicles. In Proceedings of the 2011 IEEE Electrical Power and Energy Conference (EPEC), Winnipeg, MB, Canada, 3–5 October 2011; pp. 415–420. [Google Scholar]
- Kempton, W.; Letendre, S.E. Electric vehicles as a new power source for electric utilities. Transp. Res. Part Transp. Environ. 1997, 2, 157–175. [Google Scholar] [CrossRef]
- Brooks, A.; Thesen, S. PG&E and Tesla Motors: Vehicle to Grid Demonstration and Evaluation Program. In Proceedings of the 23rd International Battery, Hybrid and Fuel Cell Electric Vehicle Symposium and Exhibition (EVS-23), Anaheim, CA, USA, 2–5 December 2007. [Google Scholar]
- Ota, Y.; Taniguchi, H.; Nakajima, T.; Liyanage, K.M.; Baba, J.; Yokoyama, A. Autonomous Distributed V2G (Vehicle-to-Grid) Satisfying Scheduled Charging. IEEE Trans. Smart Grid 2012, 3, 559–564. [Google Scholar] [CrossRef]
- Guille, C.; Gross, G. A conceptual framework for the vehicle-to-grid (V2G) implementation. Energy Policy 2009, 37, 4379–4390. [Google Scholar] [CrossRef]
- Escudero-Garzas, J.J.; Garcia-Armada, A.; Seco-Granados, G. Fair Design of Plug-in Electric Vehicles Aggregator for V2G Regulation. IEEE Trans. Veh. Technol. 2012, 61, 3406–3419. [Google Scholar] [CrossRef] [Green Version]
- Kempton, W.; Tomić, J.; Letendre, S.; Brooks, A. Vehicle-to-Grid Power: Battery, Hybrid, and Fuel Cell Vehicles as Resources for Distributed Electric Power in California. 2001. Available online: http://www.udel.edu/V2G/docs/V2G-Cal-2001.pdf (accessed on 3 May 2014).
- Brooks, A.; Gage, T. Integration of Electric Drive Vehicles with the Electric Power Grid—A New Value Stream. In Proceedings of the 18th International Electric Vehicle Symposium and Exhibition, Berlin, Germany, 20–24 October 2001. [Google Scholar]
- Sortomme, E.; El-Sharkawi, M.A. Optimal Charging Strategies for Unidirectional Vehicle-to-Grid. IEEE Trans. Smart Grid 2011, 2, 131–138. [Google Scholar] [CrossRef]
- Sortomme, E.; El-Sharkawi, M.A. Optimal Combined Bidding of Vehicle-to-Grid Ancillary Services. IEEE Trans. Smart Grid 2012, 3, 70–79. [Google Scholar] [CrossRef]
- Sortomme, E.; El-Sharkawi, M.A. Optimal Scheduling of Vehicle-to-Grid Energy and Ancillary Services. IEEE Trans. Smart Grid 2012, 3, 351–359. [Google Scholar] [CrossRef]
- Shafie-khah, M.; Heydarian-Forushani, E.; Golshan, M.E.H.; Siano, P.; Moghaddam, M.P.; Sheikh-El-Eslami, M.K.; Catalão, J.P.S. Optimal trading of plug-in electric vehicle aggregation agents in a market environment for sustainability. Appl. Energy 2016, 162, 601–612. [Google Scholar] [CrossRef]
- Baringo, L.; Amaro, R.S. A stochastic robust optimization approach for the bidding strategy of an electric vehicle aggregator. Electr. Power Syst. Res. 2017, 146, 362–370. [Google Scholar] [CrossRef] [Green Version]
- Soares, J.; Ali, M.; Ghazvini, F.; Borges, N.; Vale, Z. Dynamic electricity pricing for electric vehicles using stochastic programming. Energy 2017, 122, 111–127. [Google Scholar] [CrossRef] [Green Version]
- Alipour, M.; Mohammadi-Ivatloo, B.; Moradi-Dalvand, M.; Zare, K. Stochastic scheduling of aggregators of plug-in electric vehicles for participation in energy and ancillary service markets. Energy 2017, 118, 1168–1179. [Google Scholar] [CrossRef]
- Hoogvliet, T.W.; Litjens, G.B.M.A.; van Sark, W.G.J.H.M. Provision of regulating- and reserve power by electric vehicle owners in the Dutch market. Appl. Energy 2017, 190, 1008–1019. [Google Scholar] [CrossRef]
- Aghajani, S.; Kalantar, M. Optimal scheduling of distributed energy resources in smart grids: A complementarity approach. Energy 2017, 141, 2135–2144. [Google Scholar] [CrossRef]
- Mohammadi-Ivatloo, P.A.B.; Alipour, M.; Abapour, M.; Zare, K. Optimal scheduling of plug-in electric vehicles and renewable micro-grid in energy and reserve markets considering demand response program. J. Clean. Prod. 2018, 186, 293–303. [Google Scholar]
- Moghaddam, S.Z.; Tohid, A. Network-constrained optimal bidding strategy of a plug-in electric vehicle aggregator: A stochastic/robust game theoretic approach. Energy 2018, 151, 478–489. [Google Scholar] [CrossRef]
- Perez-Diaz, A.; Gerding, E.; McGroarty, F. Coordination and payment mechanisms for electric vehicle aggregators. Appl. Energy 2018, 212, 185–195. [Google Scholar] [CrossRef] [Green Version]
- Banshwar, A.; Sharma, N.K.; RajSood, Y.; Shrivastava, R. Market-based participation of energy storage scheme to support renewable energy sources for the procurement of energy and spinning reserve. Renew. Energy 2019, 135, 326–344. [Google Scholar] [CrossRef]
- Aziz, M.; Oda, T.; Mitani, T.; Watanabe, Y.; Kashiwagi, T. Utilization of Electric Vehicles and Their Used Batteries for Peak-Load Shifting. Energies 2015, 8, 3720–3738. [Google Scholar] [CrossRef] [Green Version]
- Liu, H.; Ji, Y.; Zhuang, H.; Wu, H. Multi-Objective Dynamic Economic Dispatch of Microgrid Systems Including Vehicle-to-Grid. Energies 2015, 8, 4476–4495. [Google Scholar] [CrossRef]
- Chen, Z.; Xiong, R.; Wang, K.; Jiao, B. Optimal Energy Management Strategy of a Plug-in Hybrid Electric Vehicle Based on a Particle Swarm Optimization Algorithm. Energies 2015, 8, 3661–3678. [Google Scholar] [CrossRef] [Green Version]
- Gao, Y.; Chen, Y.; Wang, C.-Y.; Liu, K.J.R. A contract-based approach for ancillary services in V2G networks: Optimality and learning. In Proceedings of the 2013 Proceedings IEEE INFOCOM, Turin, Italy, 14–19 April 2013; pp. 1151–1159. [Google Scholar]
- ERCOT. Electric Reliability Council of Texas, Market Information. Available online: http://www.ercot.com/mktinfo (accessed on 4 January 2018).
- Grant, M.C.; Boyd, S.P. Graph implementations for nonsmooth convex programs. In Recent Advances in Learning and Control; Blondel, V.D., Boyd, S.P., Kimura, H., Eds.; Springer: London, UK, 2008. [Google Scholar]
- Kempton, W.; Udo, V.; Huber, K.; Komara, K.; Letendre, S.; Baker, S.; Brunner, D.; Pearre, N. A Test of Vehicle-To-Grid (V2G) for Energy Storage and Frequency Regulation in the PJM System; University of Delaware: Newark, DE, USA, 2008. [Google Scholar]
- Nissan Leaf 2011 Specifications. Available online: https://www.nissanusa.com/digital-brochures/brochures/nissan.leaf.2011/pdf/nissan.leaf.2011.specs.pdf (accessed on 4 January 2018).
- TESLA. Tesla Motors Model S. Available online: http://www.teslamotors.com/models/features#/performance (accessed on 4 January 2018).
- MINI, MINI-E Specifications. Available online: http://www.mitsubishi-cars.co.uk/used-cars/i-miev/ (accessed on 4 January 2018).
- Federal Highway Administration. National Household Travel Survey, 2010. Available online: http://nhts.ornl.gov/ (accessed on 15 December 2018).
Figure 1.
Relationship between preferred operating point (POP) and ancillary services capacities of a certain battery.
Figure 1.
Relationship between preferred operating point (POP) and ancillary services capacities of a certain battery.

Figure 2.
Power draw calculation of a battery after performing the regulation service.

Figure 3.
Power draw calculation of a battery after performing a responsive reserve service.

Figure 4.
Battery state of charge calculation after performing ancillary services.

Figure 5.
Hourly energy price.

Figure 6.
Hourly ancillary services prices.

Figure 7.
POP for the Electric Vehicle (EV) aggregator and dedicated storage unit.

Figure 8.
Regulation down capacity of the EV aggregator and dedicated storage unit.

Figure 9.
Regulation up capacity of the EV aggregator and dedicated storage unit.

Figure 10.
Responsive reserve capacity of the EV aggregator and dedicated storage unit.

Figure 11.
Expected and actual power draw of all EVs.

Figure 12.
Expected and actual power draw of the energy storage unit at 2 August 2010.

Figure 13.
Expected and actual profits for the case of operating the EV aggregator.

Figure 14.
Expected and actual profits for the case of operating the energy storage unit.

Figure 15.
Actual degradation cost for the cases of the EV aggregator and energy storage unit.

Figure 16.
EV charging cost for the cases of EV aggregation vs. the no EV aggregation.

© 2019 by the authors. Licensee MDPI, Basel, Switzerland. This article is an open access article distributed under the terms and conditions of the Creative Commons Attribution (CC BY) license (http://creativecommons.org/licenses/by/4.0/).
Share and Cite
MDPI and ACS Style
Aldik, A.; Khatib, T. EV Aggregators and Energy Storage Units Scheduling into Ancillary Services Markets: The Concept and Recommended Practice. World Electr. Veh. J. 2020, 11, 8. https://doi.org/10.3390/wevj11010008
AMA Style
Aldik A, Khatib T. EV Aggregators and Energy Storage Units Scheduling into Ancillary Services Markets: The Concept and Recommended Practice. World Electric Vehicle Journal. 2020; 11(1):8. https://doi.org/10.3390/wevj11010008
Chicago/Turabian StyleAldik, Abdelrahman, and Tamer Khatib. 2020. "EV Aggregators and Energy Storage Units Scheduling into Ancillary Services Markets: The Concept and Recommended Practice" World Electric Vehicle Journal 11, no. 1: 8. https://doi.org/10.3390/wevj11010008