
Driving Behavior and Decision Mechanisms in Emergency Conditions
by
 ,
,
Ying Lyu
1,2, 
Yiteng Sun
1,
Tianyao Zhang
1,
Debao Kong
2,
Zheng Lv
2,
Yujie Liu
2 and
Zhenhai Gao
1,* 1
State Key Laboratory of Automotive Simulation and Control, Jilin University, Changchun 130025, China
2
State Key Laboratory of Comprehensive Technology on Automobile Vibration and Noise & Safety Control, Changchun 130025, China
*
Author to whom correspondence should be addressed.
World Electr. Veh. J. 2022, 13(4), 62; https://doi.org/10.3390/wevj13040062
Submission received: 13 December 2021
/
Revised: 21 March 2022
/
Accepted: 23 March 2022
/
Published: 1 April 2022
Abstract
:In this article we used simulator experiments to explore the intelligent mechanisms of human decision-making. Three types of typical emergency scenarios were used in the experiment, in which Scenario 1 was used to analyze the driver’s choice to protect themselves or to protect pedestrians in emergency situations. Scenario 2 was compared with Scenario 1 to verify whether the driver’s avoidance behavior to protect pedestrians was instinctive or selective. Scenario 3 was to verify whether the driver would follow the principle of damage minimization. The driver’s decisions and actions in emergency situations, from the cumulative frequency of time to collision (TTC) to the maximum steering wheel angle rate during the experiments, were recorded. The results show that the driver was not just instinctively avoiding the immediate obstacle, but more selectively protecting pedestrians. At the same time, the time taken up by the driver’s instinctive avoidance response also had a negative impact on decision-making. The actual decisions of the driver were analyzed to provide a basis for building up the ethical decision-making of autonomous vehicles.
1. Introduction
As a solution to replace human driving, an automatic driving system contains many human driving behaviors and habits behind its design ideas and solutions. In current autonomous driving technology there is a lack of comprehensive consideration of ethics, traffic laws, and other ethical theories. For example, the “tram problem” [1]; there are 5 people on one side of the tramway and only one person on the other side. When an accident cannot be avoided, should one person be sacrificed to save more lives? Especially for autonomous vehicles, the problem becomes more acute when the decision maker is the algorithm. At present, the frequent accidents of autonomous cars have made them less popular with people [2]. Ethical dilemmas pose another set of challenges for the adoption of autonomous cars. In previous research, MIT has adopted the Moral Machine website, which allows visitors to the website to make decisions under the multiple dilemmas designed from the perspective of bystanders [3]. They can make choices by clicking on the pictures, and they can also compare the results of other people’s choices and make comparisons to understand the general value tendencies of society and the differences to one’s own choice tendency. Furthermore, Bonnefon’s research [4] concluded through a series of experiments that people generally accept “utilitarian autonomous cars”, that is, an autonomous vehicle selection algorithm based on the principle of minimizing total loss. Edmond Awad’s research expanded the sample size and scope to assess demographic and cultural moderators of ethical preferences [5]. The above surveys were conducted in the form of questionnaires and pictures for data statistics. Choices made by the participants from different angles are also different. When the situation is particularly critical, the driver may rely more on instinctive reaction. Therefore, the choices made by the subjects in the questionnaire may also be different from their real choices. At the same time, smart cars should also be more humane, and the reaction of real drivers can be used as an important reference. Experiments show that there is a difference between the actual driving process and the choice of questionnaire responses [6]. Most people refrain from acting in a purely self-interested manner in economic games, but different cultures have different expectations about what constitutes fair behavior [7]. Every culture prohibits at least some form of homicide, while disagreeing about which exact form of homicide is wrong [8,9,10]. Each of these factors has a strong causal influence on the fatality risk for the passengers of the self-driving car [11,12,13]. Autonomous vehicles have the potential to benefit the world by increasing traffic efficiency [14], reducing pollution [15], and eliminating up to 90% of traffic accidents [16]. The distribution of well-being and harm inevitably creates tradeoffs, the resolution of which falls in the moral domain [17,18,19]. Figuring out how to build ethical autonomous machines is one of the thorniest challenges in artificial intelligence [20]. To solve the above problems, we conducted ethical decision-making experiments in the form of a driving simulator in order to give the participants an immersive feeling to obtain more instinctive and true-choice results. According to the vehicle dynamics information, the decision-making behaviors and the operation of the car by the driver throughout the whole process are analyzed in detail to provide a basis for the ethical decision-making of the self-driving car.
2. Experiment Methods
As the questionnaire cannot accurately obtain the driver’s more realistic reactions and decisions, this experiment mainly used a simulator experiment. Simulator experiments can give the testers a more realistic feeling, under the premise of ensuring the safety of the testers. The simulator used the Panosim software platform as the simulation platform. The hardware mainly included a force feedback steering wheel, pedals, and shift levers. The internal model relayed data to Simulink in order to collect and store car kinematic parameters such as speed, lateral position, longitudinal position, and yaw angle in real time. Additional parameters included steering wheel angle, brake pedal position, throttle opening, and other information reflecting the driver’s actions.
The participants tested in the experiment were 31 volunteers aged between 22 and 39 (the average age was 26.3 years, the standard deviation was 4.2), and the volunteers’ driving experience ranged from 6 months to 12 years (the average driving experience was 3.2 years, the standard deviation was 2.8), The average driving distance was 16,000 km, and the standard deviation was 2.2. All test subjects had a Chinese legal motor vehicle driver’s license and had normal or normal vision after correction. Before the experiment, they had a good rest, had not taken drugs or alcohol that could affect driving, had no heart or nervous system diseases, and had no simulator vertigo or similar simulator-adverse reactions. After 10 min of free driving, once the driver was familiar with the simulator and the driving operation of the simulator, a formal experiment was carried out. As shown in Figure 1, the experimental scenarios were divided into the following three types: 1. In the case of brake failure, a pedestrian suddenly appeared in front of the car in its the current lane, and there were roadblocks in the adjacent lane; 2. In the case of brake failure, there was a roadblock directly ahead, and there were pedestrians in the adjacent lane; 3. In the case of brake failure, there were 5 pedestrians in the lane directly in front of the car and 1 pedestrian in the adjacent lane.
To reserve enough time for the driver to judge and react and at the same time not to allow the driver to stop the car early due to sufficient time, the design of Scenario 1 set the car in the right lane at a speed of 50 km/h. In the side lane, the car cruised at a constant speed. At this point, the brake suddenly failed, a pedestrian appeared in front of the vehicle in the same lane, and there were obstacles ahead in the adjacent lane (the driver could choose to protect themselves and continue straight and hit the pedestrian or turn to avoid the pedestrian and hit the roadblock. To explore whether the driver’s steering behavior in Scenario 1 was entirely an instinctual avoidance response or whether their decision-making considered the protection of pedestrians, an experiment in Scenario 2 was designed as a control group for Scenario 1. In this simulation, the car was set to cruise at a constant speed of 50 km/h. At which point, the brake suddenly failed, and the driver was only able to control the steering wheel. There was a roadblock ahead in the current lane, and there was a pedestrian in the adjacent lane. The tester could avoid the roadblock by turning but would then crash into the pedestrian or they could continue straight ahead to hit the roadblock. To study whether the driver’s decision would be based on the principle of the lowest total injury in real driving and the difference between instinctive reaction and thinking after planning, Scenario 3 was carried out. There were 5 pedestrians ahead of the car in its current lane and 1 pedestrian in the adjacent lane. The tester could turn to hit a single pedestrian or continue straight ahead and crash into 5 pedestrians. This scenario appeared twice during the test.
3. Results
Scenario 1 was designed to investigate whether drivers would crash into obstacles to protect pedestrians. From the experimental results, most drivers chose to brake (66.29%) in crisis situations. In an emergency, due to the short decision-making time, when it is too late to decide, the driver will subconsciously perform emergency braking to avoid or minimize the risk. The experimental data shows that 20.57% of the time, when the driver has no time to react in a crisis, they choose to go with the flow. This is because when the situation was urgent, some drivers were still in the decision-making stage or were shocked by the sudden arrival of the scenario, so they could not respond. Hedging behavior. Only a small part of the experimental data shows that the driver adopted steering or steering and braking behaviors (11.71%, 1.43%, respectively) to avoid risks.
In-depth explorations of the driver’s decision-making mechanisms in emergency situations, data processing of collected vehicle dynamic parameters, time to collision (TTC), steering wheel angle change rate, and other relationships were obtained.
The steering wheel angle data was de-noised and smoothed, and the curve of the steering wheel angle over time was drawn. Figure 2 shows the change of the steering wheel angle of a driver before the accident in Scenario 1. The red line in the figure is the time of the collision. It can be seen that 1.31 s before the collision, the subject began to turn to the left to avoid pedestrians. Then the steering wheel angle changes to a negative when the driver reversed the direction to correct body position. To further explore the influencing factors that affect the driver’s decision before the collision, the moment when the car steering wheel had a slight angle input (the steering wheel angle is greater than 8°) was taken as the moment when the driver started to control the car, and the time remaining before the collision was counted. The horizontal axis is the time left before the collision occurs before the driver starts to control the car, and the vertical axis is the proportion of the number of people who have already turned by that point. This result is shown in Figure 3.
Half of the drivers began to control the vehicle 2 s before the collision (Figure 3). The steeper the curve in the figure, the more people started the steering action during that period. It is not difficult to see that most drivers start the steering movement from 3 s before the collision to 1 s before the collision. The time left to collision from when the driver who chose to turn to hit the roadblock in Scenario 1 started to control the car and the time left to the collision from when the driver who chose to hit the pedestrian took control of the car are plotted as box diagrams in Figure 4.
The upper and lower quartiles, median, etc., of the time remaining to the collision, when the subject who chose to crash into the pedestrian starts to control the vehicle is less than the test subject who crashed into the roadblock, indicating that the final result is a pedestrian crash. When the test subjects started to control the car, the time left before the collision was relatively short, so there is the possibility that they wanted to protect the pedestrian by turning, but due to insufficient time crashed into the pedestrian. To explore whether the result of choosing to hit a pedestrian was due to lack of time, the steering failed. The data collected in the experiment and the selected parameters of the steering wheel angle rate for auxiliary analysis were retaken. The period before the collision was divided into several time windows, the data collection frequency was 100 Hz, the steering wheel angle derivative at each time was calculated at equal intervals, the steering wheel angle derivative at each time during each time window was averaged, and this value was recorded as the steering wheel rotation rate. The steering wheel angle rate reflects the intensity of the subject’s steering wheel operation. The relationship between the maximum steering wheel angle rate of the subject who turned into a roadblock in Scenario 1 and the remaining time to the collision from the start of the steering action is shown in Figure 5.
It can be seen from Figure 5 that if a driver chose to hit a roadblock, when they started to turn the time left until the collision occurred was shorter, especially when the time was less than 2 s, and the maximum steering wheel angle rate during the action increased significantly. The reason for this is that the smaller the TTC, the more vigorously drivers need to turn the steering wheel to avoid pedestrians.
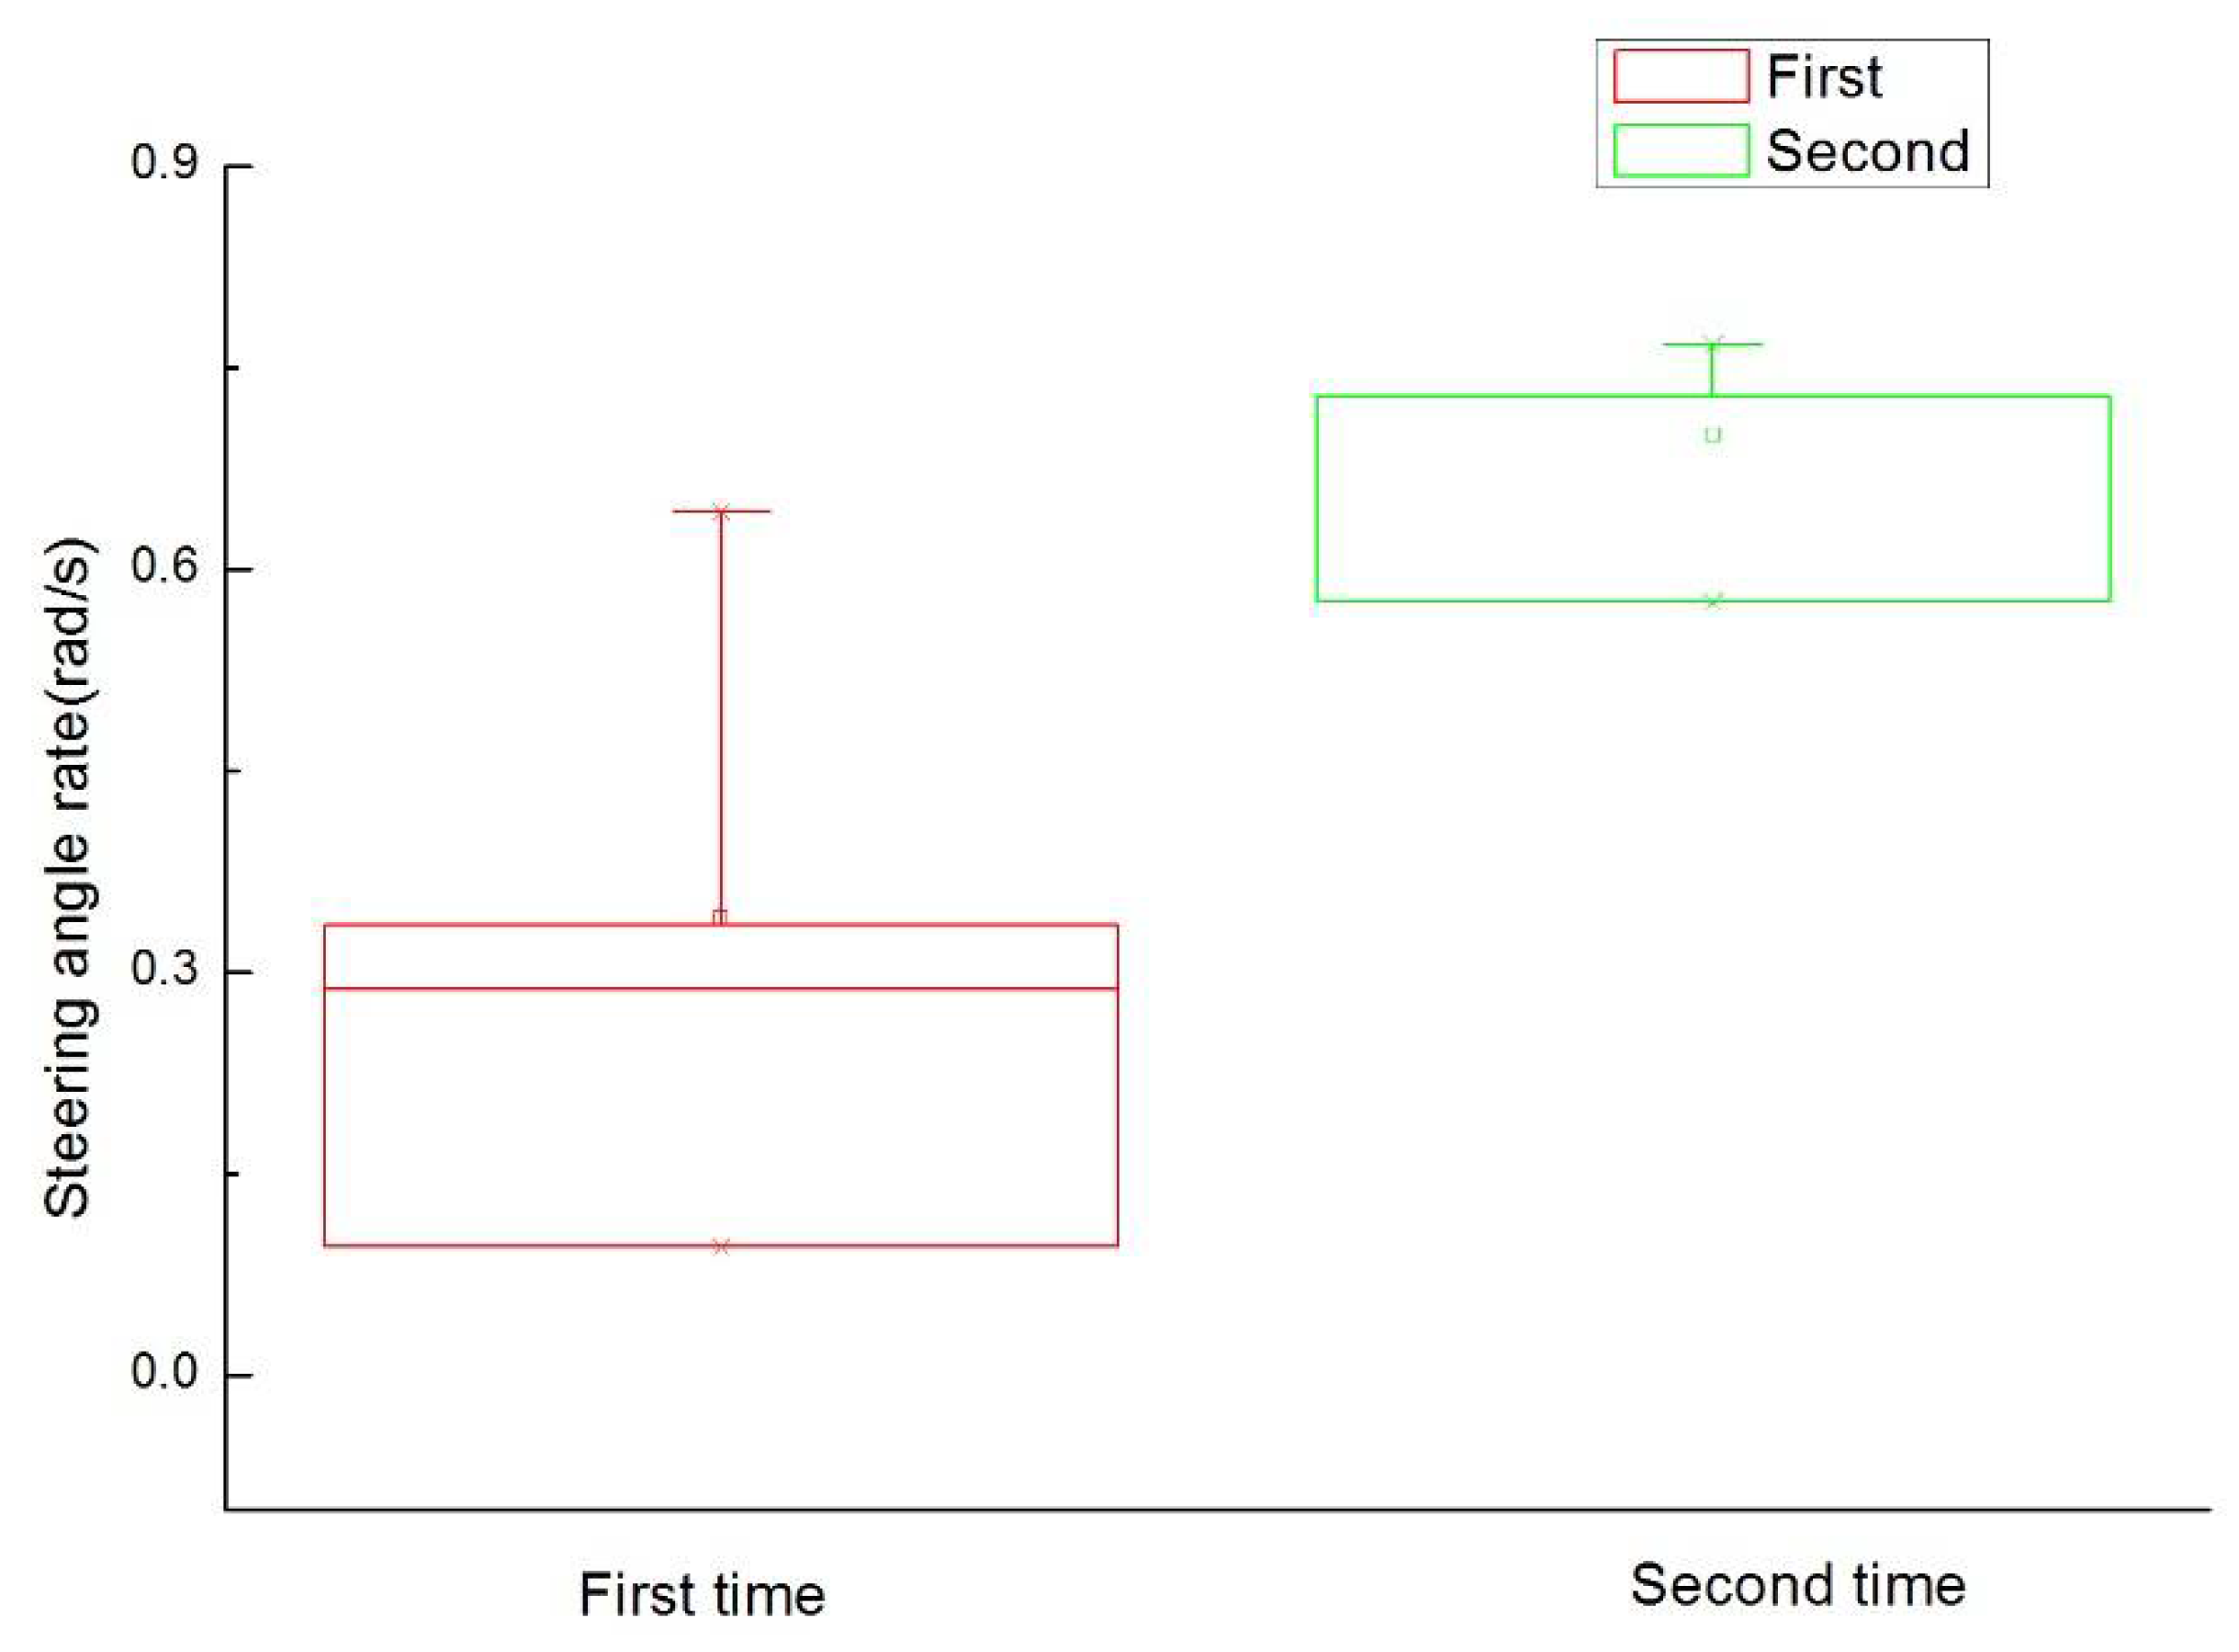
In Scenario 2, most drivers (75%) ended up hitting the roadblock. However, during the experiment, only one-third of the participants remained in the lane of the roadblock, and the rest of the participants swerved towards the pedestrian. When the 12 participants in this scene found that there was a roadblock ahead in their current lane, except for four drivers who still chose to stay in the lane where the roadblock was located, the other eight drivers all performed a vigorous steering action. Only two drivers turned towards the pedestrians to avoid obstacles, and the remaining six drivers chose to turn towards the roadblocks in the original lane or crashed into the roadside roadblocks. The driver does have the instinctive behavior to avoid the target in front of them in a critical situation, but many drivers made two turns in the second scenario (Figure 6). The first turn was to avoid the barricade to protect themselves, and the second was to avoid pedestrians and hit the barricade. Therefore, the driver does have an instinct to steer in a way that avoids any target ahead, but when the avoidance behavior may endanger the pedestrian on the road, drivers would even choose to drive back to the original lane to protect the pedestrian.
Scenarios 1 and 2 are combined to explore whether the driver intentionally avoided pedestrians, or just instinctively avoided any obstacles that appeared in their current lane. The Fisher exact test was performed on the two scenarios from experiments 1 and 2, and the results were p = 0.0003647 < 0.05. This indicates that the target in the lane ahead of them had no significant impact on the driver’s decision to prioritize pedestrian protection. The driver’s steering and avoidance behavior was not only to avoid the current lane target, but also reflected the selective priority to protect pedestrians.
The design of Scenario 3 is mainly to explore whether human drivers follow the principle of least harm in critical situations. Among the 13 participants, 30.77% chose to keep to the original lane and hit 5 pedestrians, and 53.85% chose to turn right and hit 1 person. The other 15.38% chose to continue to turn right and drive straight out of the lane. This shows that more than half of the subjects choose to comply with the principle of minimum total damage in this dilemma.
4. Discussion
The following conclusions can be drawn from the experimental results. In actual experiments, most drivers did not only consider their own safety, but gave priority to the safety of vulnerable groups on the road, namely pedestrians, and their steering behaviors was not only an instinctive reaction. Through the comparative analysis of the results of Scenarios 1 and 2, drivers did have the instinct to steer to avoid any target ahead, but when the avoidance behavior may have endangered pedestrians on the road, the driver even chose to drive back into their original lane. It can be seen from these behaviors that most drivers paid more attention to the safety of pedestrians on the road when both the occupants in the car and pedestrians on the road were threatened at the same time and chose to give priority to the protection of pedestrians, even if their own safety was be threatened. It was a selective decision made under the principle of giving priority to pedestrian protection.
In general, most drivers agreed with the principle of minimum total harm, while the participants who did not show compliance with the principle of minimum total harm after the end of the experiment said that they did not pay special attention to the number of pedestrians on both sides in the emergency of the experiment. In an emergency, the drivers were more concerned about the type and characteristics of the target object and were able to quickly decide to prioritize pedestrian protection. However, the sensitivity to the difference in the number of pedestrians in Scenario 3 was not as good as that to two different targets. Therefore, participants who did not follow the principle of minimum total damage in Scenario 3 did not agree with their choice in the experiment, which also shows that the driver’s decisions in critical situations are not optimal solutions. However, the sensors equipped in smart cars can easily identify the difference in quantity, which can help the driver realize his driving decision-making intention more perfectly and reduce the possible injuries caused by traffic accidents. The driver’s decisions in critical situations are more than just a few choices. In follow-up research, we will explore how to help drivers better realize their driving decision-making intentions with the help of smart cars equipped with sensors.
Author Contributions
Conceptualization, Y.L. (Ying Lyu) and Z.G.; methodology, Y.S.; software, T.Z.; resources, D.K.; data curation, Z.L. and Y.L. (Yujie Liu). All authors have read and agreed to the published version of the manuscript.
Funding
This research was funded by The Open Fund of State Key Laboratory of Comprehensive Technology on Automobile Vibration and Noise & Safety Control, grant number FAWSKL2020KFJJB2.
Institutional Review Board Statement
Not applicable.
Informed Consent Statement
Informed consent was obtained from all subjects involved in the study.
Data Availability Statement
The data presented in this study are available on request from the corresponding author.
Conflicts of Interest
The authors declare no conflict of interest.
References
- Foot, P. The Problem of Abortion and the Doctrine of Double Effect’, in her Virtues and Vices. In FootThe Problem of Abortion and the Doctrine of the Double Effect19Virtues and Vices1978; University of California Press: Berkeley/Los Angeles, CA, USA, 1978; pp. 19–32. [Google Scholar]
- McFarland, M. Who’s Responsible When an Autonomous Car Crashes? Available online: https://www.karnskerrisonlaw.com/blog/2021/september/who-is-responsible-for-self-driving-car-accident/#:~:text=The%20liable%20party%20will%20likely,the%20eyes%20of%20the%20law (accessed on 2 July 2020).
- MoralMachine. Available online: https://www.moralmachine.net/ (accessed on 8 July 2018).
- Bonnefon, J.-F.; Shariff, A.; Rahwan, I. The social dilemma of autonomous vehicles. Science 2016, 352, 1573–1576. [Google Scholar] [CrossRef] [PubMed] [Green Version]
- Awad, E.; Dsouza, S.; Kim, R.; Schulz, J.; Henrich, J.; Shariff, A.; Bonnefon, J.F.; Rahwan, I. The moral machine experiment. Nature 2018, 563, 59–64. [Google Scholar] [CrossRef] [PubMed]
- Gao, Z.; Sun, Y.; Hu, H.; Zhang, T.; Gao, F. Investigation of the instinctive reaction of human drivers in social dilemma based on the use of a driving simulator and a questionnaire survey. Traffic Inj. Prev. 2020, 21, 254–258. [Google Scholar] [CrossRef] [PubMed]
- Henrich, J.; Boyd, R.; Bowles, S.; Camerer, C.; Fehr, E.; Gintis, H.; McElreath, R.; Alvard, M.; Barr, A.; Ensminger, J.; et al. “Economic man” in cross-cultural perspective: Behavioral experiments in 15 small-scale societies. Behav. Brain Sci. 2005, 28, 795–815. [Google Scholar] [CrossRef] [PubMed] [Green Version]
- Hoebel, E.A. The Law of Primitive Man: A Study in Comparative Legal Dynamics; Harvard University Press: Cambridge, MA, USA, 2009. [Google Scholar]
- Mikhail, J. Is the Prohibition of Homicide Universal-Evidence from Comparative Criminal Law. Brook. L. Rev. 2009, 75, 497. [Google Scholar]
- Awad, E.; Dsouza, S.; Shariff, A.; Rahwan, I.; Bonnefon, J.F. Universals and variations in moral decisions made in 42 countries by 70,000 participants. Proc. Natl. Acad. Sci. USA 2020, 117, 2332–2337. [Google Scholar] [CrossRef] [PubMed] [Green Version]
- Nyholm, S.; Smids, J. The ethics of accident-algorithms for self-driving cars: An applied trolley problem? Ethical Theory Moral Pract. 2016, 19, 1275–1289. [Google Scholar] [CrossRef] [Green Version]
- Evans, L. Causal influence of car mass and size on driver fatality risk. Am. J. Public Health 2001, 91, 1076. [Google Scholar] [PubMed] [Green Version]
- Gogoll, J.; Müller, J.F. Autonomous cars: In favor of a mandatory ethics setting. Sci. Eng. Ethics 2017, 23, 681–700. [Google Scholar] [CrossRef] [PubMed]
- Van Arem, B.; Van Driel, C.J.; Visser, R. The impact of cooperative adaptive cruise control on traffic-flow characteristics. IEEE Trans. Intell. Transp. Syst. 2006, 7, 429–436. [Google Scholar] [CrossRef] [Green Version]
- Spieser, K.; Treleaven, K.; Zhang, R.; Frazzoli, E.; Morton, D.; Pavone, M. Toward a systematic approach to the design and evaluation of automated mobility-on-demand systems: A case study in Singapore. In Road Vehicle Automation; Springer: Cham, Switzerland, 2014; pp. 229–245. [Google Scholar]
- Gao, P.; Hensley, R.; Zielke, A. A Road Map to the Future for the Auto Industry. McKinsey Quarterly. 2014. Available online: https://www.mckinsey.com/industries/automotive-and-assembly/our-insights/a-road-map-to-the-future-for-the-auto-industry (accessed on 2 July 2020).
- Greene, J.D. Moral Tribes: Emotion, Reason, and the Gap between Us and Them; Penguin: London, UK, 2013. [Google Scholar]
- Tomasello, M. A Natural History of Human Thinking; Harvard University Press: Cambridge, MA, USA, 2014. [Google Scholar]
- Cushman, F.; Young, L. The psychology of dilemmas and the philosophy of morality. Ethical Theory Moral Pract. 2009, 12, 9–24. [Google Scholar] [CrossRef]
- Deng, B. Machine ethics: The robot’s dilemma. Nature 2015, 523, 24. [Google Scholar] [CrossRef] [PubMed]
Figure 1.
Three traffic situations in the simulator. The participant could decide to (A) hit several pedestrians or swerve to hit one pedestrian, (B) hit the pedestrian or swerve to hit the barrier, and (C) hit the barrier or swerve to hit the pedestrian.
Figure 1.
Three traffic situations in the simulator. The participant could decide to (A) hit several pedestrians or swerve to hit one pedestrian, (B) hit the pedestrian or swerve to hit the barrier, and (C) hit the barrier or swerve to hit the pedestrian.
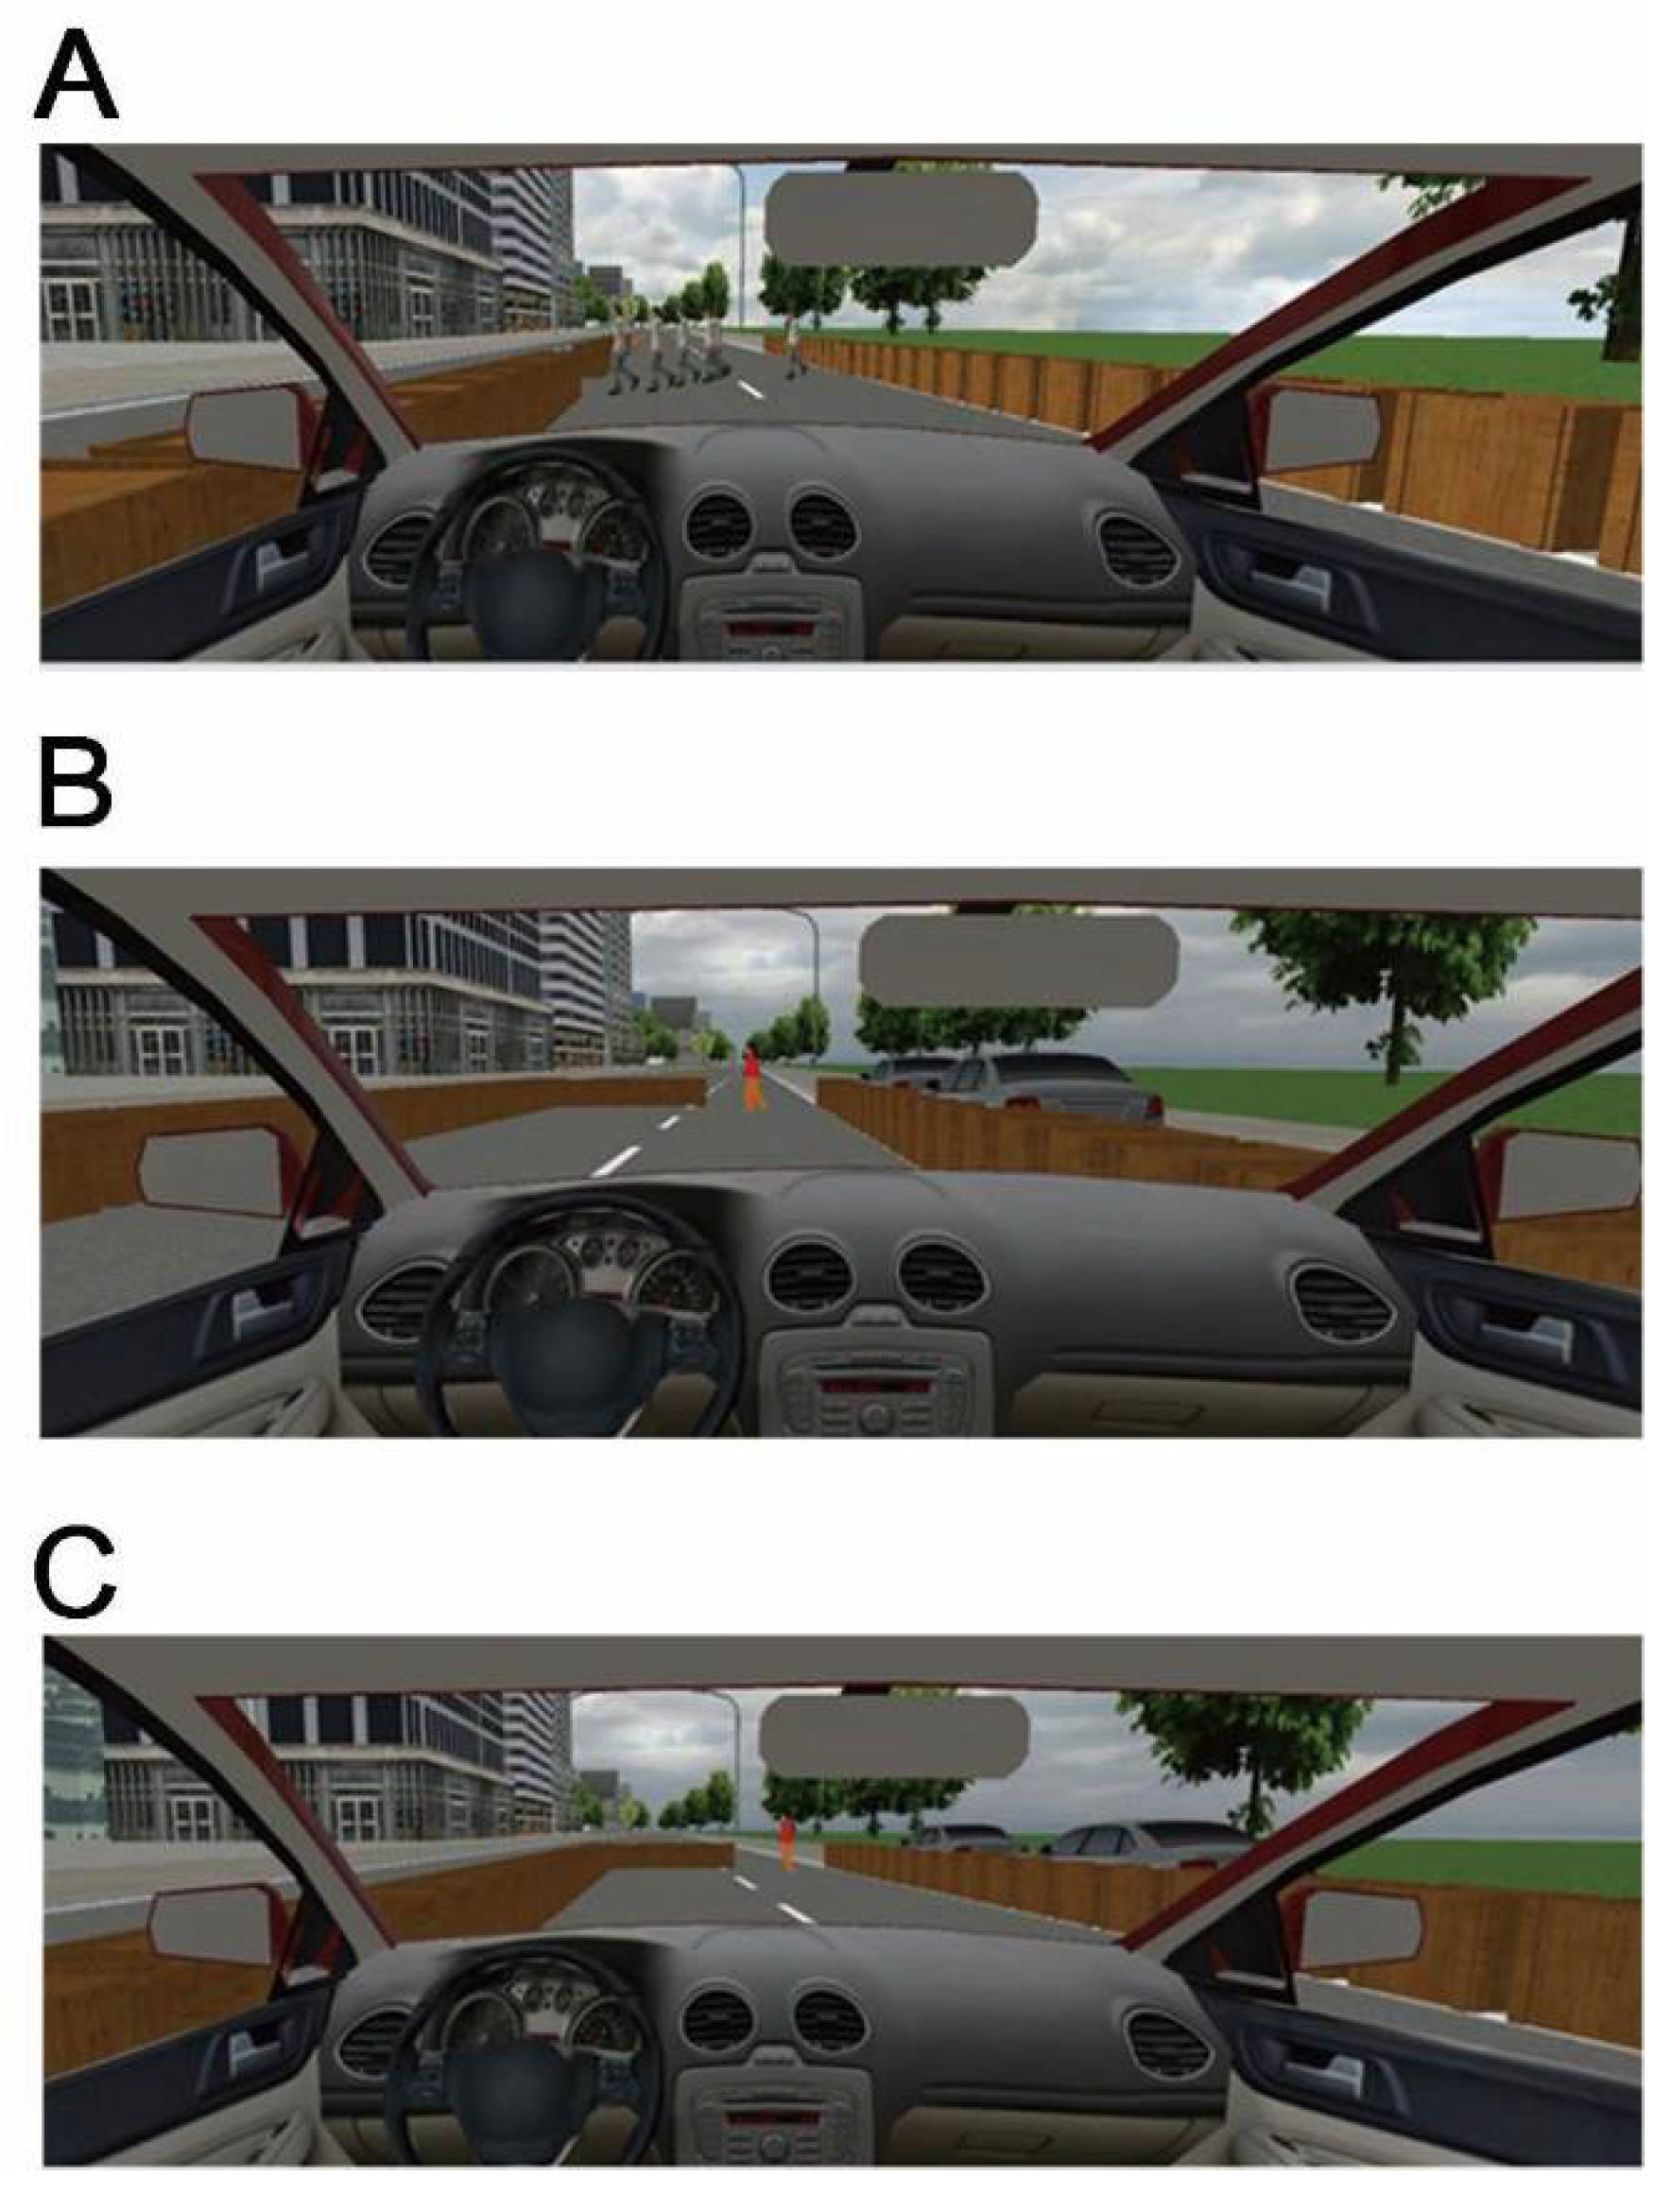
Figure 2.
The relationship between steering wheel angle and time.

Figure 3.
TTC cumulative frequency chart.
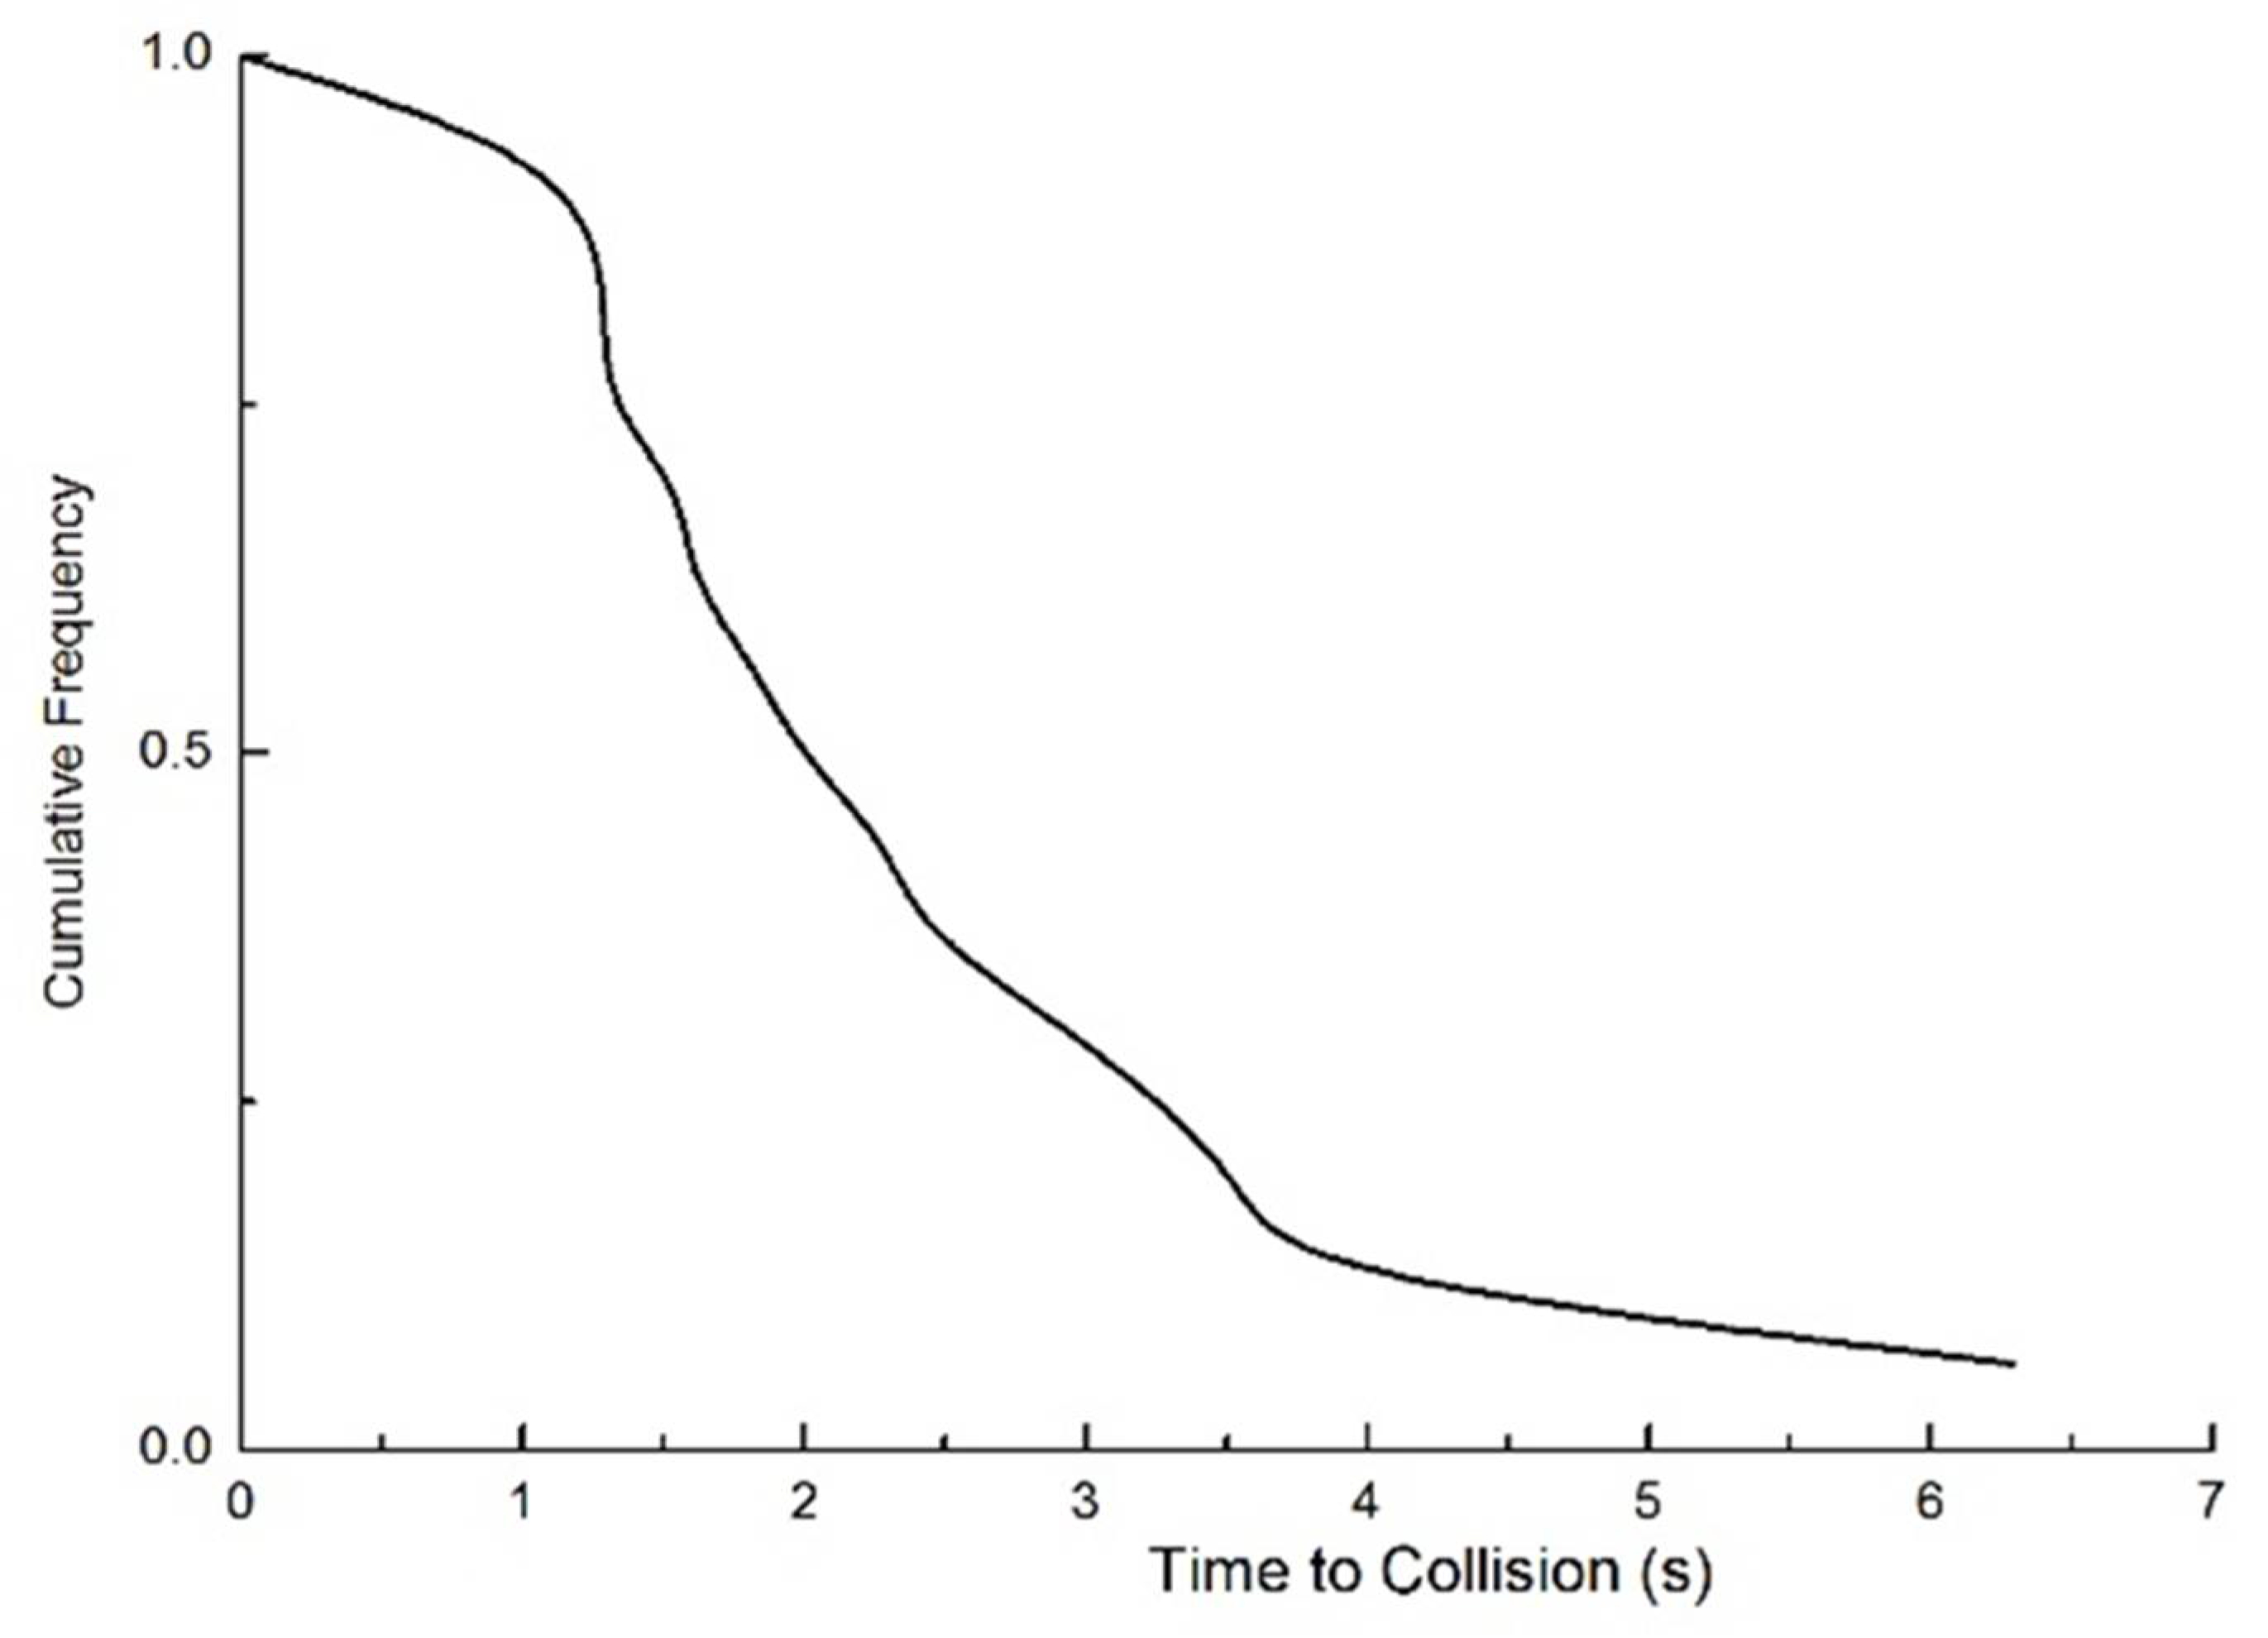
Figure 4.
TTC comparison chart from when the driver starts to control the car.
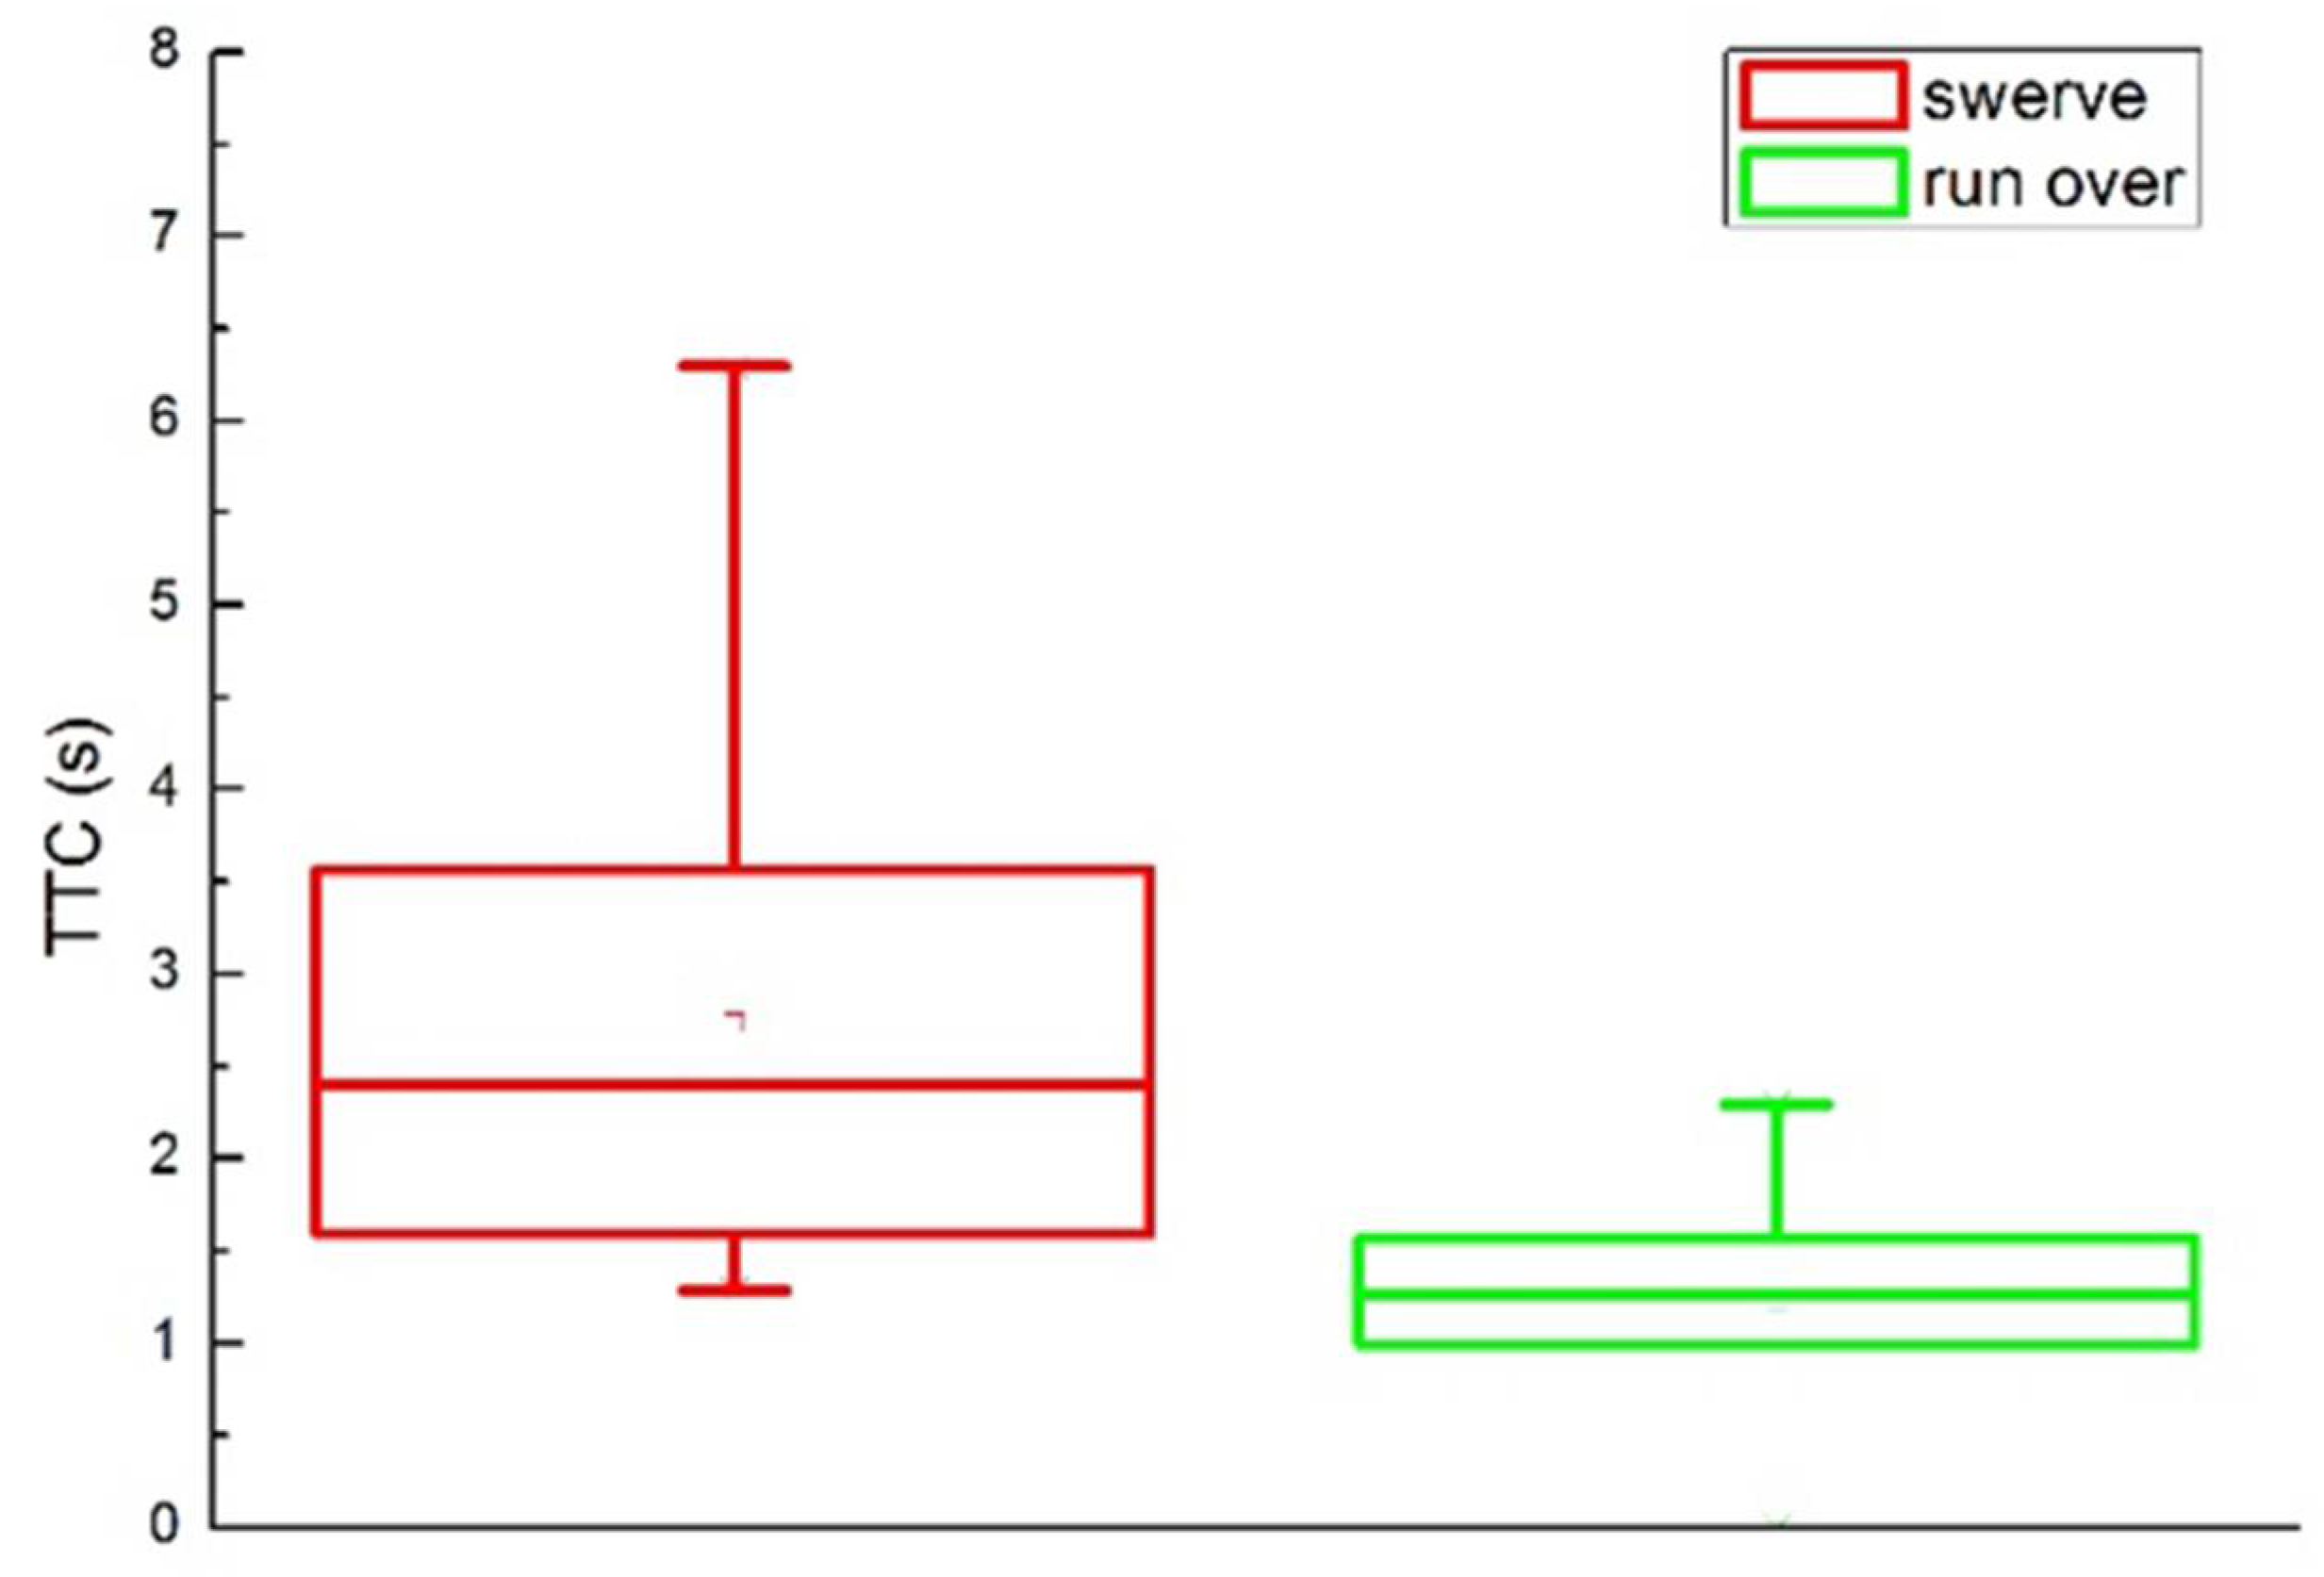
Figure 5.
The relationship between the maximum steering wheel angle rate and the TTC when starting to control the car.
Figure 5.
The relationship between the maximum steering wheel angle rate and the TTC when starting to control the car.

Figure 6.
Comparison of steering wheel angle rates.
Publisher’s Note: MDPI stays neutral with regard to jurisdictional claims in published maps and institutional affiliations. |
© 2022 by the authors. Licensee MDPI, Basel, Switzerland. This article is an open access article distributed under the terms and conditions of the Creative Commons Attribution (CC BY) license (https://creativecommons.org/licenses/by/4.0/).
Share and Cite
MDPI and ACS Style
Lyu, Y.; Sun, Y.; Zhang, T.; Kong, D.; Lv, Z.; Liu, Y.; Gao, Z. Driving Behavior and Decision Mechanisms in Emergency Conditions. World Electr. Veh. J. 2022, 13, 62. https://doi.org/10.3390/wevj13040062
AMA Style
Lyu Y, Sun Y, Zhang T, Kong D, Lv Z, Liu Y, Gao Z. Driving Behavior and Decision Mechanisms in Emergency Conditions. World Electric Vehicle Journal. 2022; 13(4):62. https://doi.org/10.3390/wevj13040062
Chicago/Turabian StyleLyu, Ying, Yiteng Sun, Tianyao Zhang, Debao Kong, Zheng Lv, Yujie Liu, and Zhenhai Gao. 2022. "Driving Behavior and Decision Mechanisms in Emergency Conditions" World Electric Vehicle Journal 13, no. 4: 62. https://doi.org/10.3390/wevj13040062