
A Smart Battery Management System for Electric Vehicles Using Deep Learning-Based Sensor Fault Detection


1
Electrical and Computer Engineering, Lawrence Technological University, Southfield, MI 48075, USA
2
Electrical Engineering, University of Cincinnati, Cincinnati, OH 45221, USA
*
Author to whom correspondence should be addressed.
World Electr. Veh. J. 2023, 14(4), 101; https://doi.org/10.3390/wevj14040101
Submission received: 1 March 2023
/
Revised: 31 March 2023
/
Accepted: 3 April 2023
/
Published: 10 April 2023
Abstract
:Battery sensor data collection and transmission are essential for battery management systems (BMS). Since inaccurate battery data brought on by sensor faults, communication issues, or even cyber-attacks can impose serious harm on BMS and adversely impact the overall dependability of BMS-based applications, such as electric vehicles, it is critical to assess the durability of battery sensor and communication data in BMS. Sensor data are necessary for a BMS to perform every operation. Effective sensor fault detection is crucial for the sustainability and security of electric vehicle battery systems. This research suggests a system for battery data, especially lithium ion batteries, that allows deep learning-based detection and the classification of faulty battery sensor and transmission information. Initially, we collected the sensor data, and preprocessing was carried out using z-score normalization. The features were extracted using sparse principal component analysis (SPCA), and enhanced marine predators algorithm (EMPA) was used for feature selection. The BMS’s safety and dependability may be enhanced by the suggested incipient bat-optimized deep residual network (IB-DRN)-based false battery data identification and classification system. Simulations using MATLAB (2021a), along with statistics, machine learning, and a deep learning toolbox, along with experimental research, were used to show and assess how well the suggested strategy performs. It is shown to be superior to traditional approaches.
1. Introduction
The transportation sector is responsible for a significant proportion of greenhouse gas emissions and environmental degradation. However, the development of battery-powered energy storage devices, including electric vehicles, hybrid locomotives, and other e-mobility applications, has the potential to positively impact this sector. Energy storage systems are essential components of smart grid and electric vehicle technologies, enabling the efficient transmission and distribution of energy. With a variety of batteries available on the market, there are numerous options for energy storage purposes.
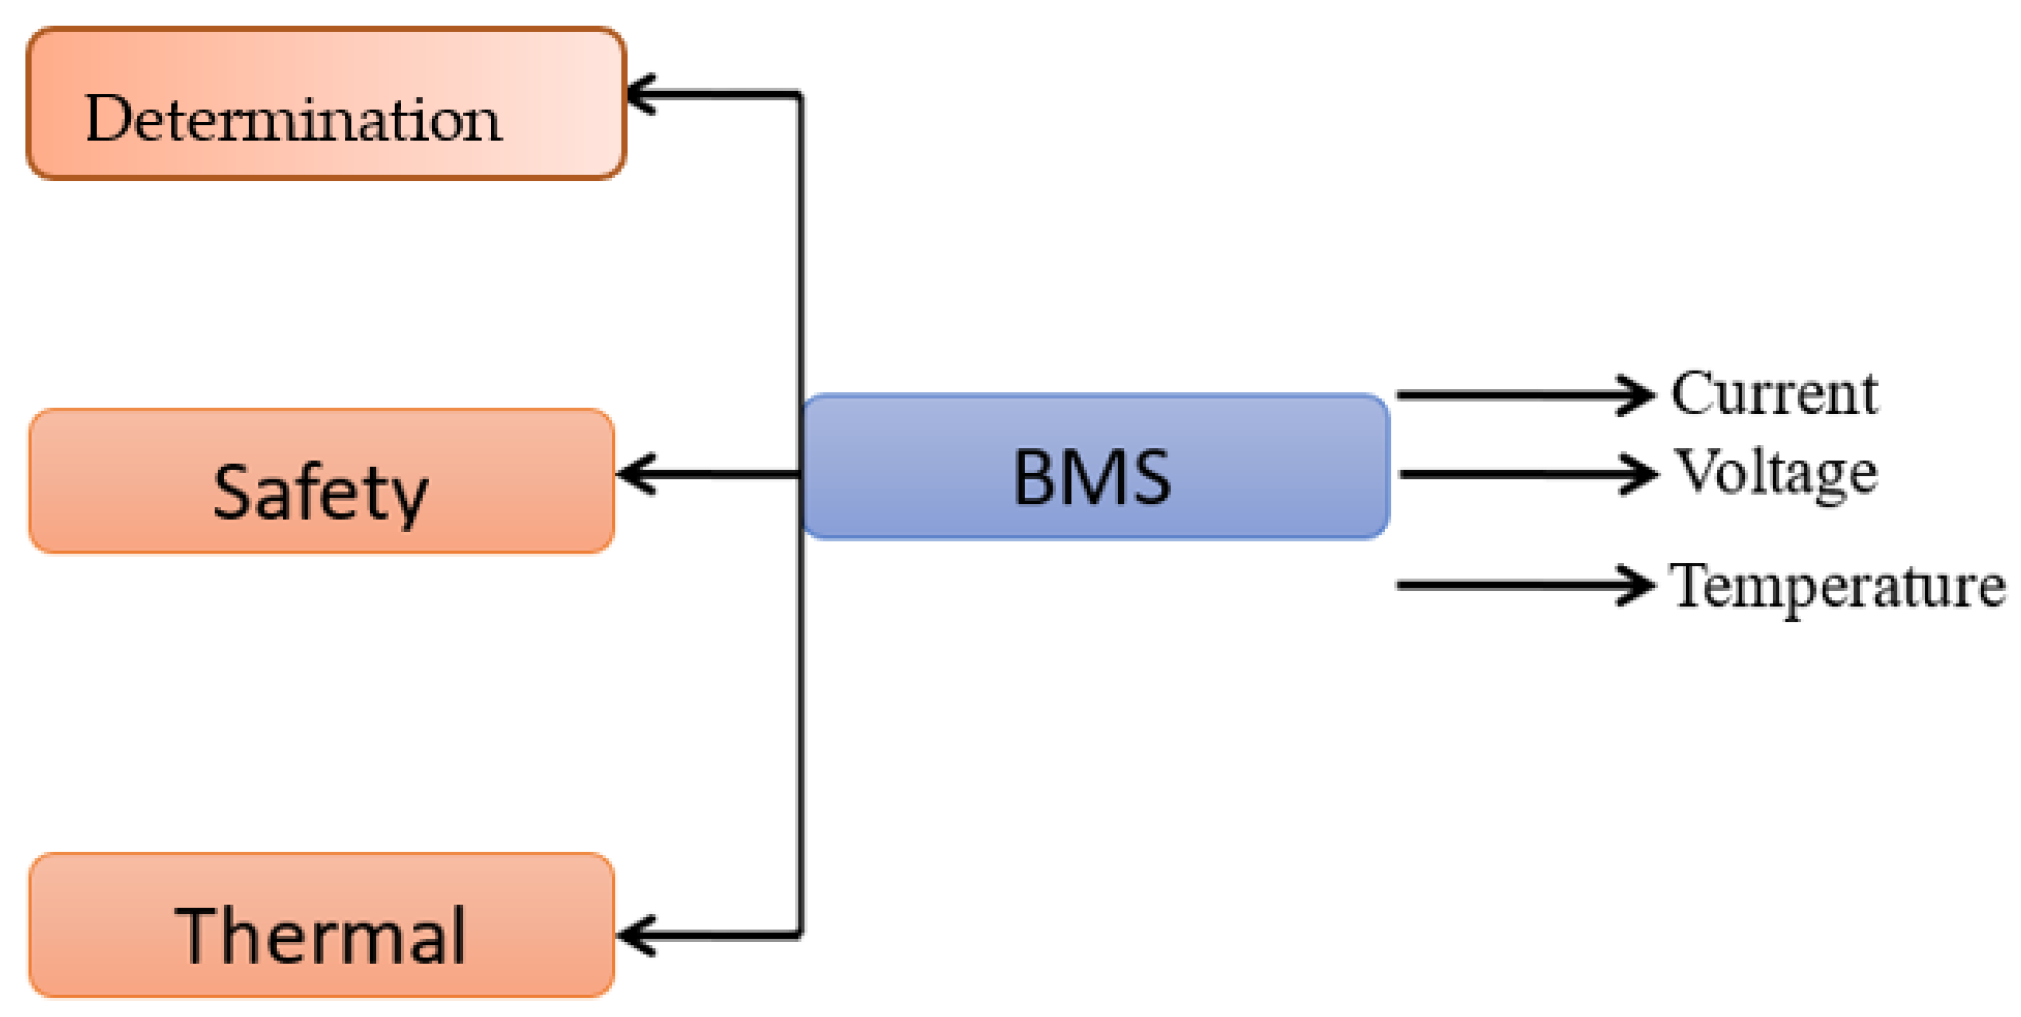
For EV applications, battery heat control is crucial. Internationally, EV charging stations are extensively utilized, and ports at both private and public charging stations have been increased [1]. Due to the growing dependence on EVs, high voltages, high efficiency, and longer life-span battery systems are necessary, requiring improved battery monitoring techniques. Electric vehicles employ battery management systems (BMS) to monitor, regulate, and shield Li-ion batteries from harsh conditions and abuse. Cell balancing, which occurs as a result of differences in a cell impedance, temperature, and self-discharge characteristics, is one of the crucial functions of BMS. Cell balancing systems are divided into passive and active types [2]. The battery management system may perform a wide range of tasks, but most academics concentrate on estimating the state of charge (SOC) and state of health (SOH), and fault diagnostic approaches received little attention until recent incidents involving battery systems in EVs. Additionally, if the acquisition sensor is faulty, other BMS activities that depend on data-gathering may be hampered, further affecting the battery system’s safety. Hence, sensor fault diagnostics is crucial for ensuring a BMS’s smooth functioning [3]. A overview block diagram for battery management system is demonstrated in Figure 1 below.
The battery management systems cannot function without the data that the current, voltage, and temperature sensors collect. Due to hundreds of such sensors used in electric vehicle battery packs to monitor the currents, voltages, and temperatures for each battery cell, the risk of a problem occurring in a single voltage or current sensor has considerably increased. A sensor malfunction may lead to poor battery performance or possibly significant safety risks [4]. The BMS in EVs consists of a large number of circuits, parts, power electronics, sensors, actuators, diodes, capacitors, inductors, transformers, switches, converters, and safety equipment, all of which are managed by a large number of algorithms, models, and control signals. The creation of suitable algorithms for BMSs has been the subject of much study. Model-based techniques and intelligent methods are the strategies used in BMSs the most often [5].
The organization of this paper is as follows: “Abbreviations and their Definitions” used in this research are detailed in Table 1 of the introductory section. Section 2 presents related works, while Section 3 overviews the methodology. Section 4 presents the performance analysis. Discussions are presented in Section 5, and finally, the conclusions are given in Section 6.
2. Related Works
The research in [6] provides a concise overview of several important BMS technologies, including battery modeling, state estimation, and battery charging. Prior to introducing the fundamental technologies employed in BMS, a study of prominent battery types used in EVs is conducted. An electric model, thermal model, and linked electro-thermal model are only a few of the battery models that are discussed. An improvement in the BMS’s high accuracy and reliable management is shown [7].
The paper [8] presented a summary of current ideas in cutting-edge systems and allowed the reader to estimate the factors that must be considered when building a BMS for a specific application. Several potential battery pack topologies and their effects on the complexity of the BMS were considered after a brief study of basic requirements [9].
The paper [10] supplied a comprehensive, current assessment of fast-charging techniques for battery electric vehicles (BEV). This research begins with fundamental ideas about the charging of a single battery cell and existing and potential charging standards. Then, several common power converter topologies used for this application are given.
The on-depth analyses of various EV range-extending technologies, such as internal combustors engines, free linear generators, fuel cell, micro gas turbines, and zinc-air batteries, are provided in [11].
Each range-extending technology is described along with its definition, operational principles, and most recent advancements. To assist in addressing future research requirements, a comparison of the various technologies is also offered, emphasizing their benefits and drawbacks.
The research in [12] developed the qualitative knowledge of a fire risks and hazards related to battery-powered EVs by evaluating battery fires in battery electric vehicles, hybrid EVs, and electric buses. Additionally, key battery fire features discovered via testing that are present in different EV fire situations were analyzed. For an electric vehicle, a modular battery managements system is suggested in [13].
Battery voltage, charging currents, discharging current, and temperature can all be precisely measured by the system, and it also can send the data to a mixed-signal processor for monitoring battery modules. In order to achieve the integrated optimization of the vehicle system, a unique Li-ion battery pack circuit, electric motor and power electronics cooling circuit, an air conditioning circuit, etc., and an integrated thermal system for vehicles are suggested in [14].
The paper [15] presented certain novel methods that have used to create a reliable battery management system. Accurate characterization, the reliable estimate of battery states and characteristics, and effective battery control mechanisms make up the approach to robust battery management.
The paper [16] offered a machine learning (ML)-based intelligent charging technique to decide when to charge an EV during a connection session. In order to reduce the total cost of vehicle energy, this was accomplished by making real-time charging choices based on a variety of auxiliary data, such as driving, environment, price, and demand time series.
The paper [17] suggested a deep learning and blockchain-based EV fault detection system to find many kinds of problems in vehicles, including battery, temperature, and tire pressure issues. Furthermore, to conduct the defect detection data transactions for EVs with high scalability and reliability, a fault tree analysis (FTA) is given in [18].
The paper [19] suggested a voltage problem diagnostic detection technique that was shown via an electric vehicle (EV) with a multiple-cell battery system under real-world operating conditions. This study reveals that the overvoltage problem for Li-ion batteries cell may be seen from the voltage curves after collecting and preparing the usual data periods from the Operation Service and Management Center for Electric Vehicles (OSMC-EV).
The paper [20] provided a pathway for detecting battery failure that is supported by deep learning models. This research provided a large dataset for electric vehicle (EV) batteries that included cleaned data on battery charging from hundreds of vehicles.
The paper [21] focused on defect detection using the interclass correlation coefficient (ICC) approach (EVs). The off-trend voltage drop was captured using the suggested approach to determine ICC values, and the voltages were taken from the Operation Service and Management Center for Electric Vehicles.
The paper [22] examined the specifics of BMS for stationary (large-scale) energy storage and electric vehicles. The examination covers a variety of BMS-related topics, such as testing, component functionality, topology, operation, architecture, and BMS safety issues.
The paper includes an assessment of the current standards and regulations related to BMS. It examines the technology of batteries, regulatory necessities, and safety factors of BMS before providing recommendations and implementing BMS to oversee and control the charging and discharging of rechargeable batteries, as referenced in [23,24,25,26].
Problem Statement
When a fault with a vehicle’s charging system causes the operating voltage to fall below 12 volts, a malfunction appears on the instrument cluster. However, because of their simplicity, electrical ECM-based techniques are used in most real systems. The three research issues facing modern BMS are safety, efficiency, and dependability. Issues concerning display screens, external door lights, broken temperature sensors, uneven paint, seals, and weather stripping are all common complaints from electric vehicle owners.
3. Methodology
Vehicle controllers or ECUs that impose deep-learning and model-tuning algorithms make use of input sensors data as mainstream to perform continuous learning through algorithms. The block diagram below represents sensor data collection and the processing of sensor data that are used for feature extraction and optimization in electric vehicle controllers. In addition, this paper focuses on techniques for deriving performance analysis from collected sensor data.
3.1. Process Overview
The article outlines a research principle that focuses on the deep learning-based sensor fault identification of BMS systems. The research is categorized into six critical steps, as represented in Figure 2—“Overview of Research Process”.
Step 1—The initial step involves collecting sensor data that reflect the battery’s outward features. New sensors, such as built-in pressure sensors and acoustic sensors, can be utilized to obtain parameters that characterize battery internal state information, which helps to achieve specific fault isolations accurately. Table 2 lists out the sensor sample data utilized for the research.
Step 2—Sample datasets from sensors undergo preliminary processing to ensure their plausibility and to normalize information using the Z-score, making them ready for primary processing and analysis.
Step 3—The sample datasets are fed into a feature extraction model that is based on the principle of the “sparse principal component analysis (SPCA)” theorem for data processing and reorganization from feature extractions.
Step 4 and Step 5—The extracted data are utilized for feature selection, which runs on the “marine predator’s algorithm” (MPA) to simulate the interactions between marine predators and their prey, as further explained in the phases outlined in Section 3.5. Additionally, the optimization of BMS sensor data feature selections is performed using the “incipient bat algorithm” to find prey during the search process, as described in detail in Section 3.6.
Step 6—The final step of the research is to evaluate the “Performance Analysis” for the framework described in Section 3. The performance analysis is based on the evaluation of parameters such as mean square error, root mean square error, accuracy, precision, recall, and f1-score. The results are compared to existing methods, and a detailed analysis is presented in Section 4 of the research.
3.2. Sensor Data Collection
The data gathered by the sensors only reflect the battery’s outward features not its inside conditions. Additionally, there is a connection between several faults, and the characteristics of each fault are not always clear. Therefore, achieving reliable fault detection and separation from unidentified fault data remains exceedingly difficult. New sensors (such as built-in pressure sensors, acoustic sensors, etc.) can be used to obtain parameters characterizing the battery’s internal state information in order to accurately achieve specific fault isolation. Table 2 lists sensor sample data collected for the feature extraction model. This is in addition to extracting fault categorization variables based on fault data [27].
3.3. Preprocessing Using Z-Score Normalization
The data obtained from the sensors have undergone preliminary processing in order to be ready for primary processing and for analysis [28]. Preliminary processing involves checking the plausibility of data and normalizing the information.
To accomplish Z-score normalization, also called zero normalization, the mean and standard deviation for each characteristic in a training set are obtained and divided by several variables in a training dataset. Mean and standard deviation are determined for each attribute [29]. The transformation to be performed is specified in the general formula
where the average of c is μ and its standard deviation is σ [30]. All of the features in the dataset are normalized using the z-score process before training can begin. After a set of training data has been computed, it is critical to maintain the standard deviation and mean for each feature so that they may be utilized as weights in the system’s design.
3.4. Feature Extraction
Feature Extraction Using Sparse Principal Component Analysis
Statistical analysis or the analysis for multivariate datasets for feature extractions is performed on the principle of sparse principal component analysis (SPCA) [31]. Data extractions are principally carried out by introducing sparsity structures to input variables, where SPCA enhances the effectiveness of the traditional technique for dimensionality and reduction, commonly known as principal component analysis (PCA).
Assume that the data X is a matrix, where K and P represent the number of variables and observations, respectively. Assume that the column means of X were all zeros to preserve generality.
Consider that SVD of X is in Equation (3),
where T denotes transposition. The columns for V are the equivalent loadings of the principal components, and U is the unit-length principal component (PC). A “self-contained” regression-type criterion to generate main components is presented in the following theorem. Consider the first L primary components. Let the matrices be and . The ith row vector of matrix X is designated as . Whenever >0, let the following Equation (4) be
Subject to , then for effectively convert the PCA issue into a ridge regression issue. Here, we discuss the relationship between PCA and regression and utilize the lasso technique to generate sparser loadings, also known as regression coefficients. To achieve this objective, we incorporate the lasso penalty into the criterion outlined in Equation (4) and formulate the following optimization problem listed in Equation (5). We investigate the following elastic net regularization issue by adding the lasso penalty to the criterion in order to obtain sparse loadings.
Subject to .
By selecting the proper and , we arrive at a sparse solution, from which we derive a sparse vector of unit length that approximates .
An optimization problem can be formulated for SPCA by introducing an elastic net constraint for a fixed α. To address this issue, an alternate minimization procedure can be utilized to minimize the SPCA criteria. Detailed mathematical formulas are available to implement SPCA. Due to its sparsity, SPCA has been widely used in gene expression analysis as it facilitates the understanding of data and the identification of key genes. In addition, sparsity can aid in the generalization of a learned model and prevent over-fitting. Therefore, incorporating sparsity in face recognition can potentially lead to improved recognition results.
One of the disadvantages of PCA is that, as previously stated, every component of a loading matrix V is often non-zero, which makes it difficult to understand the generated PCs and may impede the identification of important trends and patterns in datasets. In order to produce a sparse V matrix, sparse principal component analysis is used to decrease the number of variables which explicitly have non-zero loadings. To conduct SPCA, PCA is reconfigured as a regression-type optimization problem with a quadratic penalty.
A following optimization problems is addressed in order to acquire the sparse principal component (SPCs), taking into consideration that in the first k PCs, xi denotes the ith row vector of an original data matrix X, and . Equation (6) is described below:
Subject to .
Where is permitted to penalize the loadings of various PCs and > 0 and different 1 are acceptable.
Let represent the altered PCs, commonly known as SPCA. is too pessimistic to accurately reflect the overall variance because the columns for are correlated. We can quickly obtain an adjusted variance by using the QR decomposition and accounting for the correlations between the columns of . If Q is orthonormal and R is higher triangular, then assuming = QR, Equations (7)–(10) are
The SPCA proportion of explained variation (PVE) is indicated, where the X is the data matrix; the number of selected PCs is k; in each SPC, is the required NNZL; is the vectors of sparse loading; and the cumulative percent variance of SPCA is .
3.5. Feature Selection Using Enhanced Marine Predators’ Algorithm
An innovative population-based optimization technique that has seen extensive usage in practical optimization applications is the improved marine predator’s algorithm (EMPA). However, due to a lack of population variety in the late stages of optimization, EMPA may quickly enter a local optimum. The three stages of the marine predator’s algorithm simulates the interactions between marine predators and their prey as shown in Table 3 of enhanced MPA algorithm matrix. The following is a summary of these actions, which indicate the predator’s stride size as it pursues its prey.
Phase 1: When the velocity ratio is large (V > 10), the predator outruns the prey. This phase begins in the first third of exploration iterations, and the following equations represent it mathematically. According to Equations (11)–(13),
where R is the vector made up of random values between 0 and 1. Entry-wise multiplications are indicated by the notation, and p = 0.5. Max T is the maximum number of iterations, where t is the current iteration and N the population size. Using the Brownian motion, creates a vector of random integers that derives the step size from a normal distribution with a mean of 0 and unit variance of 1. The fittest solution is included in the matrix, which is suggested as a top predator. We may determine the probability density function (PDF) at a location x using this motion and the formula in Equation (13).
Phase 2: The predator and a prey are represented by unit velocity ratio move at same velocity. The Lévy distribution utilizes Brownian motion exploitation. As a result, the algorithm explores the first half of a population, whereas the other half is reserved for abuse. The prey movement is updated by the distribution of Lévy as follows. The following Equations (14)–(18) are described below,
where z defines the step size, is the variance, and =1.5 and Q and Y are two random values generated from the normal distribution computed by generating two random numbers and applying Gaussian distribution quantities Q and Y. is a vector for random data produced using the Mantegna method of Lévy distribution. We revise the employment of the second half of the Brownian motion equation and the predator movement population. According to the following Equations (19)–(21):
where CF is an adaptive variable that regulates the motion of the predator’s step size.
Phase 3: With a low velocity ratio (V = 1), a predator outruns the prey by a factor of three in the last third of repetitions. This is mathematically expressed as the following Equations (22)–(24):
3.6. Incipient Bat-Optimized Deep Residual Network
Incipient bat algorithm is an optimization method that draws inspiration from the way that bats use echolocation to find their meals as shown in Table 4 enhanced MPA-Incipient Bat algorithm. The initial additions to a bat search algorithm were made, and simulations were run in accordance with several idealistic guidelines.
- Each bat employs the advantages of echolocation to look for prey and avoid obstacles.
- Each bat searches for food by flying at a velocity vi, location xi, constant frequency fmin, variable wavelength, and loudness L0. Depending on how close the target is, bats may automatically change the frequency of their produced pulses and the rate of pulse emission r in the range [0, 1].
- A minimal constant value Lmin and a large positive number L0 represent the range of loudness Lm.
The location and velocity of the bat at time t should be specified and updated throughout the optimization process. Equations (25)–(27) provide the new location and velocity at time .
where is the uniformly drawn pulse frequency of bat I, as represented by (, ). The outcome of comparing all the solutions among all bats is x, which represents the current global best position (i.e., solution). x is a random integer in the range [0, 1]. Once one of the best current solutions has been chosen, a new solution is created locally for each bat using random walk. This procedure may be thought of as a local search and is described by Equation (28)
When a bat finds a prey during the search process, the loudness typically drops and its pulse emission progressively rises. The loudness or pulse emission ri were updated in accordance with Equations (29) and (30) under the assumption that = 0 indicates that a bat has located his prey (i.e., a solution):
whereas is a positive constant and is a random integer in the range [1, 1].
Consider A as an example of a useful function that the residual network learns. Whenever there are no skip connections present, the identity function must be matched by adjusting the weights and bias values. The nonlinearity in the layers makes it considerably more difficult to learn the identity function from scratch, which, in turn, causes degeneration. Equations (31) and (32) defined below.
The model’s capacity to learn and adjust to novel circumstances is facilitated by this. To create a straightforward linear function, we may have inserted a skip link before the relu block in the residual network using a single weight layer.
4. Performance Analysis
The overall behavior of the recommended framework is discussed in this section. Figure 3, Figure 4, Figure 5, Figure 6, Figure 7 and Figure 8 shows the comparison of parameters, such as mean square error, root mean square error, accuracy, precision, recall, f1-score for existing, and proposed methods. The approaches include the artificial neural network (ANN), support vector machine (SVM), linear regression (LR), Gaussian process regression (GPR), and incipient bat-optimized deep residual network (IB-DRN).
To determine a test’s accuracy, it must correctly distinguish between patient and healthy samples. Calculating the ratio of positive to negative results across all instances is a good way to obtain a sense of a test’s reliability. The accuracy Equation (33) is described given below:
Figure 3 displays the results of the accuracy calculations for both the proposed and the existing procedures. According to the aforementioned graph, the proposed approach of incipient bat-optimized deep residual network (IB-DRN) has a 98% higher accuracy than the existing methods, such as artificial neural network (ANN), support vector machine (SVM), linear regression (LR), and Gaussian process regression.
Precision is determined by dividing the total numbers of true positives and false positives by the imbalanced classification problem’s two classes. According to the following Equation (34)
Figure 4 represents the precision results of the proposed and existing methodologies. As shown in Figure 4, the suggested approach of IB-DRN has a higher precision (90%) than the existing methods, such as ANN, SVM, LR, and GPR.
By dividing the real positives by anything else which should have been projected as positive, recall (also known as the true positive rate) is obtained. The recall results utilizing both the suggested and current methodologies are shown in Figure 5. Figure 5 above demonstrates that the suggested approach of IB-DRN has a higher recall than the existing methods. Equation (35) is given below:
The geometric mean of recall and accuracy is used to obtain the F1 score. The recall of the harmonic mean is a substitute measure for the more often used arithmetic mean. This is often useful when calculating an average rate. We calculate the average of accuracy and recall for the F1 score. Equation (36) described below:
Figure 6 depicts the F1 score calculations for the proposed and existing methodologies. The aforementioned graph shows that the suggested method of IB-DRN has a greater F1 score than the existing techniques.
One of the methods most often used to assess the accuracy of forecasts is root mean square error, also known as the root mean square deviation. It illustrates the Euclidean distance between measured true values and forecasts. Equation (37) is described below:
Figure 7 represents the precision results of the proposed and existing methodologies. As shown in Figure 7, the suggested approach of IB-DRN has a lower root mean square error (50%) than the existing methods, such as ANN, SVM, LR, and GPR.
In statistics, the term “Mean Squared Error” (MSE) refers to the average or mean of the square of a disparity between the observed and predicted values. Equation (38) is calculated as follows:
The recall results utilizing both the suggested and current methodologies are shown in Figure 8, which demonstrates that the existing methods, such as artificial neural network, support vector machine, linear regression, Gaussian process regression, have a higher mean square error when compared to the proposed IB-DRN method.
Figure 9 presents the data on car speed accumulation at the lower and higher ends of curves. The graph visually depicts how the car’s speed changes as it navigates curves, with data points representing the accumulation of speed during these maneuvers.
Figure 10 showcases the observed current profile for different vehicle speed profiles.
Figure 11 further illustrates plot for exhaust gas emissions. The graph provides additional data points and analysis to better understand the impact of vehicle speed on current consumption and emissions.
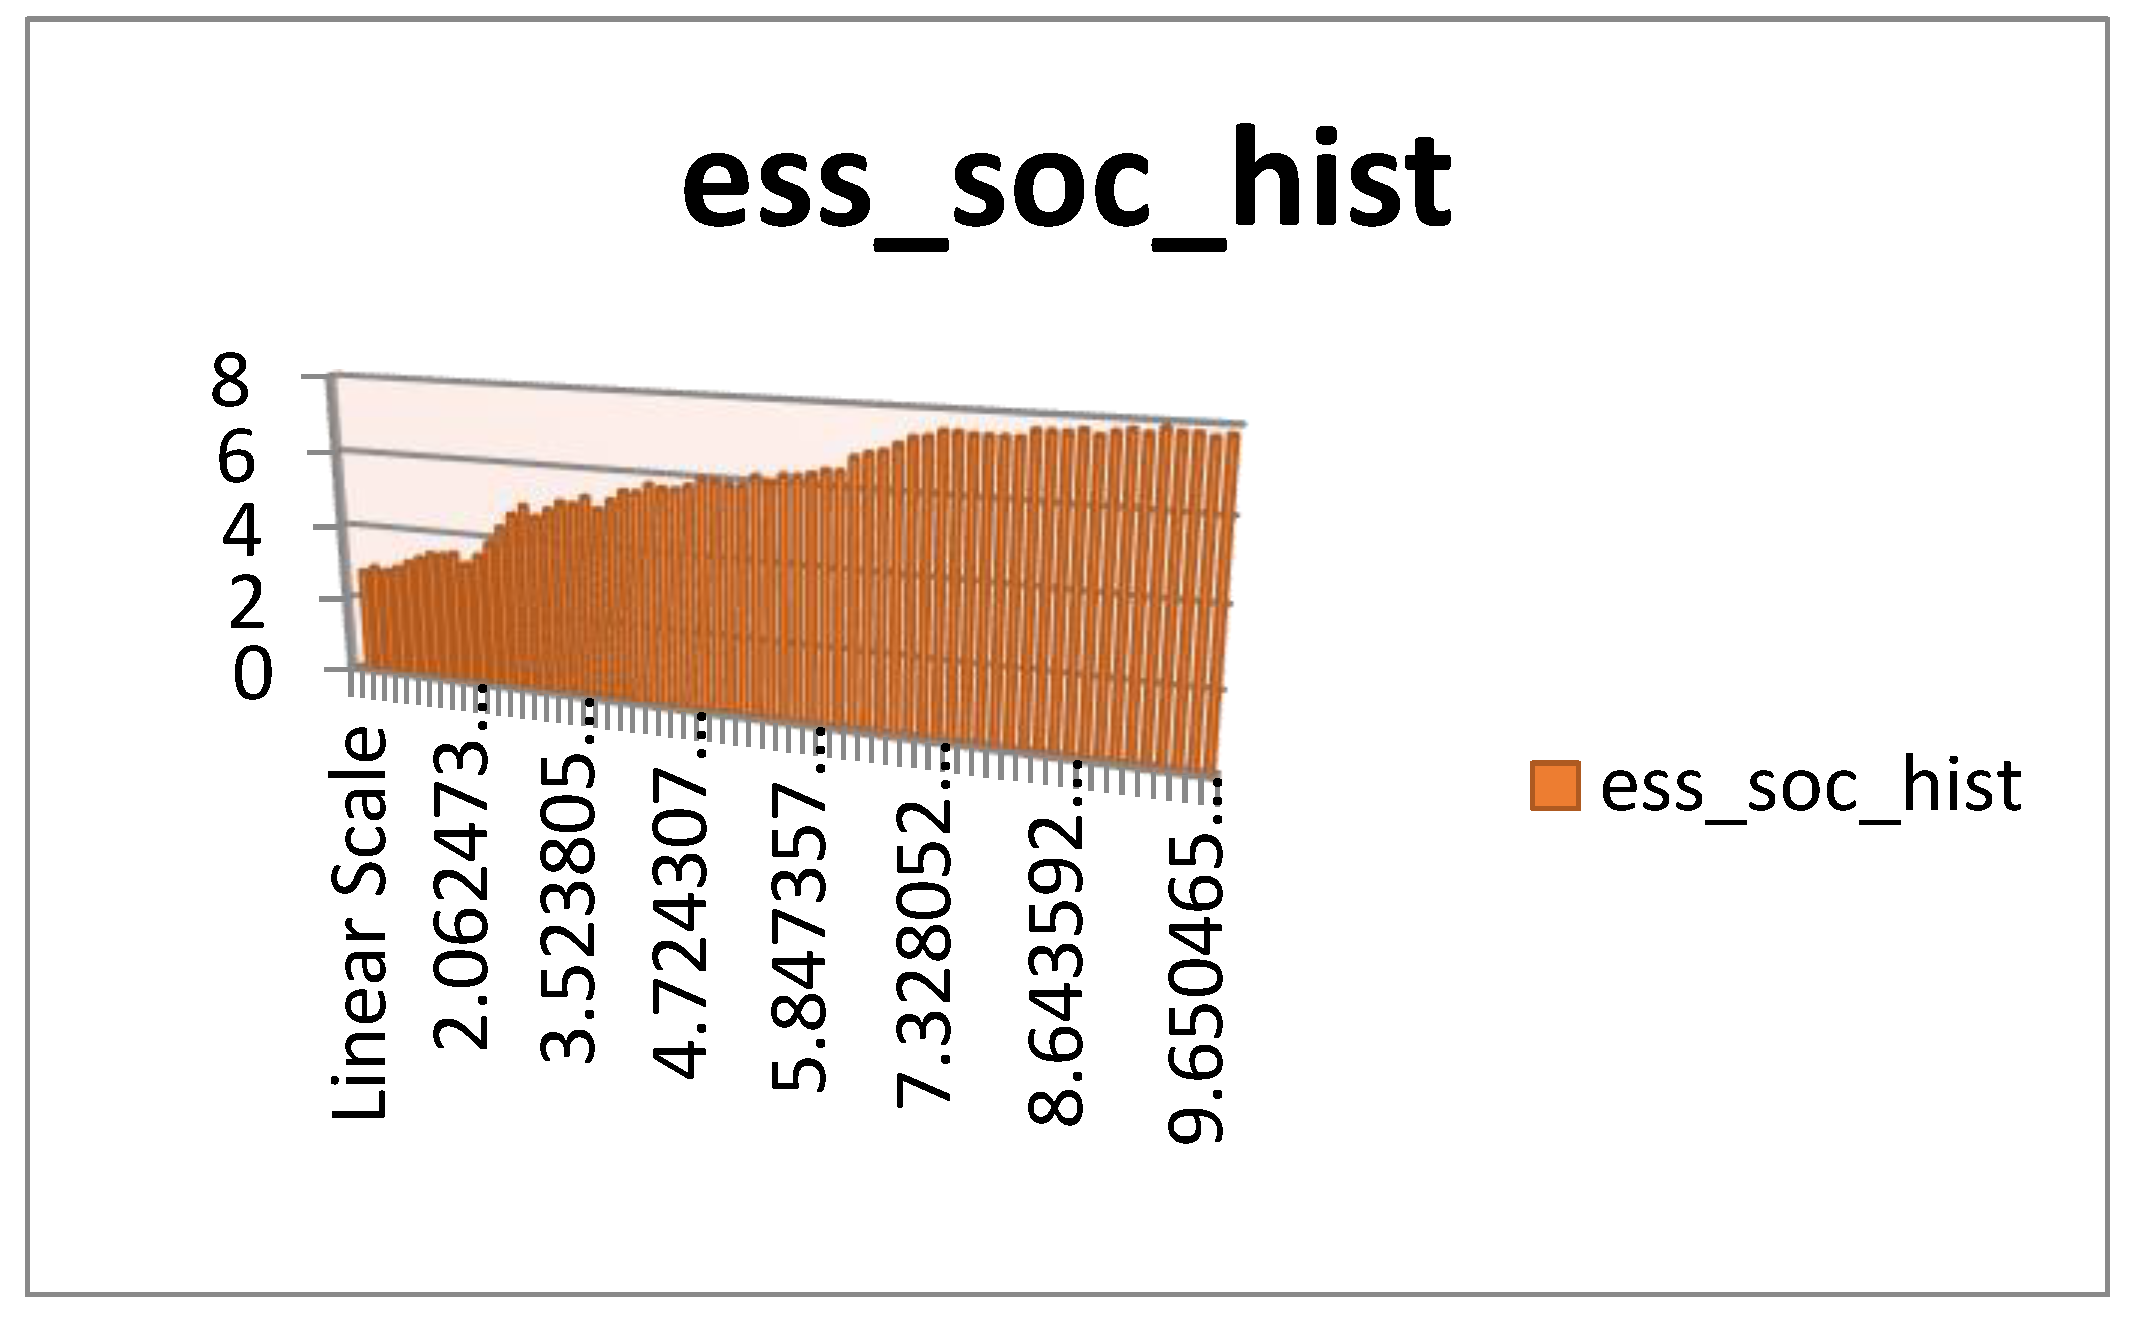
In Figure 12, the SOC curves and accompanying automobile speed, current profile, exhaust gas emission, and UDDS cycle tested on the MATLAB platform are shown.
5. Discussions
The architecture of artificial neural networks necessitates the use of parallel processing hardware. Closer-to-the-hyperplane data points, known as support vector machines, have an impact on the hyperplane’s location and orientation. When the target classes overlap and the dataset includes more sound, it does not operate very well. A support vector machines will perform poorly when there are more attributes for each data point than training data specimens are present.
Figure 3, Figure 4, Figure 5, Figure 6, Figure 7 and Figure 8 are the comparisons of the accuracy, precision, recall, F1 score, root mean square error, and mean square error for both existing methods and the proposed method. Included existing approaches are the artificial neural network (ANN), support vector machine (SVM), linear regression (LR), and Gaussian process regression (GPR), whereas the suggested technique is the incipient bat-optimized deep residual network (IB-DRN). The proposed incipient bat-optimized deep residual network technique achieves a high level of accuracy (98%), especially when compared to the existing methods of artificial neural network (53%), support vector machine (73%), linear regression (82%), and Gaussian process regression (66%) that are currently in use. In terms of precision, the proposed method of incipient bat-optimized deep residual network displays a 90% precision rate, while the existing methods of artificial neural network, support vector machine, linear regression, and Gaussian process regression are 57%, 64%, 73%, and 81%, respectively, revealing that when compared to the proposed method, the existing methods perform low in terms of precision. In terms of recall, the proposed method of incipient bat-optimized deep residual network is 97% and the existing methods of artificial neural network, support vector machine, linear regression, and Gaussian process regression, 60%, 59%, 81%, and 73%, respectively, hence the suggested technique performs well in terms of recall when compared to the existing techniques. In terms of the F1 score, the proposed method of incipient bat-optimized deep residual network has a score of 94% and the existing methods have scores as follows: the artificial neural network is 67%, the support vector machine is 85%, the linear regression is 65%, and Gaussian process regression is 73%, so the suggested technique performs well in terms of F1 score when compared to the existing methods. In terms of root mean square error, the proposed method of the incipient bat-optimized deep residual network has a score of 50% and the existing methods of artificial neural network, support vector machine, linear regression, Gaussian process regression have scores of 96%, 77%, 83%, and 65%, respectively; thus, the existing techniques perform well in terms of root mean square error when compared to the suggested technique. The proposed technique of incipient bat-optimized deep residual network achieves a low level regarding mean square error (55%), especially when compared to the existing methods of the artificial neural network (93%), support vector machine (65%), linear regression (85%), Gaussian process regression (74%).
6. Conclusions
This article discusses the principles of battery design and management for electric vehicles with a focus on sensor fault detection. Safety in electric vehicles depends heavily on BMSs, which control the electronics of the rechargeable battery pack or individual cells. To improve the safety and reliability of battery management systems, this article proposes a false battery data detection and classification system based on incipient bat-optimized deep residual networks (IB-DRN). Compared to current approaches, the IB-DRN system achieves high accuracy (98%), precision (90%), recall (97%), and F1 score (94%) but has poor performance in root mean square error (50%) and mean square error (55%). Additionally, this paper details a unique BMS hardware design and experimental findings. Future work should include potential upgrades for battery models, sensor data visualization, and continuous fault monitoring.
Author Contributions
Conceptualization, V.S.R.K.; methodology, V.S.R.K.; software, V.S.R.K.; validation, V.S.R.K. and A.K.V.; formal analysis, V.S.R.K. and A.K.V.; investigation, V.S.R.K. and A.K.V.; resources, V.S.R.K.; writing—original draft, A.K.V.; writing—review and editing, V.S.R.K.; visualization, A.K.V.; supervision, V.S.R.K. All authors have read and agreed to the published version of the manuscript.
Funding
This research received no external funding.
Data Availability Statement
Not applicable.
Conflicts of Interest
The authors declare no conflict of interest.
References
- Chandran, V.; Patil, C.; Karthick, A.; Ganeshaperumal, D.; Rahim, R.; Ghosh, A. State of Charge Estimation of Lithium-Ion Battery for Electric Vehicles Using Machine Learning Algorithms. World Electr. Veh. J. 2021, 12, 38. [Google Scholar] [CrossRef]
- Duraisamy, T.; Kaliyaperumal, D. Machine Learning-Based Optimal Cell Balancing Mechanism for Electric Vehicle Battery Management System. IEEE Access 2021, 9, 132846–132861. [Google Scholar] [CrossRef]
- Yu, Q.; Wan, C.; Li, J.; Xiong, R.; Chen, Z. A Model-Based Sensor Fault Diagnosis Scheme for Batteries in Electric Vehicles. Energies 2021, 14, 829. [Google Scholar] [CrossRef]
- Xiong, R.; Yu, Q.; Shen, W.; Lin, C.; Sun, F. A Sensor Fault Diagnosis Method for a Lithium-Ion Battery Pack in Electric Vehicles. IEEE Trans. Power Electron. 2019, 34, 9709–9718. [Google Scholar] [CrossRef]
- Lipu, M.H.; Hannan, M.; Karim, T.F.; Hussain, A.; Saad, M.H.M.; Ayob, A.; Miah, S.; Mahlia, T.I. Intelligent algorithms and control strategies for battery management system in electric vehicles: Progress, challenges and future outlook. J. Clean. Prod. 2021, 292, 126044. [Google Scholar] [CrossRef]
- Liu, K.; Li, K.; Peng, Q.; Zhang, C. A brief review on key technologies in the battery management system of electric vehicles. Front. Mech. Eng. 2018, 14, 47–64. [Google Scholar] [CrossRef] [Green Version]
- Rajalakshmi, M.; Sultana, W.R. Intelligent Hybrid Battery Management System for Electric Vehicle. Artificial Intelligent Techniques for Electric and Hybrid Electric Vehicles; Wiley Online Library: New York, NY, USA, 2020; pp. 179–206. [Google Scholar] [CrossRef]
- Lelie, M.; Braun, T.; Knips, M.; Nordmann, H.; Ringbeck, F.; Zappen, H.; Sauer, D.U. Battery Management System Hardware Concepts: An Overview. Appl. Sci. 2018, 8, 534. [Google Scholar] [CrossRef] [Green Version]
- Sanguesa, J.; Torres-Sanz, V.; Garrido, P.; Martinez, F.; Marquez-Barja, J. A Review on Electric Vehicles: Technologies and Challenges. Smart Cities 2021, 4, 372–404. [Google Scholar] [CrossRef]
- Suarez, C.; Martinez, W. Fast and Ultra-Fast Charging for Battery Electric Vehicles—A Review. In Proceedings of the 2019 IEEE Energy Conversion Congress and Exposition (ECCE), Baltimore, MD, USA, 29 September–3 October 2019. [Google Scholar] [CrossRef]
- Tran, M.-K.; Bhatti, A.; Vrolyk, R.; Wong, D.; Panchal, S.; Fowler, M.; Fraser, R. A Review of Range Extenders in Battery Electric Vehicles: Current Progress and Future Perspectives. World Electr. Veh. J. 2021, 12, 54. [Google Scholar] [CrossRef]
- Sun, P.; Bisschop, R.; Niu, H.; Huang, X. A Review of Battery Fires in Electric Vehicles. Fire Technol. 2020, 56, 1361–1410. [Google Scholar] [CrossRef]
- Chen, H.-C.; Li, S.-S.; Wu, S.-L.; Lee, C.-Y. Design of a Modular Battery Management System for Electric Motorcycle. Energies 2021, 14, 3532. [Google Scholar] [CrossRef]
- Ma, J.; Sun, Y.; Zhang, S.; Li, J.; Li, S. Experimental study on the performance of vehicle integrated thermal management system for pure electric vehicles. Energy Convers. Manag. 2022, 253, 115183. [Google Scholar] [CrossRef]
- Balasingam, B.; Ahmed, M.; Pattipati, K. Battery Management Systems—Challenges and Some Solutions. Energies 2020, 13, 2825. [Google Scholar] [CrossRef]
- Lopez, K.L.; Gagne, C.; Gardner, M.-A. Demand-Side Management Using Deep Learning for Smart Charging of Electric Vehicles. IEEE Trans. Smart Grid 2018, 10, 2683–2691. [Google Scholar] [CrossRef]
- Trivedi, M.; Kakkar, R.; Gupta, R.; Agrawal, S.; Tanwar, S.; Niculescu, V.-C.; Raboaca, M.S.; Alqahtani, F.; Saad, A.; Tolba, A. Blockchain and Deep Learning-Based Fault Detection Framework for Electric Vehicles. Mathematics 2022, 10, 3626. [Google Scholar] [CrossRef]
- Aguilera, F.; de la Barrera, P.M.; De Angelo, C.H. Speed and current sensor fault-tolerant induction motor drive for electric vehicles based on virtual sensors. Electr. Eng. 2022, 104, 3157–3171. [Google Scholar] [CrossRef]
- Liu, P.; Sun, Z.; Wang, Z.; Zhang, J. Entropy-Based Voltage Fault Diagnosis of Battery Systems for Electric Vehicles. Energies 2018, 11, 136. [Google Scholar] [CrossRef] [Green Version]
- Li, X.; Dai, K.; Wang, Z.; Han, W. Lithium-ion batteries fault diagnostic for electric vehicles using sample entropy analysis method. J. Energy Storage 2020, 27, 101121. [Google Scholar] [CrossRef]
- Li, X.; Wang, Z. A novel fault diagnosis method for lithium-Ion battery packs of electric vehicles. Measurement 2018, 116, 402–411. [Google Scholar] [CrossRef]
- Gabbar, H.A.; Othman, A.M.; Abdussami, M.R. Review of Battery Management Systems (BMS) Development and Industrial Standards. Technologies 2021, 9, 28. [Google Scholar] [CrossRef]
- Li, Y.; Sun, Z.; Wang, J. Design for battery management system hardware-in-loop test platform. In Proceedings of the 2009 9th International Conference on Electronic Measurement & Instruments, Beijing, China, 16–19 August 2009; pp. 3-399–3-402. [Google Scholar] [CrossRef]
- Mishra, R.K.; Kim, K.H. Role of Li-Ion Battery Energy Storage System in Renewable-Based Microgrid: A Review. Energies 2019, 12, 446. [Google Scholar] [CrossRef] [Green Version]
- Vivas, F.J.; Segura, F.; Andújar, J.M. Fuzzy logic-based energy management system for grid-connected residential DC microgrids with multi-stack fuel cell systems: A multi-objective approach. Sustain. Energy Grids Netw. 2022, 32, 100909. [Google Scholar] [CrossRef]
- Moulik, B.; Söffker, D. Battery Management System for Future Electric Vehicles. Appl. Sci. 2020, 10, 5095. [Google Scholar] [CrossRef]
- Xiong, R.; Sun, W.; Yu, Q.; Sun, F. Research progress, challenges and prospects of fault diagnosis on battery system of electric vehicles. Appl. Energy 2020, 279, 115855. [Google Scholar] [CrossRef]
- Bonfitto, A.; Ezemobi, E.; Amati, N.; Feraco, S.; Tonoli, A.; Hegde, S. State of health estimation of lithium batteries for automotive applications with artificial neural networks. In Proceedings of the 2019 AEIT International Conference of Electrical and Electronic Technologies for Automotive (AEIT AUTOMOTIVE), IEEE, Turin, Italy, 2–4 July 2019; pp. 1–5. [Google Scholar] [CrossRef]
- Xuan, L.; Qian, L.; Chen, J.; Bai, X.; Wu, B. State-of-Charge Prediction of Battery Management System Based on Principal Component Analysis and Improved Support Vector Machine for Regression. IEEE Access 2020, 8, 164693–164704. [Google Scholar] [CrossRef]
- Hong, J.; Wang, Z.; Chen, W.; Wang, L.-Y.; Qu, C. Online joint-prediction of multi-forward-step battery SOC using LSTM neural networks and multiple linear regression for real-world electric vehicles. J. Energy Storage 2020, 30, 101459. [Google Scholar] [CrossRef]
- Zou, H.; Hastie, T.; Tibshirani, R. Sparse Principal Component Analysis. J. Comput. Graph. Stat. 2006, 15, 265–286. [Google Scholar] [CrossRef] [Green Version]
Figure 1.
Battery Management System for Electric Vehicles.
Figure 2.
Overview of Research Process.
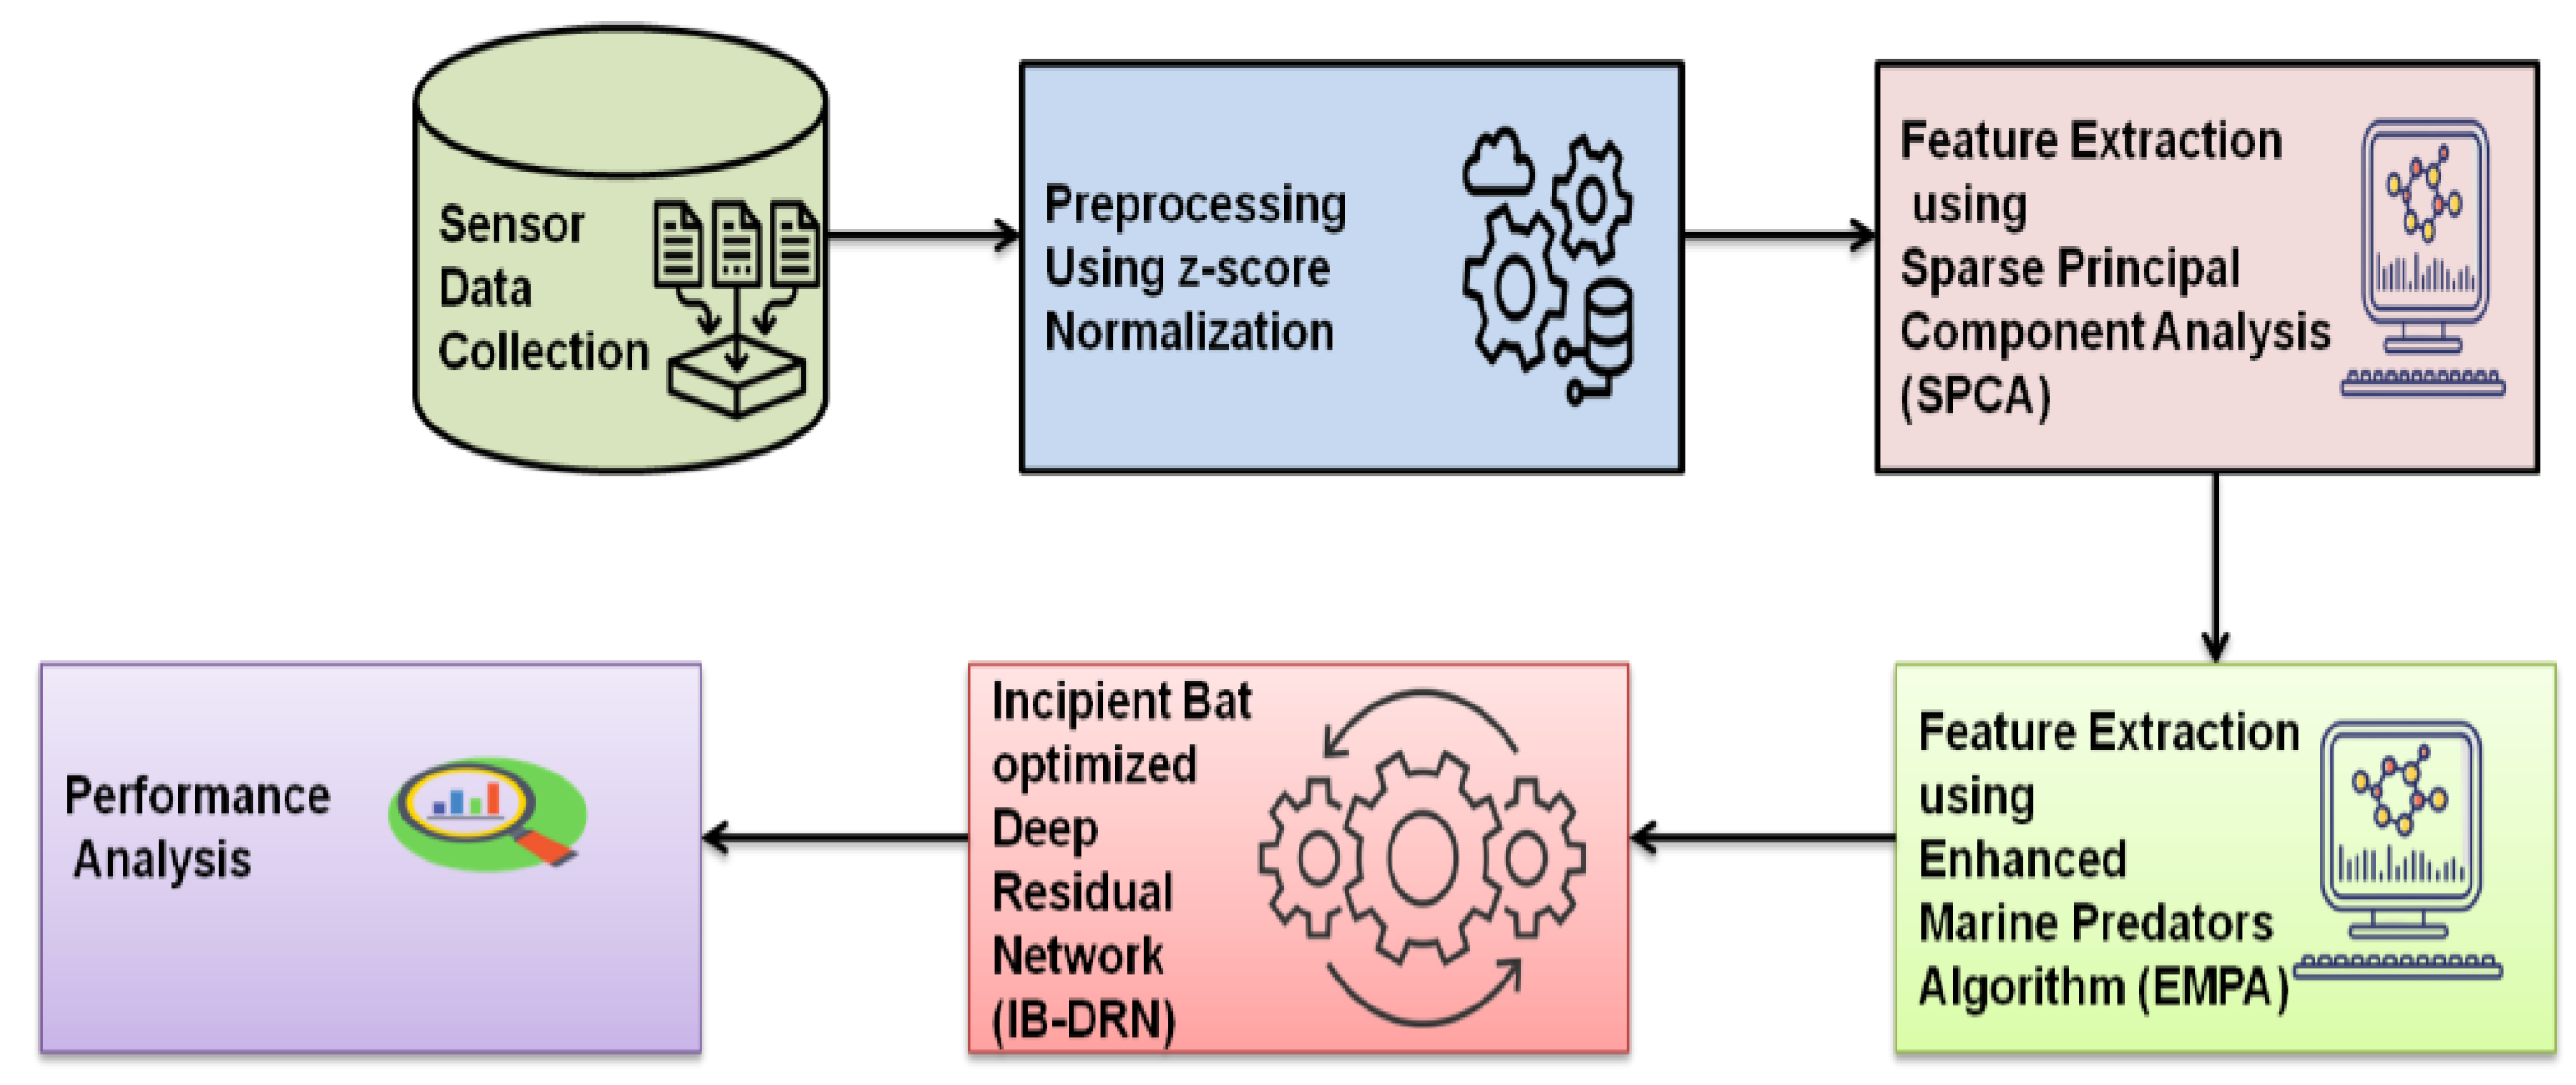


Figure 9.
Car speed.
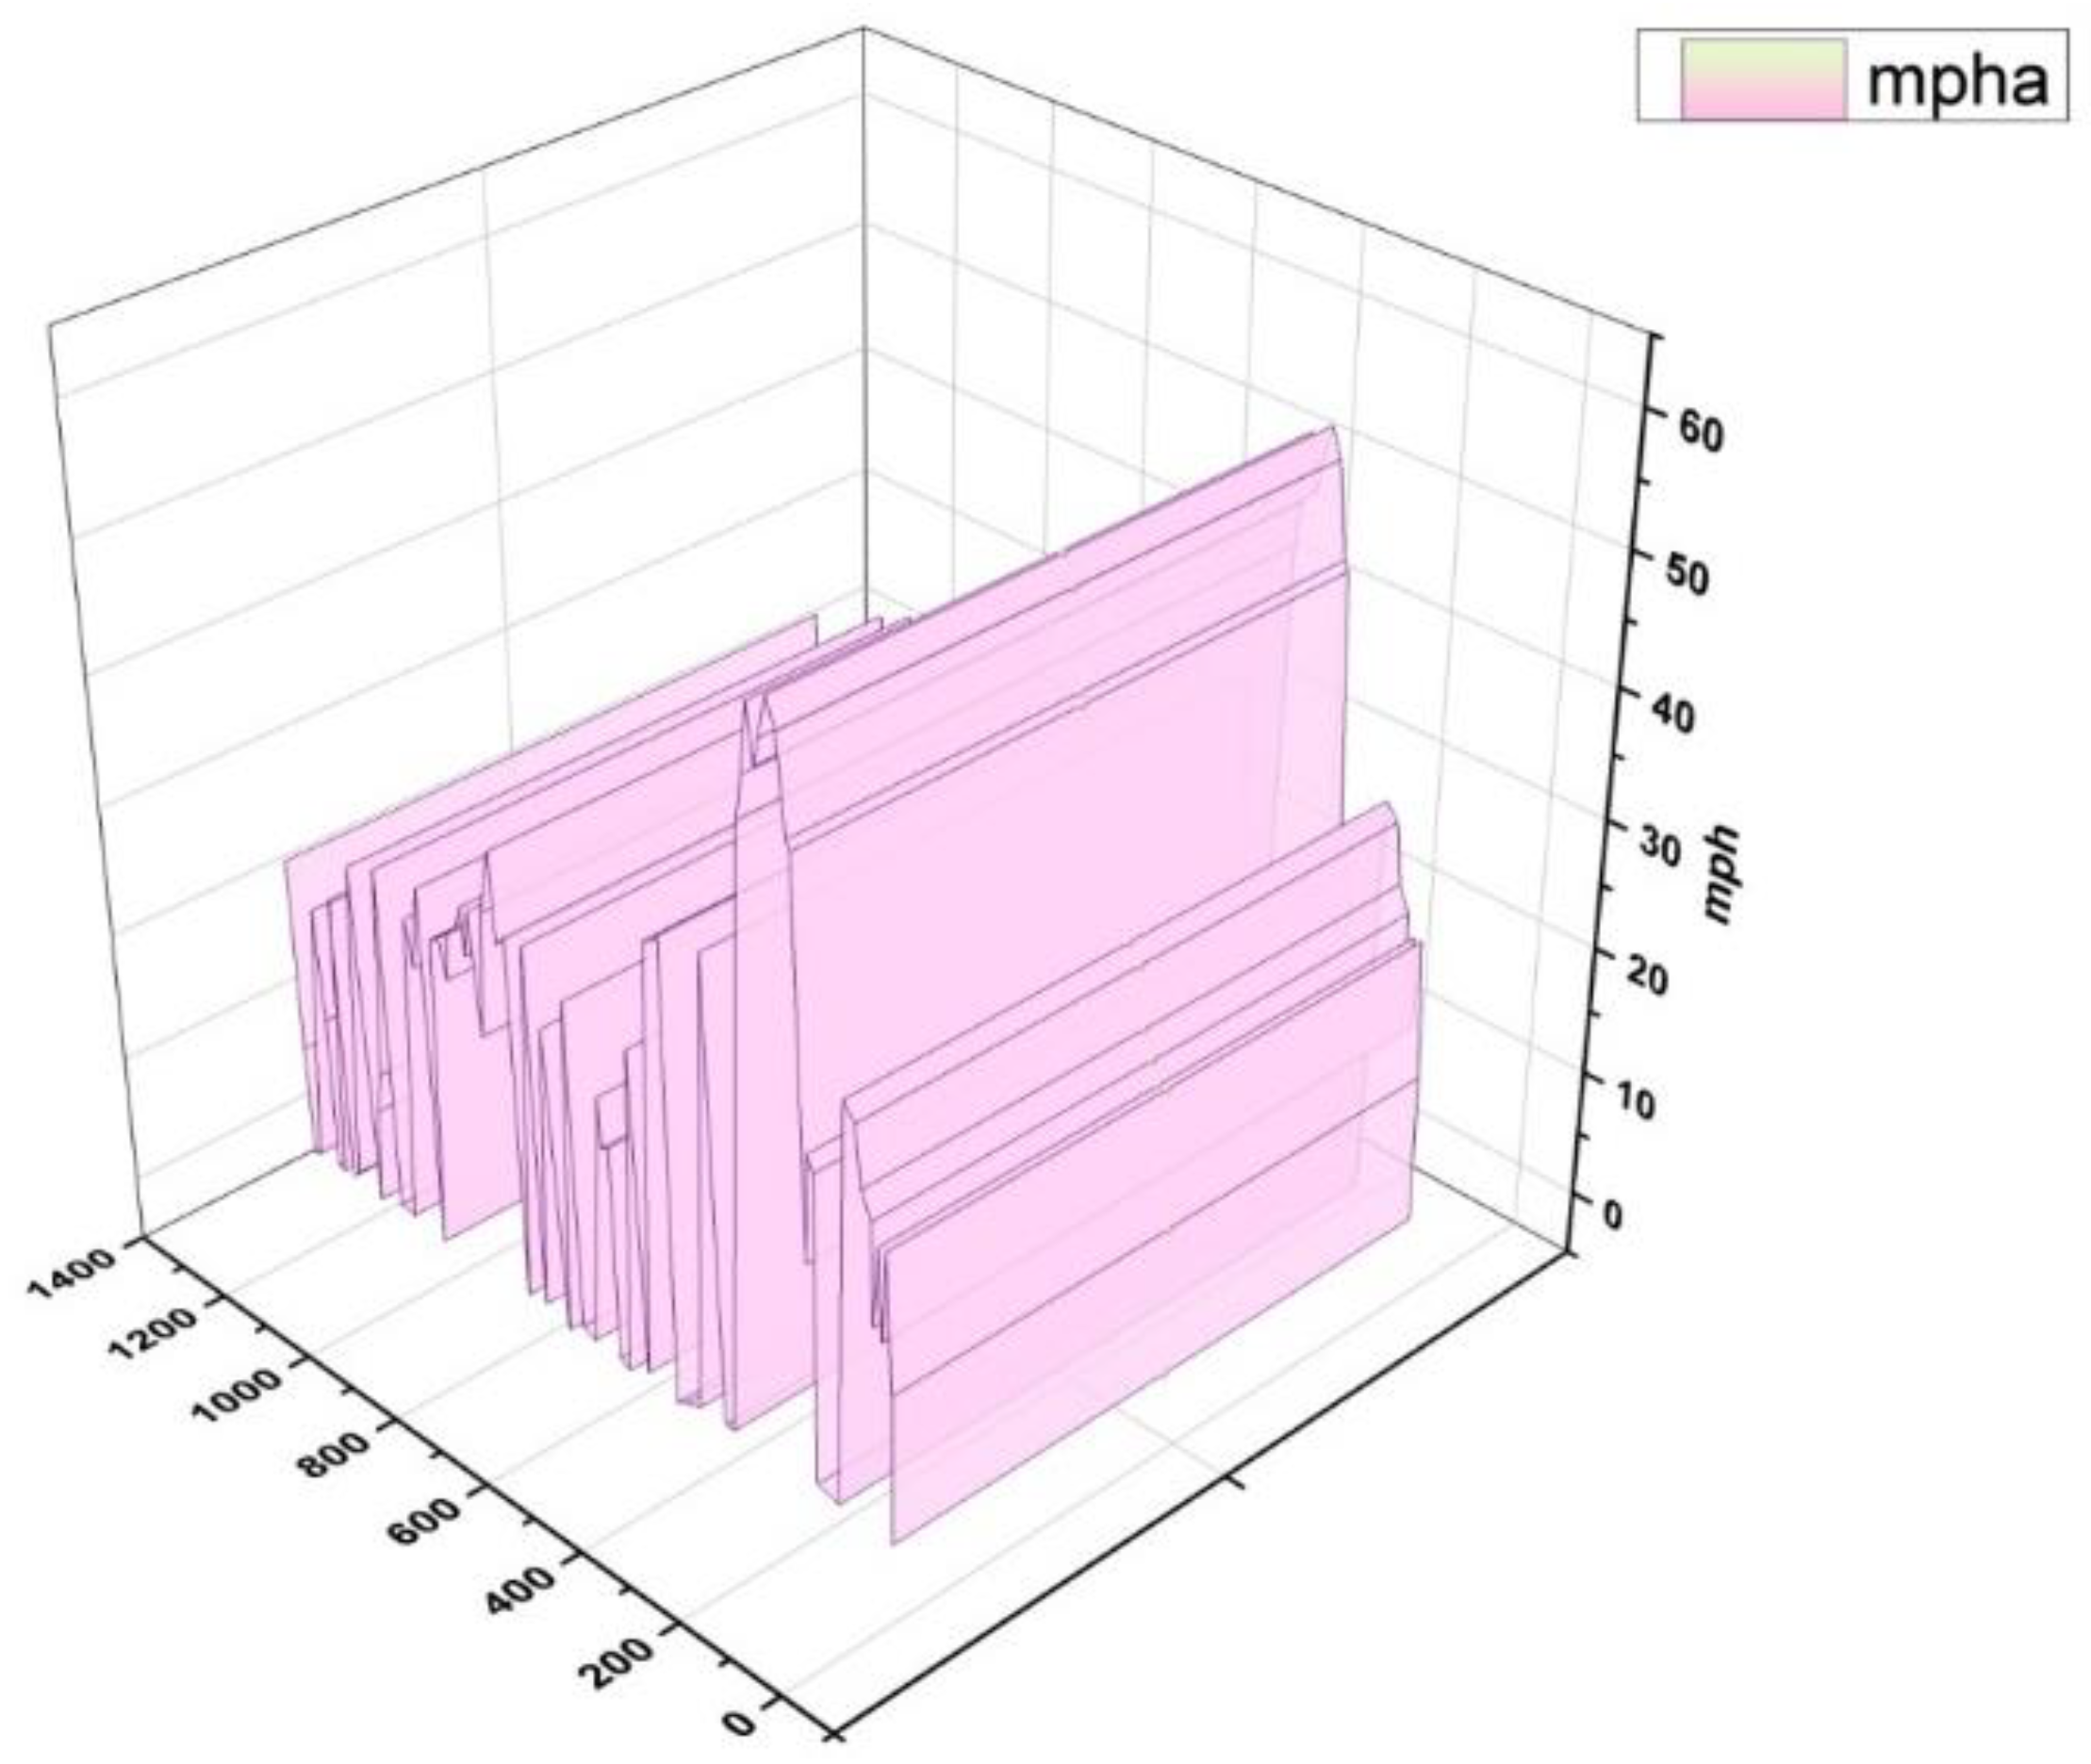
Figure 10.
Current profile.
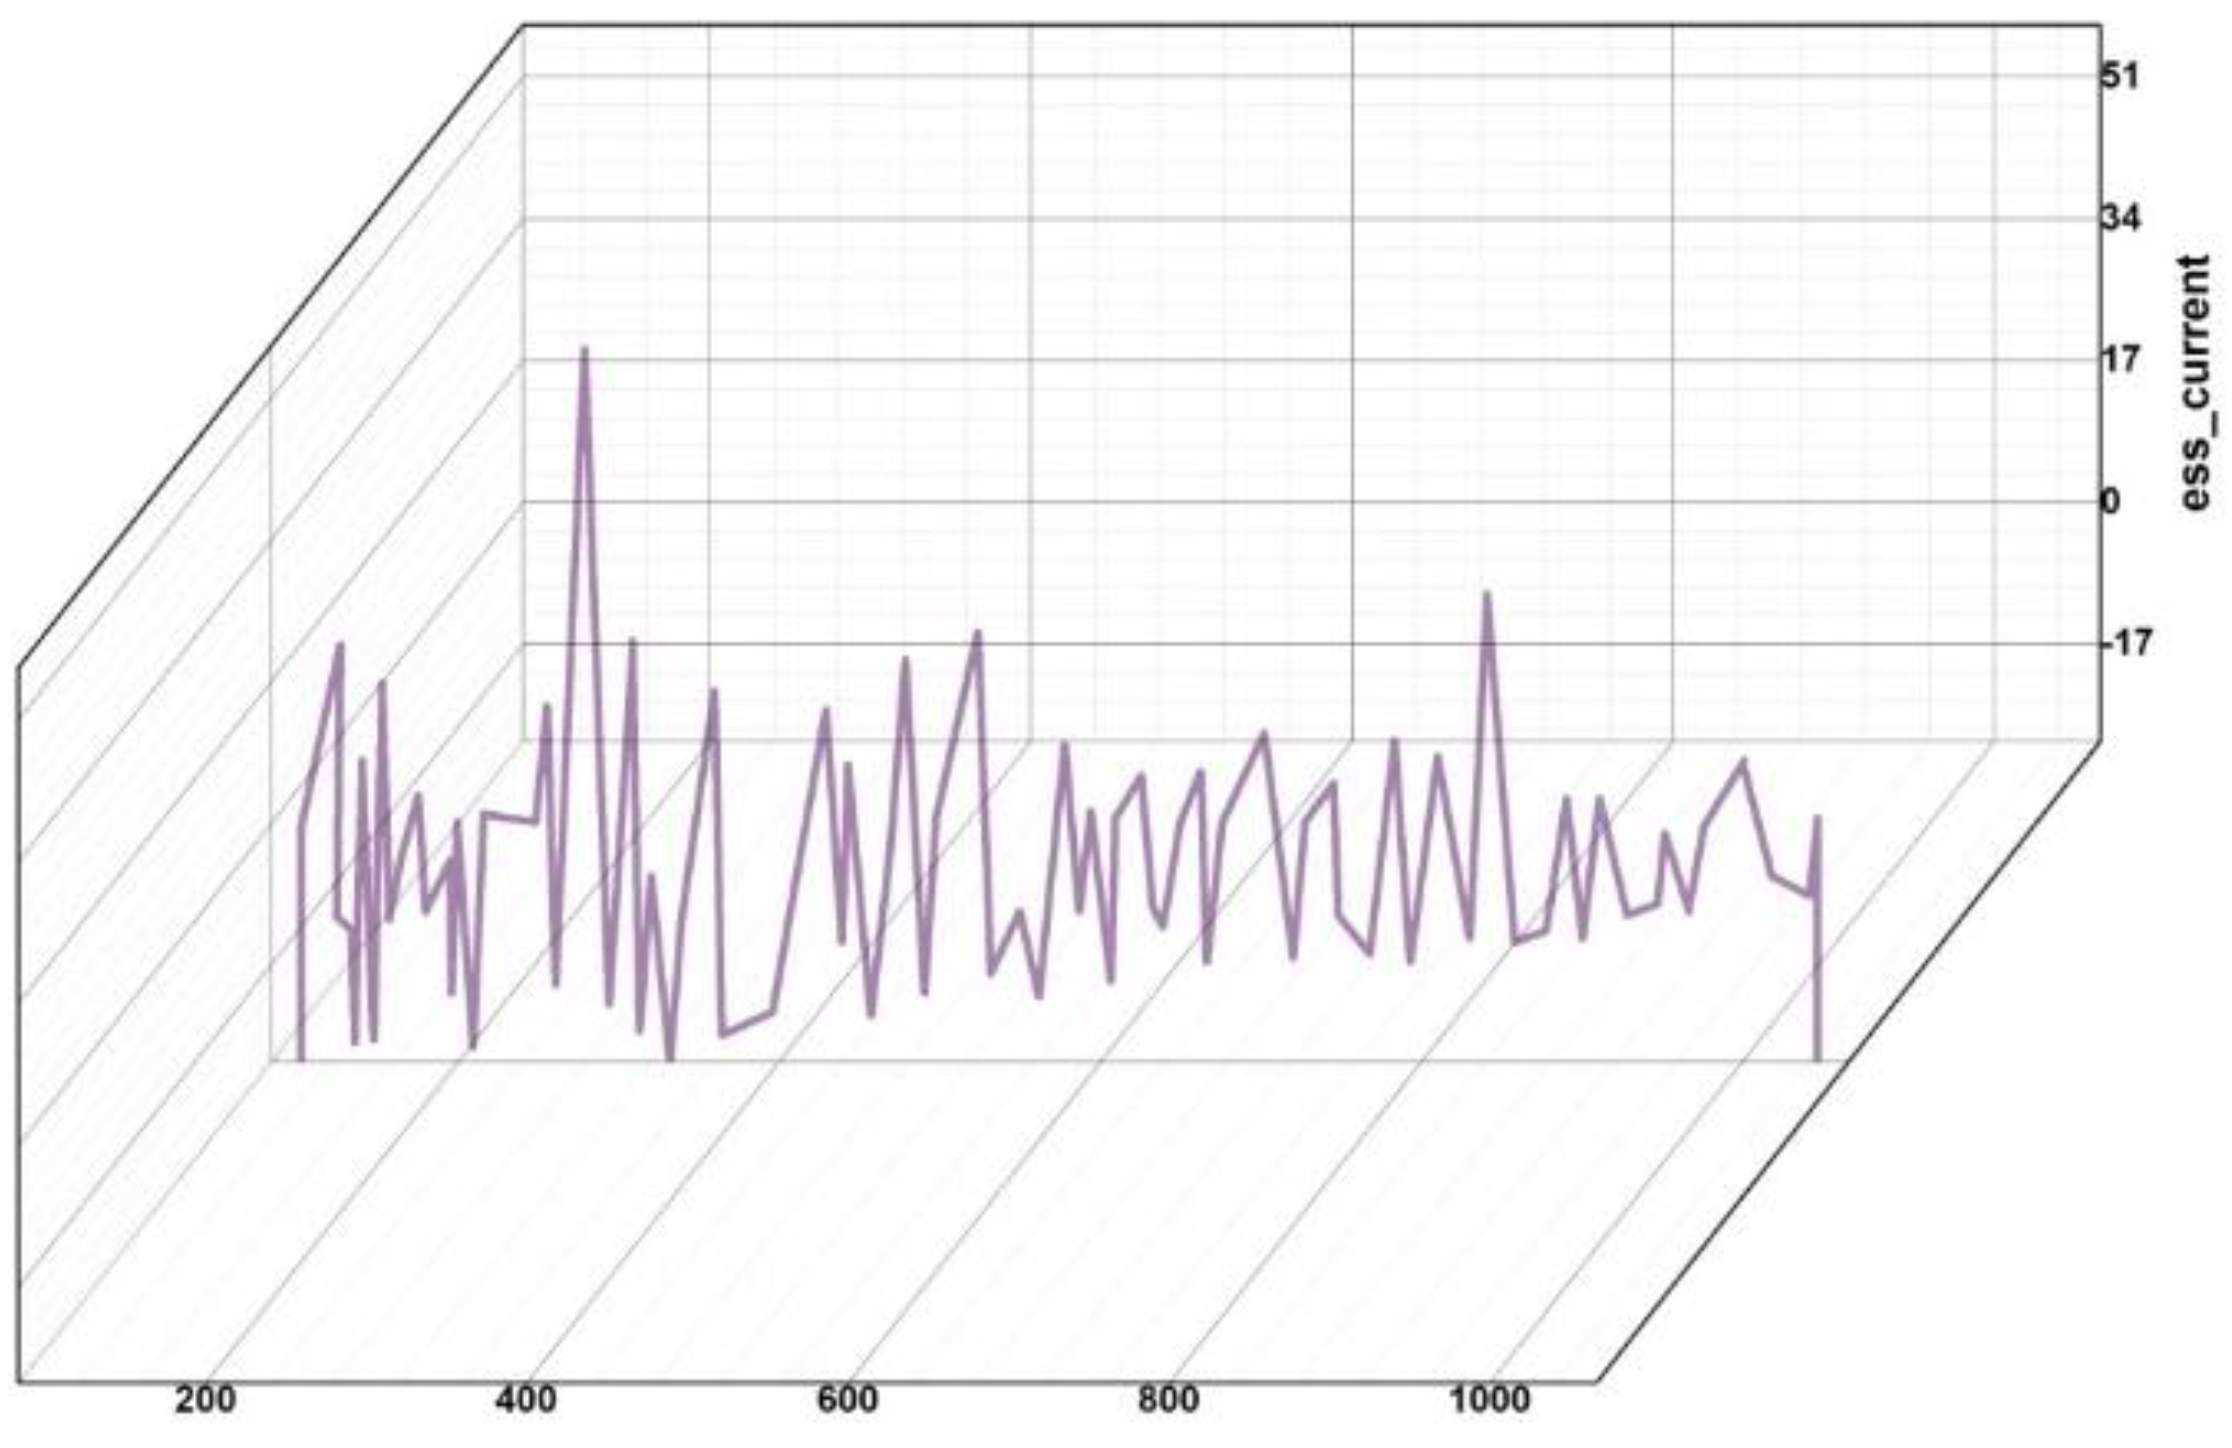
Figure 11.
Exhaust gas emissions.
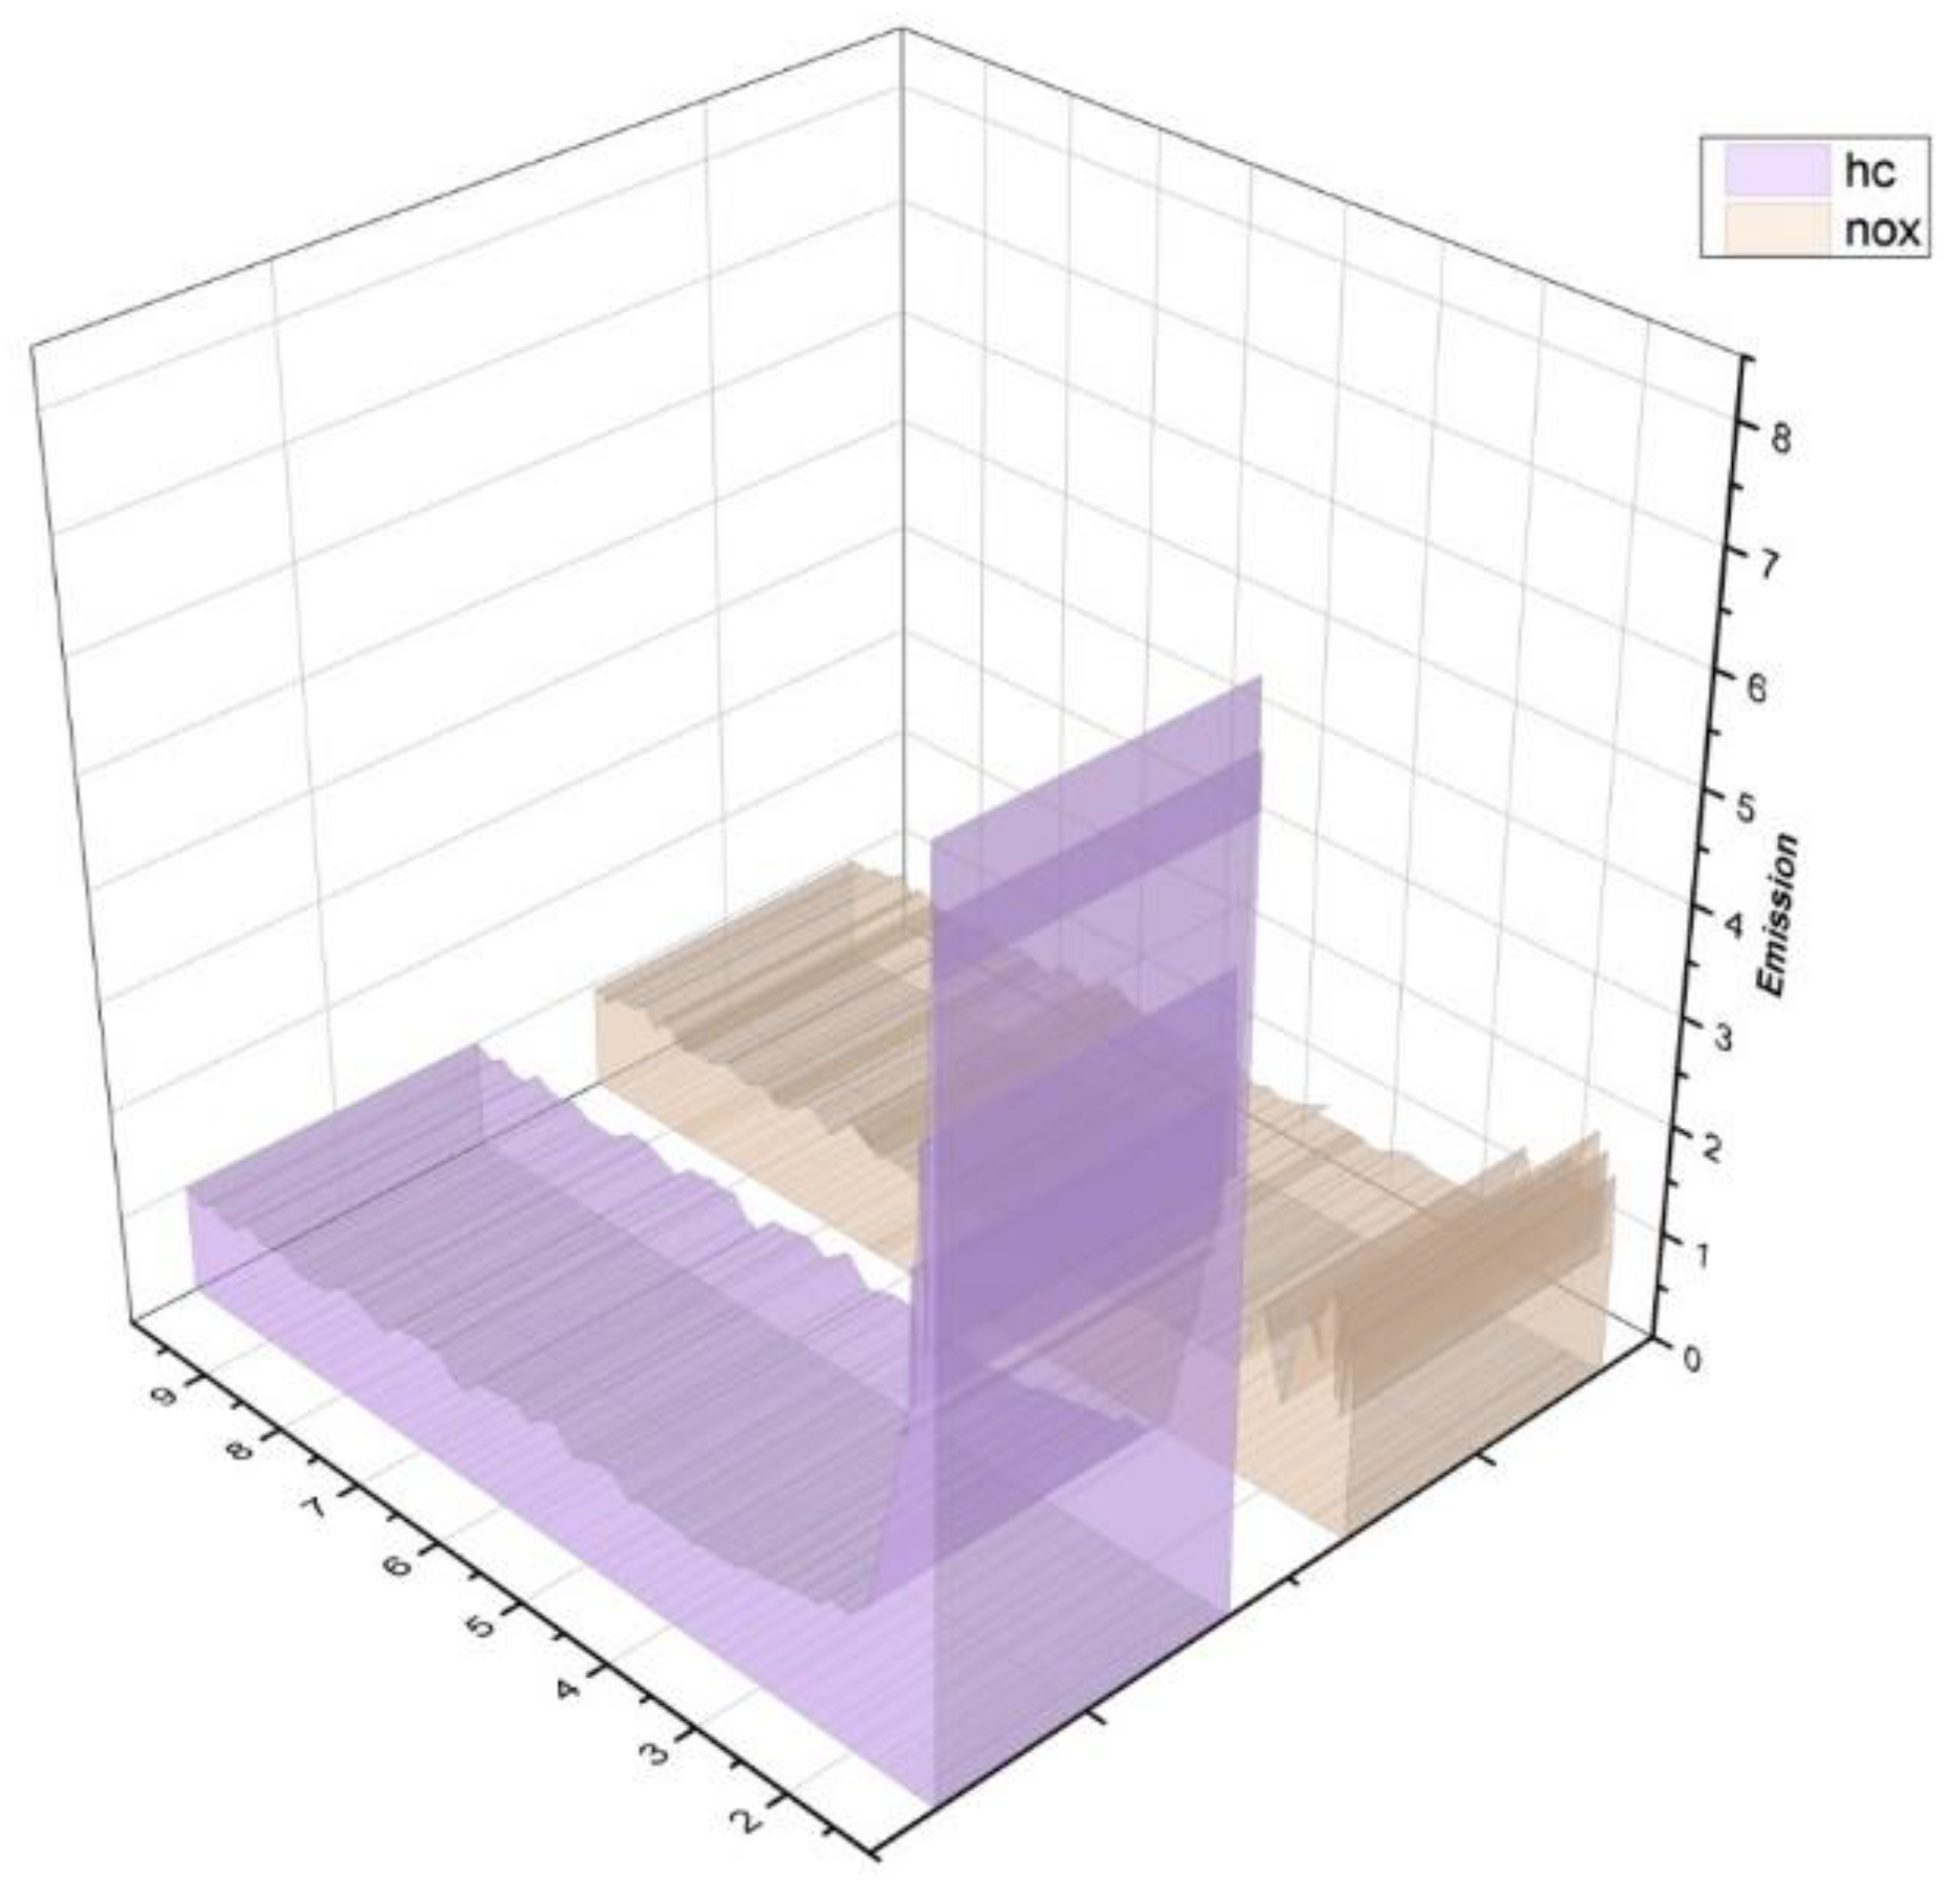
Figure 12.
SOC curves.

Table 1.
List of Abbreviations.
| Abbreviations | Definitions |
|---|---|
| EV | Electric Vehicles |
| BEV | Battery Electric Vehicles |
| BMS | Battery Management System |
| SOC | State of Charge |
| SOH | State of Health |
| ECU | Vehicle or Electronic Controller Units |
| OSMC-EV | Operation Service and Management Center for Electric Vehicle |
| ML | Machine Learning |
| FTA | Fault Tree Analysis |
| IB-DRN | Incipient Bat optimized Deep Residual Network |
| ICC | Interclass Correlation Coefficient |
| SPCA | Sparse Principal Component Analysis |
| PCA | Principle Component Analysis |
| SVD | Singular Value Decomposition |
| PCs | Principal Components |
| QR decomposition | QR factorization | Q is orthonormal, and R is higher triangular |
| SPCs | Sparse Principal Component |
| PVE | Proportion of Explained Variation |
| EMPA | Enhanced Marine Predators Algorithm |
| ANN | Artificial Neural Network |
| SVM | Support Vector Machine |
| LR | Linear Regression |
| GPR | Gaussian Process Regression |
| UDDS | Urban Dynamometer Driving Schedule |
| TP | True Positives |
| FP | False Positives |
| FN | False Negatives |
| MSE | Mean Squared Error |
| RMSE | Root Mean Square Error |
Table 2.
Sample sensor data.
| Battery Voltage (V) | Battery Current (A) | Battery Temperature (°C) | State of Charge (%) | State of Health (%) | Charge/Discharge Status | Charging Power (kW) | Charging Time (h) | Cell Voltage (V)—Cell 1 | Cell Voltage (V)—Cell 2 | Cell Voltage (V)—Cell 3 | Cell Voltage (V)—Cell 4 | Cell Voltage (V)—Cell 5 |
|---|---|---|---|---|---|---|---|---|---|---|---|---|
| 385 | 80 | 35 | 75 | 95 | Charging | 10 | 2 | 3.8 | 3.9 | 3.7 | 3.6 | 3.5 |
| 386 | 82 | 35.2 | 75.2 | 94.9 | Discharging | 10 | 2.01 | 3.9 | 3.8 | 3.6 | 3.7 | 3.4 |
| 387 | 85 | 35.4 | 75.4 | 94.8 | Charging | 10 | 2.02 | 3.7 | 3.9 | 3.5 | 3.6 | 3.3 |
| 388 | 88 | 35.6 | 75.6 | 94.6 | Discharging | 10 | 2.03 | 3.8 | 3.7 | 3.6 | 3.5 | 3.4 |
| 389 | 90 | 35.8 | 75.8 | 94.4 | Charging | 10 | 2.04 | 3.9 | 3.8 | 3.7 | 3.6 | 3.5 |
Table 3.
Enchased MPA Algorithm Matrix.
| Algorithm: The Enhanced MPA |
|---|
| Initialize search agents or the prey population i = 1,⋯,N |
| t = 1 |
| while (t < Max T) |
| Calculate the fitness and create the Elite matrix |
| Update prey using Equation (11) |
| else if |
| for |
| Update prey based on Equation (14) |
| for |
| Update prey based on Equation (19) |
| else if |
| Update prey based on Equation (22) |
| End if |
| Achieve memory saving and update Elite matrix |
| Apply the effect and update using Equation (24) |
| Accomplish memory saving and update Elite matrix |
| end while |
Table 4.
Enchased MPA—Incipient Bat Algorithm.
| Algorithm: Incipient Bat Algorithm |
|---|
| 1 Define the objective function ; |
| 2 Initialize the bat population ; |
| 3 for each bat in the population do |
| 4 Initialize the velocity the pulse rate and loudness ; |
| 5 Define the frequency at position ; |
| 6 while termination criterion not reached do |
| 7 for each bat in the population do |
| 8 if rand then |
| 9 Select one solution among the best ones. |
| 10 Generate local solution around the best one. |
| 11 Generate a new solution by flying randomly. |
| 12 if then |
| 13 Accept the new solutions. |
| 14 Increase the and reduce ; |
| 15 Rank bats and find current best solution |
Disclaimer/Publisher’s Note: The statements, opinions and data contained in all publications are solely those of the individual author(s) and contributor(s) and not of MDPI and/or the editor(s). MDPI and/or the editor(s) disclaim responsibility for any injury to people or property resulting from any ideas, methods, instructions or products referred to in the content. |
© 2023 by the authors. Licensee MDPI, Basel, Switzerland. This article is an open access article distributed under the terms and conditions of the Creative Commons Attribution (CC BY) license (https://creativecommons.org/licenses/by/4.0/).
Share and Cite
MDPI and ACS Style
Kosuru, V.S.R.; Kavasseri Venkitaraman, A. A Smart Battery Management System for Electric Vehicles Using Deep Learning-Based Sensor Fault Detection. World Electr. Veh. J. 2023, 14, 101. https://doi.org/10.3390/wevj14040101
AMA Style
Kosuru VSR, Kavasseri Venkitaraman A. A Smart Battery Management System for Electric Vehicles Using Deep Learning-Based Sensor Fault Detection. World Electric Vehicle Journal. 2023; 14(4):101. https://doi.org/10.3390/wevj14040101
Chicago/Turabian StyleKosuru, Venkata Satya Rahul, and Ashwin Kavasseri Venkitaraman. 2023. "A Smart Battery Management System for Electric Vehicles Using Deep Learning-Based Sensor Fault Detection" World Electric Vehicle Journal 14, no. 4: 101. https://doi.org/10.3390/wevj14040101