Article

Modeling the Impact of Different Policies on Electric Vehicle Adoption: An Investigative Study

by
Pg Emeroylariffion Abas
* and
Benedict Tan
Faculty of Integrated Technologies, Universiti Brunei Darussalam, Bandar Seri Begawan BE1410, Brunei
*
Author to whom correspondence should be addressed.
World Electr. Veh. J. 2024, 15(2), 52; https://doi.org/10.3390/wevj15020052
Submission received: 31 December 2023 / Revised: 25 January 2024 / Accepted: 2 February 2024 / Published: 5 February 2024

Abstract

:
Electric Vehicles (EVs) emerge as a crucial solution for alleviating the environmental footprint of the transportation sector. However, fostering their widespread adoption demands effective, targeted policies. This study introduces a versatile model, amalgamating stakeholders and policies and leveraging local data with broader market applicability. It delineates two key EV adopter groups—innovators and imitators—shedding light on their evolving impact on adoption trends. A pivotal feature of the model is the factoring of EV attractiveness, comprising Life-Cycle Cost (LCC), Driving Range, Charging Time, and infrastructure availability, all of which are expected to improve with the fast technological advancement of EVs. Financial policies, notably subsidies, prove potent in boosting EV adoption but fall short of targeted sales due to imitator lag. In response, a pragmatic solution is proposed: a government-led EV acquisition of 840 EVs, coupled with a 20% subsidy on new EV purchases and a 20% tax on new ICEV purchases, potentially realizing a 30% EV sales target by 2035. Future research avenues may delve into behavioral dynamics prompting imitators’ adoption, optimizing EV infrastructure strategies, and assessing the socio-economic impacts of EVs. Interdisciplinary approaches hold promise for enriched insights for effective EV integration policies.

1. Introduction

The fast-increasing global population has precipitated an insatiable demand for fossil fuels, crucial for sustaining the burgeoning energy demands required to fuel societal and economic progress [1]. Alas, this burgeoning need has spawned a litany of environmental perils intricately linked with the combustion of these fossil resources, prominently marked by pervasive pollution and the dire exacerbation of global warming. Projections hint at an impending surge in energy requirements, a trajectory poised to exacerbate these already looming threats, amplifying the gravity of these environmental quandaries [2]. The transportation sector—encompassing land; air; and sea travel—stands as a foremost consumer of these fossil fuels. Its substantial contribution to our environmental challenges has prompted significant efforts aimed at mitigating the associated environmental footprints [3].
The implementation of fuel standards and labeling systems has been long advocated to eradicate inefficient products from the market [4,5]. These measures incentivize manufacturers to enhance efficiency while empowering consumers with pertinent information on prices and performance [6], playing a pivotal role in diminishing the environmental footprint attributable to the transportation sector. Researchers have also suggested the adoption of renewable energies, particularly biofuels, as a means to alleviate our reliance on fossil fuels as the primary energy source and mitigate greenhouse gas (GHG) emissions [6]. Depending on the specific feedstocks utilized, biofuel production may encroach upon human food production and land use. Additionally, the technological maturity necessary for the cost-effective and efficient production of biofuels remains insufficient. Consequently, the adoption of biofuels as alternative energy sources remains relatively limited.
A remarkable endeavor aimed at mitigating environmental impacts within the transportation sector involves the promotion of Electric Vehicles (EVs), leading to extensive research into various facets of EV technology [7,8,9]. The adoption of EVs has steadily risen. Notably, there are a total of 26 million electric vehicles on the road worldwide, with worldwide sales of electric vehicles exceeding 10 million in 2022 [10]. Battery Electric Vehicles (BEVs) have emerged as frontrunners as potential replacements for ICEVs, although in recent years, Hydrogen Fuel Cell Electric Vehicles (FCEVs) have been gaining interest [11]. Hydrogen vehicles employ fuel cells to convert hydrogen gas into electric current, efficiently powering the motor. They are gaining popularity, especially in research, due to their swift refueling capability and the ability to achieve extended travel distances with high energy efficiency. However, the availability and environmentally friendly production of hydrogen gas to power FCEVs are some issues related to hydrogen vehicles. In contrast, Battery Electric Vehicles rely on batteries charged by the electrical grid, with their environmental effects dependent on the power source. Forecasts anticipate a further surge in BEV adoption, propelled by expected technological advancements in battery technology and the resultant economies of scale [12]. Additionally, BEVs have enjoyed considerable head-start as potential replacements for ICEVs, compared to hydrogen cars [13], and consequently, this paper has focused on BEVs in its narrative.

2. Literature Review

Several studies [14,15,16,17,18] have focused on evaluating the economic competitiveness of Electric Vehicles (EVs) in a market historically dominated by traditional Internal Combustion Engine Vehicles (ICEVs), with mixed results. Economic competitiveness was calculated by considering 3 stages of the vehicle lifetime: manufacturing until sales, during operation, and the recycling stages in Ref. [14], with results demonstrating that EVs are still 9% more expensive than ICEVs. Similarly, economic analysis comparing ICEVs and EVs during their operation stage only (from sales to disposal) has indicated EVs are still relatively expensive compared to ICEVs, despite the progressive reduction in the selling price of EVs over the years [15]. On the other hand, it has been argued that while EVs are unable to compete with popular ICEVs, they can be more financially attractive compared to some of the European premium brands [18]. These studies, however, simplify their analysis by ignoring the discounted effect of money. Our previous works [7,8,19] related to electric vehicles have considered present value calculations and concluded that neither EVs, EV vehicles, nor EV charging infrastructure are yet able to compete with ICEVs without additional incentives by the government. Conversely, Ref. [17] concluded that EVs are cheaper than ICEVs when studying the French market. These varied outcomes underscore the intricate interplay between the diverse cost elements that dictate the economic competitiveness of vehicles, many of which are dictated by the local market conditions and interactions between actors in the market. Consequently, in assessing the potential competitiveness of Electric Vehicles (EVs) within a given market, conducting an analysis using parameters directly derived from that market becomes imperative.
Feasibility studies on Electric Vehicles (EVs) have put forward diverse policy recommendations aimed at fostering their adoption and integration into existing transportation frameworks [20,21,22]. These studies, conducted across various regions and economies, propose multifaceted strategies to bolster the feasibility and attractiveness of EVs in the market. Suggestions encompass a spectrum of measures, including but not limited to incentivizing EV purchases through tax credits or subsidies [23], expanding charging infrastructure networks to alleviate range anxiety [24], fostering research and development initiatives to enhance battery technology and efficiency [25], and implementing regulatory frameworks that promote environmental sustainability and reduce reliance on fossil fuels. These proposed policies underscore the complex and interconnected nature of factors influencing the widespread adoption of EVs, emphasizing the need for comprehensive, multifaceted approaches to realize their full potential within the transportation landscape.
The intricate and interconnected web of factors shaping Electric Vehicle (EV) adoption renders the process highly challenging to predict with certainty. However, despite this complexity, the necessity to model and forecast EV adoption remains paramount for several reasons [26]. Firstly, such predictive models serve as invaluable tools for policymakers, industry stakeholders, and researchers, offering insights into the potential trajectory and pace of EV uptake [27]. These models aid in devising informed strategies and policies tailored to bolster adoption rates, including the allocation of resources for charging infrastructure development, incentives for consumers and manufacturers, and investment in technological advancements. Moreover, predictive models help mitigate uncertainties by offering scenario analyses, enabling stakeholders to anticipate and prepare for various potential outcomes and contingencies. Additionally, these models provide a foundation for assessing the impact of different variables, such as economic factors, technological advancements, government policies, and consumer behaviors, thereby guiding strategic decision-making in the evolving landscape of sustainable transportation. In essence, despite the complexities involved, predictive models play an indispensable role in charting the course and optimizing the transition toward widespread EV adoption.
Limited studies [28,29,30,31] have attempted to address this issue. The Bass diffusion model, which splits adopters into innovators and imitators, was used to predict EV numbers, specifically in Beijing [32], by using a fuzzy analytic hierarchy process to predict important coefficients of the model due to a lack of historical data. Similarly, the Bass diffusion model has also been employed to explore EV adoption in wider China [33]. Both studies, however, have assumed constant market potential for EV adopters, i.e., constant potential adopters and EV attractiveness, without considering the annual increase in the total number of vehicles or the effect of the fast improvement in EV technologies. On the other hand, Ref. [34] adopted a modified Bass Diffusion model by introducing time-varying functions to account for the effect of improvements in EV technologies, particularly charging time. The study concluded that battery charging technology and infrastructure provision are crucial for the success of EVs in Germany. The Bass diffusion, discrete choice, and regression models were used to study EV adoptions under different scenarios in a comprehensive study by harnessing sales data from 39 countries [35]. Particularly, the effect of EV purchase price was considered in the diffusion model to demonstrate the varying EV adoption rates across the different countries. Ref. [36] leveraged the Bass diffusion model, incorporating latent classes as input variables, revealing that affluent households might not consistently represent the dominant group of EV adopters in California. This underscores the need for policymakers globally to formulate strategies targeting middle-income demographics in order to augment the diffusion of EVs in the market. A more recent attempt to investigate the effect of policies on EV adoption considers the attractiveness of EVs in terms of economic benefits derived from EVs by factoring them into the Bass Diffusion model [29,30]. The studies concluded that it is necessary for governments to reduce taxes on EVs as well as implement policies that assist in improving the driving range and manufacturing costs of EVs. However, these studies have ignored the time value of money in their analysis.
It is clear from the above that a more robust method of modeling EV adoptions is needed to forecast EV adoptions in the years to come as well as to explore the most effective policies that are needed to accelerate EV adoptions, especially with many countries having set targets related to EV adoptions. This paper aims to fill this research gap by making the following contributions to the body of knowledge on this topic:
The development of a model, considering the different stakeholders in the EV ecosystem, that is able to predict EV adoptions,
The developed model utilizes the generic Bass Diffusion Model by considering EV attractiveness from the perspective of potential EV adopters while acknowledging the time value of money.
Demonstration of the developed model using local data to predict EV adoptions,
Using the model to analyze different policies to predict their effectiveness in accelerating EV adoptions.
However, it is important to highlight that although local data were utilized, the methodologies applied are versatile and directly applicable for analyzing other markets. This paper is structured as follows: The Introduction section provides background to the studies, with the Literature Review section providing the relevant works related to the topic, particularly those relating to economic feasibility studies of EVs and available studies on EV adoptions. This is followed by the Methodology section, explaining the developed model used to predict EV adoptions. Results obtained using the developed model are given in the Result and Discussion section, with discussions on the effects of different policies elaborated in the section. The last section concludes this paper.

3. Methodology

3.1. Stakeholder Analysis of the Electric Vehicle Ecosystem

The adoption of electric vehicles (EVs) represents a multifaceted socio-technical development process that involves a diverse array of stakeholders. Due to the advantages associated with EVs, it is in the interest of many stakeholders that EVs get adopted as replacements for Internal Combustion Engine Vehicles (ICEVs), and commonly, the responsibility falls on the government to encourage their adoption by legislating different policies. Analytical reflection on the effects of different policies is of importance in the policy-making realm. In the first instance, it is essential to identify and understand the various direct and indirect stakeholders in the EV ecosystem [37], and these are parties who will be affected by or will affect the EV ecosystem [38]. Stakeholder analysis serves as a valuable tool to identify relations between interdependent stakeholders, perceptions of the stakeholders of the EV ecosystem, values in relation to these stakeholders, including objectives and interests, and their resources related to the EV ecosystem [30,39]. Table 1 below provides the stakeholder analysis specific to the EV eco-system. Government, ICEV users, automotive industries, and charging station providers are similar stakeholders identified in Ref. [29], with the EV workshop identified through reflection of the local EV ecosystem. The perception, values, and resources columns were a collection of information in the literature [29,39,40].
In the Bruneian test case, the impetus for EV implementation is primarily driven by the government, with the adoption of EVs aligning nicely with the government’s objective of mitigating CO2 emissions and contributing to a more environmentally sustainable future for Brunei, thereby coming closer to the implementation of its 2035 Wawasan target. Brunei is also one of the highest users of ICEVs, with per capita usage of approximately 1 vehicle per capita, with EVs constituting only a very small percentage [41]. The increased adoption of EVs and the use of renewable energies have been touted as the way forward to reduce CO2 emissions. Within the automotive industries in the country, Brunei is a buyer of automotive technology rather than a manufacturer, with the automotive industries merely functioning as the importers of different foreign vehicles. Rather than a disadvantage, this market structure makes it easier for Brunei to adopt EVs, as the automotive importing industries can easily adapt to EV demands as required. It also represents an opportunity for Brunei to set up new industries related to EVs. So far, there are a very limited number of charging stations, with the available EVs in Brunei relying on home-based chargers to charge their EVs. Thus far, the charging stations are run by Brunei Shell Marketing Co., a government subsidiary company that is also the main distributor of fuel in Brunei. There is yet to be a workshop that specializes in EVs. However, EVs are relatively easier to maintain, with limited moving parts and limited expertise required. While EVs are expected to reduce CO2 emissions, their increased adoption is expected to increase electricity demand with uncertain electric usage. Indeed, much research has been carried out to analyze the effect of EV adoption on the electricity grid.

3.2. Model Development

3.2.1. Model for EV Adoption

An EV adoption model must consider all, if not most, of the factors that influence the decisions of potential EV adopters in their decision-making process. The total number E V t o t a l t of EVs at time t in the eco-system is the total number of EVs E V t o t a l t 1 in the previous year i.e., year t 1 and the number of EVs adopted in the current year E V n e w t less the number of retired EVs in the current year E V r e t i r e d t .
E V t o t a l t = E V t o t a l t 1 + E V n e w t E V r e t i r e d t
Via recursive substitution and taking t = 1 as the first adoption of EVs considered by the model in the eco-system, Equation (1) can be conveniently expressed as
E V t o t a l t = i = 1 t E V n e w i E V r e t i r e d i
The number of EVs adopted in the current year t is a proportion of the number of potential adopters N(t), represented by non-EV users. It is driven by the willingness W ( t ) of the potential adopters to adopt EVs and the attractiveness A ( t ) of EVs at that time.
E V n e w t = N t × W t × A ( t )
Bass diffusion theory may then be used to represent the willingness W ( t ) to adopt EVs by assuming two groups of potential adopters: (1) Innovators, and (2) Imitators [28]. Innovators are those who are the forerunners in EV adoptions, tend to make their purchasing choices without considering the influence of other consumers, and are primarily driven by advertisements and promotional materials. On the other hand, imitators are those that adopt EVs based on the perceptions of others who have already adopted EVs, and hence, they are primarily influenced by their social circles and word of mouth. Naturally, the larger the proportion of EVs adopted, the larger the number of imitators that can be expected. Based on these, the willingness W ( t ) to adopt EVs can be mathematically represented as
W t = α i n n o v a t o r s + α i m m i t a t o r s × E V t o t a l t 1 N ( t )
where α i n n o v a t o r s and α i m m i t a t o r s represent the coefficients of innovation and imitation, respectively.
Substituting Equation (4) into Equation (3), the number of EVs adopted in the current year t can be represented as
E V n e w t = N t . A t . α i n n o v a t o r s + A t .   α i m m i t a t o r s . E V t o t a l t 1
It can be seen that the innovators are concerned with the attractiveness of EVs A ( t ) , particularly in comparison to their substitutes, i.e., ICEVs. The coefficient of innovation can be increased by more effective promotion and advertisement of EVs. While the imitators are also concerned with the attractiveness of EVs A ( t ) , they are very affected by the total number of EVs already in the eco-system; this is particularly relevant during the early introduction of EVs to the market.
EV attractiveness A ( t ) captures the different factors that influence the attractiveness of EVs in comparison to their substitutes, particularly ICEVs, which are more established and the most widely used vehicles in the world. Of importance is the life-cycle cost (LCC) of adopting EVs in comparison to ICEVs. LCC captures the whole life cycle cost of owning an EV, discounted to the present value. Comparative studies between EVs and ICEVs in terms of their financial feasibility have given mixed results, with some research stating that EVs can already financially compete with ICEVs, in contrast to Ref. [42] stating otherwise. Ref. [19] has argued that it is necessary to perform analysis using local parameters to determine economic feasibility due to the complex interactions between the cost components of EVs and ICEVs. Other important parameters that factor into EV attractiveness include the driving range, availability of infrastructure, and charging time of EVs in comparison to ICEVs.
EV attractiveness A ( t ) can be seen as the likelihood of purchasing EVs, with its value normalized between 0 and 1 [30]. This can be calculated as the sum of the product of each factor and its relative importance to the local consumer.
A t = β L C C . F L C C ( t ) + β D R . F D R ( t ) + β I n f . F I n f ( t ) + β C T . F C T ( t )
where β L C C , β D R , β I n f and β C T represent the relative importance of the LCC, driving range, availability of infrastructure, and charging time towards the attractiveness of EVs. Again, it is important to account for the relative importance of each factor within the local context, and for this study, the relative importance of the 4 factors was extracted from survey data. On the other hand, F L C C ( t ) , F D R ( t ) , F I n f ( t ) and F C T ( t ) represent the relative attractiveness of EVs relative to ICEVs in terms of LCCs, driving range, availability of infrastructure, and charging time. Generally, lower LCCs, shorter charging times, a higher number of charging infrastructures, and a longer driving range before the need for recharging are advantageous for the adoption of EVs. F L C C ( t ) , F D R ( t ) , F I n f ( t ) and F C T ( t ) at time t can be determined as,
F L C C ( t ) = 1 2 L C C I C E V ( t ) L C C E V ( t ) m a x L C C E V ( t ) , L C C I C E V ( t ) + 0.5
F D R ( t ) = 1 2 D R E V ( t ) D R I C E V ( t ) m a x D R E V ( t ) , D R I C E V ( t ) + 0.5
F I n f ( t ) = 1 2 I n f E V t I n f r a t i o , E V I n f I C E V t I n f r a t i o , I C E V   m a x I n f E V t I n f r a t i o , E V , I n f I C E V t I n f r a t i o , I C E V   + 0.5
F C T ( t ) = 1 2 C T I C E V ( t ) C T E V ( t ) m a x C T I C E V ( t ) , C T E V ( t ) + 0.5
where L C C E V , D R E V , I n f E V , and C T E V are LCC, driving range, number of charging infrastructure and charging time for EVs, respectively, whilst L C C I C E V , D R I C E V , I n f I C E V , and C T I C E V are LCC, driving range, number of refueling infrastructure and charging time for ICEVs, respectively. For relative attractiveness in terms of infrastructure, the number of charging infrastructure and refueling infrastructure is divided by the ideal ratio of recharging infrastructure/EV, I n f r a t i o , E V and refueling infrastructure/ICEV, I n f r a t i o , I C E V .
Relative attractiveness in terms of the different factors considers the disparity between EVs and ICEVs, which are then normalized by dividing by the maximum of either EVs or ICEVs, taking half the values, and adding 0.5 [43], to give values between 0 and 1.
Driving range, number of charging/refueling infrastructures, and charging/refueling times for EVs and ICEVs can be obtained directly from the available local data. However, LCC requires consideration of the overall cost over the lifespan of the vehicles, with the methodology adopted to determine LCCs described in the following section.
Figure 1 depicts the flowchart of the developed model used to determine EV adoptions. The flowchart outlines the process used to simulate and predict electric vehicle (EV) adoption over time, starting from t = 0 , the initial point of the simulation. The model operates with the following key steps:
  • Initial Conditions ( t = 0 ): The simulation begins with an input of the total number of EVs in the ecosystem at the start ( E V t o t a l ( 0 ) ).
  • Time Progression ( t 1 ): The model aims to predict the number of EV adoptions for any time t 1 .
  • Quantifying Relative Attractiveness ( F L C C ( t ) , F D R ( t ) , F I n f ( t ) and F C T ( t ) ): At each time t , the model assesses the competitiveness of EVs against ICEVs in terms of life cycle cost ( F L C C ( t ) ), driving range ( F D R ( t ) ), infrastructure availability ( F I n f ( t ) ), and charging time ( F C T ( t ) ). These factors are calculated using Equation (7) through Equation (10), as detailed in Section 3.2.2. The model assigns a relative attractiveness score between 0 and 1, where a score of 0.5 indicates that EVs and ICEVs are equally competitive. A score above 0.5 suggests that EVs are more competitive than ICEVs, while a score below 0.5 points to EVs being less competitive compared to ICEVs.
  • Consideration of Relative Importance: Different users assign varying importance to the aspects of relative attractiveness. Therefore, the model incorporates relative importance factors to derive an overall EV attractiveness score A ( t ) , as defined in Equation (6). The relative importance of the LCC ( β L C C ) , driving range ( β D R ), availability of infrastructure ( β I n f ) and charging time ( β C T ) towards the attractiveness of EVs is determined using a survey to ensure alignment with local relative importance.
  • Determining Annual EV Adoption ( E V n e w ( t ) ): Using the calculated EV attractiveness ( A ( t ) ), along with the coefficients of innovation ( α i n n o v a t o r s ) and imitation ( α i m m i t a t o r s ), the number of potential adopters ( N ( t ) ), and the total number E V t o t a l t 1 of EVs from the previous year t 1 in the ecosystem, the model estimates the number of new EV adopters ( E V n e w ( t ) ) for the current year t .
  • Accumulating Total number of EVs ( E V t o t a l t ) at time t in the Ecosystem: The model updates the total number of EVs ( E V t o t a l t )in the ecosystem by adding the newly adopted EVs ( E V n e w ( t ) ) for the year ( t ) and subtracting the number of EVs retired (( E V r e t i r e d ( t ) ) in the same year.
This methodology provides a comprehensive framework for understanding and predicting EV adoption dynamics, considering both the comparative advantages of EVs over ICEVs and user-specific preferences. The model’s adaptability to various local conditions and its ability to integrate a broad range of factors make it a valuable tool for policymakers and stakeholders in the EV industry.

3.2.2. Life Cycle Cost

Life Cycle Cost (LCC) encompasses all expenses tied to either EV or ICEV over its lifespan, considering the time-value of money. This includes acquisition (AC), the various operating (OC) and maintenance (MC) costs, and less salvage value (SV) that may be obtained upon disposal of the vehicle or any of its components [44].
The acquisition cost (AC) of a vehicle only considers the Manufacturer Suggested Retail Price (MSRP) without any added import tax. As electric vehicles (EVs) are relatively new, no tax rate has been decided by the government yet, and since EVs operate differently from ICEVs and do not rely on internal combustion engines, the usual vehicle import tax rates based on engine capacity are not applicable. Additionally, the assumption is that the vehicles are bought outright without loans, freeing the acquisition costs from fluctuating interest rates. These acquisition costs are incurred solely at the start of the first year and hence are not affected by the present value calculations.
The Operating Cost (OC) comprises fuel expenses, either electricity for EVs or gasoline for ICEVs, along with the annual vehicle license fee V L ( t ) and yearly insurance coverage I C ( t ) incurred at year t. Fuel costs vary based on distance traveled and vehicle efficiency, with these expenses assumed to be incurred at the end of each year. Given that the EV has an efficiency of η E V and is charged from domestic electric sockets with a charging efficiency of η c h , whilst the ICEV has an efficiency of η I C E V , cost of fuel for the EV and ICEV can be determined,
F C E V t = η E V × d t × C e l e c η c h
F C I C E V t = η I C E V × d t × C g a s
where d t , C e l e c and C g a s are distance traveled at year t, per unit of cost of electricity and gasoline, respectively.
Typically, the vehicle license fee V L ( t ) is calculated based on the usage category and engine displacement. On the other hand, the insurance coverage cost I C ( t ) is influenced by the type of coverage and the vehicle’s value. Third-party coverage is assumed for both EVs and ICEVs, offering uniform protection and therefore incurring an equal expense. Given an assumed interest rate of r with a vehicle lifetime of n, operating cost (OC) can be represented as,
O C = t = 1 n F C t + V L t + I C ( t ) 1 + r t
Maintenance costs considered are service and periodic maintenance P M t , as well as battery B R t and tire replacements T R t . Unscheduled maintenance and repairs are excluded due to uncertainty issues. Period maintenance P M t is determined by the maintenance rate per distance (MR), which is acquired from the manufacturer and accrued at the end of each year, while battery and tire replacement expenses are accrued in the year when replacements are necessary, as specified by vehicle and tire manufacturers. Maintenance costs (MC) can be represented as:
M C = t = 1 n M R × d ( t ) + B R t + T R ( t ) 1 + r t
On the other hand, the Salvage Value (SV) encompasses both the scrap worth of batteries S B ( t ) upon replacement and the vehicle S C at the end of its lifespan, with the values being disbursed in the year when the vehicle or battery is scrapped.
S C = t = 1 n S B ( t ) 1 + r t + S C 1 + r n
Collectively, the life cycle cost (LCC) of an EV or ICEV can be represented as in Equation (15), with a higher LCC indicating a more costly vehicle over its lifetime.
L C C = A C + t = 1 n F C t + V L t + I C t + M R × d ( t ) + B R t + T R t S B ( t ) 1 + r t S C 1 + r n

3.3. Different Financial Policies Affecting EV Adoptions

Equation (1) above can be used to determine the total number of EVs in the eco-system at time t, with Equation (3) used to calculate the number of new EVs adopted in year t. Different policies are expected to have different effects on the adoption of EVs. Common policies have been explored by different researchers/policymakers to increase EV adoption. The most obvious of which is by introducing subsidies towards the purchase of new EVs as well as towards electricity prices, effectively reducing acquisition and operating costs, respectively. Within the above model, reducing both acquisition and operating costs directly reduces the LCC of EVs and makes EVs more attractive, albeit with different levels of effectiveness.
Other policies that may affect EV adoption are making its substitutes, i.e., ICEVs, more expensive, either by putting on a tax on new purchases of ICEVs or by increasing the price of gasoline. Effectively increasing the acquisition and operating costs of ICEVs may indirectly make EVs more competitive. As such, the effects of tax/subsidies on the acquisition costs of EVs and ICEVs, as well as the effects of tax/subsidies on the operating cost components of EVs and ICEVs, were studied.

4. Results and Discussion

The methodologies described in the prior section are used to assess the effect of different policies on EV adoption, particularly in the Bruneian market. Local data extracted from research papers, technical notes, and reports by manufacturers and subject-matter experts, along with the most recent market prices collected from diverse sources, was used in this analysis. It should be noted that while local Brunei data were used, the methodologies employed in this paper can be applied and easily adapted for analyzing the effect of different policies on different markets.

4.1. Data Requirement

Table 2 gives the important input parameters for the model required to estimate the adoption of EVs in Brunei. Coefficients of innovation α i n n o v a t o r s and imitation α i m m i t a t o r s were taken to be 0.025 and 0.42, respectively [28,45]. These values are considered more suitable to assess the adoption of the new EV technology. A survey was conducted to assess the perceived importance of four key factors influencing the adoption of electric vehicles (EVs): Life Cycle Cost (LCC), Charging Time, Driving Range, and Availability of Infrastructure. Definitions of LCC, driving range, availability infrastructure, and charging time of vehicles were clearly articulated with examples at the outset of the survey to ensure consistent and common understandings. Participants were asked to allocate a total of 100 points across these factors based on their individual importance in the decision-making process for adopting an EV. A Likert scale ranging from 0 to 100 was used, where respondents assigned points to each factor according to its perceived significance, with clear instructions provided to participants to distribute points among the factors while ensuring the total equaled 100. This approach allowed for a nuanced understanding of individual preferences and provided insights into the relative importance of each factor in the decision-making process. The survey was administered online within a period of 1 month to a diverse sample of participants, including EV owners, potential adopters, and individuals with no current plans to switch to an EV. More than 300 respondents participated in the survey. The data collected were then analyzed using descriptive statistics to determine average point allocations for each factor, providing a comprehensive overview of the perceived importance of these variables in the context of EV adoption. Subsequently, the relative importance of LCC ( β L C C ), driving range ( β D R ), availability of infrastructure ( β I n f ) and charging time ( β C T ) were taken to be 53.6%, 12.5%, 25%, and 8.9%, respectively. The current charging time of EVs is approximately 53 min, with an average driving range of approximately 300 km. The very low importance placed on charging time signals that the locals are satisfied with the current requirement for charging time. While the driving range is still short as compared to ICEVs, the small size of Brunei does not necessitate long travel; this equates to the low relative importance put on the driving range. The largest concern from the perspective of EV potential adopters is the LCC of EVs, with previous research clearly indicating that EVs are not yet economically feasible [19]. However, EVs have improved since the studies in Ref. [19], with improvements in terms of battery price, driving range, and charging time.
Data from the Department of Land Transport, Brunei Darussalam, indicates that the total number of vehicles in 2022 was approximately 300,000, comprising only 19 EVs. Past data has shown that Brunei has been seeing an increase of 0.4% in sales of new vehicles, with 10,949 vehicles sold in 2022.
For the study, Neta V and Toyota Vios have been chosen as the representatives for EVs and ICEVs in Brunei. Neta V was newly introduced in Brunei during the 27th Consumer Fair and has been receiving strong interest from potential buyers due to its affordability and performance. On the other hand, the Toyota Vios has been the most popular model in Brunei for a number of years now. Table 3 presents a summary of the key parameters utilized for LCC calculations, considering a vehicle lifespan of approximately 200,000 miles. With an annual mileage Dᵢ of 14,235 km, this results in a vehicle lifespan n of around 23 years.
Neta V uses a large capacity (38.5 kWh) battery, allowing it to travel a distance of 300 km on one charge. Assuming a fast-charging outlet of 50 kW power output and a charging loss of 12.38% [46], Neta V would require approximately 53 min of charging time. Additionally, a 3.97% annual charging time [47] and approximately 6.7% annual driving range improvement rates [48] are assumed based on past data. These improvements are due to the rapid improvement of battery technologies. The price of batteries is also expected to reduce by between 6 and 9%, reducing the overall price of EVs as well as battery replacement. With the expected increase in the number of EVs on the road, there needs to be a proportional increase in the number of charging stations, despite most EVs being equipped with home charging facilities. To simplify our calculation, the relative attractiveness of EVs relative to ICEVs, in terms of the availability of infrastructure, is taken to be 0.5, i.e., both EVs and ICEVs have equally sufficient infrastructure to support adoption.
Table 3. Important Parameters for EV and ICEV [19,49,50].
Vehicles TypeEVICEV
Engine- (hp or cc)95 hp1329 cc
Battery Size—kWh38.50.42
Vehicles Lifetime, n-years2323
Acquisition costUSD$22,99517,275
BND$(31,273)(23,494)
Vehicle Efficiency, ηEV, or ηICEV—kWh/km or L/km0.130.052
Annual Distance Travelled, Di—km [51]14,23514,235
Fuel Cost, Celec,i, C g a s , i USD$/kWh or USD$/L0.070.39
BND$/kWh or BND$/L(0.10)(0.53)
Charging Efficiency, ηch—%87.62%-
Current Charging/Refueling time—min52.75
Current Driving Range—km300548
Ann. Vehicle Lic. fee, VLiUSD$24.2922.65
BND$(32.06)(29.90)
Ann. Ins. Cover, ICiUSD$75.7675.76
BND$(100)(100)
Maintenance Rate, MRiUSD$/km0.02340.0442
BND$/km(0.0309)(0.0456)
Tyre Rep. CostUSD$273273
BND$(359.04)(359.04)
Tyre Average Lifetime—km35,00035,000
Current Batt. Rep. rateUSD$/kWh299299
BND$/kWh(407)(407)
Battery Lifetime—years84
Scrap Val. for batt.USD$2.212.21
BND$(3)(3)
Scrap Val. for vehicleUSD$22.0622.06
BND$(30)(30)

4.2. Predictions of EV Growth without Intervention

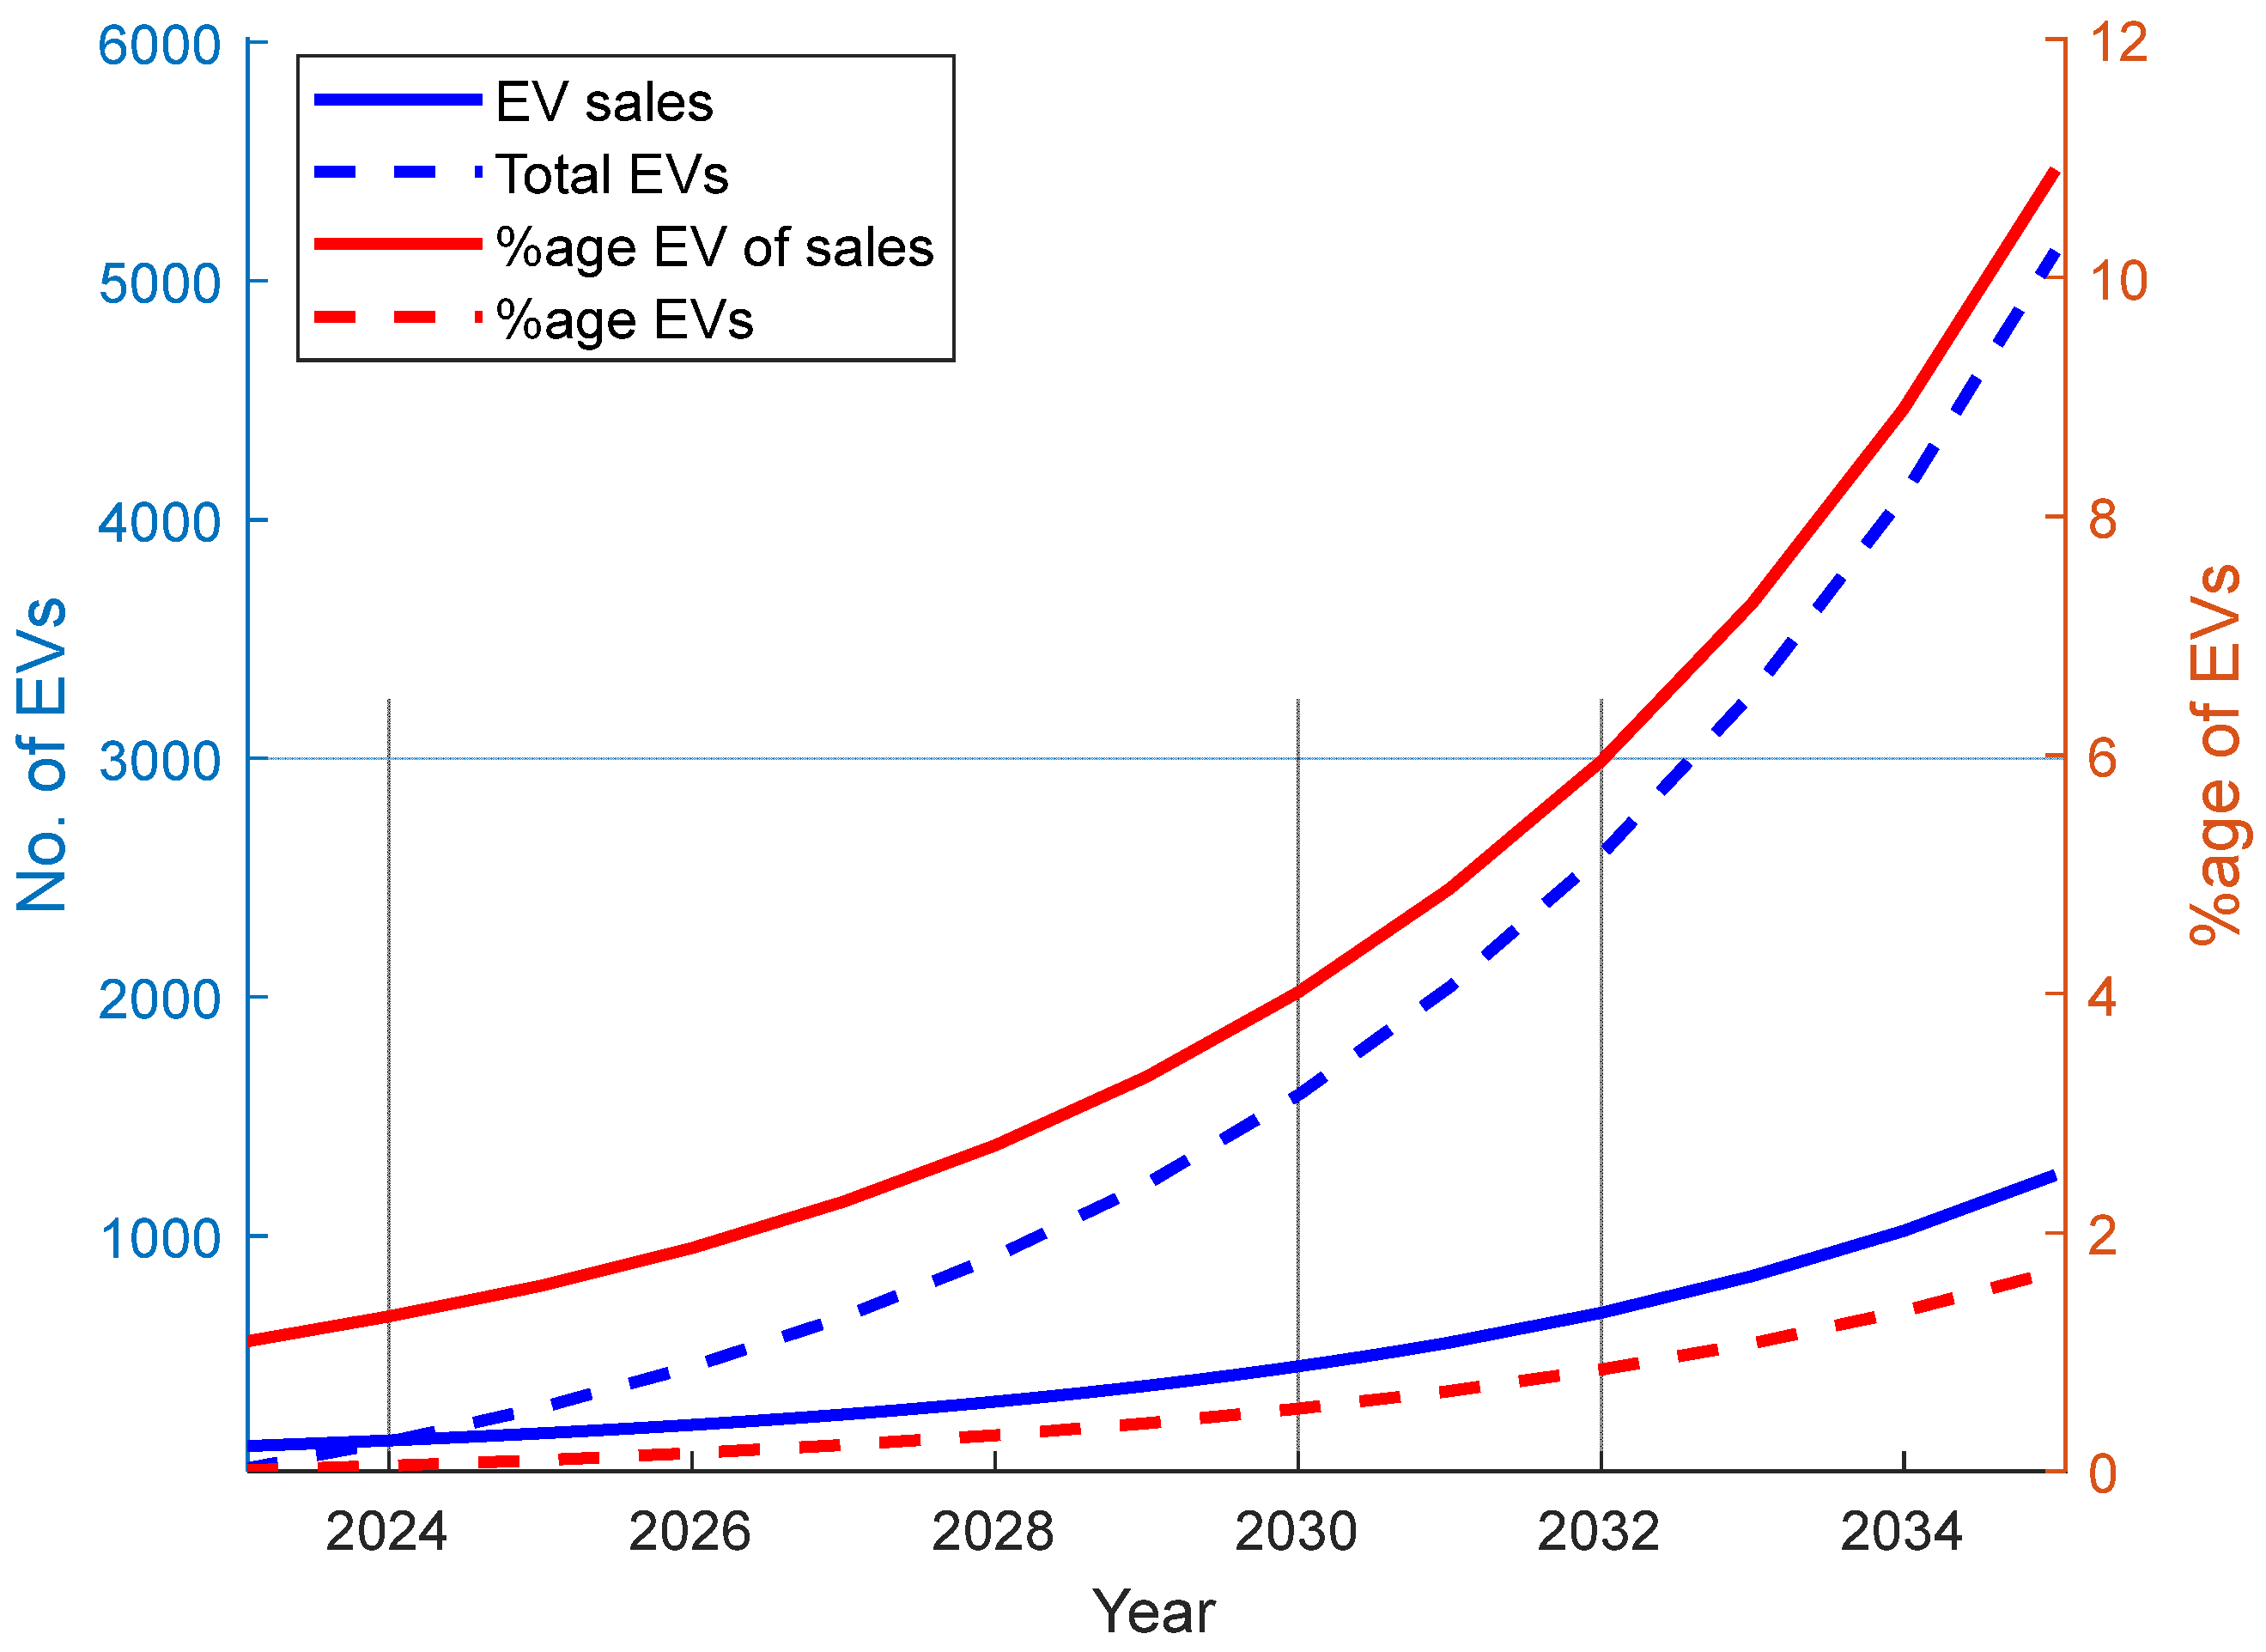
Figure 2 shows the number of EVs adopted and the accumulated number of EVs in different years, as well as their percentages. It can be seen that the number of EVs adopted increases from 118 EVs adopted in 2023 to 1255 EVs in 2035, causing the accumulated number of EVs on the road to accumulate from 19 EVs at the beginning of 2023 to more than 5100 EVs in 2035. Since EVs are a relatively new technology in Brunei, adoptions of EVs rely primarily on the innovators at an early stage. These early innovators cause an increase in the number of imitators, purchasing their EVs based on the perceptions of those early EV adopters, subsequently causing a ripple effect, increasing even further the number of EV adopters in the later years. This is evident from the exponential increase in the number of EV sales.
The segmentation of innovators and imitators as part of the EV adopters at different years is given in Figure 3a, showing that almost all of the EV adopters in the earlier years were composed of innovators (115 innovators and only 3 imitators), while the imitators made up almost 90% of the EV adopters in 2035 (155 innovators and 1101 imitators). The number of innovators increases slightly over the year due to improvements in EV attractiveness A ( t ) , however, the number of imitators increases exponentially due to the ripple effect as the number of EV adopters increases. Around 2027, the EV adopters will be composed of an almost equal number of innovators and imitators.
EV attractiveness A ( t ) increases over time, from 0.4194 in 2023 to 0.5371 in 2035, as can be seen in Figure 3b. This increase contributes to the slight increase in innovators and slightly contributes to the increase in imitators, with the bulk increase in imitators associated with the rippling effect of the increase in EV adopters. Overall, relative attractiveness in terms of LCC, charging time, and driving range increased, with the largest improvement seen in terms of driving range F D R ( t ) . However, the greater relative importance of LCCs, i.e., the factor β L C C results in the increase in F L C C ( t ) to contribute more to overall EV attractiveness.
Relative attractiveness in terms of LCC F L C C ( t ) increases from 0.4675 to 0.6190. Indeed, it can be seen from Figure 3c that the LCC of EVs is getting more economically feasible over time. The LCCs of EVs and ICEVs are USD$38,817 and USD$36,995, respectively, in 2023, while the LCC of EVs drops to USD$28,193 in 2035 (lower than the LCC of ICEVs). It can be seen that the LCCs of both EVs and ICEVs are dominated by their acquisition costs. Maintenance cost constitutes the second dominant cost, with the maintenance cost of EVs noticeably higher due to their large battery capacity of 38.5 kWh and the current high battery replacement rate, which contributes highly to the maintenance cost despite the assumed replacement frequency of once every 8 years and the assumed annual reduction price of a battery of 7.5% per annum. Operating costs constitute only a relatively small portion of LCCs due to the relatively cheap subsidized costs of electricity and gasoline in Brunei. LCCs of EVs are expected to reduce over the years, mainly due to the reduction in battery technology, lowering the price of batteries with an assumed price reduction of 0.5% per annum. This not only leads to a reduction in acquisition costs but also in maintenance costs. In relation to our model, this reduction in LCCs results in the observed increase in relative attractiveness in terms of LCC F L C C ( t ) and EV attractiveness A ( t ) .
Despite the expected increase in EV adoptions, the proportion of EV sales and the overall increase in the accumulated number of EVs are still relatively small due to the already large number of ICEVs. The percentage of EV sales will be a mere 1% in 2023, increasing to 10.9% in 2035. This is far from the 30% target of EV sales in 2035 set by the government in its roadmap. The percentage of EVs in the total number of vehicles is only 1.7% of the almost 307,000 vehicles predicted in 2035. In truth, EV adoption is a slow process, mostly relying on the initially slow increase in EV adoptions by innovators to cause a ripple effect on EV adoptions by imitators. It is evident from the results that interventions are needed to speed up EV adoption in the country.

4.3. Predictions of EV Growth with Different Policies

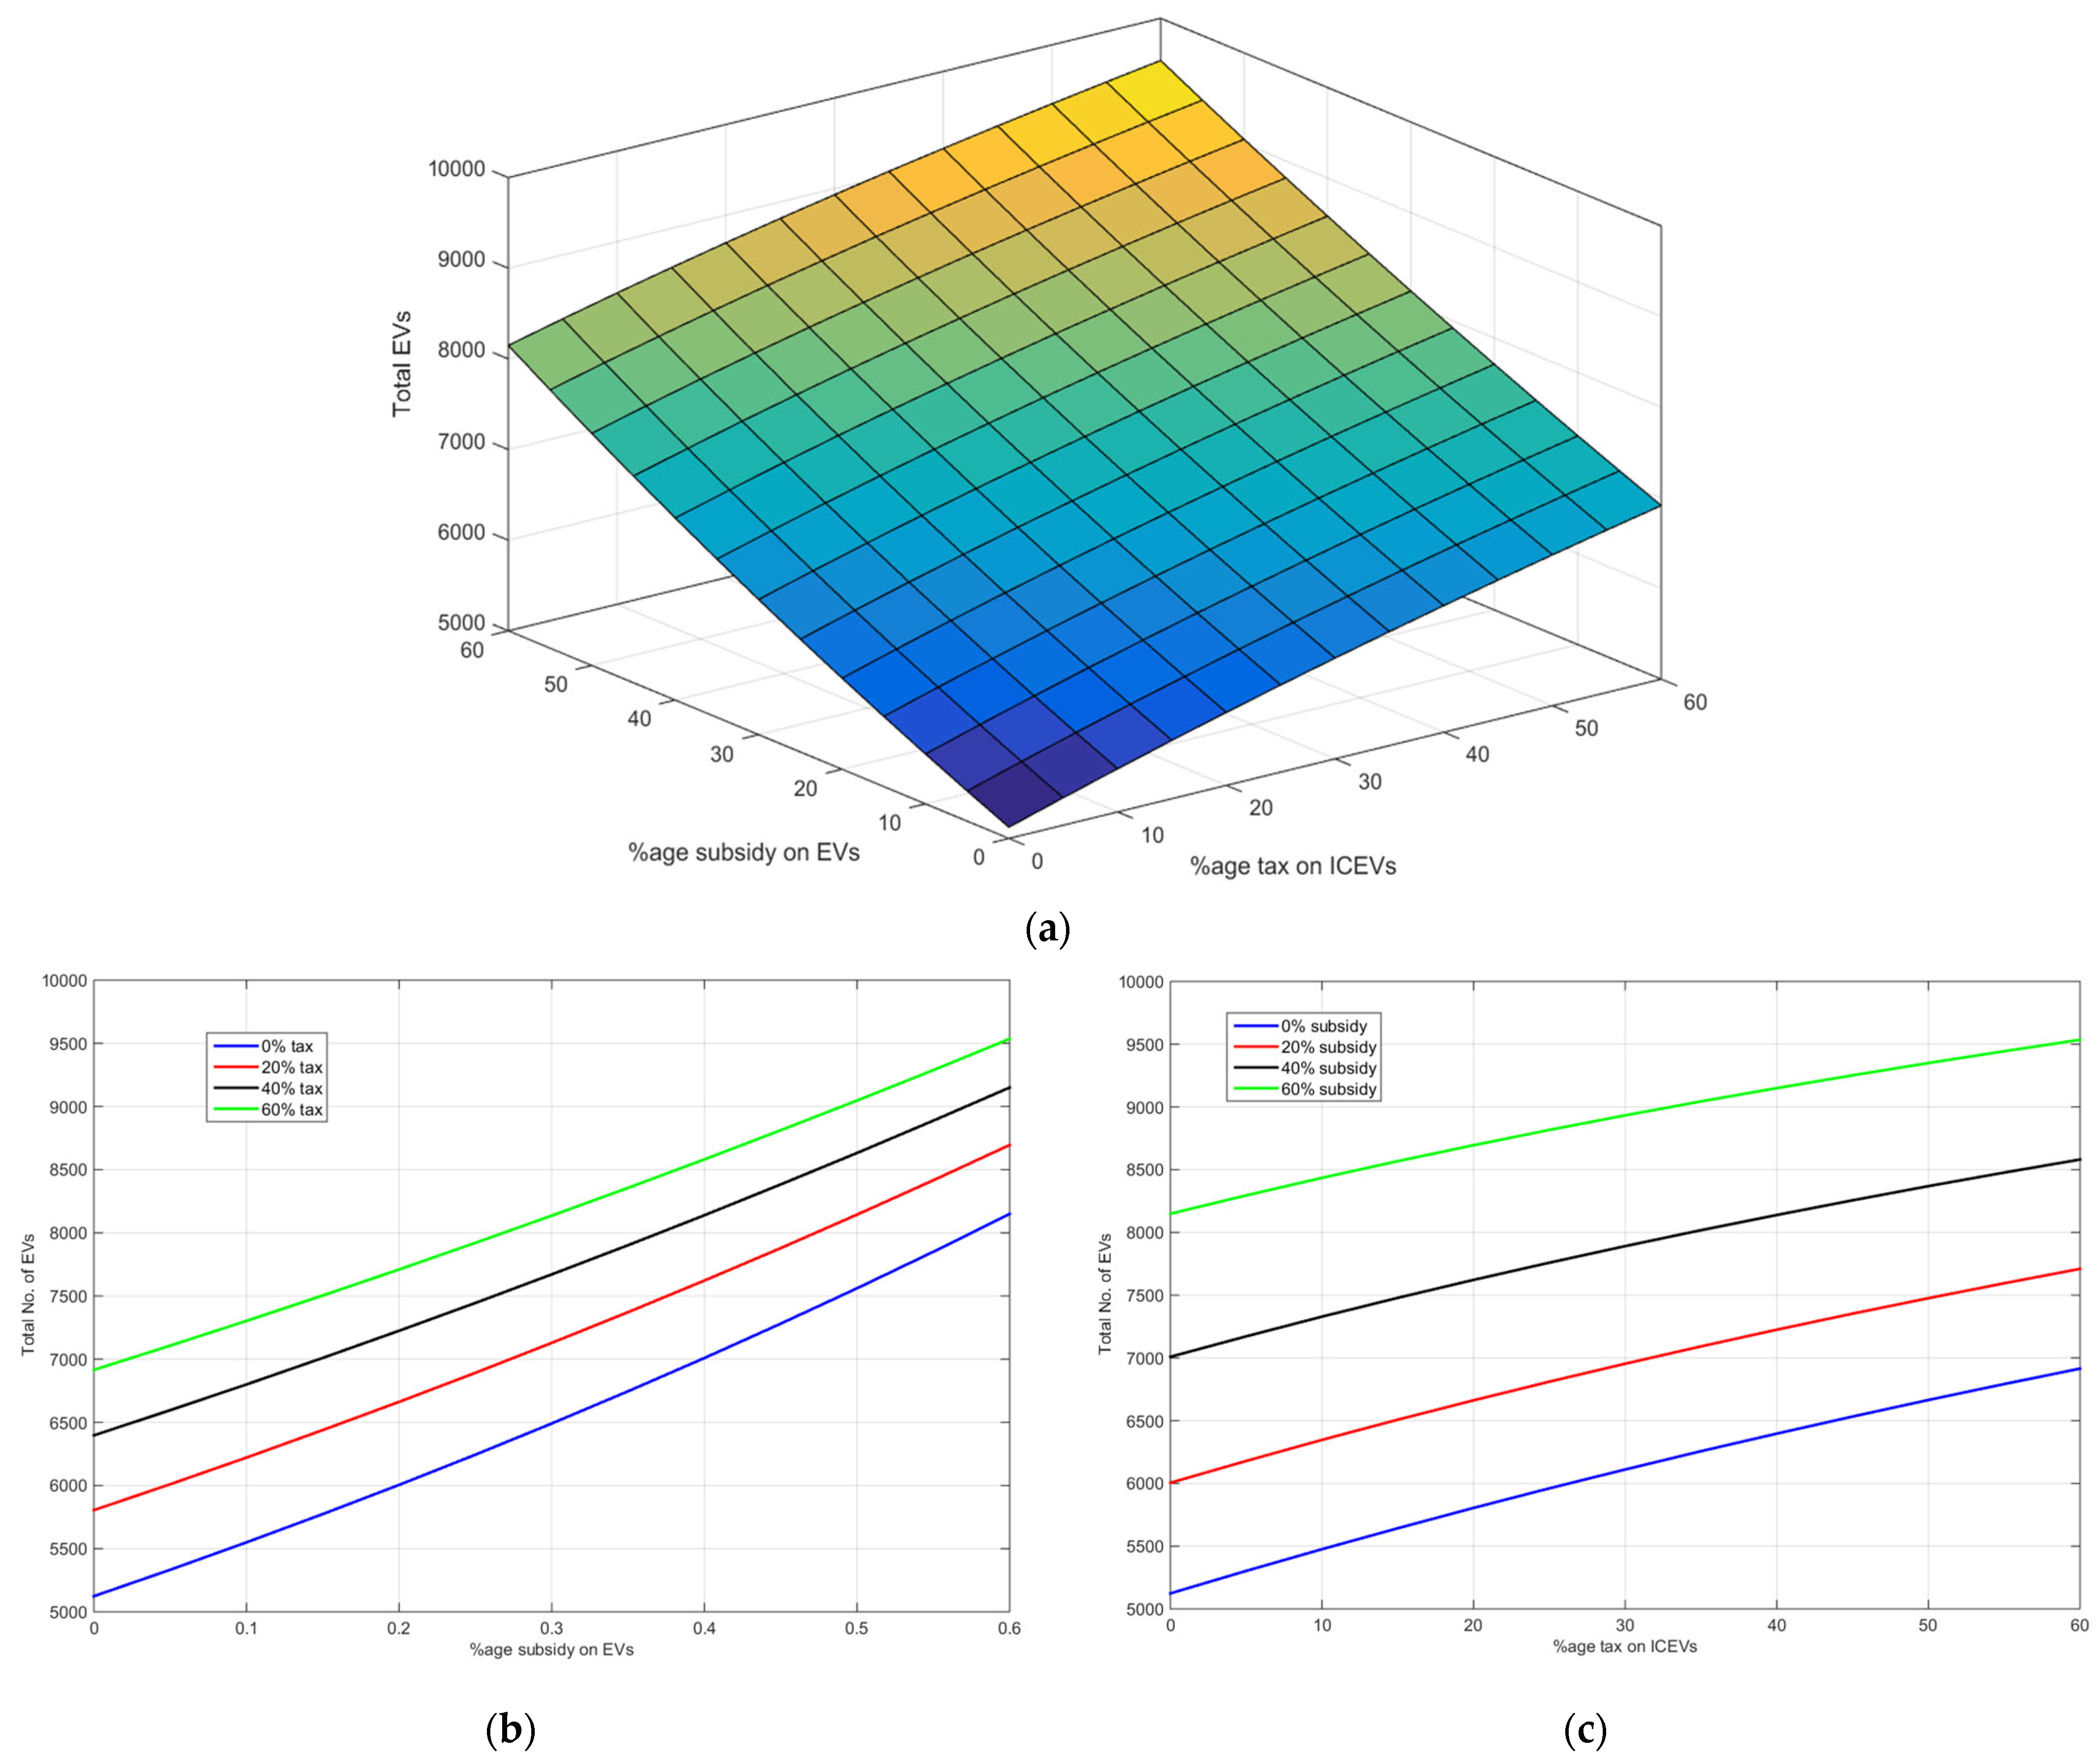
The effects of different policies on EV adoptions are studied in this paper. Analysis of the components of LCCs has shown that acquisition costs constitute the bulk of LCCs. Subsidy on EVs and purchase tax on ICEVs are tools that can be used by policymakers to promote EV adoption. The relationship between the cumulative number of EVs at the end of 2035 and varying rates of subsidy towards the purchase of EVs and tax on the purchase of ICEVs is shown in Figure 4a. It can be clearly seen that introducing purchase subsidies on EVs and purchase taxes on ICEVs has the effect of increasing EV adoptions. Subsidy on EVs reduces its acquisition cost and, subsequently, its LCC. For a given purchase tax rate on ICEVs, subsidies on EVs improve the relative attractiveness of EVs in terms of LCC F L C C ( t ) , overall EV attractiveness, A ( t ) and subsequently, increases EV adoption. On the other hand, the purchase tax on ICEVs (EV substitutes) increases the acquisition cost of ICEVs and, subsequently, increases their LCC. This also improves the relative attractiveness of EVs in terms of LCC F L C C ( t ) , overall EV attractiveness A ( t ) and, as a result, increases EV adoptions. Comparatively, introducing a subsidy on EVs has more effect on increasing EV adoption than a similar tax on ICEVs; introducing a 60% subsidy on the purchase of new EVs alone increases the total EV number in 2035 to 8149 EVs, or 2.66% of total vehicles, while introducing a 60% purchase tax on ICEVs alone increases the total EV number to 6915 EVs, or 2.26% of total vehicles.
The effect of subsidy on EVs for certain purchase tax rates on ICEVs and the effect of purchase tax on ICEVs for certain subsidy rates on EVs may be analyzed further by dissecting the 3D plot in Figure 4a to give Figure 4b and Figure 4c, respectively. Generally, increasing subsidies for EVs and increasing taxes on ICEVs increase EV adoption. For a 0% purchase tax rate on ICEVs, introducing a 60% subsidy on EVs increases the total number of EVs in 2035 by almost 60%, i.e., from 5124 EVs to 8149 EVs; however, a similar introduction of a 60% subsidy on EVs with a 60% purchase tax rate on ICEVs increases the total number of EVs by only 38%, i.e., from 6915 EVs to 9535 EVs. It seems that introducing subsidies for EVs when there is no purchase tax on ICEVs in place does more to improve EV adoption. Another observation that can be made from Figure 4c is that the introduction of a purchase tax on ICEVs generally improves EV adoptions, but the improvement in EV adoptions is more impactful when there is no existing subsidy on EVs in place.
Figure 5a shows the relationship between the cumulative number of EVs at the end of 2035 and the different prices of electricity and gasoline. Both electricity and gasoline are heavily subsidized in Brunei and are set at BND$0.10/kWh and BND$0.53/L, respectively. Similar to subsidies on the acquisition cost of EVs and purchase taxes on the acquisition cost of ICEVs, varying electricity and gasoline prices influence EV attractiveness A ( t ) . BND$0.53/L However, since operating costs constitute a smaller portion of the LCCs of both EVs and ICEVs, the effect of varying them is more limited than varying acquisition costs through purchase subsidies or taxes, as reflected in the limited increase in the number of total EVs to 5983 EVs by reducing the electricity price to BND$0.10/kWh and increasing the gasoline price to BND$1.10/L.
Figure 5b,c show total No. of EVs against electricity and gasoline prices, respectively, for different gasoline and electricity prices. Reducing the electricity price and increasing the gasoline price have the effect of increasing the adoption of EVs, and vice versa. Reducing the electricity price from its current price to BND$0.05/kWh and BND$0.01/kWh, i.e., 50% and 90% reduction, increases total EVs in 2035 from 5124 EVs to 5276 EVs and 5401 EVs, respectively, i.e., 3.0% and 5.4% increase in EVs. On the other hand, increasing the gasoline price from its current price to BND$0.80/L and BND$1.00/L (approximately a 50% and 90% increase from its current price) increases total EVs from 5124 EVs to 5410 EVs and 5613 EVs, respectively, or 5.6% and 9.5%, respectively. It is interesting to note that setting the electricity and gasoline prices similar to those in the USA at USD$0.23/kWh and USD$3.117/L (BND$0.174/kWh and BND$2.361/L) increases the total number of EVs in 2035 to 6582. This represents 2.15% of total vehicles in 2035.

4.4. Predictions of EV Growth with Combined Policies

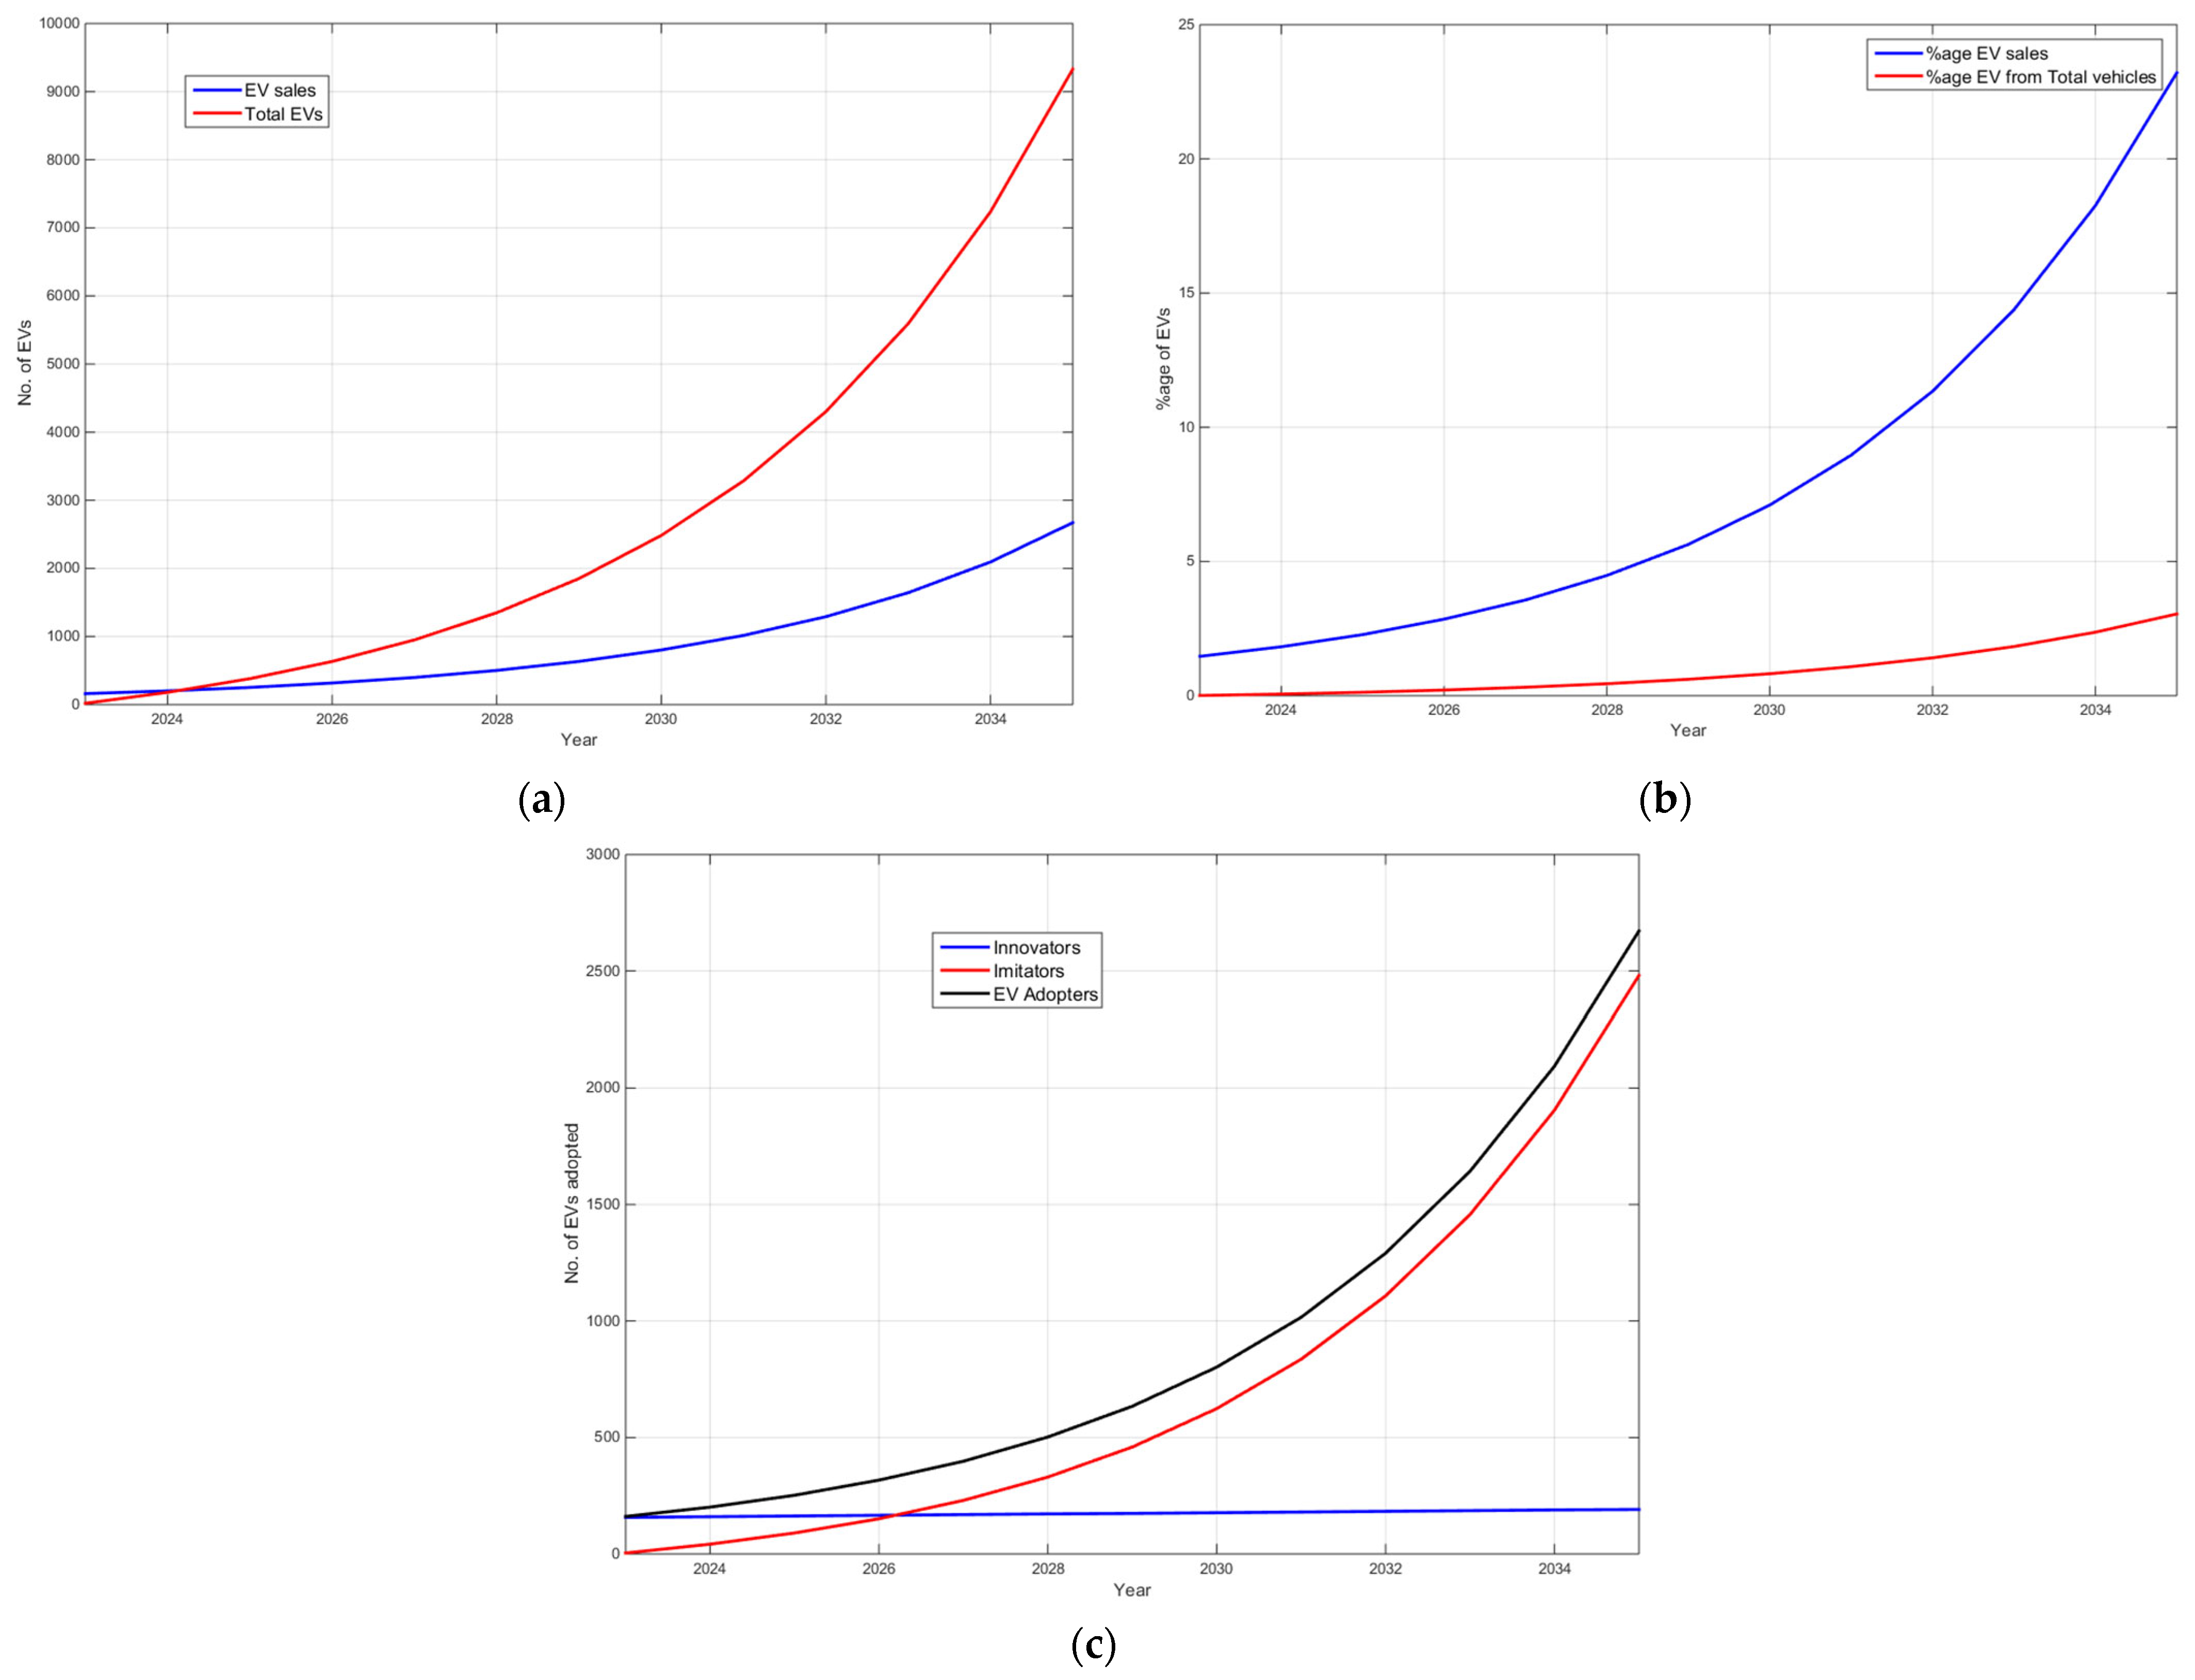
It is evident from the above results that the government’s target of EVs constituting 30% of total sales of vehicles by 2035 is not achievable by implementing the different policies in isolation. Combining different policies may be able to improve EV adoption in Brunei, which is closer to the target. Figure 6a,b show the number of EVs adopted and the accumulated number of EVs at different years, as well as their percentages, by implementing a 50% subsidy on the new purchase of EVs, a 50% tax on the new purchase of ICEVs, a 50% reduction in the electricity price to BND$0.05/kWh, and a 50% increase in the price to BND$1.06/L. It can be seen that the EV adoption rate increases with a combination of policies. From the initial number of 19 EVs in 2023, there will be a total of 9330 EVs in 2035, representing 3.04% of the total vehicles. In terms of percentage of sales, 2672 EVs will be sold in 2035, compared to only 161 EVs in 2023. Sales of 2672 EVs represent 23.21% of the total vehicle sales in 2035, still 6.79%, or 782 EVs, short of the EV target sales of 30% set by the government. Thus, it is evident that common policies of taxes/subsidies on acquisition and operating costs are not going to be sufficient for the government to reach its ambitious target. This is despite considering high subsidy/tax rates; it is suicidal for policymakers to even propose.
Looking into the problem, the issue lies in the slow uptake by imitators, who rely on word-of-mouth effects from early adopters of the technology. From Equation (5), it is evident that the determining factor is that the total number of EVs is too low at the early stage of technology adoption for the imitators to start buying EVs. From Figure 6c, it is clear that despite the improvement in EV adoption, most of the EV adopters at the early stage are composed of innovators. Only in 2026 will EV adopters be composed of an almost equal number of innovators and imitators, an improvement over the scenario without policy intervention in Figure 3, but still a slow level of adoption from the imitators. Approximately 92.9% of the EV adopters in 2035 (191 innovators and 2481 imitators) are composed of imitators.
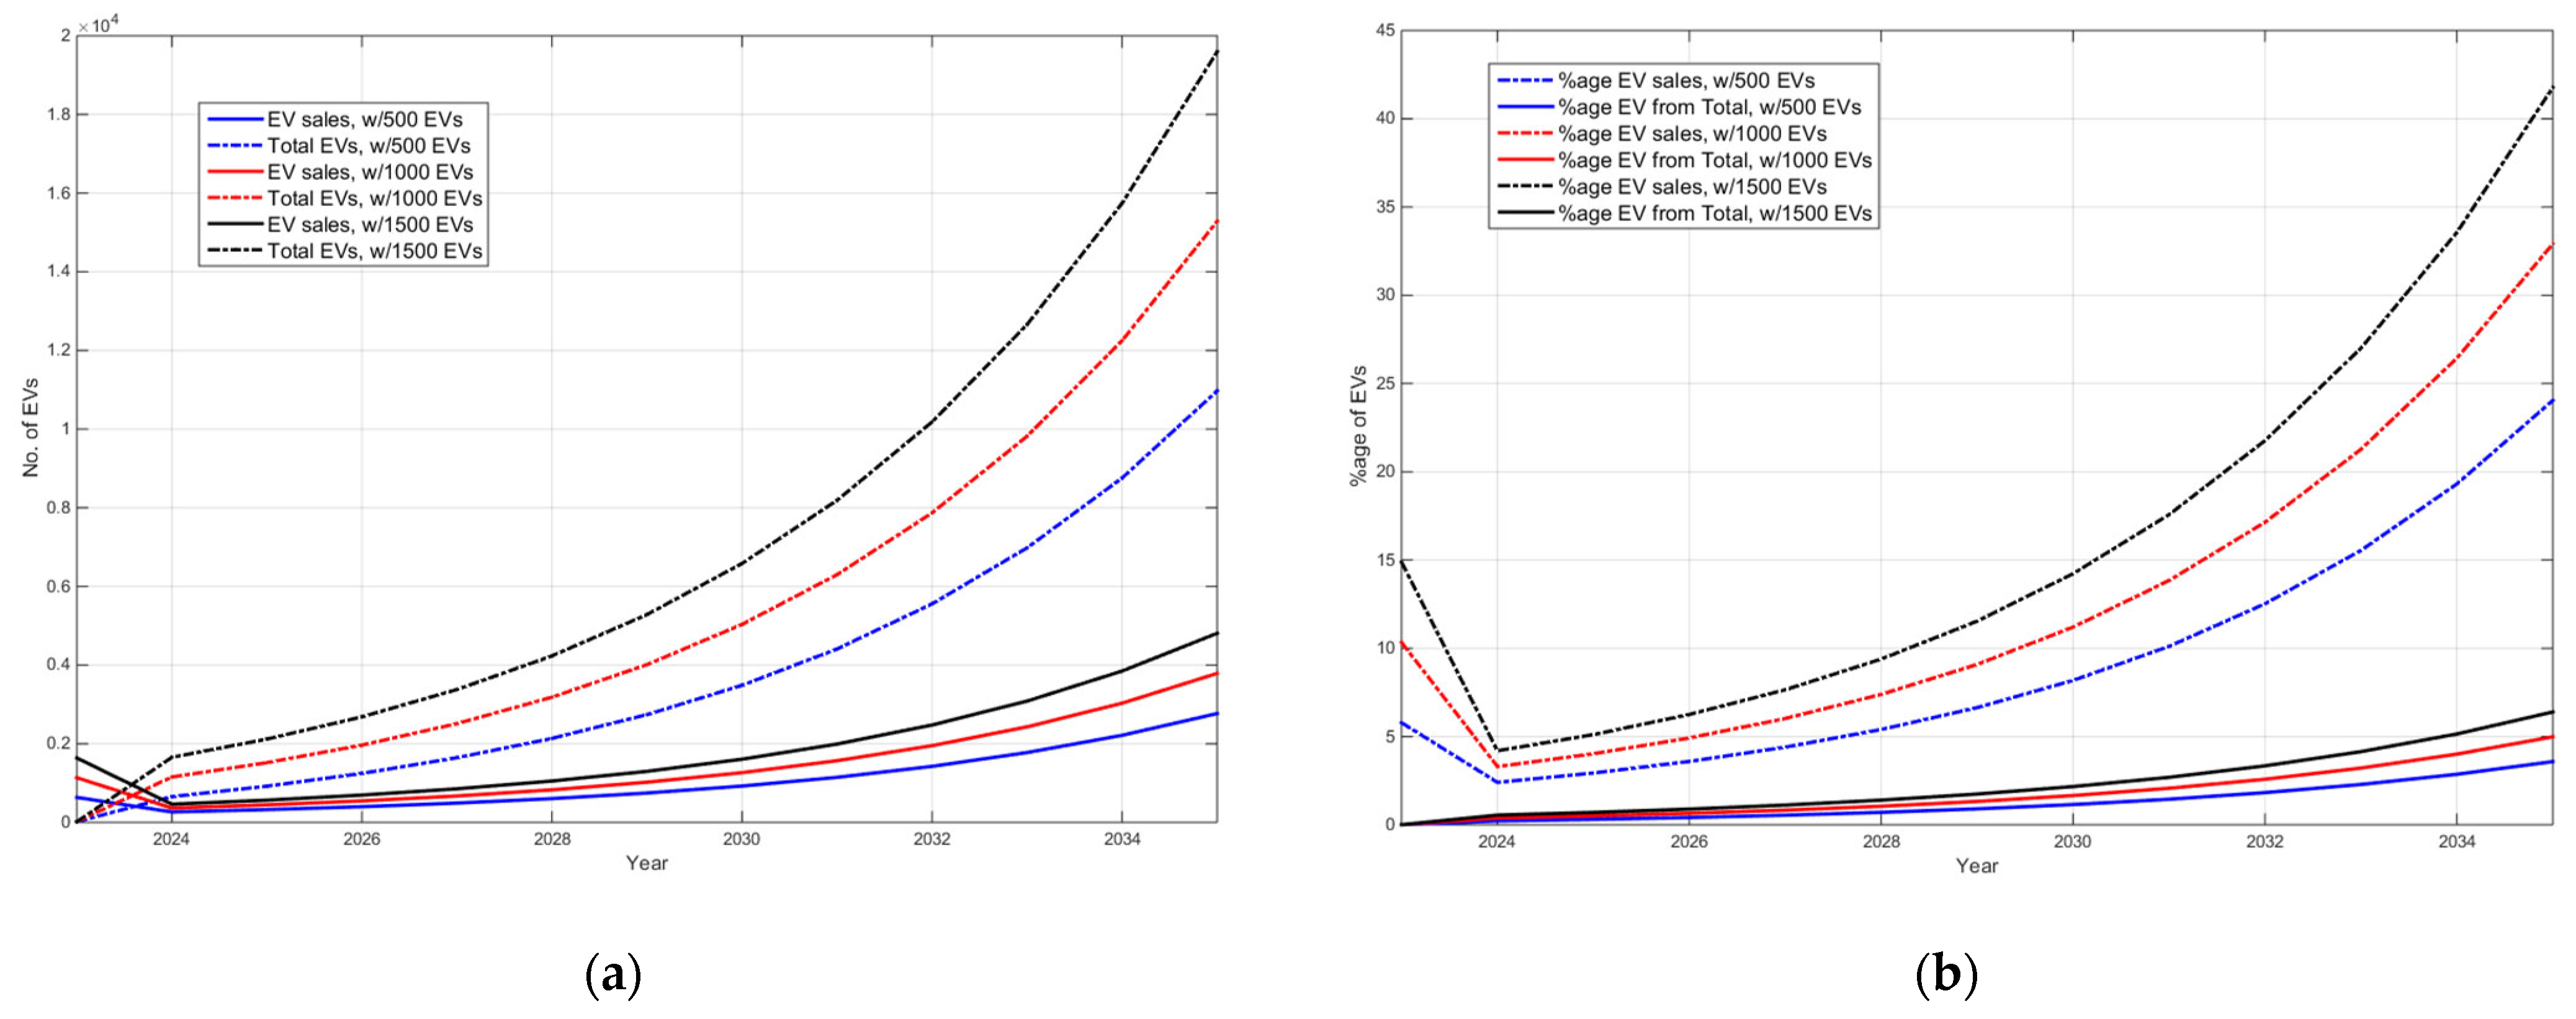
A possible solution to this problem is for the government to artificially inject EVs into the ecosystem, thereby increasing the number of EVs at the early stage of adoption and, hence, encouraging the imitators to start buying EVs instead of just relying on the innovators. This can come about by the government taking the initiative to replace its abundant fleet of government vehicles with EVs. Figure 7a,b show the number of EVs adopted and the accumulated number of EVs at different years, as well as their percentages, with the government initiating the purchase of 500, 1000, and 1500 EVs in 2023 while implementing a more realistic 20% subsidy and 20% tax on new purchases of EVs and ICEVs, respectively. It can be seen that with the government injecting only 500, 1000, and 1500 EVs in 2023, EV sales in 2035 will be 2768 EVs, 3789 EVs, and 4809 EVs, respectively. These represent 24.05%, 32.91%, and 41.78% of total vehicle sales, respectively. The accumulated numbers of EVs in 2035 are 10,973 EVs, 15,283 EVs, and 19,594 EVs, with the government injecting only 500, 1000, and 1500 EVs in 2023, respectively. In fact, injecting just 840 EVs in 2023 while implementing a 20% subsidy on the new purchase of EVs and a 20% tax on the new purchase of ICEVs would allow the government to reach its 30% sales target by 2035.

4.5. Discussion

The examination of electric vehicle (EV) adoption in Brunei reveals both promising trends and critical challenges that warrant attention. As highlighted by Ref. [28], which dissected the contributions of the two adopters (imitators and innovators), our analysis underscores a similar noteworthy challenge: the slow uptake of imitators in the early stages of EV technology adoption. In the initial phase, innovators predominantly drive adoption, leading to a gradual increase in imitators over time. Although other researchers [30,31] have not emphasized this aspect, in-depth studies of their work and results support our conclusion that the rise in the number of EV adopters in the early years is too slow, relying too much on innovators, and this poses a significant hurdle to achieving the government’s ambitious target of 30% EV sales by 2035. All of this is despite improvements in EV attractiveness and an almost equal distribution of innovators and imitators by 2027.
Policy interventions play a pivotal role in shaping EV adoption trajectories. This study evaluates the impact of subsidies on EVs and taxes on internal combustion engine vehicles (ICEVs). Results indicate that introducing subsidies for EVs has a more substantial effect on increasing adoption compared to similar taxes on ICEVs. As Brunei does not impose any taxes on the sales of EVs or ICEVs, the favorable effect of introducing subsidies on EVs is similar to the reduction of taxes previously reported [29,30]. However, even with high subsidies and tax rates, the attainment of the 30% EV sales target remains challenging, emphasizing the need for a more comprehensive approach. The examination of EV attractiveness factors reveals a crucial aspect—anticipated improvements in driving range [30] and charging time [34] significantly contribute to the overall appeal of EVs. As illustrated in Figure 3b, EV attractiveness A t increases over time, driven not only by the reduction in Life Cycle Costs (LCC) but also by improvements in driving range [30]. The expected enhancement in driving range contributes to the slow but steady increase in the number of innovators, which is crucial for initiating the ripple effect that influences imitators. Moreover, the reduction in LCC, primarily attributed to advancements in battery technology [12], is a key factor in bolstering EV adoption. As depicted in Figure 3c, the LCC of EVs becomes more economically feasible over time. The decline in both acquisition and maintenance costs reflects the progress in battery technology, fostering a positive environment for potential adopters. This is definitely a positive development for the EV ecosystem, as previous studies [14,15,19] have indicated that EVs are yet unable to compete with ICEVs.
To address the imitator uptake challenge, a novel solution is proposed: the government’s active involvement in injecting EVs into the ecosystem. Simulations indicate that replacing a portion of the government vehicle fleet with EVs, coupled with a realistic subsidy and tax framework, significantly contributes to reaching the 30% EV sales target by 2035. Even a conservative injection of 840 EVs in 2023 demonstrates substantial progress.
In conclusion, the path to achieving robust EV adoption in Brunei necessitates a multifaceted strategy. While policy interventions are crucial, a comprehensive approach that addresses the imitator uptake challenge through government initiatives proves to be a key driver for realizing ambitious EV sales targets. The findings of this study provide valuable insights for policymakers and stakeholders involved in steering Brunei towards a sustainable and electrified transportation future. The anticipated improvements in driving range, charging time, and reduction in LCC further underscore the dynamic nature of EV adoption, urging policymakers to stay attuned to evolving technological landscapes.

5. Conclusions

Electric Vehicles (EVs) have been acclaimed as a highly effective solution for mitigating the environmental impact attributed to the transportation sector. However, numerous studies have pointed out that effective policies are needed to increase the adoption of EVs in the ecosystem. Predicting EV adoption is crucial for policymaking, aiding in resource allocation, scenario planning, and assessing the impact of various factors such as economics, technology, and consumer behavior. This paper introduces a versatile model considering stakeholders and policies, utilizing local data while having wider applicability across markets. It has been observed that Electric Vehicle (EV) adopters tend to fall into two primary groups: innovators and imitators. Our analysis emphasizes that in the initial stages of adopting new technology like EVs, the majority of adopters belong to the innovator category. However, as the EV market expands, the imitator segment grows as well, creating a ripple effect on the overall EV adoption trends.
Various financial policies aimed at boosting Electric Vehicle (EV) adoption were evaluated, encompassing subsidies on EV acquisition costs and electricity expenses, along with taxes on Internal Combustion Engine Vehicles (ICEVs) and fuel. Our analysis revealed that implementing subsidies to offset the high acquisition costs proved most effective in driving EV adoption. However, while these policies contribute to an overall increase in adoption rates, they fall short of the government’s targeted EV sales due to a sluggish uptake by imitators, identified as a primary challenge. To address this issue, it is proposed that injecting EVs into the ecosystem by the government could significantly encourage imitators to adopt EVs, thereby bolstering the EV adoption rate. Introducing 840 EVs into the ecosystem, coupled with a 20% subsidy on new EV purchases and a 20% tax on new ICEV purchases, could enable the achievement of the targeted 30% EV sales by 2035.
While our study offers valuable insights into the factors influencing Electric Vehicle (EV) adoption, it is crucial to acknowledge certain limitations that may impact the generalizability of our findings. One notable limitation pertains to the approximation of imitation and innovator coefficients in our model. The identification and quantification of these coefficients involve inherent complexities, and commonly, these coefficients are derived from past historical data on EV adoptions. As EV is relatively new, local historical data are not available, and hence, our approach relies on assumptions that may introduce variability. Additionally, our study relies on assumptions related to infrastructure readiness, which might not fully encapsulate the dynamic nature of EV infrastructure development. Recognizing these limitations, further research that delves deeper into the nuances of imitation dynamics and infrastructure considerations is proposed to refine predictive models and enhance the robustness of future studies in the field of EV. Our analysis is also constrained by the scope of EV-related policies considered, and the study may not have captured the full spectrum of policy measures influencing EV adoption. Given the evolving nature of policy landscapes and the potential introduction of new measures as the regulatory environment for EVs continues to evolve, the importance of continuous monitoring and analysis to comprehensively understand the impact of diverse policy frameworks on EV adoption cannot be overemphasized.
Future research in this domain could also delve deeper into the behavioral dynamics influencing the transition from imitation to adoption in the context of Electric Vehicle (EV) uptake. Understanding the triggers and barriers that prompt imitators to embrace EV technology on a larger scale remains a pivotal area for exploration. Additionally, a comprehensive analysis of the evolving landscape of EV infrastructure, including advancements in charging networks and battery technology, could offer valuable insights into optimizing adoption strategies. Furthermore, investigating the socio-economic impacts of widespread EV adoption, such as its influence on urban planning, energy grids, and job markets, would provide a holistic perspective on the transformative potential of EV integration. Embracing interdisciplinary approaches that incorporate fields like psychology, economics, and urban studies could enrich our understanding of the multifaceted facets of EV adoption and pave the way for more effective policies and strategies.

Author Contributions

Conceptualization, P.E.A. and B.T.; methodology, P.E.A.; software, P.E.A. and B.T.; validation, P.E.A. and B.T.; formal analysis, P.E.A. and B.T.; investigation, B.T.; resources, P.E.A. and B.T.; data curation, P.E.A. and B.T.; writing—original draft preparation, P.E.A. and B.T.; writing—review and editing, P.E.A.; visualization, P.E.A.; supervision, P.E.A.; project administration, P.E.A.; funding acquisition, P.E.A. All authors have read and agreed to the published version of the manuscript.

Funding

This research was funded by Universiti Brunei Darussalam, Grant number UBD/RSCH/URC/NIG/3.0/2022/002.

Data Availability Statement

The original contributions presented in the study are included in the article, further inquiries can be directed to the corresponding author.

Conflicts of Interest

The authors declare no conflicts of interest. The funders had no role in the design of the study, in the collection, analysis, or interpretation of data, in the writing of the manuscript, or in the decision to publish the results.

References

  1. Wang, J.; Azam, W. Natural resource scarcity, fossil fuel energy consumption, and total greenhouse gas emissions in top emitting countries. Geosci. Front. 2024, 15, 101757. [Google Scholar] [CrossRef]
  2. Mohr, S.; Wang, J.; Ellem, G.; Ward, J.; Giurco, D. Projection of world fossil fuels by country. Fuel 2014, 141, 120–135. [Google Scholar] [CrossRef]
  3. Sun, L.; Zhang, T.; Liu, S.; Wang, K.; Rogers, T.; Yao, L.; Zhao, P. Reducing energy consumption and pollution in the urban transportation sector: A review of policies and regulations in Beijing. J. Clean. Prod. 2021, 285, 125339. [Google Scholar] [CrossRef]
  4. Galarraga, I.; Kallbekken, S.; Silvestri, A. Consumer purchases of energy-efficient cars: How different labelling schemes could affect consumer response to price changes. Energy Policy 2020, 137, 111181. [Google Scholar] [CrossRef]
  5. Abas, A.P.; Mahlia, T. Development of energy labels based on consumer perspective: Room air conditioners as a case study in Brunei Darussalam. Energy Rep. 2018, 4, 671–681. [Google Scholar] [CrossRef]
  6. De Melo, C.A.; Jannuzzi, G.D.M.; Santana, P.H.D.M. Why should Brazil to implement mandatory fuel economy standards for the light vehicle fleet? Renew. Sustain. Energy Rev. 2018, 81, 1166–1174. [Google Scholar] [CrossRef]
  7. Mahlia, T.; Syazmi, Z.; Mofijur, M.; Abas, A.P.; Bilad, M.; Ong, H.C.; Silitonga, A. Patent landscape review on biodiesel production: Technology updates. Renew. Sustain. Energy Rev. 2020, 118, 109526. [Google Scholar] [CrossRef]
  8. Yusof, N.K.; Abas, P.E.; Mahlia, T.M.I.; Hannan, M.A. Techno-Economic Analysis and Environmental Impact of Electric Buses. World Electr. Veh. J. 2021, 12, 31. [Google Scholar] [CrossRef]
  9. Danial, M.; Azis, F.A.; Abas, P.E. Techno-Economic Analysis and Feasibility Studies of Electric Vehicle Charging Station. World Electr. Veh. J. 2021, 12, 264. [Google Scholar] [CrossRef]
  10. Das, H.S.; Rahman, M.M.; Li, S.; Tan, C.W. Electric vehicles standards, charging infrastructure, and impact on grid integration: A technological review. Renew. Sustain. Energy Rev. 2020, 120, 109618. [Google Scholar] [CrossRef]
  11. International Energy Agency. Global EV Outlook 2022; International Energy Agency: Paris, France, 2022. [Google Scholar]
  12. Veza, I.; Asy’Ari, M.Z.; Idris, M.; Epin, V.; Fattah, I.R.; Spraggon, M. Electric vehicle (EV) and driving towards sustainability: Comparison between EV, HEV, PHEV, and ICE vehicles to achieve net zero emissions by 2050 from EV. Alex. Eng. J. 2023, 82, 459–467. [Google Scholar] [CrossRef]
  13. Nykvist, B.; Nilsson, M. Rapidly falling costs of battery packs for electric vehicles. Nat. Clim. Chang. 2015, 5, 329–332. [Google Scholar] [CrossRef]
  14. Loengbudnark, W.; Khalilpour, K.; Bharathy, G.; Taghikhah, F.; Voinov, A. Battery and hydrogen-based electric vehicle adoption: A survey of Australian consumers perspective. Case Stud. Transp. Policy 2022, 10, 2451–2463. [Google Scholar] [CrossRef]
  15. Qiao, Q.; Zhao, F.; Liu, Z.; Hao, H.; He, X.; Przesmitzki, S.V.; Amer, A.A. Life cycle cost and GHG emission benefits of electric vehicles in China. Transp. Res. Part D Transp. Environ. 2020, 86, 102418. [Google Scholar] [CrossRef]
  16. Guo, X.; Sun, Y.; Ren, D. Life cycle carbon emission and cost-effectiveness analysis of electric vehicles in China. Energy Sustain. Dev. 2023, 72, 1–10. [Google Scholar] [CrossRef]
  17. Cimprich, A.; Sadayappan, K.; Young, S.B. Lightweighting electric vehicles: Scoping review of life cycle assessments. J. Clean. Prod. 2023, 433, 139692. [Google Scholar] [CrossRef]
  18. Desreveaux, A.; Hittinger, E.; Bouscayrol, A.; Castex, E.; Sirbu, G.M. Techno-Economic Comparison of Total Cost of Ownership of Electric and Diesel Vehicles. IEEE Access 2020, 8, 195752–195762. [Google Scholar] [CrossRef]
  19. Cheok, Q.; Husaini, N.H.; Nauman, M.M. Economic feasibility of electric vehicles: A case study. Energy Storage 2022, 4, e302. [Google Scholar] [CrossRef]
  20. Abas, A.E.P.; Yong, J.; Mahlia, T.M.I.; Hannan, M.A. Techno-Economic Analysis and Environmental Impact of Electric Vehicle. IEEE Access 2019, 7, 98565–98578. [Google Scholar] [CrossRef]
  21. Mekky, M.F.; Collins, A.R. The Impact of state policies on electric vehicle adoption -A panel data analysis. Renew. Sustain. Energy Rev. 2024, 191, 114014. [Google Scholar] [CrossRef]
  22. Singh, V.; Singh, V.; Vaibhav, S. Analysis of electric vehicle trends, development and policies in India. Case Stud. Transp. Policy 2021, 9, 1180–1197. [Google Scholar] [CrossRef]
  23. Zhang, X.; Liang, Y.; Yu, E.; Rao, R.; Xie, J. Review of electric vehicle policies in China: Content summary and effect analysis. Renew. Sustain. Energy Rev. 2017, 70, 698–714. [Google Scholar] [CrossRef]
  24. Wangsa, I.D.; Vanany, I.; Siswanto, N. The optimal tax incentive and subsidy to promote electric trucks in Indonesia: Insight for government and industry. Case Stud. Transp. Policy 2023, 11, 100966. [Google Scholar] [CrossRef]
  25. Mastoi, M.S.; Zhuang, S.; Munir, H.M.; Haris, M.; Hassan, M.; Usman, M.; Bukhari, S.S.H.; Ro, J.-S. An in-depth analysis of electric vehicle charging station infrastructure, policy implications, and future trends. Energy Rep. 2022, 8, 11504–11529. [Google Scholar] [CrossRef]
  26. Hu, S.; Liu, Z.; Tan, Y.; Cheng, X.; Chen, Z.; Long, Z. The status quo and future trends of new energy vehicle power batteries in China—Analysis from policy perspective. Energy Rep. 2022, 8, 63–80. [Google Scholar] [CrossRef]
  27. Martino, J.P. A comparison of two composite measures of technology. Technol. Forecast. Soc. Chang. 1993, 44, 147–159. [Google Scholar] [CrossRef]
  28. Jochem, P.; Gómez Vilchez, J.J.; Ensslen, A.; Schäuble, J.; Fichtner, W. Methods for forecasting the market penetration of electric drivetrains in the passenger car market. Transp. Rev. 2018, 38, 322–348. [Google Scholar] [CrossRef]
  29. Massiani, J.; Gohs, A. The choice of Bass model coefficients to forecast diffusion for innovative products: An empirical investigation for new automotive technologies. Res. Transp. Econ. 2015, 50, 17–28. [Google Scholar] [CrossRef]
  30. Damayanti, S.; Hidayatno, A.; Setiawan, A.D. User Acceptance of Electric Vehicles in Indonesia: A Conceptual Model. In Proceedings of the 3rd Asia Pacific Conference on Research in Industrial and Systems Engineering (APCORISE’20), Depok, Indonesia, 16–17 June 2020; Association for Computing Machinery: New York, NY, USA, 2020; pp. 110–115. [Google Scholar]
  31. Setiawan, A.D.; Zahari, T.N.; Purba, F.J.; Moeis, A.O.; Hidayatno, A. Investigating policies on increasing the adoption of electric vehicles in Indonesia. J. Clean. Prod. 2022, 380, 135097. [Google Scholar] [CrossRef]
  32. Kumar, R.R.; Guha, P.; Chakraborty, A. Comparative assessment and selection of electric vehicle diffusion models: A global outlook. Energy 2022, 238, 121932. [Google Scholar] [CrossRef]
  33. Zhu, Z.; Du, H. Forecasting the Number of Electric Vehicles: A Case of Beijing. IOP Conf. Ser. Earth Environ. Sci. 2018, 170, 042037. [Google Scholar] [CrossRef]
  34. Zeng, M.; Zhan, X.; Xue, S.; Ma, M.; Li, Y. Inventory Forecast of Electric Vehicles in China during the Twelfth Five-Year Plan Period Using Bass Model Optimized by Particle Swarm Optimization. J. Appl. Sci. 2013, 13, 4887–4891. [Google Scholar] [CrossRef]
  35. Santa-Eulalia, L.A.; Neumann, D.; Klasen, J. A simulation-based innovation forecasting approach combining the bass diffusion model, the discrete choice model and system dynamics—An application in the German market for electric cars. In Proceedings of the Third International Conference on Advances in System Simulation, Barcelona, Spain, 23–28 October 2011. [Google Scholar]
  36. Jenn, A.; Tal, G.; Fulton, L. A multi-model approach to generating international electric vehicle future adoption scenarios. In Proceedings of the EVS30: 30th International Electric Vehicle Symposium & Exhibition, Stuttgart, Germany, 9–11 October 2017. [Google Scholar]
  37. Lee, J.H.; Hardman, S.J.; Tal, G. Who is buying electric vehicles in California? Characterising early adopter heterogeneity and forecasting market diffusion. Energy Res. Soc. Sci. 2019, 55, 218–226. [Google Scholar] [CrossRef]
  38. Walker, W.E. Policy analysis: A systematic approach to supporting policymaking in the public sector. J. Multi-Criteria Decis. Anal. 2000, 9, 11–27. [Google Scholar] [CrossRef]
  39. Bryson, J.M. What to do when Stakeholders matter. Public Manag. Rev. 2004, 6, 21–53. [Google Scholar] [CrossRef]
  40. Hermans, L.M.; Thissen, W.A. Actor analysis methods and their use for public policy analysts. Eur. J. Oper. Res. 2009, 196, 808–818. [Google Scholar] [CrossRef]
  41. Wang, Q.; Hauge, J.B.; Meijer, S. Adopting an Actor Analysis Framework to a Complex Technology Innovation Project: A Case Study of an Electric Road System. Sustainability 2019, 12, 313. [Google Scholar] [CrossRef]
  42. Statista. Vehicle to Population Ratio in Southeast Asia from 2012 to 2021, by Country. Available online: https://www.statista.com/statistics/1358331/asean-vehicle-to-population-ratio-by-country/ (accessed on 1 January 2024).
  43. Kara, S.; Li, W.; Sadjiva, N. Life Cycle Cost Analysis of Electrical Vehicles in Australia. Procedia CIRP 2017, 61, 767–772. [Google Scholar] [CrossRef]
  44. Yu, J.; Yang, P.; Zhang, K.; Wang, F.; Miao, L. Evaluating the Effect of Policies and the Development of Charging Infrastructure on Electric Vehicle Diffusion in China. Sustainability 2018, 10, 3394. [Google Scholar] [CrossRef]
  45. Kapli, F.W.A.; Azis, F.A.; Suhaimi, H.; Shamsuddin, N.; Abas, P.E. Feasibility Studies of Rainwater Harvesting System for Ablution Purposes. Water 2023, 15, 1686. [Google Scholar] [CrossRef]
  46. Becker, T.A.; Sidhu, I.; Tenderich, B. Electric Vehicles in the United States A New Model with Forecasts to 2030; Center for Entrepreneurship & Technology: Berkeley, CA, USA, 2009. [Google Scholar]
  47. Apostolaki-Iosifidou, E.; Codani, P.; Kempton, W. Measurement of power loss during electric vehicle charging and discharging. Energy 2017, 127, 730–742. [Google Scholar] [CrossRef]
  48. Stone, M. Will Charging Electric Cars Ever Be as Fast as Pumping Gas? Available online: https://www.nationalgeographic.com/environment/article/will-charging-electric-cars-ever-be-as-fast-as-pumping-gas (accessed on 1 January 2024).
  49. International Energy Agency. Trends and Development in Electric Vehicle Markets—Global EV Outlook; International Energy Agency: Paris, France, 2021. [Google Scholar]
  50. Neta Auto Brunei. Neta V. Available online: https://www.netaautobrunei.com/neta-v.html (accessed on 1 January 2024).
  51. Toyota. Toyota Vios. Available online: https://www.toyota.com.bn/car/vios/ (accessed on 1 January 2024).
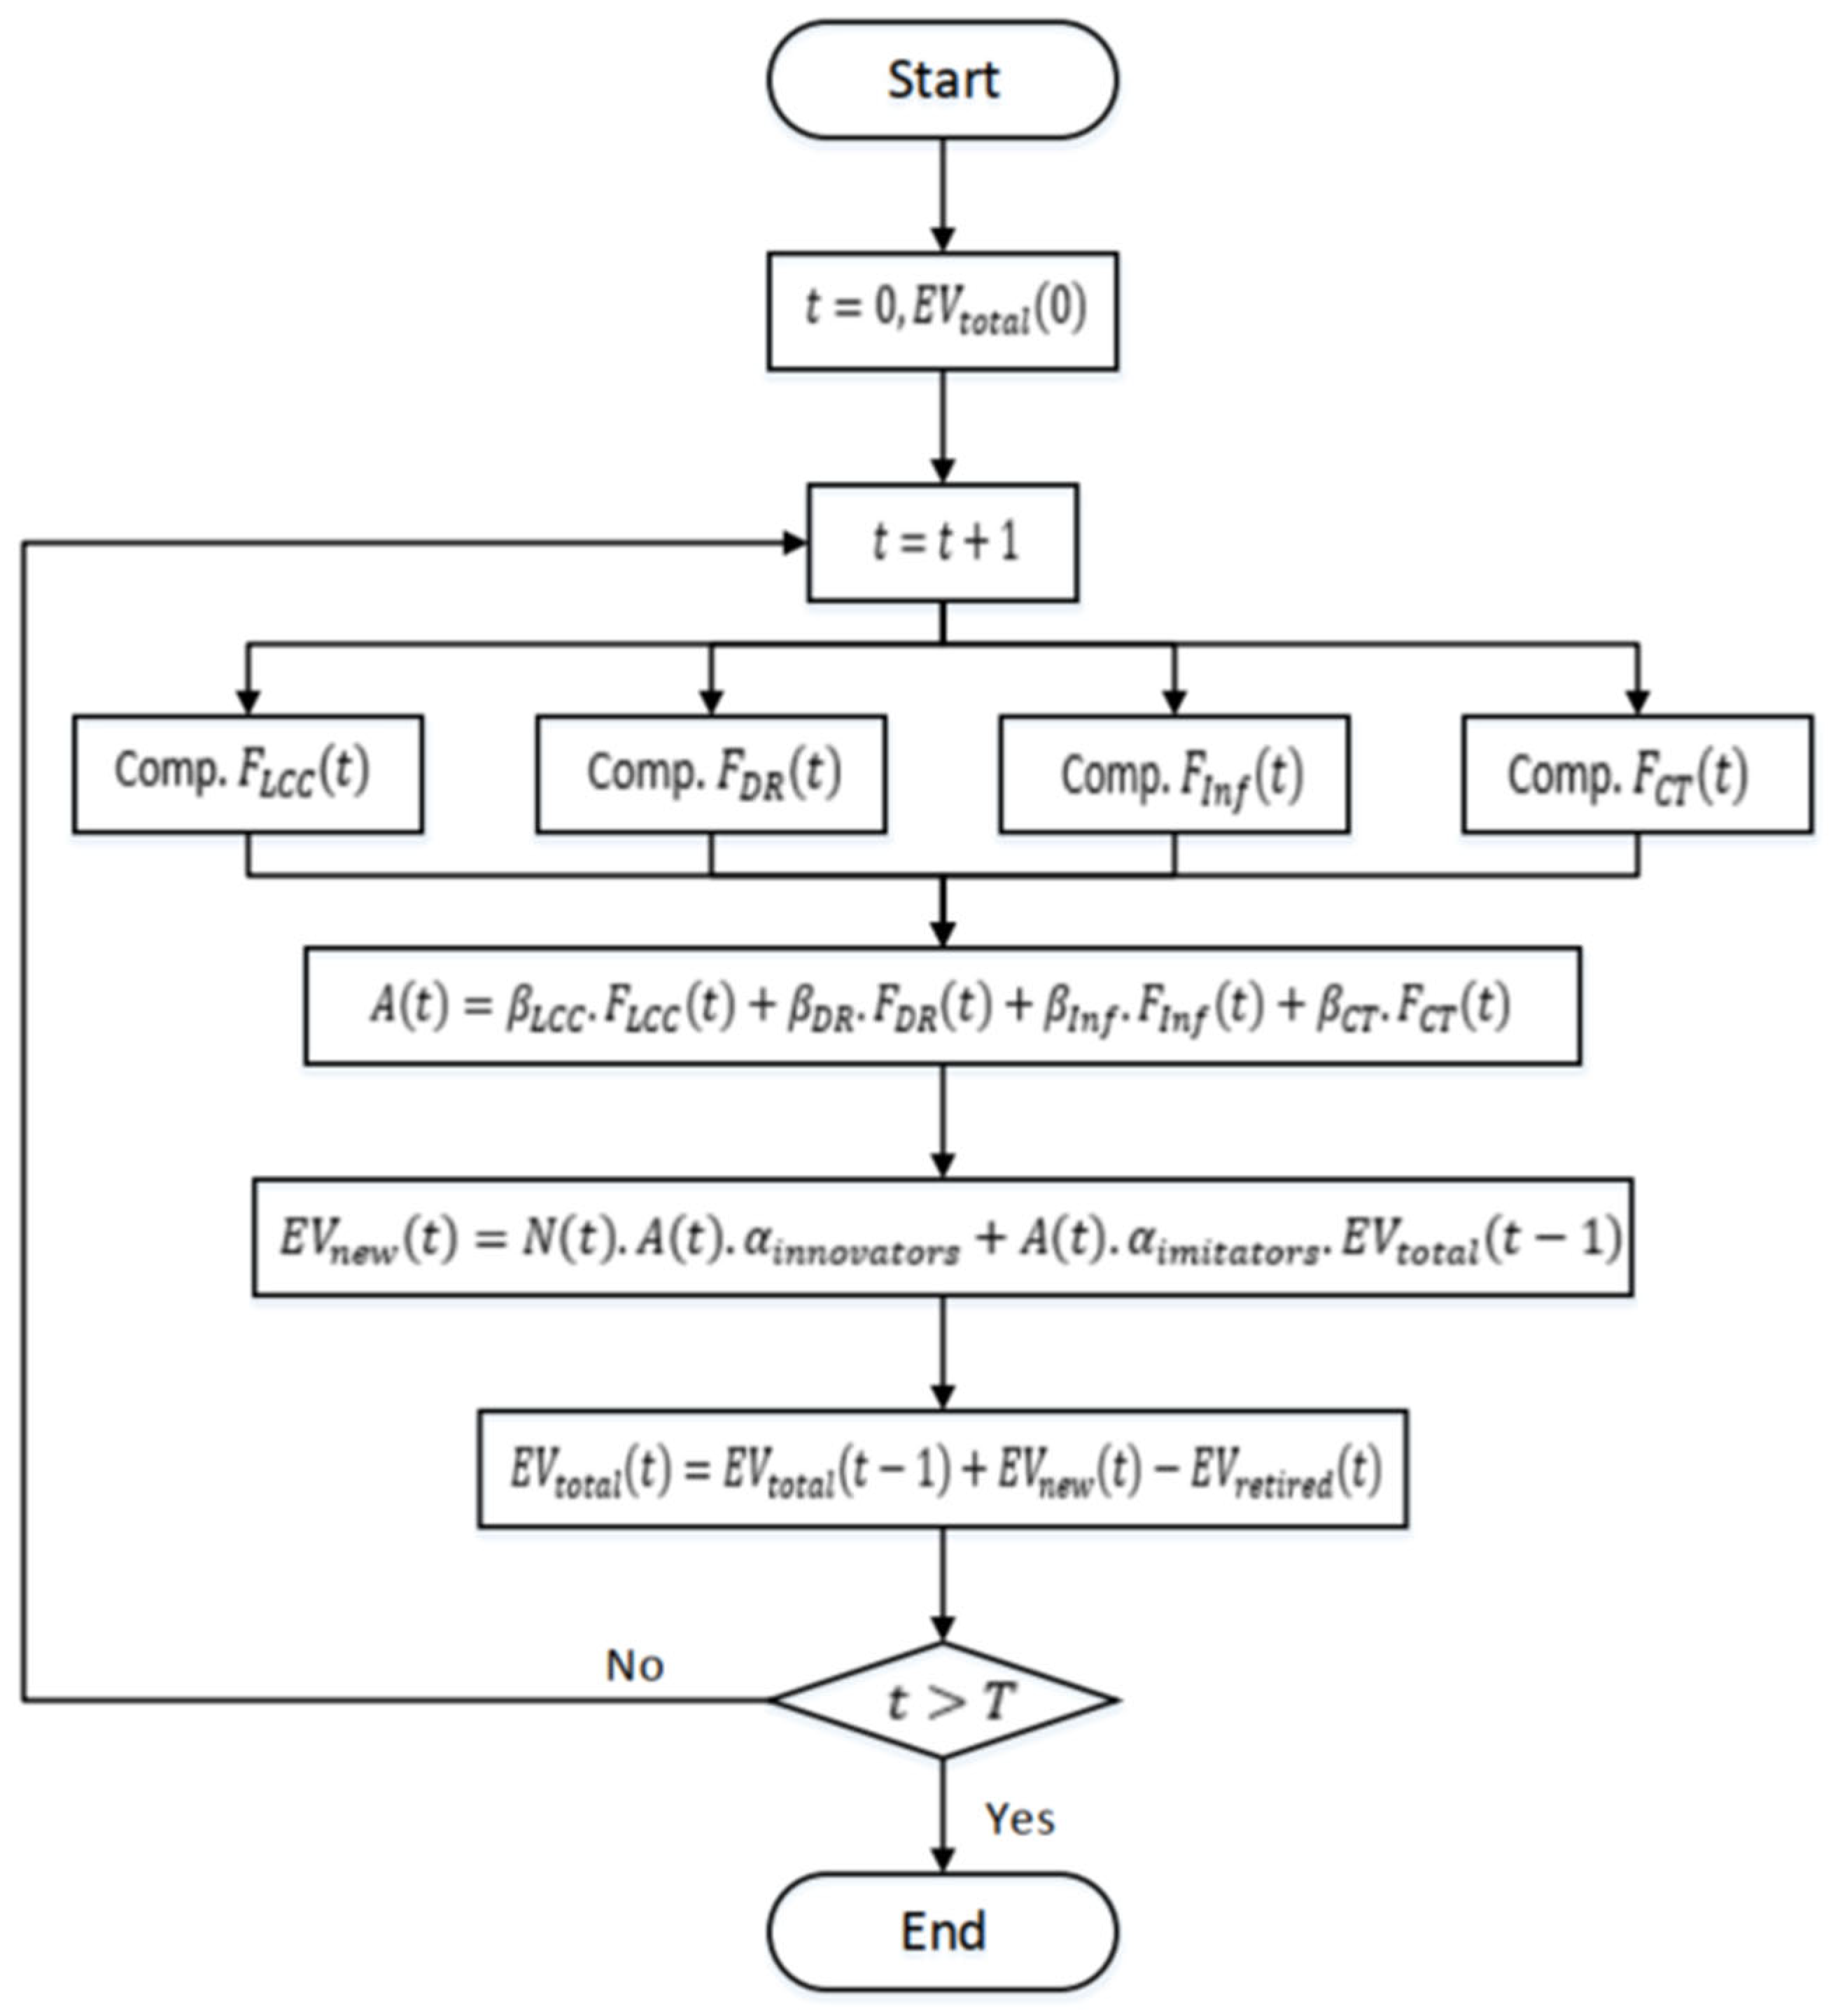
Figure 1. Developed Model used to predict EV Adoptions.
Wevj 15 00052 g001
Figure 2. EV sales and Total EVs, as well as percentage of EV sales and total EVs, in different years.
Wevj 15 00052 g002
Figure 3. (a) Composition of EV Adopters; (b) EV attractiveness at different years; and (c) Comparison of LCCs of EVs and ICEVs in 2023 and 2035.
Wevj 15 00052 g003aWevj 15 00052 g003b
Figure 4. (a) Relationship between total No. of EVs and subsidy on EVs/tax on ICEVs; (b) Total No. of EVs against subsidy rate on EVs for different tax rates; and (c) Total No. of EVs against tax rate on ICEVs for different subsidy rates.
Wevj 15 00052 g004
Figure 5. (a) Relationship between total No. of EVs and electricity/gasoline prices; (b) Total No. of EVs against electricity price for different gasoline prices; and (c) Total No. of EVs against gasoline price for different electricity prices.
Wevj 15 00052 g005
Figure 6. (a) The number of EVs adopted and the accumulated number of EVs at different years of EV sales and Total EVs; (b) the percentage of EV sales and total EVs at different years; and (c) Composition of EV Adopters by implementing 50% subsidy on new purchase of EVs, 50% tax on new purchase of ICEVs, 50% reduction in electricity price to BND$0.05/kWh, and 50% increase in the price to BND$1.06/L.
Wevj 15 00052 g006
Figure 7. (a) The number of EVs adopted and the accumulated number of EVs at different years; and (b) the percentage of EV sales and total EVs at different years; with the government injecting 500 EVs, 1000 EVs, and 1500 EVs in 2023 in conjunction with 20% subsidy on EVs and 20% tax on ICEVs.
Wevj 15 00052 g007
Table 1. Stakeholder Analysis of the Electric Vehicles (EVs) Eco-System [29,30,39,40].
ActorPerceptionValuesResources
InterestObjective
GovernmentTransportation plays a major role in the economy, despite being a significant contributor to CO2 emissions. Currently, ICEV is perceived to be more attractive to EVs.Increase the adoption of EVs and thereby reduce CO2 emissions.To increase the proportion of EVs with respect to the total number of vehicles.Implement effective policies to increase EV adoption.
ICEV UsersThe perception is that EVs are more expensive than ICEVs, with limited driving range. This is exacerbated by the limited number of charging stations.Affordable and reliable, with a reasonable driving range.To own an affordable and reliable EV with respect to ICEVs.The flexibility of choosing between ICEVs and EVs.
Automotive IndustriesLimited demand for EVs is due to various factors, most importantly, their cost.Profitable income from EV sales.To provide a selection of EVs to meet demand.Manufacture or provision of affordable and energy-efficient EVs.
Charging Station ProvidersWith the limited number of EVs, investment in building a charging station may be unjustified.Asset Utilisation.To ensure a high utilization rate of the charging stations with a reasonable rate of return.The flexibility of investing in EV charging stations.
WorkshopsWith the limited number of EVs and the unavailability of expertise, investment in an EV workshop may be unjustified.Service Utilisation.To provide servicing and maintenance for EVs with a reasonable rate of return.The flexibility of investing in an EV workshop.
Electrical CompaniesThe adoption of EVs may cause uncertainty in electric demand.Provision of reliable electricity for customers, including EV users.To provide reliable and sufficient electrical supply to customers.Change the energy mix to reduce CO2 emissions and to provide clean and reliable electric supplies.
Table 2. Important Parameters for the EV Adoption Model.
ParametersValue
Coefficient of innovation0.025
Coefficient of imitation0.42
Relative importance of LCC, β L C C 53.6%
Relative importance of driving range, β D R 12.5%
Relative importance of infrastructure readiness, β I n f 25%
Relative importance of charging time, β C T 8.9%
Disclaimer/Publisher’s Note: The statements, opinions and data contained in all publications are solely those of the individual author(s) and contributor(s) and not of MDPI and/or the editor(s). MDPI and/or the editor(s) disclaim responsibility for any injury to people or property resulting from any ideas, methods, instructions or products referred to in the content.