


Abstract
The emergence of Autonomous Vehicles (AVs) marks a significant advancement in the automotive industry, transitioning from driver-assistance technologies to fully autonomous systems. This change is particularly impactful in the Gulf Cooperation Council (GCC) region, which is a significant automotive market and technological hub. However, the adoption of AVs in the GCC faces unique challenges due to the influence of cultural norms and geographical characteristics. Our research utilizes a customized framework of the Unified Theory of Acceptance and Use of Technology (UTAUT), which is adapted to include cultural and geographical factors. This approach fills a gap in the existing literature by identifying and analyzing the key factors affecting the adoption of AVs in the GCC. Our findings indicate a difference in the receptiveness towards AVs among different demographics. Younger participants displayed a more favorable attitude towards AVs compared to older individuals. Additionally, gender and educational attainment play significant roles in the acceptance of AVs. Specifically, our results suggest that there are variations in acceptance rates among genders and individuals with varying levels of education. The United Arab Emirates (UAE) has a relatively high acceptance rate of AVs due to its advanced infrastructure and openness to technological innovations. Our study identifies facilitating conditions and performance expectancy as crucial determinants of intention to use AVs in the GCC. It emphasizes the importance of infrastructure readiness and the perceived advantages of AVs in promoting their adoption.
1. Introduction
The transition of AVs from assistive technologies to fully self-navigating systems represents a significant advancement in modern transportation. These sophisticated systems employ sensors, cameras, and state-of-the-art artificial intelligence (AI) algorithms to enhance driving decisions, propelling us toward the next level of autonomy. Developments in computer vision, LiDAR technology, and AI have accelerated the growth of AVs, improving their ability to sense and comprehend their surroundings [1]. Table 1 outlines the List of Abbreviations, which provides a reference for specialized terms used throughout this document.
Table 1.
List of Abbreviations.
Expected benefits include significantly reducing global emissions through decreased vehicle usage, improved traffic flow, and enhanced environmental sustainability. AVs also have the potential to reduce traffic congestion, decrease accidents caused by human error, and improve transportation efficiency. Reliable AVs are anticipated to efficiently provide essential transportation and logistics services, improving mobility for individuals with physical limitations [2]. Furthermore, autonomous buses, taxis, and shared mobility services are expected to challenge traditional car ownership models, enhancing public transportation and increasing mobility [3].
In the GCC region, the adoption of novel technologies like AVs is influenced by specific economic policies and consumer preferences. Although there is a preference for large, fuel-consuming vehicles due to low gasoline prices, implementing AVs in this area requires a thorough analysis of technological acceptance models. The UTAUT model provides a comprehensive framework for analyzing AV adoption in the GCC’s unique sociocultural environment. This model incorporates performance expectancy, social influence, and facilitating conditions, which are crucial given the region’s cultural and geographical context [4].
This study employs the UTAUT model to address the GCC region’s unique requirements, reconciling discrepancies with prior research. While the AV sector has experienced significant growth globally, more studies are needed, especially regarding the feasibility of deploying AVs in the GCC. This modified version of the UTAUT model assesses GCC adoption, perception, and prospects for AVs, enhancing the basic constructs with factors that account for the region’s unique social, cultural, and geographical intricacies. Our autonomous vehicle model is built to function under Level 3: Conditional Driving Automation. The vehicle can handle all driving functions under specific conditions without human intervention. However, human oversight is still essential and required if the system encounters scenarios it cannot resolve autonomously [5].
The study identifies unique factors influencing AV adoption in the GCC, distinguishing it from global trends. It investigates sociocultural attitudes towards AV technology specific to the region and assesses infrastructure and policy readiness for AVs in the GCC. The study highlights the need for customized approaches to foster AV adoption in regions with distinct characteristics like the GCC. The following are the main contributions of the proposed research.
- Identified unique factors influencing AV adoption in the GCC, distinguishing it from global trends.
- Investigated socio-cultural attitudes towards AV technology specific to the GCC region.
- A comprehensive assessment of infrastructure and policy readiness for AVs in the GCC was conducted.
- Highlighted the need for customized approaches to foster AV adoption in regions with distinct characteristics like the GCC.
The current research paper is methodically organized into several different parts. It begins with a literature review that establishes the context and background for the present study. The subsequent section, methodology, expands on the research strategy and methodology. The data collection results are analyzed and presented in the Data Analysis section, then explained in the Results section. The paper concludes with a brief overview of the study’s key findings and their corresponding implications.
2. Related Work
The rise of AVs represents a significant and groundbreaking shift in transportation technology. Researchers worldwide are actively investigating various aspects of AV adoption, but there is still a need for more focused research tailored explicitly to the GCC context. This section presents crucial research that lays the groundwork for understanding global AV acceptance, technological feasibility, public opinion, and the socio-economic factors that influence these aspects. Many studies have examined AVs’ public perception, acceptance, and technological feasibility. Diverse studies, each with its methodology and area of concentration, have made valuable contributions to advancing knowledge regarding the factors that drive AV adoption. However, cultural and regional differences affecting technology acceptability are generally overlooked. Integrating AI and machine learning into autonomous vehicles represents a paradigm shift in transportation technology, significantly enhancing operational capabilities. Machine learning, in particular, has emerged as a cornerstone technology, reshaping urban landscapes by improving traffic management, fuel efficiency, and vehicle accessibility. As discussed by Mishra [6] machine learning applications in autonomous vehicles promise to enhance mobility solutions and pave the way for more sustainable and environmentally friendly transportation systems. Furthermore, deploying AI technologies requires rigorous testing and validation to ensure safety and reliability. Vishnukumar [7] proposes a new methodology using machine learning and deep neural networks for lab and real-world testing and validation of ADAS and autonomous vehicles. Their approach underscores the importance of AI in enhancing the quality and efficiency of tests, ensuring that autonomous vehicles operate flawlessly in diverse and dynamic environments. This methodology is particularly relevant to the GCC, where the integration of autonomous vehicles must contend with unique regional challenges, such as sandstorms and extreme heat, which require specialized testing protocols.
Building upon this, research by Yuqi Yuqi [8] employs anthropomorphism and the unified UTAUT to examine how system attributes, including perceived anthropomorphism, intelligence, and UTAUT attributes, affect consumer acceptability. This study found that perceived anthropomorphism and intelligence directly affect AV adoption, while performance expectancy, effort expectancy, and facilitating conditions indirectly contribute. This study adds to the psychological drivers of autonomous vehicle adoption by highlighting anthropomorphism perceptions, effectively linking technological feasibility with user psychology.
Further exploring adoption factors, a study conducted by Auditya [9] uses the Technology Acceptance Model and UTAUT conceptual frameworks to explore FAV adoption factors. AV adoption is largely influenced by perceived usefulness and social influence. This study found significant determinants in perceived ease of use, behavioral attitude, hedonic motivation, performance expectancy, and effort expectancy. On the contrary, the impact of the facilitating condition on FAV acceptability is negligible. Another study conducted in South Africa [10] added Trust in Safety and Hedonic Motivation to UTAUT, showing that performance expectancy, effort expectancy, facilitating environments, and social influence all positively affect behavioral intention, with performance expectancy having the most significant effect. Faith in safety involves anxieties versus assurances and faith.
Complementing these insights, Prateek’s [11] research presents a comprehensive review of global trends in AV adoption and the legislative constraints that affect the technology’s integration across areas. It emphasizes understanding technical advances and legal frameworks to enable safe and efficient worldwide AV deployment. Jeremy’s [12] studies show how AVs change urban transport dynamics and economic factors. According to their findings, autonomous vehicles have the potential to drastically modify urban mobility by reducing traffic congestion, increasing transportation accessibility, and influencing the economic landscape of metropolitan areas through modifications to transportation infrastructure and urban design. Studies by Liao and Wang [13] examined consumer attitudes towards AVs in China. Their research highlighted the importance of financial considerations, automotive technology advancements, and privacy concerns as crucial influences on consumer perspectives. The study emphasized the need to understand the specific cultural and regional frameworks of AV adoption, as insights derived from one location may only sometimes apply to another due to differing socio-economic dynamics and cultural norms.
In addition, autonomous mobility services in another study demonstrated their economic feasibility. However, this study also revealed a research gap in user experience and the broader social implications of AV integration, highlighting the need for further exploration [14]. surveyed how autonomous cars change people’s travel habits. Despite providing a thorough insight into consumer issues and preferences, the study was limited to specific geographic locations, highlighting the need for further research. In a unique focus, Bennett, Vijay Gopal, and Kottasz [15] employed regression analysis in a novel way to determine whether or not individuals with mental health disorders would be willing to ride in autonomous cars. Although they made a noteworthy contribution by concentrating on individuals with cognitive disabilities, the study failed to account for comfort level or in-car amenities. Expanding the scope to public transport, Roche-Cerasi [16] used descriptive statistics to measure people’s desire to use public transportation (driverless shuttles) in Norway. The research emphasized the significance of safety and security as critical determinants of adoption; however, it should have incorporated demographic variables, indicating the necessity for a more exhaustive examination of this nature. Ritchie, Watson, and Griffiths [17] explored how AVs should overtake other drivers using one-way ANOVAs. Their study, which included physiological measurements, needed to be improved by its video-based methodology, indicating a gap in real-world testing scenarios. Taking a policy perspective, Anania [18] investigated consumer perception factors affecting the willingness to ride in a driverless vehicle. They emphasized the importance of information delivery, yet the study’s scope was limited to certain aspects, suggesting room for a more holistic approach.
Subsequently, Wang, Tang, and Pan [19] examined the effectiveness of policy incentives on the adoption of electric vehicles in China by employing discrete choice analysis. Their analysis, which focused only on Chinese consumers, showed how important it is to conduct research in various cultural situations by converting preferences into monetary values. Xu, Zhang, Min, and Wang [20] assessed the willingness to travel in automated vehicles using structural equation modeling. Although their model comprehensively predicts user acceptance, its lack of consideration for demographic characteristics or real driving experiences highlights the need for more inclusive research models. Afterward, Kaur and Rampersad [21] found that factors influencing the adoption of AVs were performance expectations, dependability, security, privacy, and trust. The research was confined to a controlled environment, underscoring the need for more varied locations.
Certain studies have attempted to identify AVs’ unique features and obstacles in the GCC. According to Hussain [22]. safety, human error, AV–human vehicle interactions, and performance under different conditions are essential. Although the study highlights the public’s growing trust in AVs’ ability to reduce human error and enhance overall safety, it raises concerns regarding AV interactions with conventional vehicles and security risks. The study is limited to Qatar and may entail cultural biases, but its extensive analysis of public opinion factors makes it valuable. In addition, Al Barghuthi and Said [23] employed descriptive statistics and correlation analysis to assess the acceptance and perception of autonomous UAE cars. The study examines how automobile specs, features, and user goals affect AV adoption along with demographic characteristics. It demonstrates a profound understanding of how individual specs and features impact user approval. Nevertheless, it is essential to acknowledge that the results of this study are limited to a specific geographical area and may not apply to other regions outside of the UAE. Furthermore, the scope of the research is restricted to the features and specifications that were monitored. The research by Aldakkhelallah [24] used logistic regression modeling to investigate the Saudi public’s sentiments toward AVs. This study utilizes logistic regression analysis to examine public perceptions of AVs in Saudi Arabia. The objective is to comprehend the aspects that impact acceptance. The variables encompass gender, age, education, prior knowledge, and stakeholder group. A thorough examination of these variables and their influence on attitudes constitutes one of the strongest points. Nevertheless, the survey’s shortcoming resides in its exclusive emphasis on AVs, disregarding the potential correlation with the acceptability of electric cars.
In Kuwait, studies conducted by Toglaw [25] employ a qualitative methodology. The analysis explores the attractiveness of various levels of AV automation, specifically emphasizing fundamental functionalities like intelligent cruise control and autonomous parking. The study emphasizes the possible prospects for level-3 AVs in advanced electric vehicles and level-4 AVs in controlled industrial zones. The study analyzes opinions regarding AVs in a developing market and explores their numerous values.
Finally, Alsghan [26] conducted an in-depth investigation of the level of acceptance of AVs in Saudi Arabia. AV acceptance variables are examined using Artificial Neural Networks and Regression Analysis. This research highlights the impact of age, level of comfort, and trust on individuals’ inclination to utilize AVs. Surveys and agent-based models are used to investigate public sentiment and car-sharing dynamics. Despite data constraints and biases, this study improves understanding of AV acceptability in Saudi Arabia. A detailed Table 2 summarizes these research field techniques and findings.
Table 2.
Summary of Literature Review Findings.
Our research aims to narrow the gap in adopting AVs in the GCC region using a modified UTAUT framework. This framework is customized to encompass the GCC region’s unique socio-cultural and geographical characteristics to offer a comprehensive understanding of AV adoption within the GCC and contribute to the global conversation on autonomous transportation technologies. Ultimately, this research can pave the way for appropriate and culturally relevant strategies for the adoption of AVs.
3. Methodology
We establish the theoretical basis for our model, based on UTAUT, to examine GCC autonomous car acceptability. Next, we describe the rigorous survey creation and preparation process. Our comprehensive approach began with a detailed literature study of recent studies on technical acceptance models, cultural influences on technology uptake, and GCC autonomous car acceptance dynamics, incorporating findings from [9,10]. Based on this foundation, an expert council of AVs, survey design, and cultural studies academics and practitioners provided valuable insights. Their feedback helped refine the questionnaire to incorporate GCC opinions and subtleties. The questionnaire’s clarity, relevance, and GCC-specific alignment were improved by thorough pilot testing and revisions. We examined survey participants’ gender, age, education, occupation, and location to interpret our findings. Our results were more generalizable after this detailed analysis revealed our sample population’s diversity and representativeness. We then validated our measurement model using statistical methods to assess reliability and validity. Internal consistency was assessed using Cronbach’s alpha to ensure survey items measured the intended constructs. Composite reliability and average variance extracted (AVE) assessed each construct’s reliability and convergent validity. The Fornell–Larcker Criterion was used to determine discriminant validity to ensure that each measurement model construct differed. Following exploratory and confirmatory factor analysis in structural equation modeling (SEM), the measurement model was validated. Finally, hypothesis testing used correlation coefficients, p-values, T-statistics, and theoretical framework interpretations to estimate structural links between critical constructs. Performance Expectancy, Effort Expectancy, Social Influence, Facilitating Conditions, Cultural Context Moderation, and Behavioral Intention were explored to understand the complex interdependencies affecting GCC AV uptake [28].
3.1. Theoretical Framework
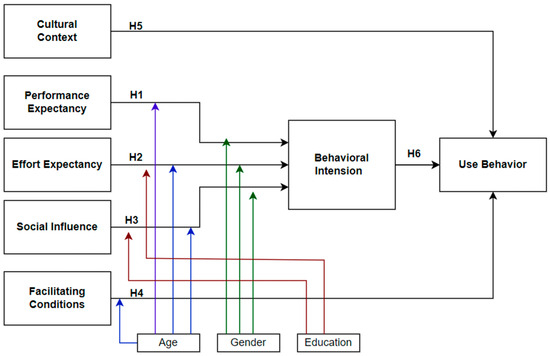
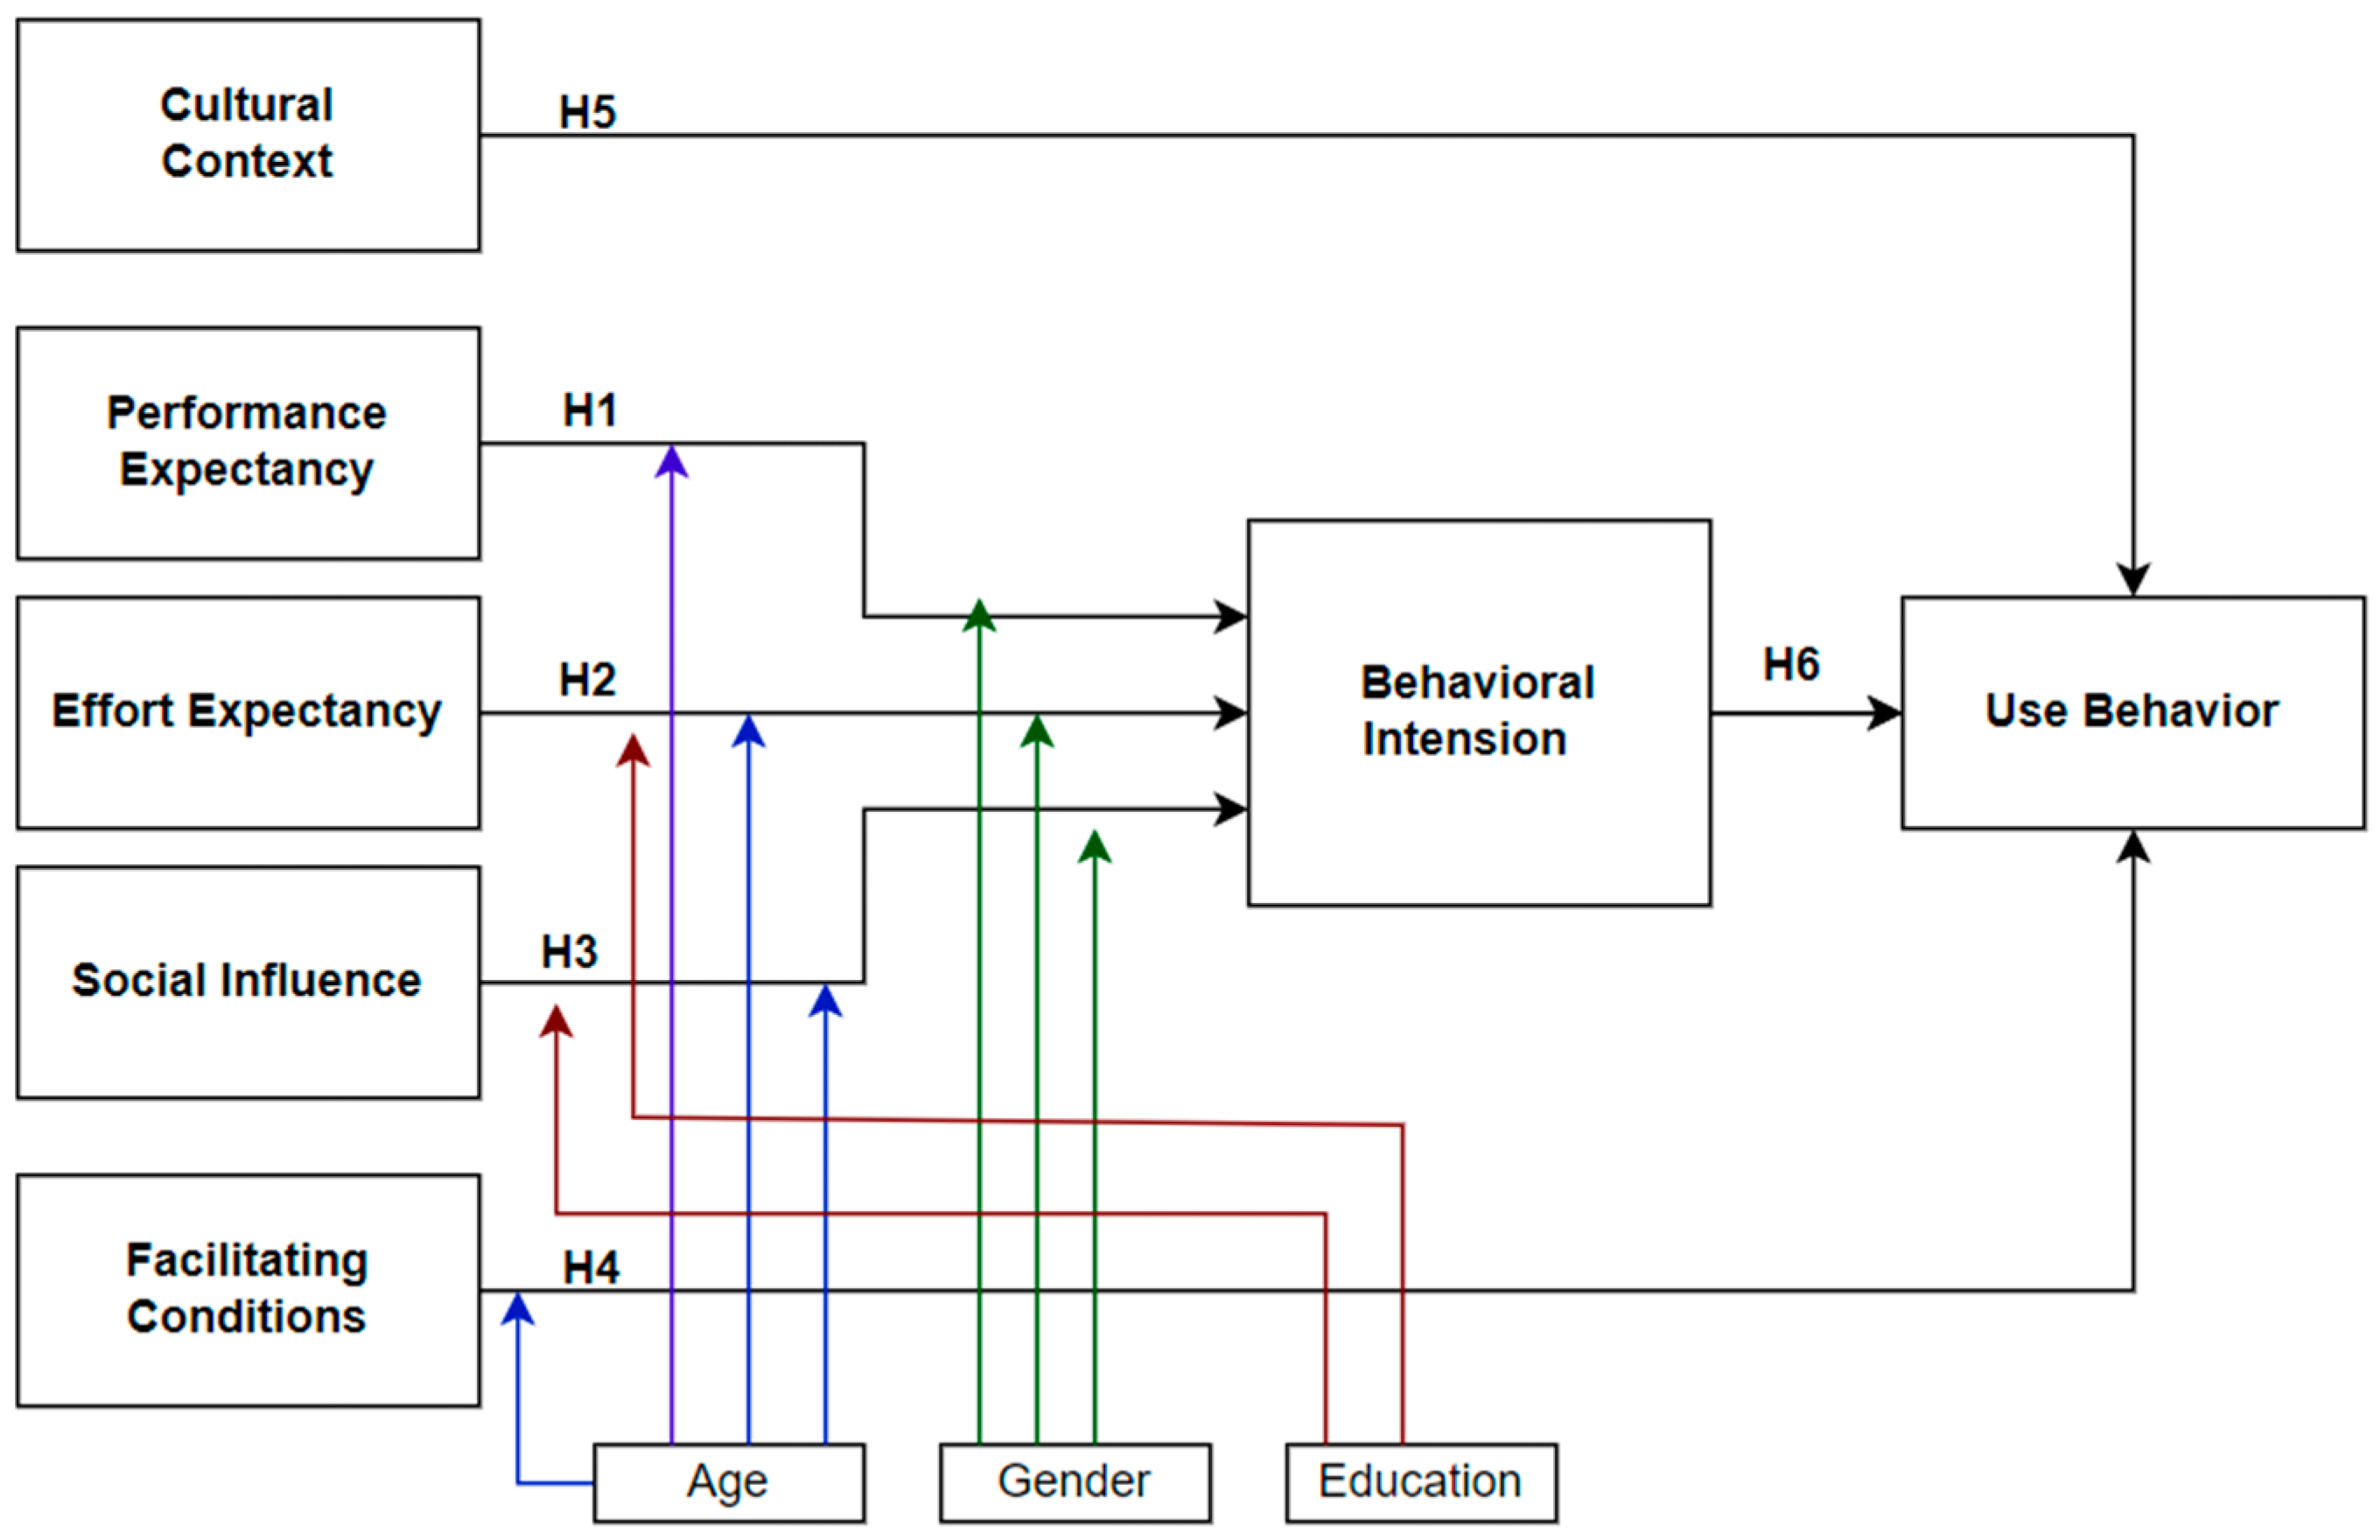
In the context of the UTAUT-based theoretical framework for AV adoption in the GCC, arrows signify the directional influence between various constructs within the model. These graphical elements are pivotal in illustrating the pathways through which factors such as Performance Expectancy, Effort Expectancy, Social Influence, Facilitating Conditions, and Cultural and Receptivity Theories impact Behavioral Intention toward AV adoption. Moreover, when incorporating demographic moderators like age, gender, and education, the arrows extend the model’s complexity by indicating how these variables modify the strength or direction of the relationships between core constructs. Each arrow represents a hypothesized relationship, suggesting that one construct influences or contributes to the development of another. For instance, arrows from Performance Expectancy, Effort Expectancy, Social Influence, and Facilitating Conditions pointing toward Behavioral Intention underscore the assumption that improvements in any of these areas are likely to enhance individuals’ intentions to use AVs [28]. Similarly, arrows from demographic factors to the UTAUT constructs highlight the nuanced view that the impact of these constructs on Behavioral Intention varies across different segments of the population [10].
The framework examines six fundamental assumptions within the GCC’s technical and cultural environment, as specified by UTAUT structures. Six hypotheses are developed based on the theoretical and empirical context. Figure 1 shows hypotheses from the customized UTAUT model to understand AVs relation in GCC.
Figure 1.
UTAUT-Based Theoretical Framework.
H1:
The Performance Expectancy Hypothesis suggests that good perceptions of self-driving cars enhancing commutes in the GCC will increase adoption, highlighting the technology’s benefits.
H2:
The Effort Expectancy Hypothesis predicts that GCC adoption will increase with perceived ease of learning and engagement, as per UTAUT’s paradigm.
H3:
The Social Influence Hypothesis, based on UTAUT’s paradigm, suggests that social support for AV adoption in the GCC will increase intent.
H4:
The Facilitating Conditions Hypothesis argues that confidence in technical infrastructure and support systems increases adoption intentions, which is consistent with UTAUT’s objective.
H5:
Culture and Receptivity Theories examine how culture affects GCC and moderates the link between UTAUT structures and autonomous car acceptability.
H6:
The Behavioral Intention Hypothesis aligns with UTAUT’s concept, indicating that individuals’ anticipated possibility of using AVs soon will favorably affect their intention to use them.
3.2. Survey Creation
A rigorous methodology was implemented to validate the content of a survey questionnaire that explored the adoption and perception of AVs in the GCC region. A key part of this process was a comprehensive literature analysis, which focused on recent studies on technical acceptance models, cultural influences on technology adoption, and the dynamics of AV acceptance, particularly in the GCC environment. This phase was instrumental in ensuring that the questionnaire was in line with current research and tailored to the local context [29,30]. The survey’s comprehensiveness and relevance were significantly enhanced through the collaborative efforts of an expert council, comprising academics and professionals with expertise in AVs, survey design, and cultural studies [31,32]. The survey was created in Arabic and English to accommodate the region’s linguistic diversity and ensure inclusivity in participant responses. After a pilot test, the questionnaire was reviewed for clarity and coverage [26]. Each survey question was thoughtfully designed to ensure validity, aligning with study goals, theoretical concepts, expectations, effort levels, and societal impact. The questionnaire’s responsiveness and accuracy to the GCC context were improved. After a thorough procedure, the questionnaire was adjusted to assess GCC AV attitudes and intents [26].
3.3. Participants Demographic Characteristics
A rigorous methodology was implemented to validate the content of a survey questionnaire that explored the adoption and perception of AVs in the GCC region. A key part of this process was a comprehensive literature analysis, which focused on recent studies on technical acceptance models, cultural influences on technology adoption, and the dynamics of AV acceptance, particularly in the GCC environment. This phase was instrumental in ensuring that the questionnaire was in line with current research and tailored to the local context [28,29]. The survey’s comprehensiveness and relevance were significantly enhanced through the collaborative efforts of an expert council, comprising academics and professionals with expertise in AVs, survey design, and cultural studies [30,31]. After a pilot test, the questionnaire was reviewed for clarity and coverage [26]. Each survey question was thoughtfully designed to ensure validity, aligning with study goals, theoretical concepts, expectations, effort levels, and societal impact. The questionnaire’s responsiveness and accuracy to the GCC context were improved. After a thorough procedure, the questionnaire was adjusted to assess GCC AV attitudes and intents [26].
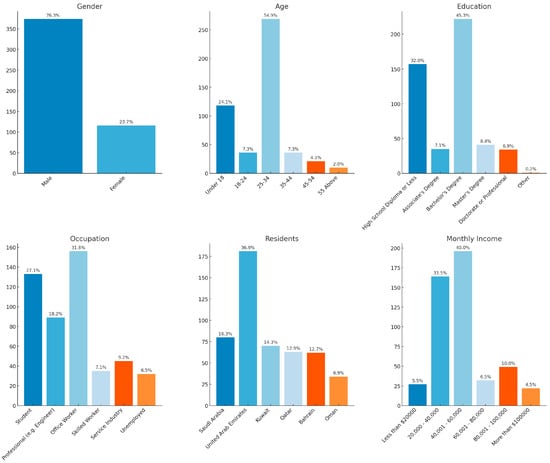
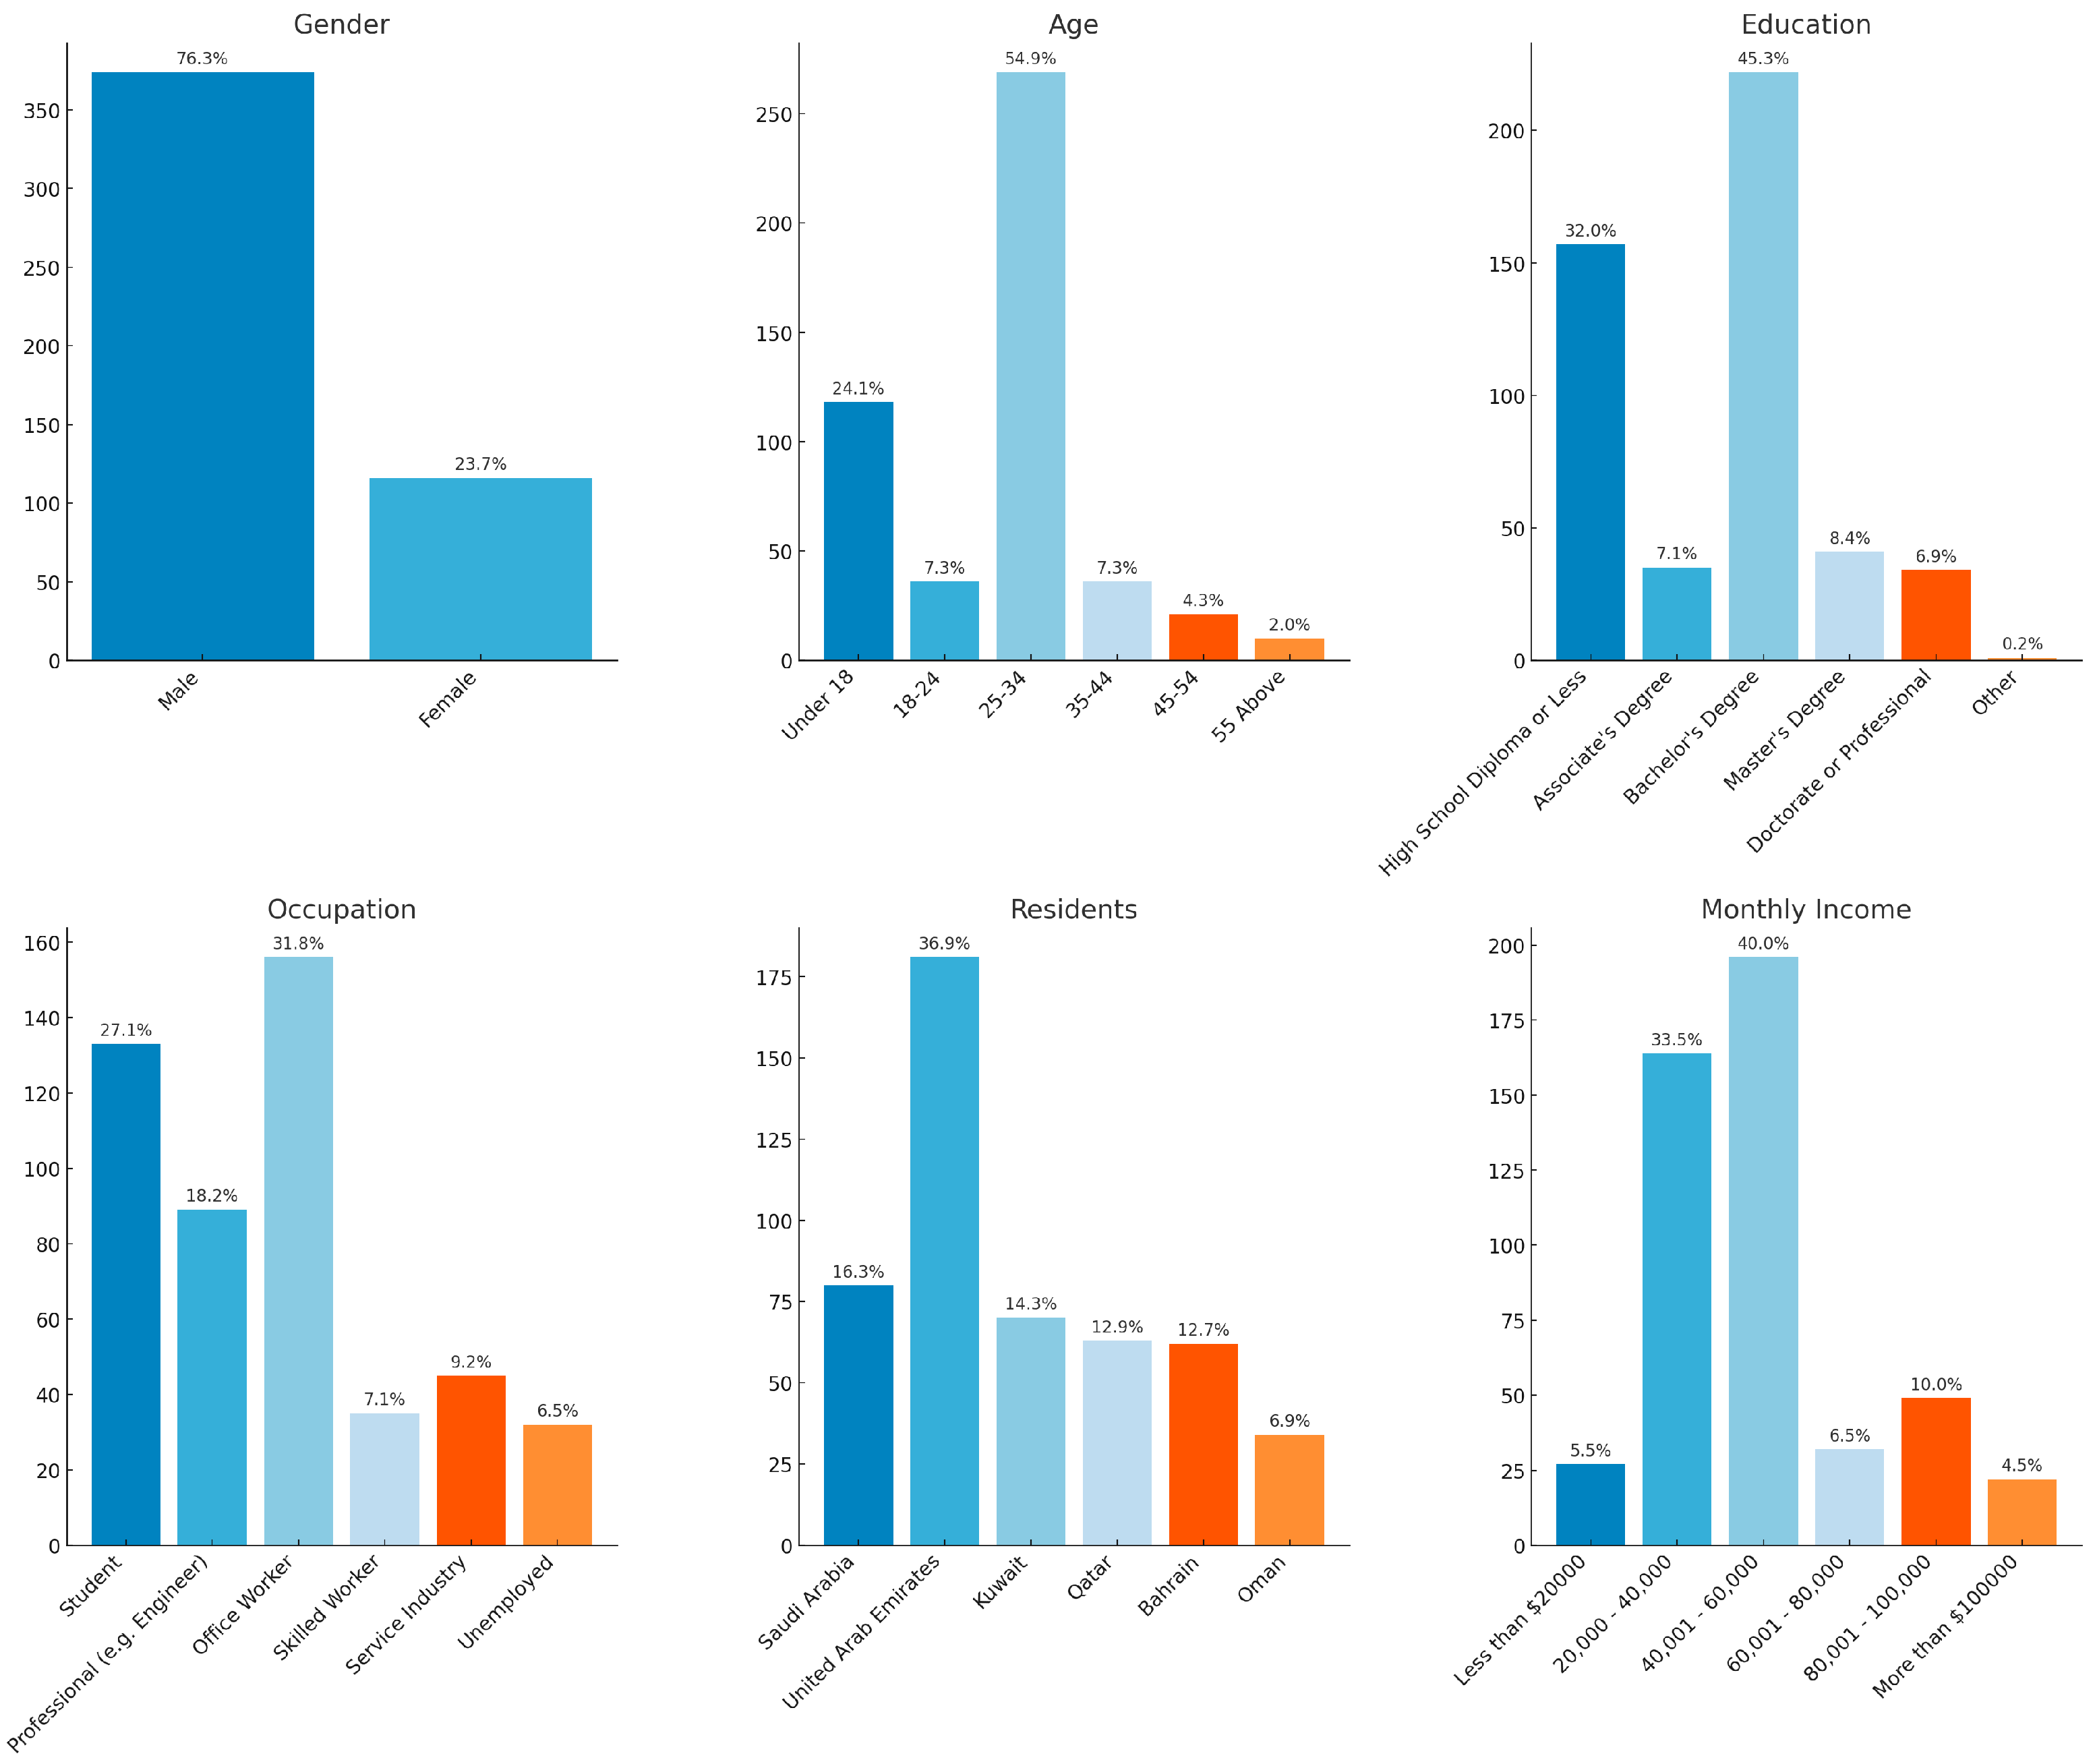
Forty percent of participants had monthly incomes between $40,001 and $60,000. This income bracket may significantly impact participants’ views and engagement with the study’s topic. This demographic data are appropriate for analysis since it covers various social groups. Diversity is essential to avoid bias in the study’s results and allows for more realistic extrapolation to a larger population. However, the results must be interpreted in light of the demographics’ masculine skew and concentration in specific age and economic categories. The study’s findings and implications are assessed based on a comparative visual analysis and a comprehensive demographic overview, as illustrated in Figure 2 and Table 3.
Figure 2.
Demographic Profile of Survey Participants in the GCC Region.
Table 3.
Demographic Distribution of Survey Respondents in the GCC Regio.
3.4. Measurement Model
A measurement model is a conceptual framework used across several disciplines, including statistics, psychology, and social sciences, to explain the relationships between observable and unobservable variables. Using observable data points helps to understand the link between immeasurable underlying constructs.
Object variables consist of unobserved elements of data patterns, while the model often utilizes indicators or observable variables to represent underlying phenomena. Support is provided for identifying relationships among object variables observed by the measurement model when conducting techniques like factor analysis, SEM, and other relevant statistical methods. They provide insight into the manifestation of the measurement model. Complex manifestations and the extent to which unobservability can be inferred are factors to consider. Various parameters are employed in estimating measurement models for states, including external loading, comprehensive reliability, obtained average variance, discriminant validity, and opposing correctness. In the initial example, the contrasting correctness of the measurement model was estimated. Advanced variance extracted (AVE), factor loading, and composite reliability (CR) were utilized for detection, as stated by Hair [31].
To ensure the reliability of the scales used in our study, we begin our analysis with Cronbach’s Alpha. This test is crucial as it assesses the internal consistency of the constructs related to Autonomous Vehicle adoption, confirming that each scale reliably measures the intended. The Facilitating Condition and Performance Expectancy demonstrated high reliability with scores of 0.92 and 0.90, respectively, indicating that each item consistently assesses the same underlying concept.
Following the assessment of internal consistency, we evaluate the composite reliability using rho_a and rho_c. This step is essential to verify that the items within each construct cohesively represent the construct across the dataset, thereby supporting the robustness of our measurement model. Composite reliability, as determined by rho_a and rho_c, indicates the extent to which the items that formed a construct accurately represent that construct. For all constructs, composite reliabilities range between 0.88 and 0.94, suggesting that the components of these constructs are reliable and accurate in portraying their intended concept.
To further establish the validity of our constructs, we compute AVE. This metric helps us determine the amount of variance captured by the constructs in relation to the amount of variance due to measurement error, underscoring the construct validity within the context of AV. AVE assesses construct validity by comparing item variance against measurement error variance. Facilitating Condition and Performance Expectancy had AVEs of 0.75 and 0.68, respectively. These results suggest that a large percentage of the variability in these constructs may be attributed to their component items rather than measurement error. The cultural context has a large AVE of 0.60, meaning that its components account for a significant percentage of the variability relative to measurement error. Table 4 provides each construct’s reliability and validity measures, including Cronbach’s alpha, composite reliability (rho_a and rho_c), and AVE.
Table 4.
Reliability and Validity Measures for Research Constructs.
Maintaining result integrity requires distinguishing constructions. Discriminant validity in SEM was assessed using the widely known Fornell–Larcker Criterion [33]. This criterion is met when the square root of AVE for each construct exceeds its correlations with all other constructs [34]. Table 5 displays the discriminant validity assessment using the Fornell–Larcker criterion. This ensures discriminant validity, exhibiting greater correlations between specific constructs and their indicators than with others. For our analysis, we organized the square roots of AVE diagonally in a table, with correlations beyond the diagonal. The square root of AVE for ‘Age’ is 0.73, higher than for ‘Behavioral Intention’ (0.12) and ‘Cultural Context’ (0.15). The diagonal values square roots of AVE for each construct are consistently higher than their correlations with other constructs across the table. The square root of AVE for ‘Gender’ is 0.86, much greater than for ‘Use Behavior’ (0.11) and ‘Social Influence’ (0.13). ‘Performance Expectancy’ has a square root of AVE at 0.87, higher than ‘Effort Expectancy’ (0.21) and ‘Facilitating Condition’ (0.26).
Table 5.
Discriminant Validity Assessment using Fornell–Larcker Criterion.
The PLS-SEM framework requires cross-loadings to validate the measurement model. Discriminant validity is assessed by ensuring that each indicator loads more on its associated construct than any other model component. Table 6 shows each indicator’s cross-loadings against all constructs [35]. We anticipate each indicator will load much higher than others to prove discriminant validity. The table shows that the EE1 loads are highest on the Effort Expectancy (EE) construct at 0.852, showing its most robust association with EE.
Table 6.
Cross-Loadings of Indicators on Constructs.
Similarly, the indicator FC1 has the highest loading on the Facilitating Condition (FC) at 0.888, demonstrating a strong correlation with the FC construct. Cultural Context indicators (CC1, CC2, CC3) had higher loadings on their construct (0.868, 0.728, 0.834) than on other constructs. Performance Expectancy (PE1 and PE2) had the highest construct loadings at 0.724 and 0.788, confirming this pattern. Indicators have more significant relationships with their constructs than any other construct, supporting the discriminant validity of our model [36]. This is also reflected in the loadings of 0.855 and 0.710 for the Behavioral Intention (BI1 and BI2) indicators on the BI construct. Demographic indicators like Age and Gender have different loadings on their constructs, with Age having a self-loading of 0.725 and Gender a substantial 0.700, which are larger than their cross-loadings with other constructs. This suggests the constructs are well-defined and distinct, confirming the measurement model’s stability. Indicators with larger construct than cross-loadings indicate discriminant solid validity in the model, a fundamental criterion for a credible SEM analysis.
The heterotrait–monotrait ratio (HTMT) is a sophisticated and reliable measure of discriminant validity in SEM. This validity examines whether specific, theoretically unrelated concepts or metrics are empirically distinct [37]. The HTMT ratios, which compare correlations between different traits and those within the same trait, establish the discriminant validity of the constructs when they are substantially less than 1, as shown in the table. A threshold value below 0.90 is widely acknowledged [36], with a more rigorous criterion being 0.85.
Table 7 serves as a practical demonstration of the HTMT ratios, which are key in Establishing model discriminant validity. For example, the HTMT ratios for Gender and Use Behavior and Age and Behavioral Intention are both 0.182, significantly lower than the threshold of 0.85. This means that these constructs are distinct from one another in practice. Similarly, the ratios of 0.383 between Behavioral Intention and Use Behavior, and 0.455 between Cultural Context and Education provide further evidence of solid discriminant validity. In the case of Facilitating Condition and Performance Expectancy, the HTMT value of 0.527 confirms their sufficient differentiation, which has important implications for our understanding of these constructs in real-world scenarios.
Table 7.
Heterotrait–Monotrait Ratio (HTMT) for Discriminant Validity.
The Goodness of Fit (GoF) Index is an essential quantitative indicator for assessing the overall fit of SEM. By evaluating the robustness of the measurement model through AVE and the variance explained in the endogenous constructs through R-Square, this metric is crucial for determining how accurately the model represents the observed data [38]. The results summarized in Table 8 indicate the Goodness of Fit indices for the Structural Equation Model.
Table 8.
Goodness of Fit (GoF) Index for Structural Equation Model (SEM).
Behavioral Intention has an AVE of 0.739 and an R-Square of 0.729, suggesting that the model explains 72.9% of its variance. Cultural Context has an AVE of 0.599, indicating modest indicator variation. The model explains 61% of Cultural Context variation with an R-Square of 0.610. Facilitating Condition has an AVE of 0.917, suggesting that its indicators explain most variation with little error. Facilitating Condition’s R-Square is 0.900, indicating that the model captures 90% of its variation. Performance Expectancy has an AVE of 0.898, suggesting a good measurement model where indicators explain much variation. The R-Square is strong at 0.870, indicating the model explains 87% of Performance Expectancy variation. Social Influence’s AVE of 0.734 shows its indicators capture a lot of variation rather than measurement error. The R-Square value of 0.750 signifies that the model explains 75% of the variance in Social Influence. The measurement methods for these structures are accurate because the AVE values are all well above the accepted level of 0.5. R-Square values are considerable, indicating that the model accounts for a substantial proportion of the variability observed in its endogenous constructs [39]. These figures show a model that fits the data well, providing a solid platform for deriving inferences regarding model connections. Table 9 presents original sample statistics and T-statistics for hypothesis testing, detailing the original sample values, sample mean, standard deviation, and T-statistics for each construct examined.
Table 9.
Original Sample Statistics and T-Statistics for Hypotheses Testing.
Upon confirming the validity of our measurement model, we utilize SEM to test the hypothesized relationships between constructs. This complex modeling technique is critical for understanding the direct and indirect relationships that influence the adoption of AVs in the GCC.
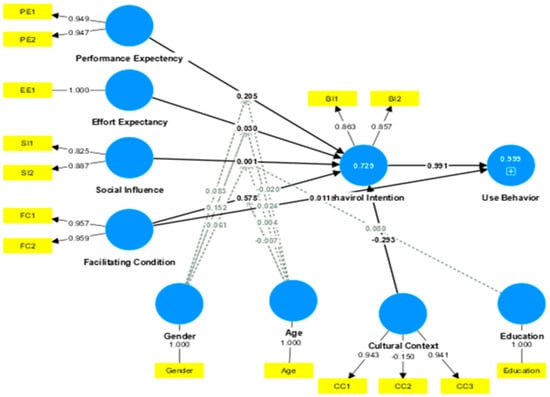
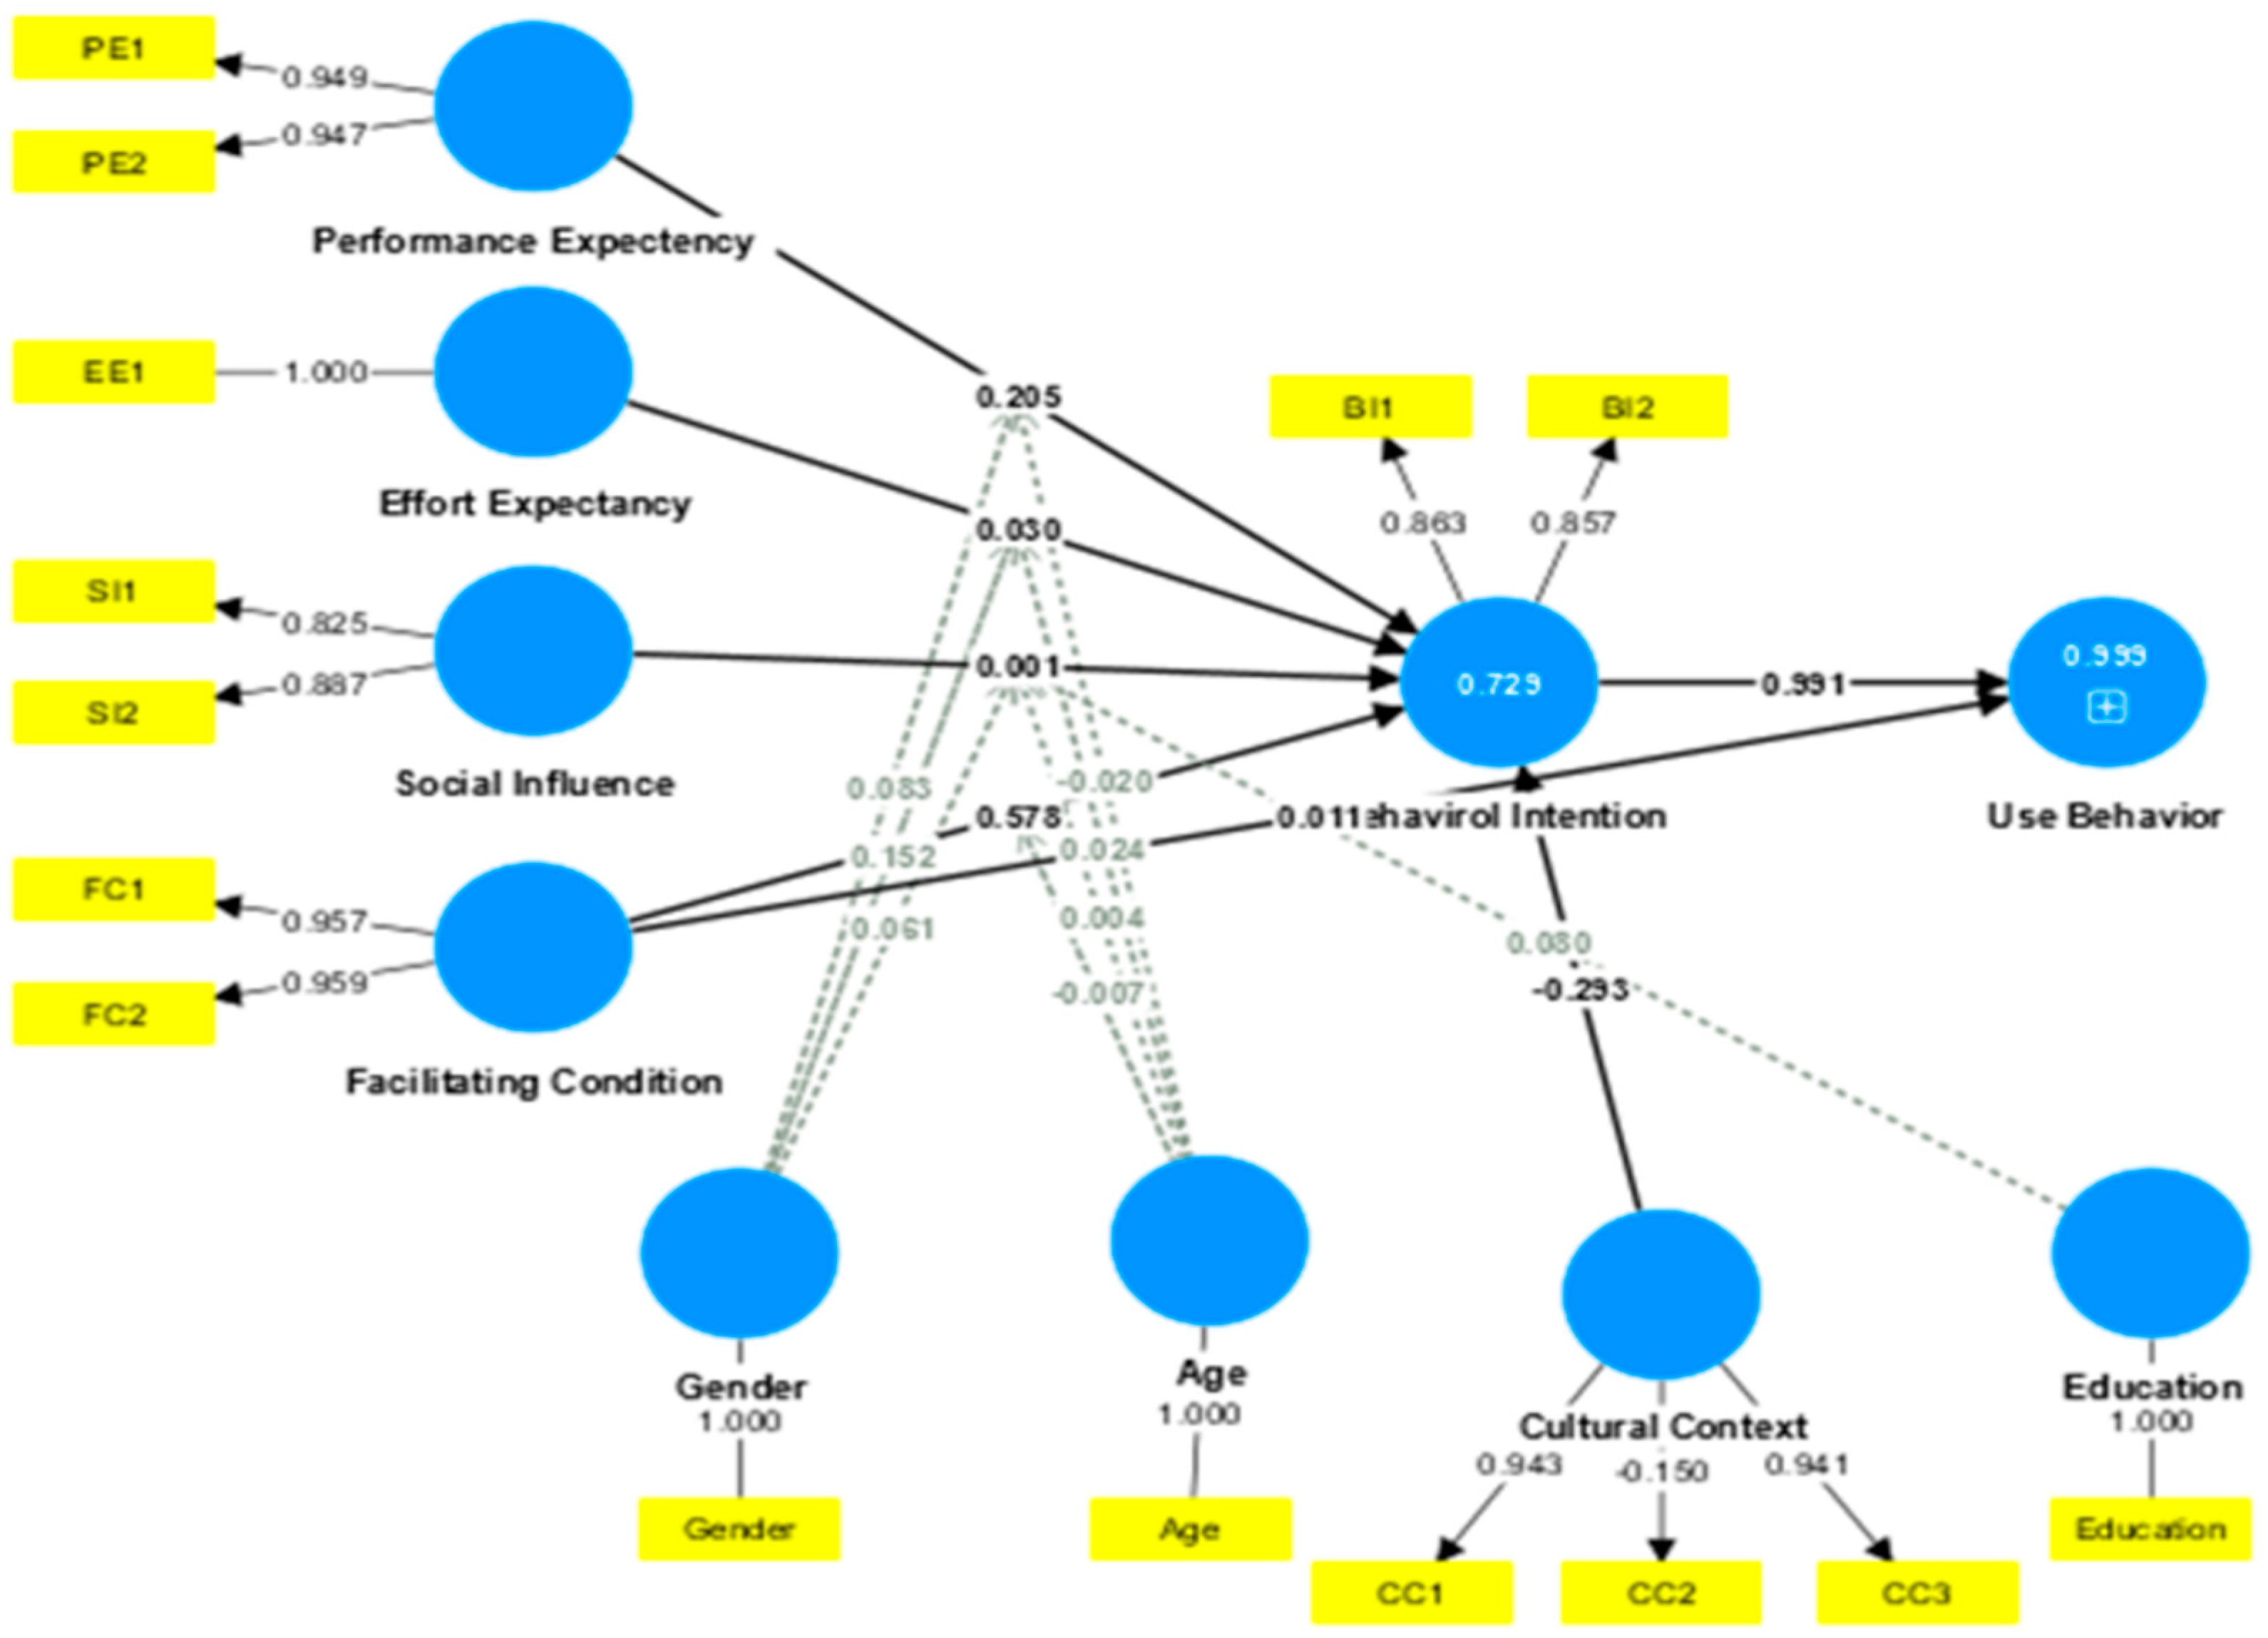
Figure 3 displays the correlation analysis results and a summary of our hypotheses surrounding the factors influencing AV adoption in the GCC region. Each hypothesis is examined to determine how variables affect GCC autonomous car adoption.
Figure 3.
Structural model showcasing UTAUT constructs’ interrelations. (Solid arrows indicate direct links with adjacent coefficients; Dotted arrows indicate control changes. Measured items are yellow; constructs are blue. Higher factor loadings are indicated by darker ovals and effect size by arrow width.).
H1:
Performance Expectancy Hypothesis: Positive perceptions of how AVs in the GCC would improve the overall commuting experience will positively influence individuals’ intention to adopt AVs. The calculated correlation coefficient between PE and BI is 0.205. This suggests that favorable opinions about the advantages of self-driving cars influence people’s willingness to adopt them—the low p-value of 0.000 and the T statistic of 5.556 show a strong and statistically significant link.
H2:
Effort Expectancy Hypothesis: Perceiving the ease of learning how to use and interact with AVs in the GCC will positively affect individuals’ intention to adopt them. The calculated correlation coefficient between EE and BI is 0.033. The T statistic of 0.881 indicates that the link could be more robust. Nevertheless, based on the corresponding p-value of 0.378, it can be concluded that this relationship lacks statistical significance.
H3:
Social Influence Hypothesis: Encouraging friends, family, and peers to adopt and use AVs in the GCC will positively impact individuals’ intention to adopt them. The calculated coefficient for the relationship between SI and BI is 0.001. This negative estimate implies a minor negative correlation between social impact and adoption. The obtained p-value of 0.883 suggests that the observed link lacks statistical significance.
H4:
Facilitating Conditions Hypothesis: Believing that the necessary technological infrastructure and support systems are in place to facilitate the adoption of AVs in the GCC will positively influence individuals’ intention to adopt them. FC and BI have an estimated relationship of 0.578. Having the proper technology framework in place significantly positively affects people’s decision to use self-driving cars. The T statistic value of 16.498 and p-value of 0.000 suggest a significant relationship.
H5:
Cultural Context Moderation Hypotheses: In the GCC, the significance of privacy, cultural receptiveness, and trust will jointly moderate the impact of social influence, facilitating conditions, and performance expectancy on intention to adopt AVs. Our calculated correlation value for Social Influence and Cultural Context on BI is −0.293. This finding suggests a negative interaction effect, wherein the combined impact of cultural context and social factors influences the intention to utilize AVs. The negligible p-value of 0.000 provides further support for the significance of this interaction.
H6:
Behavioral Intention Hypothesis: Individuals’ perceptions of their likelihood to start using AVs shortly will positively affect their intention to adopt them. The structural estimate of the relationship between Use Behavior and BI is 0.991. This estimate is so high because it indicates that people’s intentions to accept autonomous cars have a considerable positive effect on their actual behavior regarding how they utilize them. Significant evidence for a relationship’s existence is supported by the p-value of 0.000 and the exceedingly high T statistic of 212.098.
Most hypotheses were confirmed by correlation analysis, showing the complex interaction of factors affecting GCC autonomous car adoption [37]. These findings will reveal policy implications and research opportunities as we analyze and interpret them. Thus, the data highly supports specific hypotheses, while others are unexpected or statistically inconsequential, highlighting the complexity of GCC autonomous car adoption variables.
The multigroup SEM analysis across six GCC countries reveals robust evidence supporting the theoretical framework used to study self-driving car adoption. Consistently high Comparative Fit Index (CFI) and Tucker–Lewis Index (TLI) values across most countries, especially in the UAE (CFI = 0.96, TLI = 0.95), indicate an excellent model fit and validate the underlying constructs [40]. However, variations in the Root Mean Square Error of Approximation (RMSEA), particularly in Oman (RMSEA = 0.09), highlight unique regional characteristics that may influence technology adoption. These findings underscore the framework’s strength and its adaptability to different cultural and infrastructural contexts within the GCC, thereby affirming the model’s generalizability and relevance for policy formulation tailored to regional specifics [35]. Table 10 displays a comparative analysis of model fit across GCC countries for the adoption of self-driving cars, showing the Comparative Fit Index (CFI), Tucker–Lewis Index (TLI), Root Mean Square Error of Approximation (RMSEA), Chi-Square statistic, and p-values for each country.
Table 10.
Comparative Analysis of Model Fit Across GCC Countries for Self-Driving Car Adoption.
To ensure the robustness and generalizability of our model, we perform K-fold Cross-Validation. This method tests the model’s stability and predictive accuracy across different subsets of the data, an essential step in validating the overall reliability of our findings. The multigroup SEM analysis across six GCC countries reveals robust evidence supporting the theoretical framework for studying self-driving car adoption. Consistently high Comparative Fit Index (CFI) and Tucker–Lewis Index (TLI) values across most countries, especially in the UAE (CFI = 0.96, TLI = 0.95), indicate an excellent model fit and validate the underlying constructs [40]. However, variations in the Root Mean Square Error of Approximation (RMSEA), particularly in Oman (RMSEA = 0.09), highlight unique regional characteristics that may influence technology adoption. These findings underscore the framework’s strength and adaptability to different cultural and infrastructural contexts within the GCC, affirming the model’s generalizability and relevance for policy formulation tailored to regional specifics [41]. Table 11 outlines the results of K-fold cross-validation across the GCC, providing the CFI, TLI, RMSEA, Chi-Square statistic, and p-values for each fold.
Table 11.
K-fold Cross-Validation Results Across the GCC (K = 5).
After conducting our analysis, we utilized Bayesian SEM to refine our estimates and incorporate prior knowledge into the model. This advanced technique helped us to improve the precision of our model estimates and gain a sophisticated and nuanced understanding of the factors that influence the adoption of AVs in the GCC region. Table 12 presents the Bayesian SEM parameter estimates for critical determinants of AV adoption in the GCC, including posterior means, standard deviations, and 95% credible intervals. This comprehensive view of how each factor influences adoption intention shows that positive values positively influence adoption intention. At the same time, moderation by age and gender highlights the demographic-specific impacts. The results from the Bayesian SEM analysis provide compelling evidence of the positive drivers behind AV adoption in the GCC region. Performance Expectancy and Facilitating Conditions emerged as strong predictors, underscoring the importance of perceived benefits and available support for technology uptake. Social influences also significantly shape Behavioral Intention, affirming the cultural context’s role in technology acceptance. Notably, the moderation effects reveal that targeted approaches are necessary, as younger individuals and females respond more positively to these influencing factors. These insights are crucial for stakeholders aiming to enhance AV penetration in the region, suggesting that tailored, demographic-specific strategies could be more effective. This analysis supports the robustness of the applied theoretical framework and enhances the understanding of factors that can drive successful technology adoption in culturally diverse regions like the GCC.
Table 12.
Bayesian SEM Analysis for Autonomous Vehicle Adoption in the GCC.
4. Discussion
A study of AVs in the GCC region reveals essential details about the technical, social, and cultural factors affecting this emerging trend. The study confirms Performance Expectation, Effort Expectation, Social Influence, and Facilitating Conditions in AV adoption and shows their complex interdependencies. The findings provide a comprehensive comprehension of public readiness and concerns as the GCC prepares for a significant transportation shift; this can tell us how policymakers, manufacturers, and technologists collaborate to navigate this transition.
4.1. Demographic Dynamics in Self-Driving Car Adoption
Based on our data analysis on self-driving vehicle adoption, we found that different age groups have varying acceptance rates and trends. Among the respondents aged 18 to 34, 70% were interested in self-driving cars. However, the acceptance rates were significantly lower among older adults, with nearly 40% displaying noticeable acceptance rates, particularly among those aged 55 and above. The difference in acceptance rates could be attributed to safety concerns, ingrained driving habits, and unfamiliarity with the latest technologies. Similar results have been observed by Sisiopiku [42], which supports our findings on the age-related differences in technology adoption.
Regarding gender, the survey results hinted that fewer than 55% of female respondents accepted the concept of self-driving cars, compared with 65% of male respondents. This highlights how employment demands and technology impact attitudes towards AVs. Occupations with less technological focus had a 60% acceptance rate, showing that the profession affects technology adoption differently. Research indicates that 75% of respondents with annual earnings over $80,000 are interested in adopting self-driving automobiles, a significant finding that underscores the role of income in technology adoption. The financial ability to invest in developing technologies and the image of autonomous cars as symbols of prestige and advancement explain this desire. This finding aligns with research by Zefreh [43], who reported similar trends among high-income earners. Conversely, individuals earning less than $30,000 had a lower acceptance rate of 45%, perhaps due to financial constraints and lifestyle preferences. This income disparity in technology adoption is a crucial societal issue that needs to be addressed.
4.2. Cultural Influence and Technological Trust
Trust in technology is another critical factor influencing adoption rates. A significant difference in technical confidence between Kuwait (80%) and Saudi Arabia (60%) could impact the acceptability of self-driving automobiles. Kuwait may exhibit higher trust levels due to government activities in technology education and infrastructure development, while Saudi Arabia may be more cautious in adopting new technologies. This variation necessitates a careful investigation to determine if these numbers are influenced by external factors like government laws or global technological breakthroughs or if they reflect underlying cultural beliefs. Similar trends have been noted by Schepis [44], who observed that government initiatives significantly influence public trust in technology.
Understanding how perceptions may evolve as self-driving technology becomes more widespread is crucial. The views on self-driving vehicles in GCC countries vary due to economic development, technology exposure, and cultural norms. Policymakers and businesses must understand these elements for successful implementation in the region. Dialogue and research are essential for addressing the diverse perspectives on self-driving technology adoption. As found in the study by Chen [45], comprehensive engagement with community stakeholders is critical to navigating the complex landscape of technology acceptance.
4.3. Perceptions of Benefits and Concerns
Our analysis reveals a significant trend in the GCC region, with 70% of people in the UAE expressing a favorable view of self-driving cars. This positive perception is likely influenced by the nation’s advanced infrastructure, eagerness to adopt new technologies and initiatives like Dubai’s Smart Autonomous Mobility Strategy. These findings align with the research of Shahedi [46], who also observed similar trends in regions with proactive technological policies.
In comparison, Saudi Arabia may exhibit a 55% positive perception, which, while optimistic, suggests a more cautious reception that could be linked to the country’s larger size and the ongoing development of its smart city initiatives. Regarding safety and reliability concerns, let us hypothesize that there is a noticeable divide, with Qatar reporting a 60% confidence level in the safety of self-driving cars. This could reflect Qatar’s significant investments in road safety and traffic management systems as detailed in research by Alhajyaseen [47].
On the other hand, countries like Bahrain and Oman might exhibit lower confidence levels, say 50% and 45%, respectively, potentially due to less exposure to such technologies and a higher prevalence of traditional driving practices. Kuwait may hold a favorable view, around 80%, on the potential benefits of self-driving cars for both the environment and the economy. This optimism could be attributed to the country’s efforts to reduce carbon emissions and its Vision 2035 for a ‘new Kuwait’.
While there is a general trend towards acknowledging the benefits of self-driving cars in the GCC region, variations in perception are evident. These differences stem from disparities in infrastructure, economic priorities, cultural attitudes, and technological advancements across each country [45]. This underscores the necessity of tailored approaches in policymaking and public engagement to address each nation’s specific concerns and expectations. As self-driving technology continues to advance and integrate into society, ongoing research and dialogue will be essential to ensure that these innovative solutions align with the diverse needs and goals of GCC countries.
4.4. Barriers to Self-Driving Car Adoption
GCC countries face numerous barriers to adopting self-driving technology, each with a different nature and intensity. The primary concern centers around technological challenges. With its advanced infrastructure, the UAE reports a barrier perception of only about 20%. Conversely, due to a dire need for infrastructure development to support AVs, 60% of respondents from Oman perceived technological barriers. This finding aligns with the study by Duarte [48], which identifies infrastructure as a critical factor in adopting new technologies.
Furthermore, there are legal and regulatory obstacles to the adoption of AVs. This is where the role of policymakers becomes crucial. For example, 40% of respondents from Saudi Arabia express legal and regulatory concerns due to the challenges in aligning existing laws with the needs of emerging technologies. On the other hand, with swift policy-making, only 15% of respondents consider legal and regulatory issues as a significant concern—societal resistance to change further compounds these challenges. Kuwait, with its deep-rooted cultural preferences for traditional driving, demonstrated a societal resistance rate of 30%. However, Bahrain displayed a higher resistance rate of around 50%, indicating a more cautious approach to the societal integration of self-driving cars. The research by Kumar [49], corroborates the impact of societal resistance on technology adoption, emphasizing the need for tailored policy interventions.
One key factor affecting the adoption rate of self-driving technology is the economic divide within the GCC. Countries with robust economies, like Qatar and the UAE, showed more adaptability towards self-driving cars than less affluent countries, where economic concerns lead people to resist adopting such vehicles.
4.5. GCC Adoption Rates vs. Global Trends
The adoption of self-driving cars is progressing at varied rates globally, influenced by technological advancements, regulatory environments, and public image concerns. In prominent technology hubs like Silicon Valley, the adoption rate may reach approximately 80%, facilitated by cutting-edge innovations, favorable policies, and a tech-savvy population. In contrast, GCC countries exhibit a more cautious approach; for instance, the UAE reports an adoption rate of 70% due to its well-developed infrastructure and progressive national reforms [50]. However, it still trails behind first-world countries, facing unique regional challenges such as extreme weather conditions that can impair the functionality of automated sensors and systems, typically tested under milder climates.
Saudi Arabia and Qatar show lower adoption rates of around 55% and 60%, respectively, underscoring the need for comprehensive strategies to integrate self-driving technology within the existing transportation ecosystems. Furthermore, the cultural emphasis on car ownership and the status symbol associated with driving may hinder the transition to shared autonomous mobility, a trend gaining momentum in the Western world [51]. This cultural factor is a significant barrier to the adoption of self-driving cars in these countries, and understanding it is crucial for developing effective strategies.
Global issues like safety, cybersecurity, and ethical dilemmas surrounding autonomous driving decisions also affect GCC countries, mirroring widespread apprehensions about adopting self-driving cars. Nonetheless, the nature and pace of these challenges vary based on global trends, requiring adaptable solutions.
Understanding these unique regional factors is crucial for lawmakers and technology leaders in the GCC. This approach will not only cater to their specific needs and conditions but also align GCC countries with international technological advancements, ensuring that future policies and initiatives effectively support the widespread adoption of AVs. This alignment is a key step towards the successful integration of self-driving technology in the GCC.
5. Study Limitations and Prospective Research
The conducted research provides an extensive review of adopting AVs in the GCC region; the research has some limitations. Firstly, our research relies mainly on quantitative data, which only provide insights into AV adoption rates and demographic variables. This approach may not accurately represent individuals’ complex opinions and impressions of AVs. Therefore, incorporating qualitative research methods such as interviews and focus groups could provide a more comprehensive understanding of the factors influencing AV adoption. Secondly, our study focuses solely on the GCC region. Therefore, the findings may only apply to regions with different cultural, economic, and legal environments.
Additionally, it is essential to note that our research model, based on the UTAUT, does not include emerging factors that could significantly influence AV adoption. For example, cybersecurity and data privacy concerns are increasingly relevant to AVs, and studies incorporating these factors are necessary. Such research could profoundly impact policy-making and user acceptance of AVs. Therefore, there are several avenues for future research. Using qualitative research methods could enhance our understanding of the subjective experiences and concerns related to AVs. Comparative studies examining AV adoption across different cultural and regulatory landscapes could help us understand how contextual factors influence technology acceptance. Lastly, longitudinal studies that track changes in public perception and acceptance of AVs over time could reveal how advancements in technology and regulatory frameworks affect user trust and acceptance. Such studies are invaluable for understanding the dynamic nature of technology adoption and formulating policies that effectively address public concerns and expectations.
6. Conclusions
Our study found that attitudes towards AVs across the GCC are diverse and influenced by various demographic, cultural, technological, and economic factors. Notably, younger age groups demonstrated a higher comfort level with self-driving vehicles, indicative of a generational shift toward transportation that is likely to be more digitally driven than currently experienced by older generations. Road infrastructure significantly influences the technological adoption and acceptance of such innovations in GCC countries.
The importance of legal and regulatory frameworks cannot be overstated, with countries like the UAE leading the way in creating environments conducive to AV integration. Nevertheless, our research highlighted that societal readiness and cultural attitudes present notable challenges, underscoring the need for targeted awareness and educational initiatives.
Concerns were also raised regarding the economic and environmental impacts of introducing self-driving cars to a region heavily reliant on oil production. This transition presents an opportunity for the GCC to diversify its economy and contribute to global sustainability initiatives, leveraging the environmental benefits associated with AVs.
The findings have critical implications for policymakers and industry leaders, advocating for a nuanced approach to advance self-driving car technology. It is crucial to consider each GCC country’s unique needs and technological contexts for successful integration. Moreover, the research points to significant changes in transportation patterns, envisioning a future marked by rapid, sustainable, and digitally connected autonomous transportation within smart cities in the GCC. Despite the promising outlook, challenges remain, necessitating ongoing research and dialogue to maximize self-driving cars’ economic, environmental, and societal benefits. Achieving widespread integration in the GCC requires complex, collaborative efforts across sectors amid this paradigm shift, potentially contributing to the global discourse on autonomous mobility.
Author Contributions
Methodology, F.H.; Software, A.A.M.; Investigation, A.A.; Resources, S.A.-S.; Data curation, M.H.; Supervision, M.A.A.; Project administration, U.U.S. All authors have read and agreed to the published version of the manuscript.
Funding
This research was funded by the Ministry of Education Malaysia and Universiti Teknologi Malaysia (UTM), under the UTM Fundamental Research Grant, Grant Number Q.J130000.3823.22H29.
Data Availability Statement
Data underlying the results presented in this paper are not publicly available at this time, but may be obtained from the authors upon reasonable request.
Conflicts of Interest
The authors declare no conflict of interest.
References
- Tengilimoglu, O.; Carsten, O.; Wadud, Z. Implications of automated vehicles for physical road environment: A comprehensive review. Transp. Res. Part E 2023, 169, 1366–5545. [Google Scholar] [CrossRef] [Scilit]
- Yeong, D.J.; Velasco-hernandez, G.; Barry, J.; Walsh, J. Sensor and sensor fusion technology in autonomous vehicles: A review. Sensors 2021, 21, 2140. [Google Scholar] [CrossRef] [Scilit] [PubMed]
- Al-Abdallah, G.; Khair, N.; Elmarakby, R. The Impact of Social Networking Sites on Luxury Vehicles Purchase Decision Process in Gulf Cooperation Council Countries. J. Int. Consum. Mark. 2021, 33, 559–577. [Google Scholar] [CrossRef] [Scilit]
- Venkatesh, V.; Thong, J.Y.L.; Xu, X. Unified theory of acceptance and use of technology: A synthesis and the road ahead. J. Assoc. Inf. Syst. 2016, 17, 328–376. [Google Scholar] [CrossRef] [Scilit]
- Wiseman, Y. Autonomous Vehicles. In Encyclopedia of Information Science and Technology, 5th ed.; Igi Global: Hershey, PA, USA, 2020; pp. 1–11. [Google Scholar] [CrossRef] [Scilit]
- Mishra, S.A. Machine Learning in Autonomous Vehicles. Int. J. Adv. Res. Sci. Commun. Technol. 2023, 3, 210–218. [Google Scholar] [CrossRef] [Scilit]
- Vishnukumar, H.J.; Butting, B.; Muller, C.; Sax, E. Machine learning and deep neural network—Artificial intelligence core for lab and real-world test and validation for ADAS and autonomous vehicles: AI for efficient and quality test and validation. In Proceedings of the 2017 Intelligent Systems Conference, (IntelliSys), London, UK, 7–8 September 2017; pp. 714–721. [Google Scholar] [CrossRef] [Scilit]
- Tian, Y.; Wang, X. A Study on Psychological Determinants of Users’ Autonomous Vehicles Adoption from Anthropomorphism and UTAUT Perspectives. Front. Psychol. 2022, 13, 986800. [Google Scholar] [CrossRef] [Scilit] [PubMed]
- Sutarto, A.P.; Ansori, N.; Widyanti, A.; Trapsilawati, F.; Rifai, A.P.; Erlangga, R.; Woodman, R. Driving the Future: Using TAM and UTAUT to Understand Public Acceptance of Fully Autonomous Vehicles. In Proceedings of the 2023 10th International Conference on ICT for Smart Society (ICISS), Bandung, Indonesia, 6–7 September 2023. [Google Scholar] [CrossRef] [Scilit]
- Morrison, G.; Van Belle, J.P. Customer intentions towards autonomous vehicles in South Africa: An extended UTAUT model. In Proceedings of the 2020 10th International Conference on Cloud Computing, Data Science & Engineering (Confluence), Noida, India, 29–31 January 2020. [Google Scholar] [CrossRef] [Scilit]
- Bansal, P.; Kockelman, K.M. Forecasting Americans’ long-term adoption of connected and autonomous vehicle technologies. Transp. Res. Part A Policy Pract. 2017, 95, 49–63. [Google Scholar] [CrossRef] [Scilit]
- Webb, J. The future of transport: Literature review and overview. Econ. Anal. Policy 2019, 61, 1–6. [Google Scholar] [CrossRef] [Scilit]
- Wu, J.; Liao, H.; Wang, J.W. Analysis of consumer attitudes towards autonomous, connected, and electric vehicles: A survey in China. Res. Transp. Econ. 2020, 80, 100828. [Google Scholar] [CrossRef] [Scilit]
- Zmud, J.P.; Sener, I.N. Towards an Understanding of the Travel Behavior Impact of Autonomous Vehicles. Transp. Res. Procedia 2017, 25, 2500–2519. [Google Scholar] [CrossRef] [Scilit]
- Bennett, R.; Vijaygopal, R.; Kottasz, R. Willingness of people with mental health disabilities to travel in driverless vehicles. J. Transp. Health 2019, 12, 1–12. [Google Scholar] [CrossRef] [Scilit]
- Roche-Cerasi, I. Public acceptance of driverless shuttles in Norway. Transp. Res. Part F Traffic Psychol. Behav. 2019, 66, 162–183. [Google Scholar] [CrossRef] [Scilit]
- Ritchie, O.T.; Watson, D.G.; Griffiths, N.; Misyak, J.; Chater, N.; Xu, Z.; Mouzakitis, A. How should autonomous vehicles overtake other drivers? Transp. Res. Part F Traffic Psychol. Behav. 2019, 66, 406–418. [Google Scholar] [CrossRef] [Scilit]
- Anania, E.C.; Rice, S.; Walters, N.W.; Pierce, M.; Winter, S.R.; Milner, M.N. The effects of positive and negative information on consumers’ willingness to ride in a driverless vehicle. Transp. Policy 2018, 72, 218–224. [Google Scholar] [CrossRef] [Scilit]
- Wang, N.; Tang, L.; Pan, H. Effectiveness of policy incentives on electric vehicle acceptance in China: A discrete choice analysis. Transp. Res. Part A Policy Pract. 2017, 105, 210–218. [Google Scholar] [CrossRef] [Scilit]
- Xu, Z.; Zhang, K.; Min, H.; Wang, Z.; Zhao, X.; Liu, P. What drives people to accept automated vehicles? Findings from a field experiment. Transp. Res. Part C Emerg. Technol. 2018, 95, 320–334. [Google Scholar] [CrossRef] [Scilit]
- Kaur, K.; Rampersad, G. Trust in driverless cars: Investigating key factors influencing the adoption of driverless cars. J. Eng. Technol. Manag. 2018, 48, 87–96. [Google Scholar] [CrossRef] [Scilit]
- Hussain, Q.; Alhajyaseen, W.K.M.; Adnan, M.; Almallah, M.; Almukdad, A.; Alqaradawi, M. Autonomous vehicles between anticipation and apprehension: Investigations through safety and security perceptions. Transp. Policy 2021, 110, 440–451. [Google Scholar] [CrossRef] [Scilit]
- Al Barghuthi, N.B.; Said, H. Readiness, Safety, and Privacy on Adopting Autonomous Vehicle Technology: UAE Case Study. In Proceedings of the 2019 Sixth HCT Information Technology Trends (ITT), Ras Al Khaimah, United Arab Emirates, 20–21 November 2019. [Google Scholar] [CrossRef] [Scilit]
- Aldakkhelallah, A.; Alamri, A.S.; Georgiou, S.; Simic, M. Public Perception of the Introduction of Autonomous Vehicles. World Electr. Veh. J. 2023, 14, 345. [Google Scholar] [CrossRef] [Scilit]
- Toglaw, S.; Ottesen, A.; Nissi, Y. Autonomous Vehicles: A Value Proposition for Emerging Markets—The Case of Kuwait. Proceedings 2023, 85, 35. [Google Scholar] [CrossRef] [Scilit]
- Alsghan, I.; Gazder, U.; Assi, K.; Hakem, G.H.; Sulail, M.A.; Alsuhaibani, O.A. The Determinants of Consumer Acceptance of Autonomous Vehicles: A Case Study in Riyadh, Saudi Arabia. Int. J. Hum.–Comput. Interact. 2022, 38, 1375–1387. [Google Scholar] [CrossRef] [Scilit]
- Bösch, P.M.; Becker, F.; Becker, H.; Axhausen, K.W. Cost-based analysis of autonomous mobility services. Transp. Policy 2018, 64, 76–91. [Google Scholar] [CrossRef] [Scilit]
- Kettles, N.; Van Belle, J.P. Investigation into the antecedents of autonomous car acceptance using an enhanced UTAUT Model. In Proceedings of the 2019 International Conference on Advances in Big Data, Computing and Data Communication Systems (icABCD), Durban, South Africa, 5–6 August 2019. [Google Scholar] [CrossRef] [Scilit]
- Farzin, I.; Mamdoohi, A.R.; Ciari, F. Autonomous Vehicles Acceptance: A Perceived Risk Extension of Unified Theory of Acceptance and Use of Technology and Diffusion of Innovation, Evidence from Tehran, Iran. Int. J. Hum.–Comput. Interact. 2023, 39, 2663–2672. [Google Scholar] [CrossRef] [Scilit]
- Iranmanesh, M.; Ghobakhloo, M.; Foroughi, B.; Nilashi, M.; Yadegaridehkordi, E. Factors influencing attitude and intention to use autonomous vehicles in Vietnam: Findings from PLS-SEM and ANFIS. Inf. Technol. People 2023. [Google Scholar] [CrossRef] [Scilit]
- Saris, W.E.; Gallhofer, I.N. Design, Evaluation, and Analysis of Questionnaires for Survey Research; Wiley: Hoboken, NJ, USA, 2007. [Google Scholar] [CrossRef] [Scilit]
- Borelli, M. Design, Evaluation, and Analysis of Questionnaires for Survey Research. J. Workplace Learn. 2008, 20, 453–456. [Google Scholar] [CrossRef] [Scilit]
- Fornell, C.; Larcker, D.F. Structural Equation Models with Unobservable Variables and Measurement Error: Algebra and Statistics. J. Mark. Res. 1981, 18, 382–388. [Google Scholar] [CrossRef] [Scilit]
- Hair, J. Multivariate Data Analysis; Kennesaw State University: Kennesaw, GA, USA, 2009; Available online: https://digitalcommons.kennesaw.edu/facpubs/2925 (accessed on 20 December 2021).
- Fornell, C.; Larcker, D.F. Evaluating Structural Equation Models with Unobservable Variables and Measurement Error. J. Mark. Res. 1981, 18, 39–50. [Google Scholar] [CrossRef] [Scilit]
- Leguina, A. A primer on partial least squares structural equation modeling (PLS-SEM). Int. J. Res. Method Educ. 2015, 38, 220–221. [Google Scholar] [CrossRef] [Scilit]
- Hair, J.F.; Sarstedt, M.; Ringle, C.M.; Gudergan, S.P. Advanced Issues in Partial Least Squares Structural Equation Modeling (PLS-SEM); Sage Publications Inc.: Thousand Oaks, CA, USA, 2021; Volume 4. [Google Scholar]
- Wold, H. Model Construction and Evaluation When Theoretical Knowledge Is Scarce. Theory and Application of Partial Least Squares. Eval. Econom. Models 1980, 15, 101–115. [Google Scholar]
- Rezaei, A.; Cao, M.; Liu, Q.; De Vos, J. Synthesising the Existing Literature on the Market Acceptance of Autonomous Vehicles and the External Underlying Factors. J. Adv. Transp. 2023, 2023, 6065060. [Google Scholar] [CrossRef] [Scilit]
- Hu, L.T.; Bentler, P.M. Cutoff criteria for fit indexes in covariance structure analysis: Conventional criteria versus new alternatives. Struct Equ. Model. 1999, 6, 1–55. [Google Scholar] [CrossRef] [Scilit]
- Preacher, K.J.; Hayes, A.F. Asymptotic and resampling strategies for assessing and comparing indirect effects in multiple mediator models. Behav. Res. Methods 2008, 40, 879–891. [Google Scholar] [CrossRef] [Scilit]
- Sisiopiku, V.P.; Yang, W.; Mason, J.; McKinney, B.; Hwangbo, S.W.; Classen, S. Examining the Impact of Age and Gender on Drivers’ Perceptions Toward Autonomous Vehicles Before and after Autonomous Driving Simulator Exposure. Int. J. Transp. Dev. Integr. 2023, 7, 85–93. [Google Scholar] [CrossRef] [Scilit]
- Zefreh, M.M.; Edries, B.; Esztergár-Kiss, D.; Torok, A. Intention to use private autonomous vehicles in developed and developing countries: What are the differences among the influential factors, mediators, and moderators? Travel Behav. Soc. 2023, 32, 100592. [Google Scholar] [CrossRef] [Scilit]
- Schepis, D.; Purchase, S.; Olaru, D.; Smith, B.; Ellis, N. How governments influence autonomous vehicle (AV) innovation. Transp. Res. Part A Policy Pract. 2023, 178, 103874. [Google Scholar] [CrossRef] [Scilit]
- Chen, Y.; Shiwakoti, N.; Stasinopoulos, P.; Khan, S.K. State-of-the-Art of Factors Affecting the Adoption of Automated Vehicles. Sustainability 2022, 14, 6697. [Google Scholar] [CrossRef] [Scilit]
- Shahedi, A.; Dadashpour, I.; Rezaei, M. Barriers to the sustainable adoption of autonomous vehicles in developing countries: A multi-criteria decision-making approach. Heliyon 2023, 9, e15975. [Google Scholar] [CrossRef] [Scilit]
- Alhajyaseen, W.; Adnan, M.; Abuhejleh, A.; Onat, N.; Tarlochan, F. Travelers’ preferences regarding autonomous mobility in the State of Qatar. Pers. Ubiquitous Comput. 2021, 25, 141–149. [Google Scholar] [CrossRef] [Scilit]
- Duarte, F.; Ratti, C. The Impact of Autonomous Vehicles on Cities: A Review. J. Urban Technol. 2018, 25, 3–18. [Google Scholar] [CrossRef] [Scilit]
- Raj, A.; Kumar, J.A.; Bansal, P. A multicriteria decision making approach to study barriers to the adoption of autonomous vehicles. Transp. Res. Part A Policy Pract. 2020, 133, 122–137. [Google Scholar] [CrossRef] [Scilit]
- Sadaf, M.; Iqbal, Z.; Javed, A.R.; Saba, I.; Krichen, M.; Majeed, S.; Raza, A. Connected and Automated Vehicles: Infrastructure, Applications, Security, Critical Challenges, and Future Aspects. Technologies 2023, 11, 117. [Google Scholar] [CrossRef] [Scilit]
- Nastjuk, I.; Herrenkind, B.; Marrone, M.; Brendel, A.B.; Kolbe, L.M. What drives the acceptance of autonomous driving? An investigation of acceptance factors from an end-user’s perspective. Technol. Forecast. Soc. Change 2020, 161, 120319. [Google Scholar] [CrossRef] [Scilit]

Disclaimer/Publisher’s Note: The statements, opinions and data contained in all publications are solely those of the individual author(s) and contributor(s) and not of MDPI and/or the editor(s). MDPI and/or the editor(s) disclaim responsibility for any injury to people or property resulting from any ideas, methods, instructions or products referred to in the content. |
© 2024 by the authors. Licensee MDPI, Basel, Switzerland. This article is an open access article distributed under the terms and conditions of the Creative Commons Attribution (CC BY) license (https://creativecommons.org/licenses/by/4.0/).