Article

Using an Integrated Participatory Modeling Approach to Assess Water Management Options and Support Community Conversations on Maui

1
Millennium Institute, 2111 Wilson Blvd, Suite 700, Arlington, VA 22201, USA
2
Maui Economic Development Board, 1305 N. Holopono St, Kihei, HI 96753, USA
3
McGill University, 845 Sherbrooke St. W. Montreal, Quebec, H3A 2T5, Canada
*
Author to whom correspondence should be addressed.
Sustainability 2009, 1(4), 1331-1348; https://doi.org/10.3390/su1041331
Submission received: 20 October 2009 / Accepted: 11 December 2009 / Published: 15 December 2009
(This article belongs to the Special Issue Sustainable Water Management)

Abstract

:
The purpose of this study is to provide an integrated analysis of water distribution on Maui and the cross-sectoral impacts of policies and regulations aimed at rejuvenating and sustaining the deep-rooted culture on the island. Since the water diversion system was implemented in 1876 on the island of Maui, there has been contention among local interest groups over the right way to manage and allocate this precious resource. There is also concern over the availability of the precious resource in the long term, as the demand for water is expected to exceed the potential supply of water on Maui by 2020. This paper analyzes various long run scenarios of policy options presently being discussed on Maui. By collaborating with local experts, business leaders, and community members, to develop a tool that facilitates policy formulation and evaluation, informed decisions can then be made by the local community to ensure sustainable development.

1. Introduction

Founded in 1905, Maui County consists of the islands of Maui, Kahoolawe, Lanai, Molokai and Molokini. With a total de facto population of 185,000 people in 2008 [1], the County of Maui, the third largest in the State of Hawaii, is projected to accommodate over 260,000 people by 2030 [2]. Among others, concerns have been expressed about the availability of water and energy to sustain such growth, as well as about the vulnerability of Maui’s economy to energy and food imports and price volatility.
Historically, the traditional economy of Maui was based on agriculture, which provided the original inhabitants the necessary food staples—but with the arrival of American and European immigrants in the late 18th century, the sugarcane and pineapple industries were born and agriculture became an integral element of Maui’s economy, occupying more than half of the land within the County [2]. Acting as a driving force for local development over the last century, the agriculture sector that Maui once had is much diminished. With the total value of crop sales in 2004 approaching $125 million and providing 1,850 jobs, agriculture only accounts for less than 2% of the total gross domestic product of the County [1]. Following the decline in the agriculture sector, tourism became the fundamental driver of the county’s economy, accounting for 40% of economic activity in Maui County today [2]. With brief interruptions, Maui County’s tourism industry has shown moderate growth over the years at about 1.5% annually, with average daily visitors amounting to approximately 52,000 people [3].
High population and economic growth on Maui, coupled with declining precipitation, have led to an increase in overall demand for water. Being the most fundamental aspect of all biological systems, water plays an integral role in every ecological process and has become a contentious issue on Maui. Due to a steep geological gradient present on the island, parts of Maui are endowed with large amounts of water, whereas other areas suffer from low precipitation and long periods of drought conditions [4]. In fact, being the second largest island in the Hawaiian Archipelago, two large shield volcanoes, the West Maui Volcano (Mauna Kahalawai or West Maui Mountains) and the East Maui Volcano (Haleakalā), dominate the landscape and heavily influence the local climate [5]. More specifically, due to the orographic lift that occurs when an air mass is forced from a low elevation at the base of the volcanoes to a high elevation at the summit, a rain shadow is created and drastic changes in climate occur. With moisture brought in by the prevailing Trade Winds from the northeast, the windward side of the island receives a significant amount of rainfall, whereas the leeward side experiences mostly arid conditions [4].
Connected by a 5-mile wide isthmus covered in terrestrial and marine sedimentary deposits, numerous streams and river systems have been carved into these geological giants over time [5]. Included in these streams are the Waikapū, ‘Īao, Kahakuloa, Honokōhau, and the Waihe‘e Rivers. Originating near the summit of Mauna Kahalawai, these rivers are fed by a plethora of rainfall received each year, averaging almost 350 in./yr (or 8,890 mm/yr). Conversely, the desiccated area surrounding Haleakalä experiences far lower precipitation, which accounts for the staggering gradients present on the island. With mean annual rainfall generally less than 100 in./yr (or 2,500 mm), parts of the island often enter into prolonged drought conditions during the dry seasons [6].
To allow for the development of the sugarcane industry throughout the island, complex diversion systems were put in place to redirect water from the rainy windward slopes of Haleakalä to the dry sugarcane fields in Central Maui. In 1876, Samuel Alexander and H.P Baldwin, the founders of Alexander & Baldwin, were partners in an expanding, but struggling sugar company. To solve the severe water problem that threatened to put them out of business, the company built a 17-mile irrigation system that diverted up to 60 Mgal/day [7]. Along with Alexander & Baldwin, other companies such as HC&S, founded in 1882, began developing ditch, tunnel and reservoir systems to redirect water in order to satisfy a growing demand on the leeward side of the island [8]. Today, almost 274 Mgal/day of surface water is diverted each year, with almost half of that water originating from the eastern part of the island [9].
The ‘Īao Aquifer System is the principal source of domestic water supply on Maui [9]. Withdrawals from this aquifer system totaled almost 18.94 million gallons per day (Mgal/day) during 2005; a significant increase from the 10 Mgal/day extracted during 1970 [10]. The Hawaii State Commission on Water Resource Management (CWRM) has determined the sustainable yield for this aquifer is 20 Mgal/day, which means it is operating at 95% of its sustainable yield [11]. The CWRM also indicates that the Kahului Aquifer System within the Central Aquifer System is being over-pumped by over 2,500%; along with the entire Central Aquifer System currently operating 168% over its sustainable yield [11].
With diminishing levels of supply and increased economic growth, future projections for this precious resource show decreasing levels of supply and increased levels of demand, where demand could exceed supply before 2020 [2,3,11,12]. The total available supply of water for the Central Maui System is estimated to be around 25 Mgal/day whereas the average daily demand for the system in 2005 was 21.39 Mgal/day. With projections indicating that demand for resources from the Central Maui System will reach 34.11 Mgal/day–9.11 Mgal/day over the current supply, by 2030, concern over the status of the future availability of water is mounting [2].
The water system on Maui also holds a strong cultural relevance and value to the local population. The practice of cultivating taro—a traditional staple in the indigenous diet and a culturally significant crop, relies heavily on the availability of fresh water for optimal growing conditions [13]. Growing taro is an integral element to sustaining Hawaiian traditions and it holds cultural significance and value to its people. As water resources are being diverted from the streams that provide water for taro cultivation, less water is available for taro production, and the crops are more susceptible to malnutrition, disease and other ailments. The local (mostly Native Hawaiian) community is taking a stance on these issues and taking legal steps to restore the natural levels of the streams to rejuvenate and sustain the local culture and traditions. In addition, the river system provides a home and habitat for a diverse range of species—such as native freshwater shrimp, small fish, mollusks and insects—and is part of a delicate balance of the unique and fragile ecosystem that has existed for thousands of years.
In an effort to inform decision-making on water resources and to plan for sustainable growth on the island, the Millennium Institute (MI) entered into a cooperative agreement with the Maui Economic Development Board (MEDB) to improve overall understanding of the water system on Maui and to provide the community with a tool to inform decision-making and support policy formulation and evaluation.
This paper provides a general overview of how an integrated approach utilizing Millennium Institute’s Primary Country Model [14], renamed Primary Community Model (PCM) for this exercise, and fully customized to Maui, was applied to a system-wide analysis of water resources in Maui County. The intent of the analysis was to demonstrate the efficacy of implementing an integrated approach to modeling—utilizing PCM, to provide useful decision support services for water allocation and preservation employing “a broader approach to the consequences than implied by narrow output measures” [15].

2. Literature Review

A variety of models, each with their own unique attributes, investigate integrated approaches towards understanding both the biophysical and socio-economic impacts of water allocation [16]. In most cases, optimization models are used to assess water management issues and provide policy insights. These models, which are normative and prescriptive by nature, are used to provide a statement of the most favorable way to achieve a goal [17], that is, they provide a snapshot of what should be done today, normally in the most economical way, to optimize the current situation to reach a future goal. Optimization does not clearly indicate a strategy for action and does not provide insights on when the goal could be reached.
More specifically, Dinar et al. and Griffin et al. are examples of integrated optimization models applied to water management [18,19]. Dinar et al. attempt to estimate agricultural water demand and supply as a series of optimization functions, whereas Griffin et al. assign a value to in-stream flows and then develops optimization algorithms by varying economic policies and water consumption to assess the impact on water markets. Both of these approaches attempt to solve the water allocation problem from the demand component of the integrated model [18].
These models provide information on what to do to make the best of a given situation, but do not generate insights on what might happen in such a situation or what the impact of certain actions may be [21] outside of the water sector. The optimization models analyzed in this study can be best described as vertically integrated, representing detailed complexity coherently and in depth. They analyze the chain of physical steps for water from source to end use within a system and investigate the best ways to bring water to its customers, minimizing the cost of supply. As effective as these approaches may be, they are limited in their representation of the interaction between biophysical and socio-economic components within a given system.
To move from this state of vertical integration towards a more horizontal, flexible and comprehensive method of analysis, dynamic complexity must be accounted for. An example of this is the AQUA model presented by Hoekstra—the model that this study uses as its foundation for the water supply sector. Developed as a generic framework to be applied at different spatial scale levels, the aim of the model is to include as many of the interrelationships and feedback mechanisms between water, the environment and human beings as possible [21]. By employing a Pressure-State-Impact-Response (PSIR) ordering mechanism, a variety of unique interactions and relationships can be expressed within the model.
However, the AQUA model is narrow in scope, lacking connections to the energy sector, society as a whole, economic activity and the surrounding environment. Similar problems characterize System Dynamics (SD) model, that despite being dynamic are often too general or too narrow for being particularly relevant to this analysis (for an extensive review of the evolution of SD water-focused models see Winz and Brierley [22]). One of the major innovations introduced by the Millennium Institute and the Focus Maui Nui report prepared by MEDB [23], is to include the context of Maui County (i.e., social, economic and environmental factors) into the integrated analysis of water. MI and MEDB therefore collaborated to create a comprehensive quantitative simulation model that can not only provide insights on water availability and allocation, but also contribute to the analysis of the interrelationships it has with other sectors [20].
In this research work, by creating a customized water sector for Maui; developed in collaboration with a group of local water experts, many characteristics of real systems, such as feedback loops, non-linearity and delays are incorporated in the water analysis that is carried out. These are based on the identification of the casual relationships that underlie the system analyzed—both within the water sector and across social, economic and environmental spheres. The modeling exercise focuses on the longer term impacts of policy choices and presents an aggregated picture of the social, economic and environmental development of Maui, filling a gap represented by a variety of very detailed sectoral studies (e.g., USGS, Water Resource Protection Plan, etc.).
Moreover, the model is also developed at the community level as well. Through collaborations with local experts, government officials, community members and businesses, the model is modified and customized the meet the diverse needs and specifications of the community at large.

3. Research Approach

The integrated analysis of the water sector in Maui County involved developing social, economic and environmental profiles of the islands, including the collection and processing of historical data, and the construction of a PCM for Maui, supported by open sessions during which experts and community members contributed to the building and customization of the model. The main steps are briefly described below.

3.1. Group Modeling and Data Collection

This step involved extensive gathering and analysis of statistical data (from 1990 to 2008 and projections) and information from multiple sources, including; Maui County Data Book (MCDB), Hawaii State Data Book (HSDB), Native Hawaiian Data Books (OHA), Energy Information Administration (EIA), District Water Services (DWS), Center for Water Resource Management (CWRR), Maui County Water Use and Development Plan, Department of Business, Economic Development and Tourism (DBEDT), State Department of Health (DoH), Maui County General Plan 2030, Maui Island Plan, and U.S Census reports.
Along with the detailed statistics collected from these sources, a significant portion of data pertaining to the water sector and technical information on the workings of specific systems were collected from a variety of USGS studies focusing on Maui and various aquifer systems within the region [9]. Many of these studies were very detailed reports outlining the peculiar interactions of selected water systems on Maui. Extracting and aggregating the relevant outcomes of these studies, and implementing them into a coherent and integrated model highlights one of the contributions brought by this study. This enables organizations such as MEDB to present scientific conclusions to the community in an understandable way to facilitate community conversations and to assist policy formulation and evaluation.
To promote the community aspect of this process, a group-modeling session was held on Maui that was attended by local stakeholders representing farmers, landowners, and other concerned citizens. Through this process, local needs and concerns were explored and included in the subsystem diagram of the water model that was jointly developed during group sessions, to then be incorporated into the actual model at a later stage. Group modeling session included the creation of a Causal Loop Diagram (CLD) that would represent the water sector (both demand and supply) of Maui County. Further the main drivers of demand and supply, including possible policies and actions were discussed and evaluated with local experts to better evaluate the role and relevance of both local cultural and structural constraints.
Figure 1. Causal Loop Diagram developed with the working group during group modeling sessions, main drivers of water demand and supply on Maui.
Sustainability 01 01331 g001

3.2. Model Development

The project employed a customized version of the PCM model developed by the Millennium Institute. System Dynamics was used as the foundation for the customization of the model, to enable the examination of complex, dynamic interrelationships between water and other social, economic and environmental sectors. Specifically, a detailed model of the water sector was constructed, to represent water demand and supply in Maui.
Scenarios relevant to the peculiarities of Maui are determined and processed to develop an understanding of the impacts of different policies and regulations being discussed within the community. While accounting for a decreasing trend in precipitation, as well as a reduction in the annual number of visitors, the model analyzes the impacts of instream flow regulations, increases in water efficiency and investing in increasing the supply of water (e.g., desalination).

4. Model Description

The PCM is constructed on a software platform that allows for the representation and interaction of a complex network of feedback loops, which underlie the mechanisms common to developing and industrialized countries [14]. Its structure is base don 20 years of research at the Millennium Institute and over 40 country applications of integrated national development models [20], such as PCM. The Maui model is organized in spheres, sectors and modules and was customized following a modular approach. PCM-Maui is largely focused on water and a more detailed description of non-water sectors is available in other publications (see for instance Bassi, 2009 [24]). Table 1 shows all of its spheres and sectors (with sectors being the building blocks of the higher level aggregation represented by the spheres).
Table 1. Modules, Sectors and Spheres of PCM-Maui Model.
Social SpherePopulation
Economic SphereProduction
Households Accounts
Government Accounts
Banks
Environmental SphereLand allocation
Water demand and supply
Energy demand and supply
Air emissions
The content of individual modules is based upon accepted peer reviewed research within its designated field and targeted to specific governing dynamics isolated by the research inquiry. Also, all the inputs received during the working group meetings and group modeling sessions were directly incorporated in the model. The distinctive characteristic of PCM is the manner in which various determinants are linked together forming a complex link of feedback loops in which ad hoc research and/or policies can then be analyzed and weighted as driving or limiting the county’s development agenda.
The core of the Economy sphere of PCM-Maui is represented by GDP, as one aggregated item, which is characterized by a Cobb-Douglas production function with inputs of labor and capital, visitor expenditure and total factor productivity, which includes energy prices. A Social Accounting Matrix (SAM) [25] is used to elaborate the economic flows between the main actors in the economy: government, households, producers and banks. The government sector collects taxes based on economic activity and allocates expenditures by major category, which then impacts the delivery of public services, subject to budget balance constraints. County budget categories are employed, and key macro balances are incorporated into the model.
The Social sphere contains detailed population dynamics by sex and one-year age cohort. These sectors take into account, for example, the interactions of family planning, health care and income on fertility and life expectancy, which in turn determines population growth. Population determines the labor force, which shapes employment. Employment and labor productivity affect the levels of production from a given capital stock.
The Environment sphere tracks land allocation, water and energy demand and supply, in addition to pollution (i.e., emissions and water pollution due to desalination). It estimates the consumption of natural resources—both renewable and non-renewable—and can estimate the impact of the depletion of these resources on production and prices. Particular attention is devoted to water supply, where the unique peculiarities of Maui’s geographical area and hydrological systems are incorporated into the analysis.
More specifically, the supply of water on Maui is largely influenced by rainfall. Precipitation impacts watershed integrity, which is responsible for the levels of surface and ground water in the county. Further, groundwater (GW) accumulates the flow of rain infiltration (GWR)—which in turn is determined by the geological structure of the land, the flow of groundwater production (GWP) and natural loss (GWL):
D(GW)/dt = GWR(t) – GWP(t) – GWL(t)
More specifically, GWR is calculated using the total amount of water internally produced—which accounts for precipitation, multiplied by the fraction of rain evaporating immediately, and fog-, multiplied by the ratio of ground water recharge relative to precipitation. This methodology follows the analysis and data published by USGS [9]. GWP instead is calculated by multiplying GWR by the observed natural outflow share of water that infiltrates in groundwater reservoirs. This share is constant and exogenous. Finally, GWL is calculated as the minimum between the maximum sustainable groundwater production and the difference between water demand and supply from surface water and desalination (in other words, groundwater production is the residual factor to satisfy demand, with the limitation of avoiding overproduction levels that would compromise the integrity of the reservoirs—a key concern for the local population).
Surface water (SW), which represents the stock of water above the ground, accumulates the flows of ground water emergence and recharge from rain (SWI)—accounting for evaporation—as well as production (SWP), diversions for agricultural irrigation (SWAI), and the discharge in the ocean (SWR):
d(SW)/dt = SWI(t) – SWP(t) – SWAI(t) – SWR(t)
Surface and ground water flow through different channels, such as diversions, wells and tunnels, reservoirs and other forms of storage, which in turn define the actual available supply of water. Water from catchment systems, desalination and recycling plants also add to the total supply of water on Maui.
The demand for water (WD) comes from a variety of sectors, including, among others, the commercial and industrial (WDP), residential (WDR), religious institutions (WDRI) and agricultural ones (WDAG). It was discussed by some stakeholders that the amount of water that would preserve the local ecosystem be considered as demand, given its relevance. Ecosystem demand includes, but it is not limited to, the government regulated in-stream flow standards and the amount of water needed to preserve cultural traditions of the native farmers (e.g., taro and shrimp farming). Each sector has specific drivers that define the demand for water. For instance, residential water demand is mostly driven by population (POP) and per capita water use (WDPC), precipitation (P) and water efficiency use (WE); agriculture water demand is influenced by the amount of cultivated, irrigated land, as well as rainfall, that also influences overall outdoor water use:
WD = WDAG(t) – WDP(t) + WDR(t) + WDRI(t)
WDR =((POP(t) * WDPC(t)) / (P(t)/ P(t0))δ(P) ) / (WE(t)/ WE(t0))
The main drivers of demand within the system analyzed are GDP (or disposable income), combined with de facto population and precipitation.

5. Simulation Results

The PCM-Maui model projects the social, economic and environmental development of Maui County starting from 1990 until 2030. The structure of the model, based on observed causal relations and correlations, and accounting for feedback loops, delays and nonlinearities, is compared to historical data from 1990 until 2008, to then project a baseline and an alternative scenario until 2030.

5.1. Baseline Scenario-Business as Usual

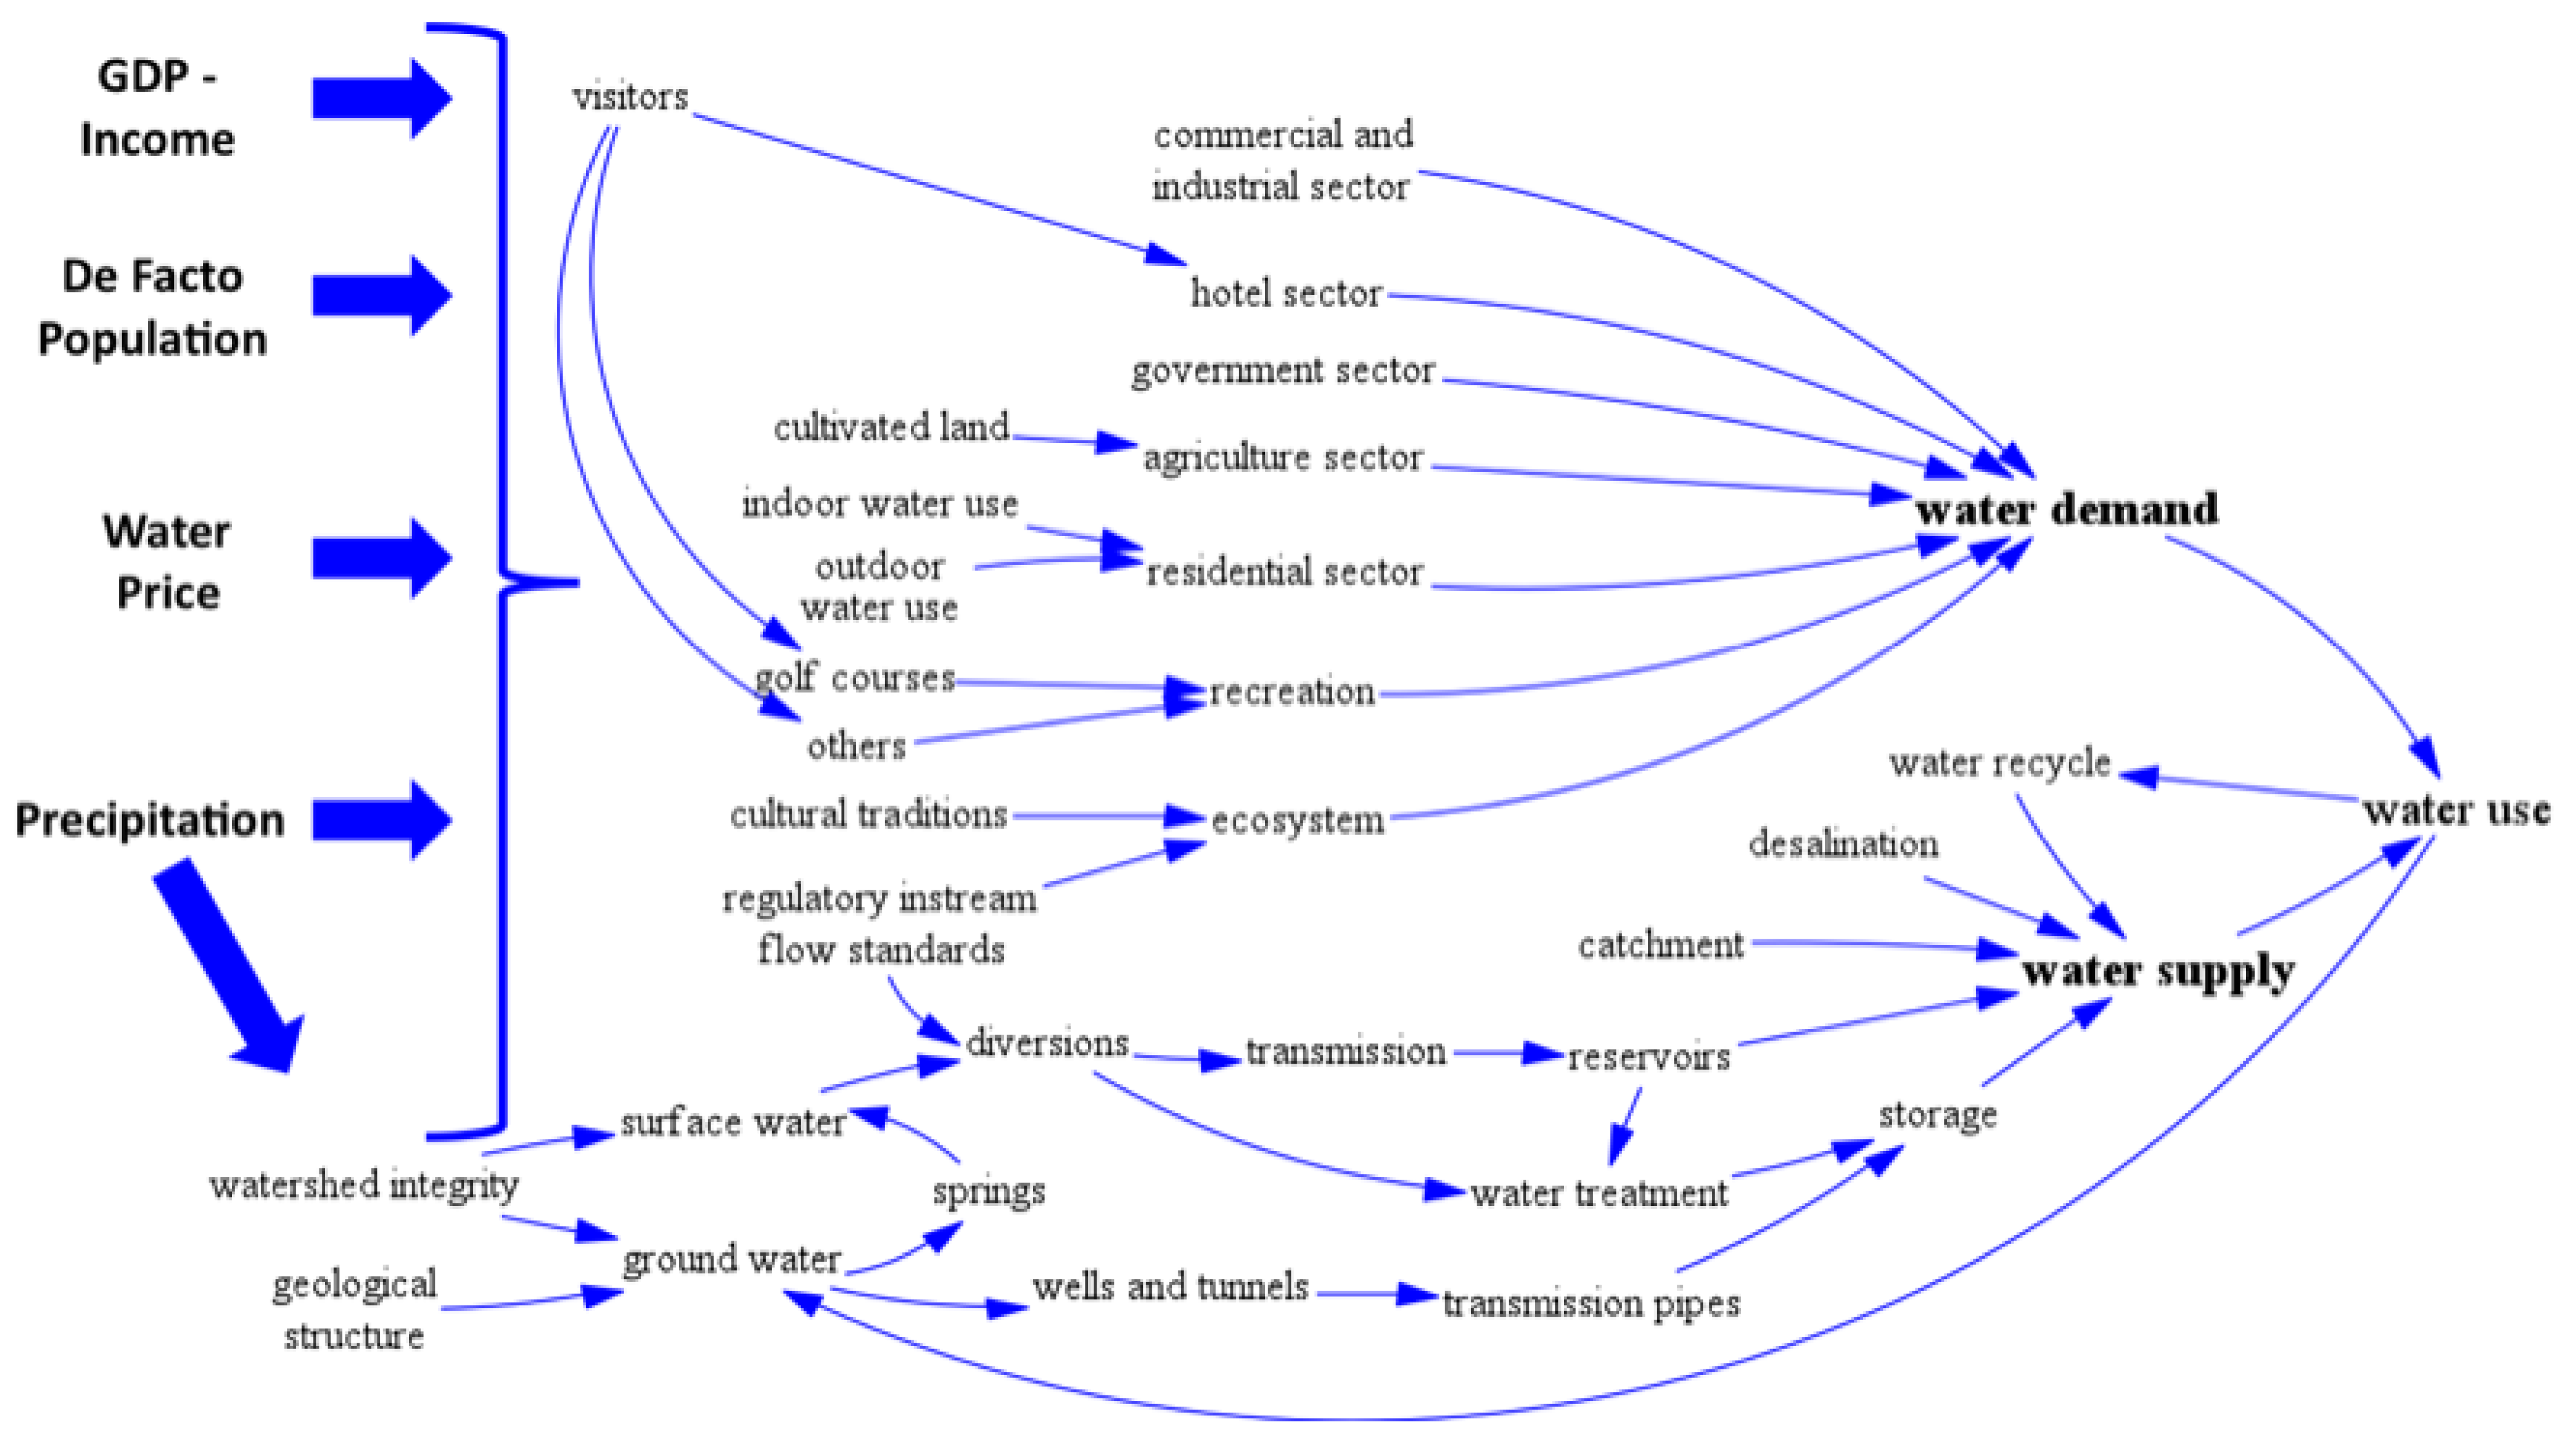
The baseline scenario, business as usual (BAU) assumes no changes in any of the current policies and regulations relating to water, and it mostly focuses on the future behavior of two key drivers of water demand and supply in Maui County, precipitation and visitors.
More specifically, the former is a proxy for the impact of global climate change on Maui and the effect it has on freshwater resources. Although the literature suggests that current precipitation models are inadequate at providing future precipitation levels [11], a 2004 USGS study has shown that from 1913 to 2002, there was a downward trend in annual rainfall over much of the area of Maui [26]. Since water resources are exclusively dependent on rainfall on Maui, any changes in the rainfall patterns and subsequent frequency and duration of droughts can affect both ground water and surface water supplies [11], through an increase in stream flows and groundwater recharge. Further, there is a significant correlation between precipitation levels and water demand on Maui. Because long-term trends in rainfall characteristics are difficult to identify, an exponential decline is assumed, and predictions of precipitation levels from 2010 to 2030 can be derived. At 2009 total precipitation in the County is at 2.49 trillion gallons/yr, approximately 3,103 mm/yr, decreasing towards 1.31 trillion gallons/yr by 2030, or 1,614 mm/yr.
The second assumption used to simulate the BAU case is the number of visitors reaching Maui County every year. As mentioned earlier, the economy of Maui is highly dependent on visitor numbers and tourism within the region. Accounting for almost 40% of economic activity on the island [2], changes in visitor levels have a strong impact on gross domestic product and the demand for water and other resources. Due to the economic crisis of 2008, the number of visitors to the region has declined considerably—by 18.45% over the first 5 months of 2009 [27]. Other sources, such as the MCDB, project future levels of annual visitors based on data from 2006, but fail to incorporate the economic crisis, resulting in overoptimistic predictions [1]. To account for the impact of the economic and financial crisis on Maui, the actual drop in annual visitors from 2007 to 2008, a loss of 374,300 annual visitors is inputted into the model, and the same growth rate projected by MCBD, 33% by 2030, is assumed.
Concerning the results of the simulation of the baseline scenario, social, economic and environmental indicators were selected to provide an overview of the projected development of Maui County. Table 2 highlights the most important results of the baseline and alternative scenarios for selected years.
Table 2. Summary of findings of baseline and alternative scenario 1.
VariableUnit19902000201020202030
De Facto Populationpeople134,564169,405194,263226,074259,976
Agriculture Landacre406,248404,049403,133401,811400,518
Settlement Landacre25,00027,38828,31529,75230,976
Surface Water Productionbillion gallons/year4.543.842.762.181.61
GDPbillion USD'003.644.495.176.247.02
3.644.495.176.257.03
PC disposable IncomeUSD'00/people24,82825,61225,70825,31424,944
24,82825,61225,70825,32924,958
Total Employmentpeople58,44069,85681,23489,39493,031
58,44069,85681,23489,50293,117
Annual Visitorsmillion people/year2.392.342.302.713.12
2.392.342.302.713.12
Water Demandbillion gallons/year9.5111.5913.7016.2619.42
9.5111.5913.5714.7316.20
Groundwater Productionbillion gallons/year4.967.7510.9414.0715.25
4.967.7510.816.338.73
Production from Desalinationbillion gallons/year00000
0006.215.86
Relative Groundwater Stock% relative to 199010096887866
10096888580
Water Runoffbillion gallons/year344295232199166
344295251254221
Energy Demandbillion BTU/year18,88829,76340,36349,46763,850
18,88829,76340,36349,50563,887
Agriculture Revenuemillion USD'00/year2131141279860
2131141248859
Agriculture Employmentpeople2,6042,0841,6281,255767
2,6042,0841,5871,132760
1 Clear region indicates baseline scenario, shaded region indicates alternative scenario.
Concerning the social sector, total resident population is projected to increase to 195,811 people in 2030, 36% above its 2008 level. Its age distribution shows a significant reduction of population between the age 15 to 19 and the age 20 to 24 cohorts—with the diminution amplified over time. There then seems to be an inflow at later ages, indicating the possible return of these students, potentially to pursue a career on Maui, or the inflow of population from the US mainland and other countries.
With economic activity in 2007 totaling $5.53 billion (in current USD), the decline in visitors is projected to cause GDP to fall to $5.16 billion USD in 2008, a 6.7% reduction. GDP is projected to recover by 2010, after a further decline in 2009, and then follow an average growth rate of approximately 1.7% per year.
Household revenue follows a similar trend, with a negative shock occurring with the 2008 economic crisis, and then steady growth afterwards. With a drop of $391 million USD, household revenue rises to $6.95 billion USD in 2010 (nominal), increases to $9.75 billion USD in 2020, and reaches $13.33 billion USD at 2030.
Conversely, per capita real disposable income tends to stay about constant over time. With a sudden drop in 2008, per capita real disposable income drops $2,065 (chained to 2000 USD) from 2007 to $24,800 ‘00USD in 2008. Disposable income then slightly increases over time to $24,944 ‘00USD in 2030.
Total employment appears to be following a decreasing exponential trend, as persons employed increases from 81,200 in 2010, to 89,300 in 2020 and leveling off to 93,000 people by 2030. The decreasing trend occurs due to the limiting factors within the economy of Maui, such as land available for agriculture, lower growth within tourism and capital available for investment, as well as for a higher reliance on technology and the services sector.
The amount of agriculture land is projected to slightly decrease over the simulation period. Historically, 406,248 acres of land was available for agriculture, whereas 404,049 acres were allocated to agriculture in 2000. Future projections indicate that cultivated land will be 400,518 by 2030. Differently, cultivated land, a subset of agriculture land, halved between 1990 and 2008, probably due to water stress (decreasing precipitation), declining profitability and higher competition—from abroad—in the agriculture business.
As discussed earlier, the reduction in precipitation due to climate change has a direct impact on water demand and supply. As agricultural, commercial and residential sectors develop and continue to use water, water demand is projected to increase as water available from precipitation declines. With a slight reduction in demand due to the recession of economic activity in 2008, demand grows to 13.7 billion gallons/yr in 2010, 16.3 billion gallons/yr in 2020 and 19.4 billion gallons/yr in 2030.
With reduced precipitation feeding groundwater and surface water levels, the total supply of water on Maui is reduced over time, as depicted by the projection of the amount of water in aquifers, relative to its 1990 level (see Table 2).
With the projected growing demand for water, supplies of water are projected to eventually reach a maximum level and begin to decline as stocks are eventually depleted in the 2 main aquifers currently used for groundwater production. This is consistent with a variety of studies that project demand to surpass supply by 2020 [2,3,11,12]. Although, due to the fact that these studies do not incorporate recent changes in economic activity, such as the reduction in visitors caused by the 2008 economic crisis, the point at which demand exceeds supply at 2020 seems prudent. By incorporating the reduction in visitors and the consequent reduction in gross domestic product, our model projects that the supply of water will reach a maximum at around 2024 and begin to level off as the main aquifers begin to be chronically depleted below their sustainable level.
The baseline scenario assumes that no investment will be allocated to the exploitation of aquifers in the Hana region or in other areas where the capital cost of such a project would be overwhelming and restrictive. With 13.7 billion gallons/yr in 2010, the total supply of water reaches a maximum at 17.2 billion gallons/yr in 2024, and then decreases to 16.8 billion gallons/yr in 2030. The maximum limit at which these aquifers can be exploited has been assumed to be the sustainable yield indicated by the Center for Water Resource Management, which is about 40% above current levels. It is assumed that once reaching this limit, aquifers will begin to degrade, the system in which they are contained will break down and the level at which they can be pumped will diminish [26].

5.2. Alternative Scenario—Implementing Policies and Regulations

After having investigated the outcome of the baseline scenario, a variety of policies and regulations are incorporated to analyze the change and impact on future projections. There are three policies that are simultaneously implemented within this scenario.
The first is the instream flow regulations that have been widely discussed within the County of Maui, and have become a contentious issue. The instream flow standards recommended by the Commission on Water Resources Management include the streams such as Honopou being capped at 1.79 Mgal/day, Hanehoi at 1.72 Mgal/day, Piinaau at 3.56 Mgal/day, Waiokamilo at 3.17 Mgal/day and Wailuanui at 1.97 Mgal/day. These are just 5 streams that have been selected within a 27-stream system, which is part of a network totaling over 100 streams. For the purposes of the simulation, the average value over the 5 streams was calculated and knowing that more streams will be regulated over time, it is assumed that the amount of streams being imposed with these standards will be 60 streams.
The second policy implemented into the analysis is the increase of water use efficiency (or voluntary conservation) over time. As time progresses, new practices emerge and technology processes improve to allow for the more efficient distribution and consumption of water, as well as an increase in conservation of the resource. With diversion infrastructure having been implemented over 100 years ago, there is a considerable amount of loss within the system, as well as inefficiencies throughout the process. Moreover, it is reasonable to assume that technologies or practices will be implemented that reduces the necessity for water at the residential, commercial and agricultural levels over time. Within this simulation, a 20% increase in water efficiency by 2030 is incorporated into the model.
The last policy that is measured within the model is the scenario of investing in and developing a desalination plant on Maui. An option that is being considered on Maui, a desalination plant would allow for the increase of the water supply by treating brackish water through reverse osmosis. For the purposes of the model, it is assumed that a plant that can bring the levels of the Central Aquifer System to its sustainable yield. As mentioned earlier, the Aquifer is currently being pumped at 168% above its sustainable yield, which translates into 18 Mgal/day above its threshold. Currently, a desalination plant on Maui with an expandable capacity of 5 Mgal/day of useful water is being discussed, with capital costs ranging around $50 million USD [28,29]. Assuming that the excess 18 Mgal/day is satisfied with these plants, a $180 million USD investment is required in 2010 to increase water supply by 18 Mgal/day by 2012. It is assumed that it is a one-time investment, requiring two years to reach full capacity and having a capital lifetime of 30 years.
When running the simulation, the first variable to analyze is the effect these policies have on the demand of water. Within this scenario, the demand for water decreases from the baseline case. Due to the increase in efficiency, less water is demanded for the same rate of use. With a 20% increase in efficiency by 2030, there is a 5.3% drop in demand in 2015, a 9.4% reduction in 2020 and a 16.5% decrease—16.2 billion gallons/yr vs. 19.4 billion gallons/yr, by 2030.
Water supply in the alternative scenario will be mostly attained from desalination and groundwater use. Groundwater production, as a share of total supply, moves from 80% in 2010 in the BAU, to 35% in 2012 thanks to the investment in the desalination plant. Due to increasing water demand over time, groundwater production grows back to 54% by 2030. Desalination water production is able to satisfy about 45% of water demand in 2012 (74% of residential use), with the remaining 20% being produced from surface water. The figures above refer to the total supply of water satisfying demand from the residential, commercial, industrial, religious and agriculture sector, excluding the amount needed for irrigation, following the classification of the USGS study on groundwater availability, as well as the 2007 Water Use and Development Plan on Maui.
An interesting outcome of this scenario on water supply is the reduction of groundwater production below the maximum sustainable level of the aquifers currently being overproduced. As indicated within the baseline scenario, the supply of water is capped at the sustainable yield, and supply begins to diminish after 2024, once the maximum level is reached. With this investment to increase the supply of water, that maximum is not reached within the simulation period, and remains within the sustainable yield throughout the simulation horizon.
As more of the fraction of groundwater production is satisfied by desalination, there is a cost associated with implementing such a decision. Firstly, there is an increase in electricity demand, caused by the estimated 0.015 kWh/gallon used by the desalination plant. Total electricity demand increases initially by 6.26 GWh/yr in 2011 as the desalination plant comes online, and peaks at 7.16% above the baseline scenario at 199.81 GWh/yr of energy demanded in 2012. Since the capital efficiency of the plant decreases over the 30 years, a slight reduction in energy consumption is experienced over time and there is only a 5.02% increase in energy demand compared to the baseline scenario in 2030. This translates into an increase of 20 MW of power generating capacity, which can cost between $10–40 million, depending the energy source considered.
Furthermore, there are additional costs associated with building a desalination plant to satisfy growing demand on Maui. When water is processed, liquid waste is created that contains toxic components. With high salt concentrations and other chemicals used within the process, it is estimated that for every gallon of useable water generated, 1.4 gallons of polluted water are created. This results in 8.7 billion gallons/yr of wastewater generated at the peak of production in 2013, and approximately 167 billion gallons of wastewater created throughout 2030.
Lastly, the initial cost of the desalination plant is a major factor to take into account. Currently, $180 million USD is approximately 40% of planned government expenditure (FY 2009–2010) and 15% of private investment in 2008, which shows the scale of undertaking such a project. If actions are taken to increase water supply to satisfy exceeding demand, funding for such developments must be readily available, which may not be the case.
The regulation of instream flow has become a contentious issue on Maui due to the diversion of natural stream systems for agriculture in the late 1800s, as mentioned earlier. By increasing the level of water within the streams, less water is being diverted for agriculture, thus decreasing the amount available for irrigation. By imposing this regulation, there will be a reduction of 2.5% of water allocated to irrigation compared to the baseline scenario in 2010. This will increase to 9.8% in 2020, and reach a 13.98% decline by 2030. Thus, 54.74 billion gallons/yr are diverted by 2030.
The impact on the agriculture sector is indicated by the change in revenue compared to the baseline scenario. In 2010, revenue is projected to decrease by 2.51%, or $3.2 million USD’00, due to lower water availability, and reaches a reduction of 9.87%, or $9.62 million USD’00 in 2020. By 2030, the reduction in revenue is only 0.93%, at $560,272 USD’00. It should be noted that due to the decreasing trend in precipitation over time, the agriculture sector if projected to feel pressure throughout the simulation period, and the implementation of instream flow regulations only marginally decrease projected revenues. The decreasing rate of revenue reduction within the trend can be associated with the increase in water efficiency use—which limits the impact of decreasing water availability, as the agriculture sector reduces water demand over time as technology and maintenance of the diversion system allows for the more efficient use of water.
When analyzing employment levels in the agriculture sector within the alternative scenario, jobs are strongly correlated and influenced by the availability of water. As water levels decrease, the amount of jobs lost in the sector increase. In 2010, 41 jobs are lost, a reduction of 2.5%. In 2020, 123 jobs are lost, at which point the decline reaches its maximum rate in 2023 and then begins to subside. This can be attributed to the increase in energy efficiency causing a reduction in water demand over time, which results in a smaller fraction of the baseline scenario lost; only 7 jobs lost in 2030, or a 0.98% reduction.
Of difficult analysis are the potential impacts of water availability on specific locations and companies, such as HC&S. In fact, it can be reasonably expected that the company would be forced to close operations before its water supply reduces to zero. In this respect, the identification of a tipping point would require more careful research but would certainly add value to the analysis, as HC&S employs about 800 people on Maui and largely contributes to the GDP generated by the agriculture sector.

6. Conclusions

The purpose of this study was to analyze the impact of water policies and interventions within the County of Maui. Due to a strong cultural relevance of the stream system and water availability within Maui, there have been extensive community discussions on regulating instream flows, as well as implementing new technologies that would help to satisfy increasing demand.
Being essential to the local economy, water is an integral part of all systems and processes—policies and regulations affecting the future availability of this resource have system-wide ramifications. To understand these impacts, an integrated approach was employed, utilizing System Dynamics to create a model that is highly customized to Maui County.
Furthermore, because water has very significant implications on the community at large, the management and regulation of this resource has become a contentious issue. Interest groups representing local industry, environmental groups and the general community have been promoting their respective ideals, while remaining uninformed of the larger—possibly unintended—consequences.
Thus, the goal of the model is to provide a foundation on which local stakeholders and the general community can both achieve a consensus on current issues, develop an understanding of the systemic consequences of their actions, and to test and evaluate proposed polices and regulations. By empowering both policymakers and the layperson with facts about the state of the situation, as well as identifying key cross-sectoral links—conversations and debates move from interest groups confronting one another (often discussing about the validity of one assumption versus another), to community dialogues that develop consensus on how to solve the problems and achieve a sustainable solution. This goal was achieved by (1) involving local experts and other interested parties in the modeling process, drawing the underlying structure of the water sectors of the model in CLDs; (2) incorporating this in the stock and flow diagram (PCM-Maui) and cross checking data availability and its consistency with all interested parties; (3) organizing working sessions to review the model and evaluate its results, simulating a variety of scenarios to accommodate requests from the working group.
This paper analyzes the impact of three policies and actions in light of the baseline scenario, while also incorporating a decline in precipitation and projected annual visitors during the simulation period. These policies include: setting instream flow standards to meet current regulations, assuming efficiency levels for water use increase over time, and investing in and developing a desalination plant to satisfy excess demand.
Policies such as increasing water use efficiency and desalination represent actions that the community can take to increase the supply of water over time. These have direct implications on the supply and demand of water, but also contain indirect costs if utilized. Firstly, the demand for water over time will decrease due to the more efficient use of the resource. Moreover, the supply of water will be able to increase without reaching its sustainable yield, due to the reduced stress on groundwater aquifers because of water being produced from the proposed desalination plant.
There are indirect costs associated with these actions though. With the development of a proposed desalination plant on Maui that facilitates the excess demand currently experienced, there will be a rise in energy demand and an increase in the necessary power generation capacity in the long term. With the County of Maui experiencing some of the highest energy costs per capita in the nation, the increase in energy demand will need to be satisfied and could prove costly in the long term. Furthermore, there is a considerable amount of wastewater created by a desalination plant, and this could have negative ramifications on the delicate structure of the local ecosystem.
The instream flow standards being discussed also have system wide ramifications, with indirect effects on the agriculture industry. Taking into account the decline in the industry due to the reduction in precipitation over the simulation period, there is a further negative impact on revenue and employment within the sector. Even though agriculture comprises 2% of the gross domestic product, the industry has had its roots on Maui for over a century, thus there are strong social implications of negative ramifications on the sector.
Due to this outcome, and other consequences, which have implications on cultural sustainability, there needs to be a community dialogue to discuss these policies and arrive at common solutions to help facilitate the transition towards a more sustainable future. PCM-Maui can provide valuable insights to policy makers and local stakeholders, but can also be used as an effective tool to create and facilitate a channel of communication within the community. Furthermore, the MI-MEDB approach is unique in that the ad hoc modeling process will be acquired and maintained by MEDB upon completion. By handing over ownership to the local partner, the community retains possession of the model, and with skills developed in training sessions, MEDB is able to update and customize the model further. This allows the model to become a tool that is not only developed by the community, but also owned and maintained by it as well.
By combining this dialogue with the holistic framework based on the initial framework of PCM, AQUA and well targeted customizations, the PCM-Maui is a highly customized tool to inform policy formulation and evaluation in Maui County. Not only will the model allow for the analysis of a variety of policy options, providing insights on the impacts of various water allocation strategies within the region, but the approach will also allow for the analysis of the cross-sectoral impacts and synergies within Maui County.

References

  1. Maui County Data Book (MCDB) 1995–2008. County of Maui Office of Economic Development. Hawai’i Small Business Development Center Network; Hawai’i Business Research Library: Maui, HI, USA, 1995–2008.
  2. Maui County General Plan Advisory Committee. Maui Island Plan (MIP), 2008. Available online: http://www.co.maui.hi.us/index.aspx?NID=1120 (Accessed on 4 August 2009).
  3. Socio-Economic Forecast (SEF). The Economic Projections for the Maui County General Plan 2030; Maui County Planning Department: Maui, HI, USA, 2006. [Google Scholar]
  4. Lau, S.L.; Mink, J.F. Hydrology of the Hawaiian Islands; University of Hawaii Press: Maui, HI, USA, 2006. [Google Scholar]
  5. Stearns, H.T.; Macdonald, G.A. Geology and Ground-Water Resources Of The Island Of Maui; Hawai’i Division of Hydrography Bulletin: Maui, HI, USA, 1942. [Google Scholar]
  6. Giambelluca, T.W.; Nullet, M.A.; Shroeder, T.A. Rainfall Atlas of Hawai’I; Technical Report R76; Hawai’i Department of Land and Natural Resources, Division of Water and Land Development: Maui, HI, USA, 1986. [Google Scholar]
  7. Warzecha, R.L. East Maui Irrigation Company, Past Present and Future. In Proceedings of a Conference Exploring Maui Water and Energy: Future Needs and Directions, Maui, HI, USA, December 14; 1986. [Google Scholar]
  8. Cataluna, D.B. Water Development and Use at Wailuku Sugar. In Proceedings of a Conference Exploring Maui Water and Energy: Future Needs and Directions, Maui, HI, USA, December 14; 1986. [Google Scholar]
  9. Engott, J.A.; Vana, T.T. Effects of Agricultural Land-Use Changes and Rainfall on Ground-Water Recharge in Central and West Maui, Hawaii, 1926–2004; Technical Report 2007-5103. U.S. Geological Survery Scientific Investigations: Island of Maui, HI, USA, 2007. Available online: http://pubs.usgs.gov/sir/2007/5103/ (accessed on August 4 2009).
  10. Meyer, W.; Todd, K.P. The Response of the Iao Aquifer to Groundwater Development, Rainfall, and Land-Use Practices between 1940 and 1998; Technical Report 00-4223; U.S. Geological Survey Water-Resources Investigations: Island of Maui, HI, USA, 2001. [Google Scholar]
  11. Water Resource Protection Plan (WRPP), Hawaii Water Plan, 2008; Commission on Water Resource Management, Department of Land and Natural Resources, State of Hawaii: Maui, HI, USA, 2008.
  12. Freedman, C. Maui County Water Use and Development (WUDP); Water Use and Demand Department of Water Supply Systems: Maui, HI, USA, 2007. [Google Scholar]
  13. Witney, L.D.; Bowers, F.A.I.; Takahashi, M. Taro Varieties in Hawaii; Bulletin No. 84; College of Tropical Agriculture and Human Resources, University of Hawaii: Manoa, HI, USA, 2007. [Google Scholar]
  14. Pedercini, M.; Kopainsky, B.; Davidsen, P.L.; Alessi, S.M. Blending Planning and Learning for National Development. In Proceedings of the 2008 International Conference of the System Dynamics Society, Boston, MA, USA, July 29–August 2; 2007. [Google Scholar]
  15. Stern, N.H. Great Britain Treasury. The Economics of Climate Change: The Stern Review; Cambridge University Press: Cambridge, UK, 2007. [Google Scholar]
  16. Gilmour, J.K.; Letcher, R.A.; Jakeman, A.J. Analysis of an integrated model for assessing land and water policy options. Math. Comput. Simulat. 2005, 69, 55–77. [Google Scholar]
  17. Sterman, J.D. A skeptic’s guide to computer models. In Managing a Nation: The Microcomputer Software Catalog; Barney, G.O., Kreutzer, W.B., Garrett, M.J., Eds.; Westview Press: Boulder, CO, USA, 1988; pp. 209–229. [Google Scholar]
  18. Dinar, A.; Letey, J. Modelling Economic Management and Policy Issues of Water in Irrigated Agriculture; Praeger Publishers: Westport, CT, USA, 1996. [Google Scholar]
  19. Griffin, R.; Hsu, S. The potential for water market efficiency when instream flows have value. Am. J. Agric. Econ. Assoc. 1993, 75, 292–0303. [Google Scholar]
  20. Bassi, A.M.; Baer, A.E. Quantifying cross-sectoral impacts of investments in climate change mitigation in Ecuador. Energy Sustain. Dev. 2009. [Google Scholar] [CrossRef]
  21. Hoekstra, A.Y.; Beusen, A.H.W.; Hilderink, H.B.M.; van Asselt, B.A. Perspectives on Global Change: A TARGET Approach; Cambridge University Press: Cambridge, UK, 1997; Chapter 14. [Google Scholar]
  22. Winz, I.; Brierley, G. The Use of System Dynamics Simulation in Integrated Water Resources Management. In Proceedings of the 25th System Dynamics Conference, Boston, MA, USA, July 29–August 2; 2007. [Google Scholar]
  23. Focus Maui Nui Final Report (FMN); Maui Economic Development Board: Maui, HI, USA, 2003.
  24. Bassi, A.M. An Integrated Approach to Support Energy Policy Formulation and Evaluation; Univeristy of Bergen: Bergen, Norway, 2009. [Google Scholar]
  25. Drud, A.; Grais, W.; Pyatt, G. Macroeconomic modeling based on social accounting principles. J. Policy Model. 1986, 8, 111–145. [Google Scholar]
  26. Oki, D.S. Trends in Streamflow Characteristics at Long-Term Gauging Stations, Hawaii; Technical Report 2004-5080; U.S. Geological Survey Scientific Investigations: Island of Maui, HI, USA, 2004. [Google Scholar]
  27. DBEDT Data Warehouse (Economic Development and Tourism, Input/Output Model). Research and Economic Analysis Division, Department of Business, Economic Development & Tourism, Government of Hawaii: Honolulu, HI, USA, 2008; Available online: http://www.hawaiieconomicdata.com/ (Accessed 10 August 2009).
  28. Leone, D. Kapolei desalination project gets under way. Star Bulletin. August 29 2003. Available online: http://archives.starbulletin.com/2003/08/29/news/index4.html (accessed on 27 July 2009).
  29. Zhoua, Y.; Tolb, R.S.J. Evaluating the Costs of Desalination and Water Transport. Available online: http://www.fnu.zmaw.de/fileadmin/fnu-files/publication/working-papers/DesalinationFNU41_revised.pdf (accessed on 27 July 2009).

