Can Polyolefin Fibre Reinforced Concrete Improve the Sustainability of a Flyover Bridge?
by
 , , ,
, , ,
Alejandro Enfedaque
1 ,
,
Marcos G. Alberti
1 ,
,
Jaime C. Gálvez
1,*,
Marino Rivera
3 and
José M. Simón-Talero
2,3 1
Departamento de Ingeniería Civil: Construcción, E.T.S de Ingenieros de Caminos, Canales y Puertos, Universidad Politécnica de Madrid, c/Profesor Aranguren, s/n, 28040 Madrid, Spain
2
Departamento de Medios Continuos y Teoría de Estructuras, E.T.S de Ingenieros de Caminos, Canales y Puertos, Universidad Politécnica de Madrid, C/Profesor Aranguren, s/n, 28040 Madrid, Spain
3
Torroja Ingeniería, C/Pedro de Valdivia 36, L20, 28006 Madrid, Spain
*
Author to whom correspondence should be addressed.
Sustainability 2018, 10(12), 4583; https://doi.org/10.3390/su10124583
Submission received: 31 October 2018
/
Revised: 28 November 2018
/
Accepted: 30 November 2018
/
Published: 4 December 2018
(This article belongs to the Special Issue Sustainable Cementitious Materials for the Construction Industry)
Abstract
:The use of polyolefin fibre reinforced concrete (PFRC) as an alternative for reducing the reinforcing steel bars employed in reinforced concrete has become real in the past years. This contribution analyses the improvements in sustainability that a change in the aforementioned reinforcement configuration might provide in a flyover bridge. Economic, environmental and social parameters of both possibilities were studied by means of the integrated value model for sustainable assessment. Such model, which acronym is MIVES (Modelo Integrado de Valor para una Evaluación Sostenible, MIVES), is a multi-criteria decision-making method based on the value function concept and the seminars delivered by experts. The results of the MIVES method showed that the use of PFRC in combination with reinforced concrete (RC) has a sustainability index 22% higher. An analysis of the parameters that form this evaluation shows that there are no remarkable differences in the financial costs between the two possibilities studied. Nevertheless, social and environmental aspects provide with a better qualification the option of building a bridge by using PFRC combined with RC.
1. Introduction
The mechanical properties of concrete, together with a low cost of raw materials, flexibility in shaping, durability and ease of production, have enabled it to become the most used construction material of the twentieth century. The remarkable compressive strength of concrete is highly suitable for structural elements subjected to compressive stresses, such as piers. However, the low-tensile and flexural strength of concrete prevent it from being used in horizontal structures subjected to vertical loads. In such situations, the structural elements should resist stresses which are in most cases higher than the tensile strength. In order to widen the use of concrete, it was merged with steel bars which formed what has been conventionally termed reinforced concrete (RC). Moreover, for certain applications steel bars have been complemented with what is commonly known as active reinforcement in the form of steel wires and strands. Such a combination is called pre-stressed concrete.
This profuse use of concrete has been subsequently followed by a rise in the production and use of cement. As is widely reported, [1] cement production generates almost a ton of CO2 per ton of cement manufactured. Consequently, cement production was responsible for an amount from 5% [2] to 7% [3] of the global industrial production of CO2 in 2010. Regarding the production of steel, it should be noted that as production has increased in the last decades the contribution to global CO2 production has also grown. For instance, Chinese crude-steel production has reached 683.3 million tons, accounting for 45.9% of world steel production [4]. Although impressive progress has been made, this industry still has low resources, low levels of energy efficiency, and heavy environmental pollution [5].
Regarding the durability of a reinforced concrete element, there are certain pathologies that may lead towards the total failure of the concrete piece, with some of them being mainly associated with degradation of the steel bars caused by potentially hazardous environments [6]. This is the case of marine environments, where saline mist or even salt content of water might accelerate the corrosion velocity of the steel bars and lead to premature failure [7]. If such an event takes place, the financial and environmental cost of rehabilitation, refurbishment or substitution of the infrastructure by a new one, increases the overall impact. This situation has been extensively explained by some published authors who have determined the financial cost of the options previously mentioned [8,9].
Some authors have tried to minimise the socio-economic and environmental impact of the construction of concrete infrastructure by optimising some characteristics of the raw materials that form it. For instance, in order to reduce the amount of cement used and improve the mechanical properties, some by-products of other industries have been employed. Blast-furnace slag has been added even in marine environments, obtaining beneficial effects both in mechanical properties and durability [10,11]. Some other products and by-products, such as contaminated marine sediment, have been employed, in the latter case as raw material for cement production [12]. It has been shown that they improve the mechanical properties if they are compared with a CEM II/A-LL 32.5 that contains a proportion of limestone similar to the sediment substitution. Fly ash has been another possibility when a reduction of the impact of cement production is sought. It has been shown that high fly-ash replacement (>75% by mass) of cement is possible for all aging times and slump ranges for controlled low-strength applications [13]. Regarding the use of aggregates, the main tendency has been to recycle debris from dismantled concrete structures. This practice has become a subject of major priority in several countries in the world [14]. The Structural Concrete Code EHE-08 in force in Spain [15] enables the use of proportions of such aggregates of up to 20% substitution in concretes with a characteristic compressive strength no greater than 40MPa. Nevertheless, there are other published studies where such proportions have risen up to 100% [16]. In general, compressive, splitting and flexural strength of recycled aggregate concrete mixes obtained slightly lower results than a conventional concrete.
Although these approaches have been used on several occasions, the positive influence that the addition of fibres might have not only on the mechanical properties, but also on the durability of the material is still being studied [17,18]. The latter is of significant importance because on many occasions the impact of the total life cycle of the infrastructure is neglected, ignoring the high impact of the cost of maintenance and refurbishment. Moreover, the present codes and recommendations have introduced in their last versions the requirements for FRC in order to consider the contribution of the fibres in the mechanical design of concrete structures. Such a contribution might, in certain cases, enable reduction of the amount of steel bars used in the concrete element and save not only money, but also contribute to reducing the impact of concrete in the natural environment. Although this issue might be questioned in the case of the construction costs, it should be noted that the influence of the eventual maintenance, repair or even re-building of the infrastructure ought to be taken into account if the entire life cycle is considered. The contribution of the fibres reduces the width of the cracks, hampering the entrance of deleterious chemical substances in the concrete matrix. Several of the aforementioned substances, such as chlorides or sulphates, cause overall damage to concrete which ultimately may imply socioeconomic and environmental costs of several orders of magnitude greater than the manufacturing and construction costs. Recently, it has been pointed out that the addition of polyolefin fibres might be apt as an alternative to substitute the traditional usage of steel fibres in FRC. In previous studies, polyolefin fibres added in certain amounts to a vibrated conventional concrete or even to a self-compacting concrete, have been able to meet the requirements set by some of the most relevant recommendations which enable to reduce the amount of steel bars in RC [19,20]. Analysing the cited contributions it was decided to take as reference a concrete formulation with the addition of 10 kg/m3 of polyolefin fibres. Moreover, polyolefin fibres are not metallic and therefore do not suffer from corrosion when subjected to environments with high concentrations of chloride or sulphate ions. This characteristic of polyolefin fibres might contribute to enhance the durability of the material and consequently the life span of the structure.
Following this rationale, this contribution seeks to apply the MIVES formulation to a common example of bridge typology. The analysis starts by performing the structural analysis on a single span multi-girder bridge and determining the reduction of the steel bars that can be achieved by substituting the conventional concrete by FRC manufactured with 10 kg/m3 of polyolefin fibres (PFRC10). The application of PFRC10 will be limited to the slab of the bridge, designing the beams with conventional reinforced concrete in the form of prefabricated girders. Once this step is completed, the MIVES analysis will evaluate the socioeconomic and environmental costs that the aforementioned options imply [21]. Lastly, some recommendations will be offered in order to serve as a reference for future applications and potential structural designs.
2. Material Modelling
2.1. Reinforced Concrete
In order to assess the positive influence that the use of PFRC10 might have when applied to bridges, it was important to determine the structural design of the slab that uses the conventional RC option. As this contribution deals with a theoretical study and no design parameters were determined by the environment conditions, only the stiffness and strength properties of concrete were used. The main parameter that defines the properties of concrete entails its characteristic compressive strength (fck) which was set at 35 MPa. Moreover, it should be highlighted that the rest of properties of concrete were deduced by using the experimental correlations between the compressive strength and the parameter needed.
Instead of using a linear constitutive stress-strain relation, a parabolic diagram was implemented in order to perform a non-linear calculation. Such a parabolic relation was established as stated in the Model Code 2010 [22]. The stress behaviour of concrete is defined in terms of strengths as an alternative to characteristic values. By analogy, the tensile strength is considered to have a maximum stress equal to the mean tensile strength (fctm).
The tensile behaviour of concrete is considered linear, taking as a reference value the secant elasticity modulus (Ecm). Such a modulus was assumed equal to that considered in the first branch of the parabolic diagram under compressive stresses. Although it is accepted that concrete under tensile stresses behaves as a quasi-brittle material, which might be simulated by using an exponential softening function [23,24,25], it cannot be overlooked that the majority of the approaches neglect this kind of behaviour thus reducing concrete to a material with brittle behaviour when using RC.
Regarding the steel bars, they are placed in the tensile zone of the concrete slab by using the usual weldable steel type B500S which boasts a modulus of elasticity of 210 GPa and a yield stress of 500 MPa. The constitutive relation adopted is a bilinear response with an elastic branch range from the origin to yield strength and a slope defined by the elastic modulus. The second branch is assumed horizontal and ends at ultimate strain, which is adopted as εsu = 1%.
The collapse of the RC takes place either when concrete or steel reach their failure values.
2.2. FRC
The influence of the polyolefin fibres in the compressive strength of concrete has been previously studied without finding unanimous tendencies. In previous studies it has been detected that, under certain situations, the presence of such fibres might slightly reduce the compressive strength [19]. However, it should not be overlooked that when polyolefin fibres have been added to a vibrated conventional concrete some enhancement of the compressive strength has been assessed [20]. As there are contradictory results in literature regarding this matter, it has been decided to apply the same compressive behavior both for RC and PFRC.
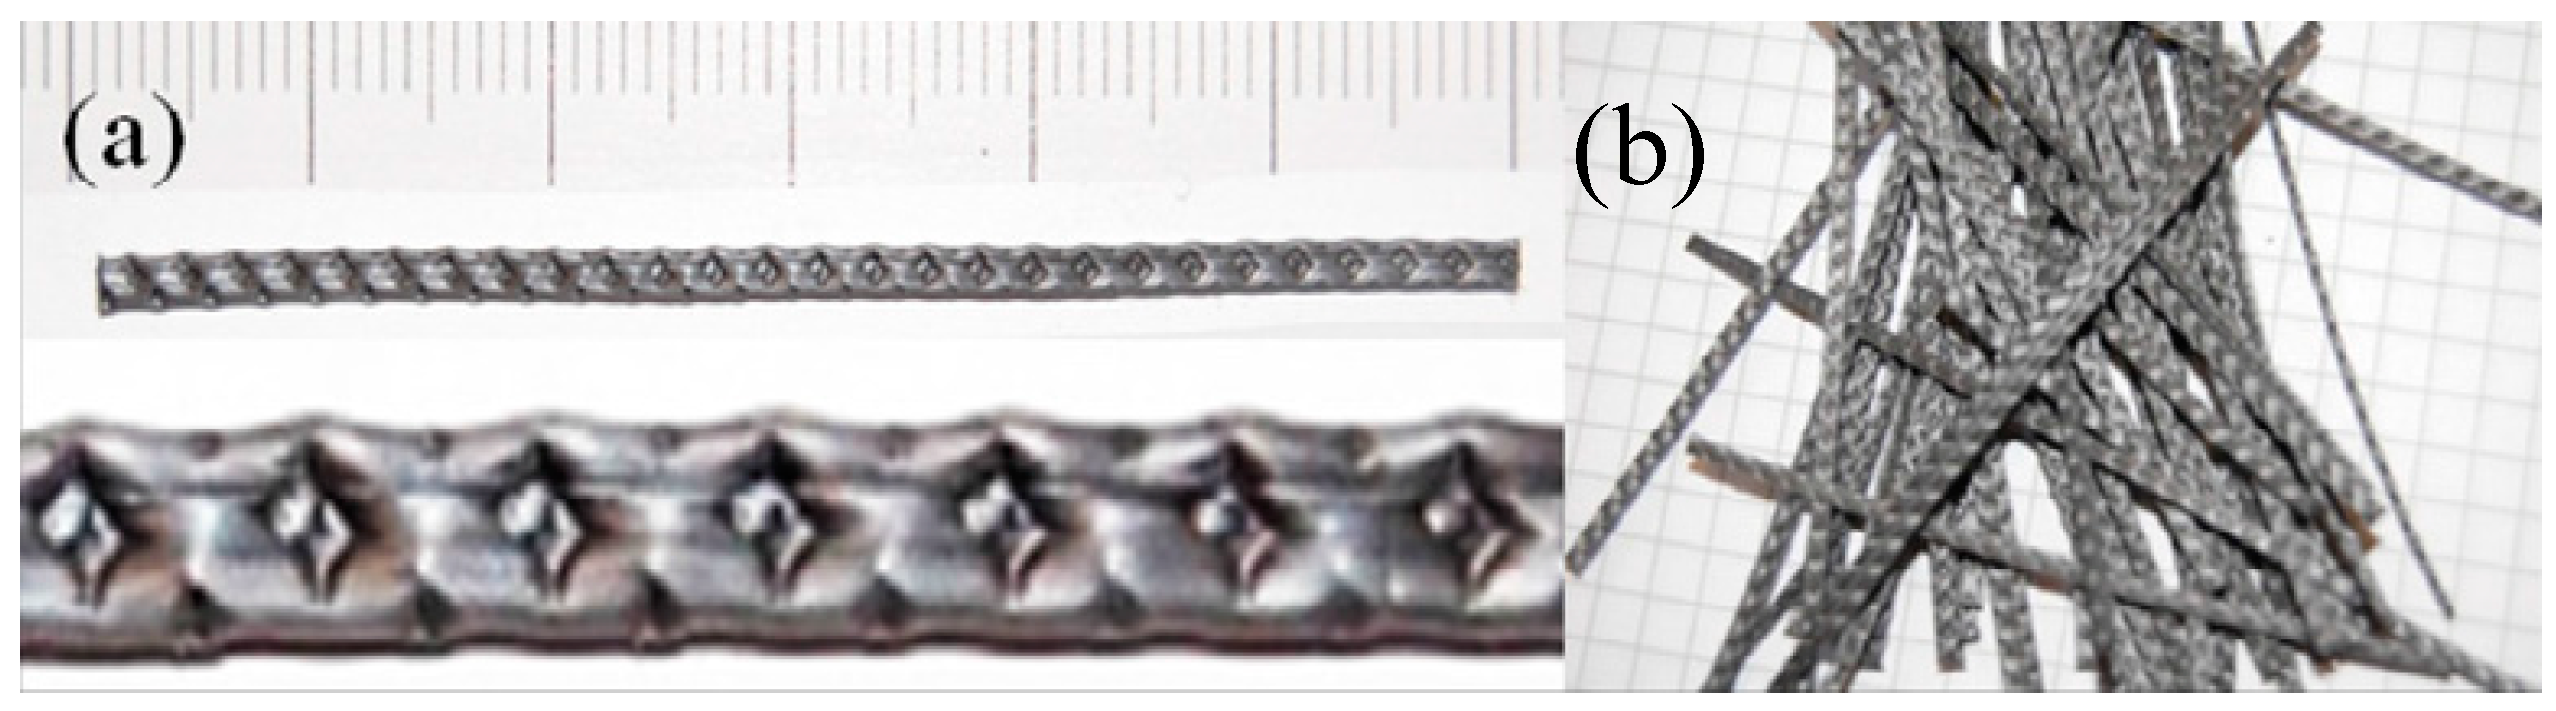
On the contrary, when tensile stresses appear notable changes in the constitutive response of concrete due to the presence of fibres are introduced. Such changes depend on a significant variety of factors, such as the fibre type, geometry, shape, anchorage between the matrix and the fibres, amount of fibres added and, among others, their distribution and orientation in the bulk material [26]. In this study, polyolefin fibre reinforced concrete has been analysed, having an addition of 10 kg/m3 forming PFRC10. The main characteristics of the fibres used can be seen in Figure 1 and Table 1.
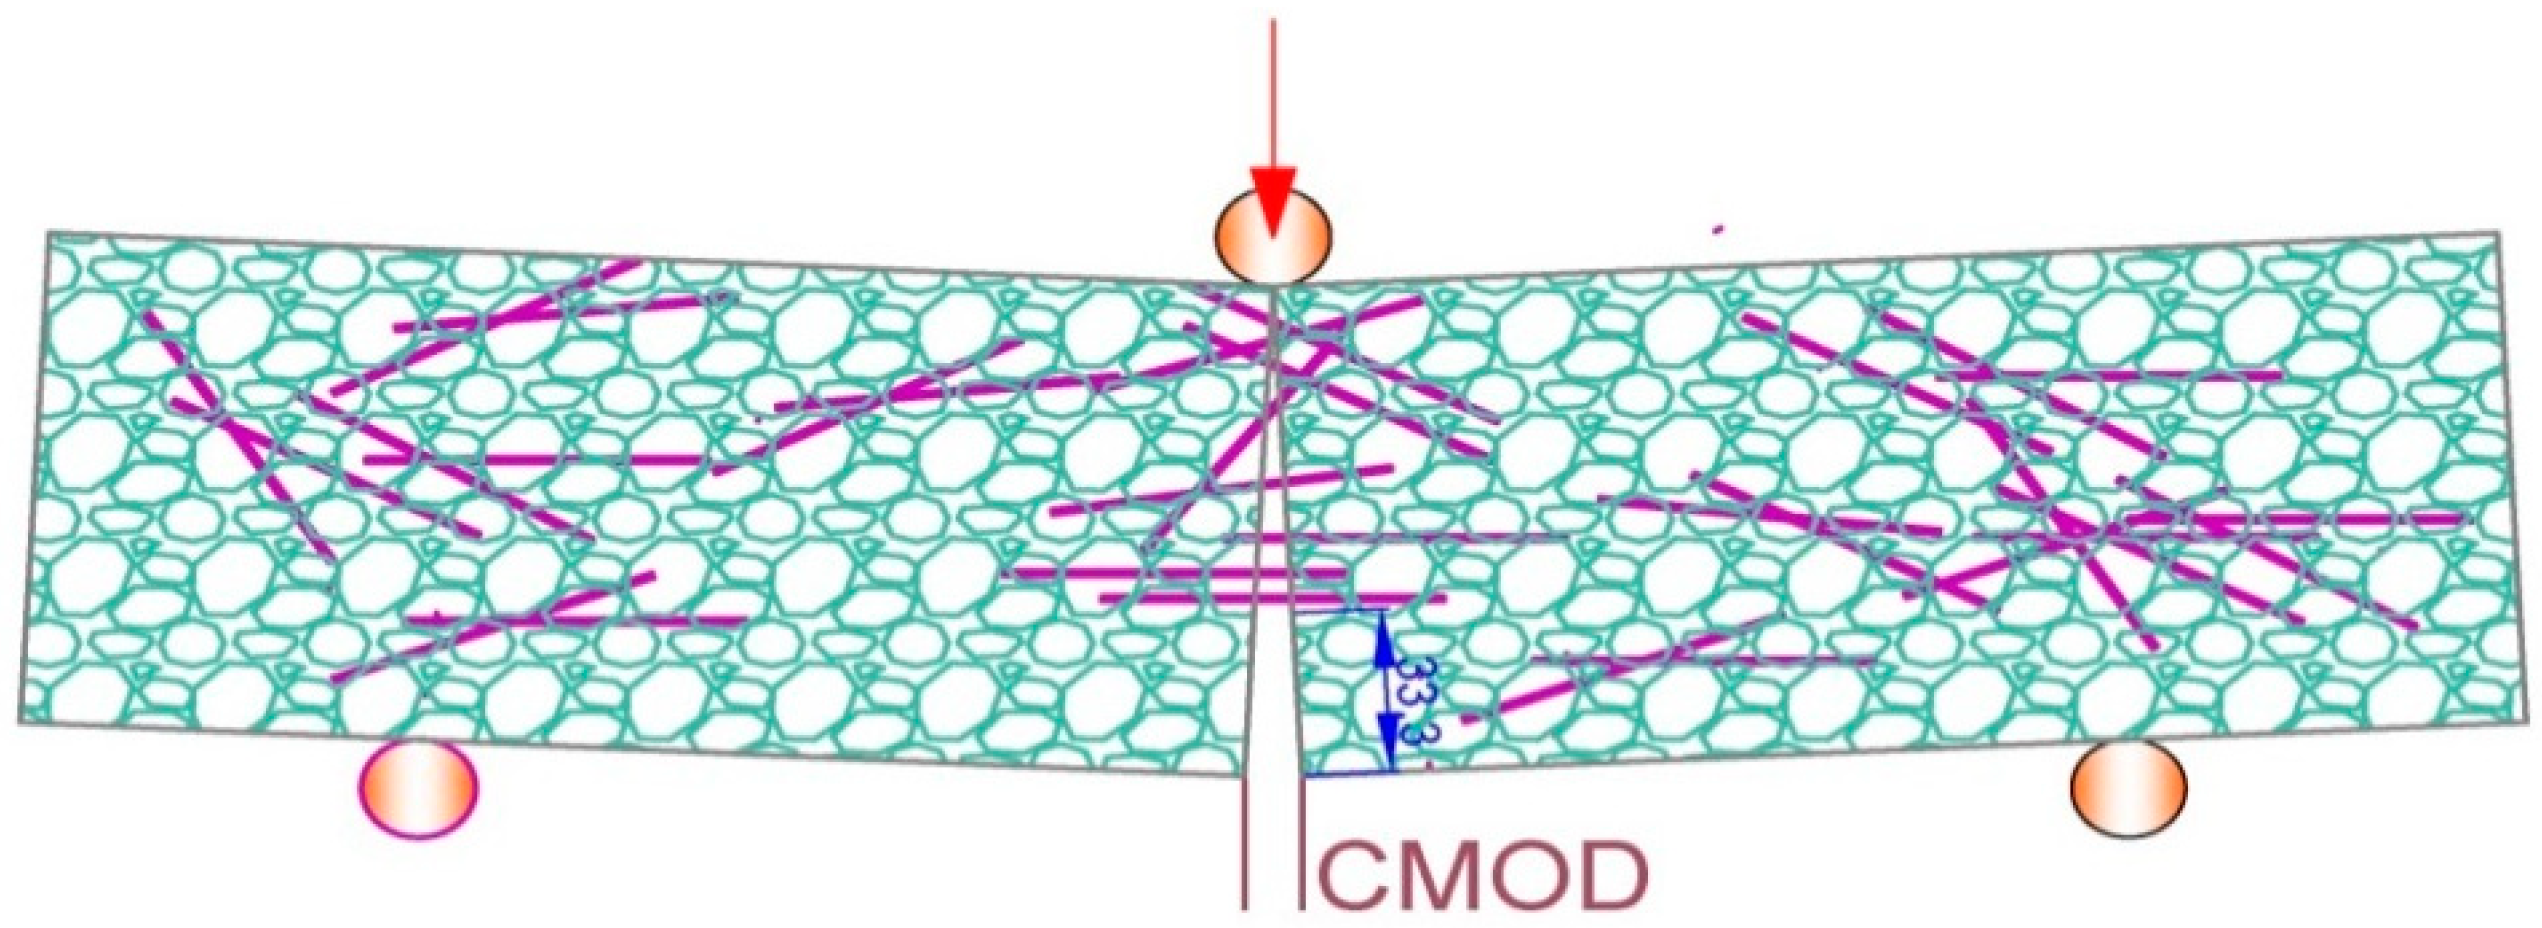
In order to perform a structural design of the concrete elements that considers all the properties that the fibres supply to the material, assessment of the behaviour of the material not only under compressive stresses but also under tensile stresses is needed. Most of the national codes relate the behaviour of the material in a three-point bending fracture test, which is sketched in Figure 2, with the requirements needed to consider the contribution of the fibres in the structural design. Some of these codes are those in force in Germany [27], Italy [28] and Spain [15] (there are published papers that analyse their analogies and differences) [29,30].
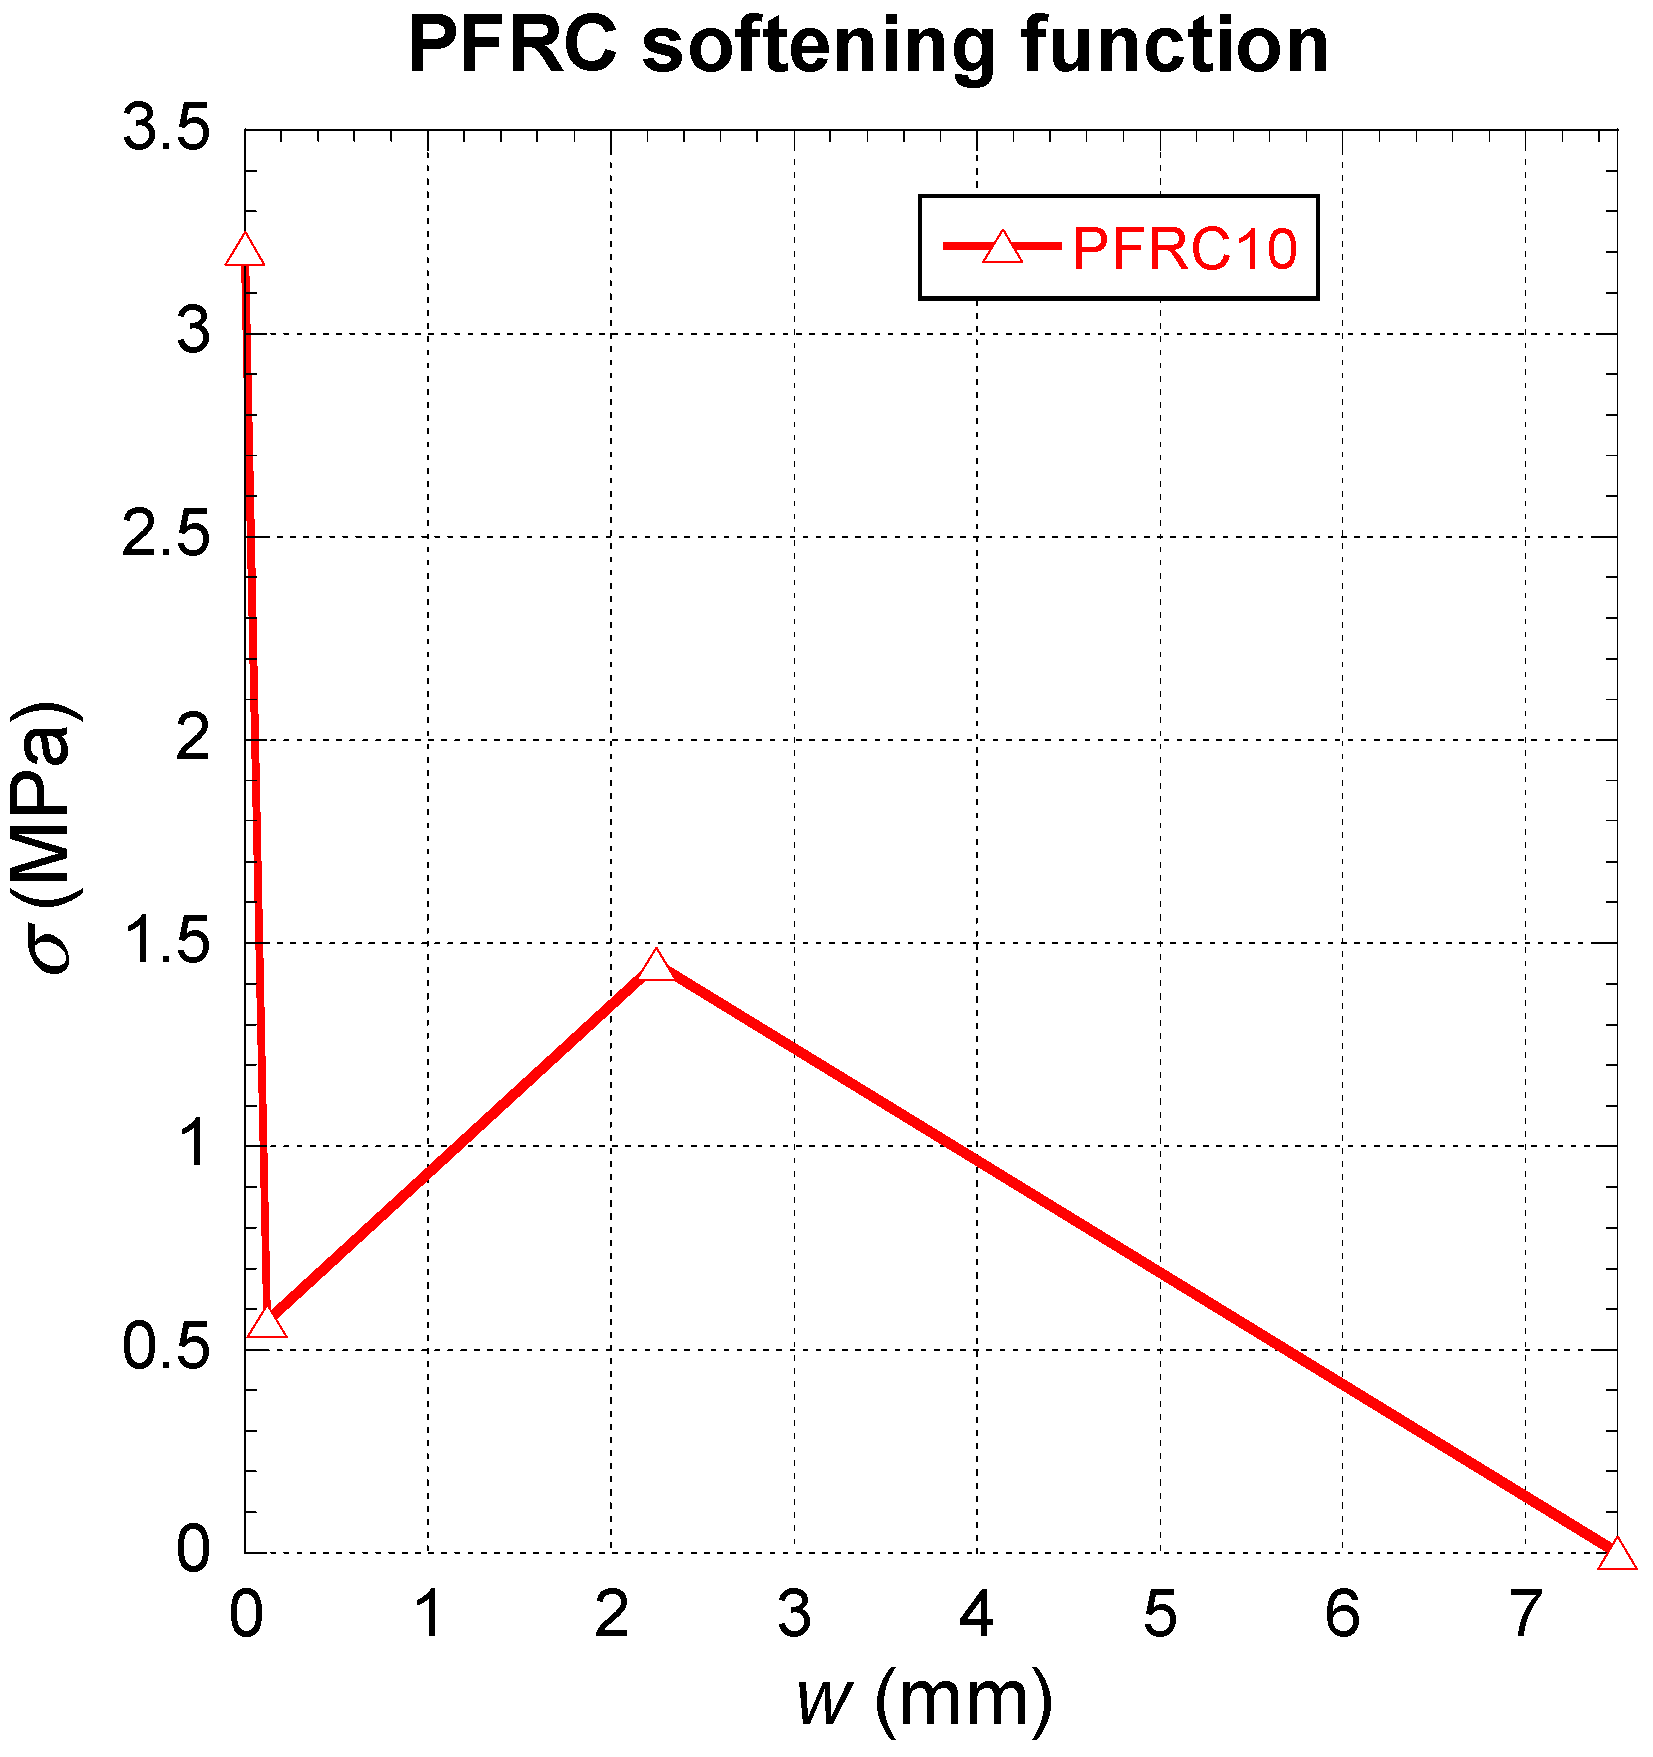
However, on many occasions the requirements set in the recommendations reduce the properties to such an extent that the positive influence of the fibres is too limited to be considered as a profitable option. In order to address this situation, another approach has been taken that offers an alternative to use of the data proposed by the codes. Based on the fracture results of [31] and using an inverse analysis performed by means of numerical simulations, the softening functions that define the post-cracking behaviour of PFRC10 were obtained. A full description of the method followed can be seen in [31,32]. Such a function, which can be seen in Figure 3, has been implemented in the structural design process.
3. Structural Design Methodology
When designing with RC, the amount of reinforcing bars is computed by considering the ultimate calculation strength, while the compression at concrete is taken as a homogenous stress reduced by a fatigue coefficient. The boundary condition to be met in the section is that the sum of all axial forces should be zero, balancing the tensile forces that appear in the steel bars with the compressive force that appears in concrete. This is carried out by estimating the depth of the compressive zone until the aforementioned balance is obtained.
In order to perform the structural design through use of PFRC10, some assumptions should be made. Instead of using the sectional strain, the crack width has to be employed as the constitutive relations of FRC relate the crack width with the stresses that the material is able to bear. Moreover, a more sophisticated analysis has been performed where a moment-curvature diagram is prepared to evaluate the flexural capacity of a one-width cross-section with a determined amount of steel reinforcement.
The moment-curvature diagram is carried out in terms of mean values, not by using characteristic ones. Consequently, the reductions in strength are applied on the final structural strength. To consider the post-cracking tensile stresses, the crack width is evaluated at the level of the reinforcing bars which is suitable for accounting the crack-width limit in the service limit state (SLS). In the case of FRC, since the tension force provided by fibres is much more reduced than that provided by steel bars, it can be concluded that the main reinforcement continues to dominate the flexural response. Consequently, an overall safety factor equivalent to the partial coefficient of the steel is assumed (γs = 1.15). It should be highlighted that this approach deviates from the partial coefficients adopted in the Model Code 2010 [22] in order to make the calculation consistent. This approach corresponds to those used in other North American standards such as those provided by the American Association of State Highway and Transportation Officials (AASHTO) or the American Concrete Institute (ACI).
The moment-curvature diagram is obtained from a discrete-point method. As this contribution is not focused on the structural design process, it has not been included in the manuscript. However, it should be highlighted that the ultimate bending moment is determined as the previous point of the diagram before the failure of any material of the cross-section occurs. This failure occurs when any of the following situations in PFRC10 is reached:
- The maximum compressive strain in concrete greater than compressive ultimate strain: εcmax > εcu = 0.35%.
- The tensile strain in main reinforcement greater than the ultimate strain of steel: εs > εsu = 1.00%.
- The crack width in concrete greater than the ultimate crack width: w > wu.
The dimension of shear reinforcement is also developed by following the guidelines of the Model Code 2010 [22], which proposes a specific modification to the conventional formulation to consider the fibre-reinforcing effect. The shear strength is computed as the sum of several components: concrete bond, aggregate interlocking, dowel action, vertical shear reinforcement, longitudinal reinforcement contribution and crack bridging by fibres.
Adding fibres to the matrix allows concrete to bear tensions in the shear cracks thanks to the action of the fibres sewing both crack surfaces. That effect is analogous to that of the longitudinal steel reinforcement, except that the fibres are randomly distributed. Therefore, the fibres contribute by means of normal tensile stresses and depend on the shear crack width. As an agreement to define this tensile stress, an ultimate crack width wu = 1.5 mm is taken. In addition, unlike the flexure crack, it is considered that the surfaces on both sides of the crack are parallel so that the crack width is constant.
4. Application to a Bridge Typology
4.1. Description of the Numerical Model
The aforementioned methodology has been applied to the concrete slab of single-span multi-girders bridge that require a reduction of the main steel-bar reinforcement. In this sense, calculations are focused on a real bridge with conventional reinforced concrete. Such a reduction might also have an influence on the durability and maintenance costs of the bridge and, consequently, its total sustainability.
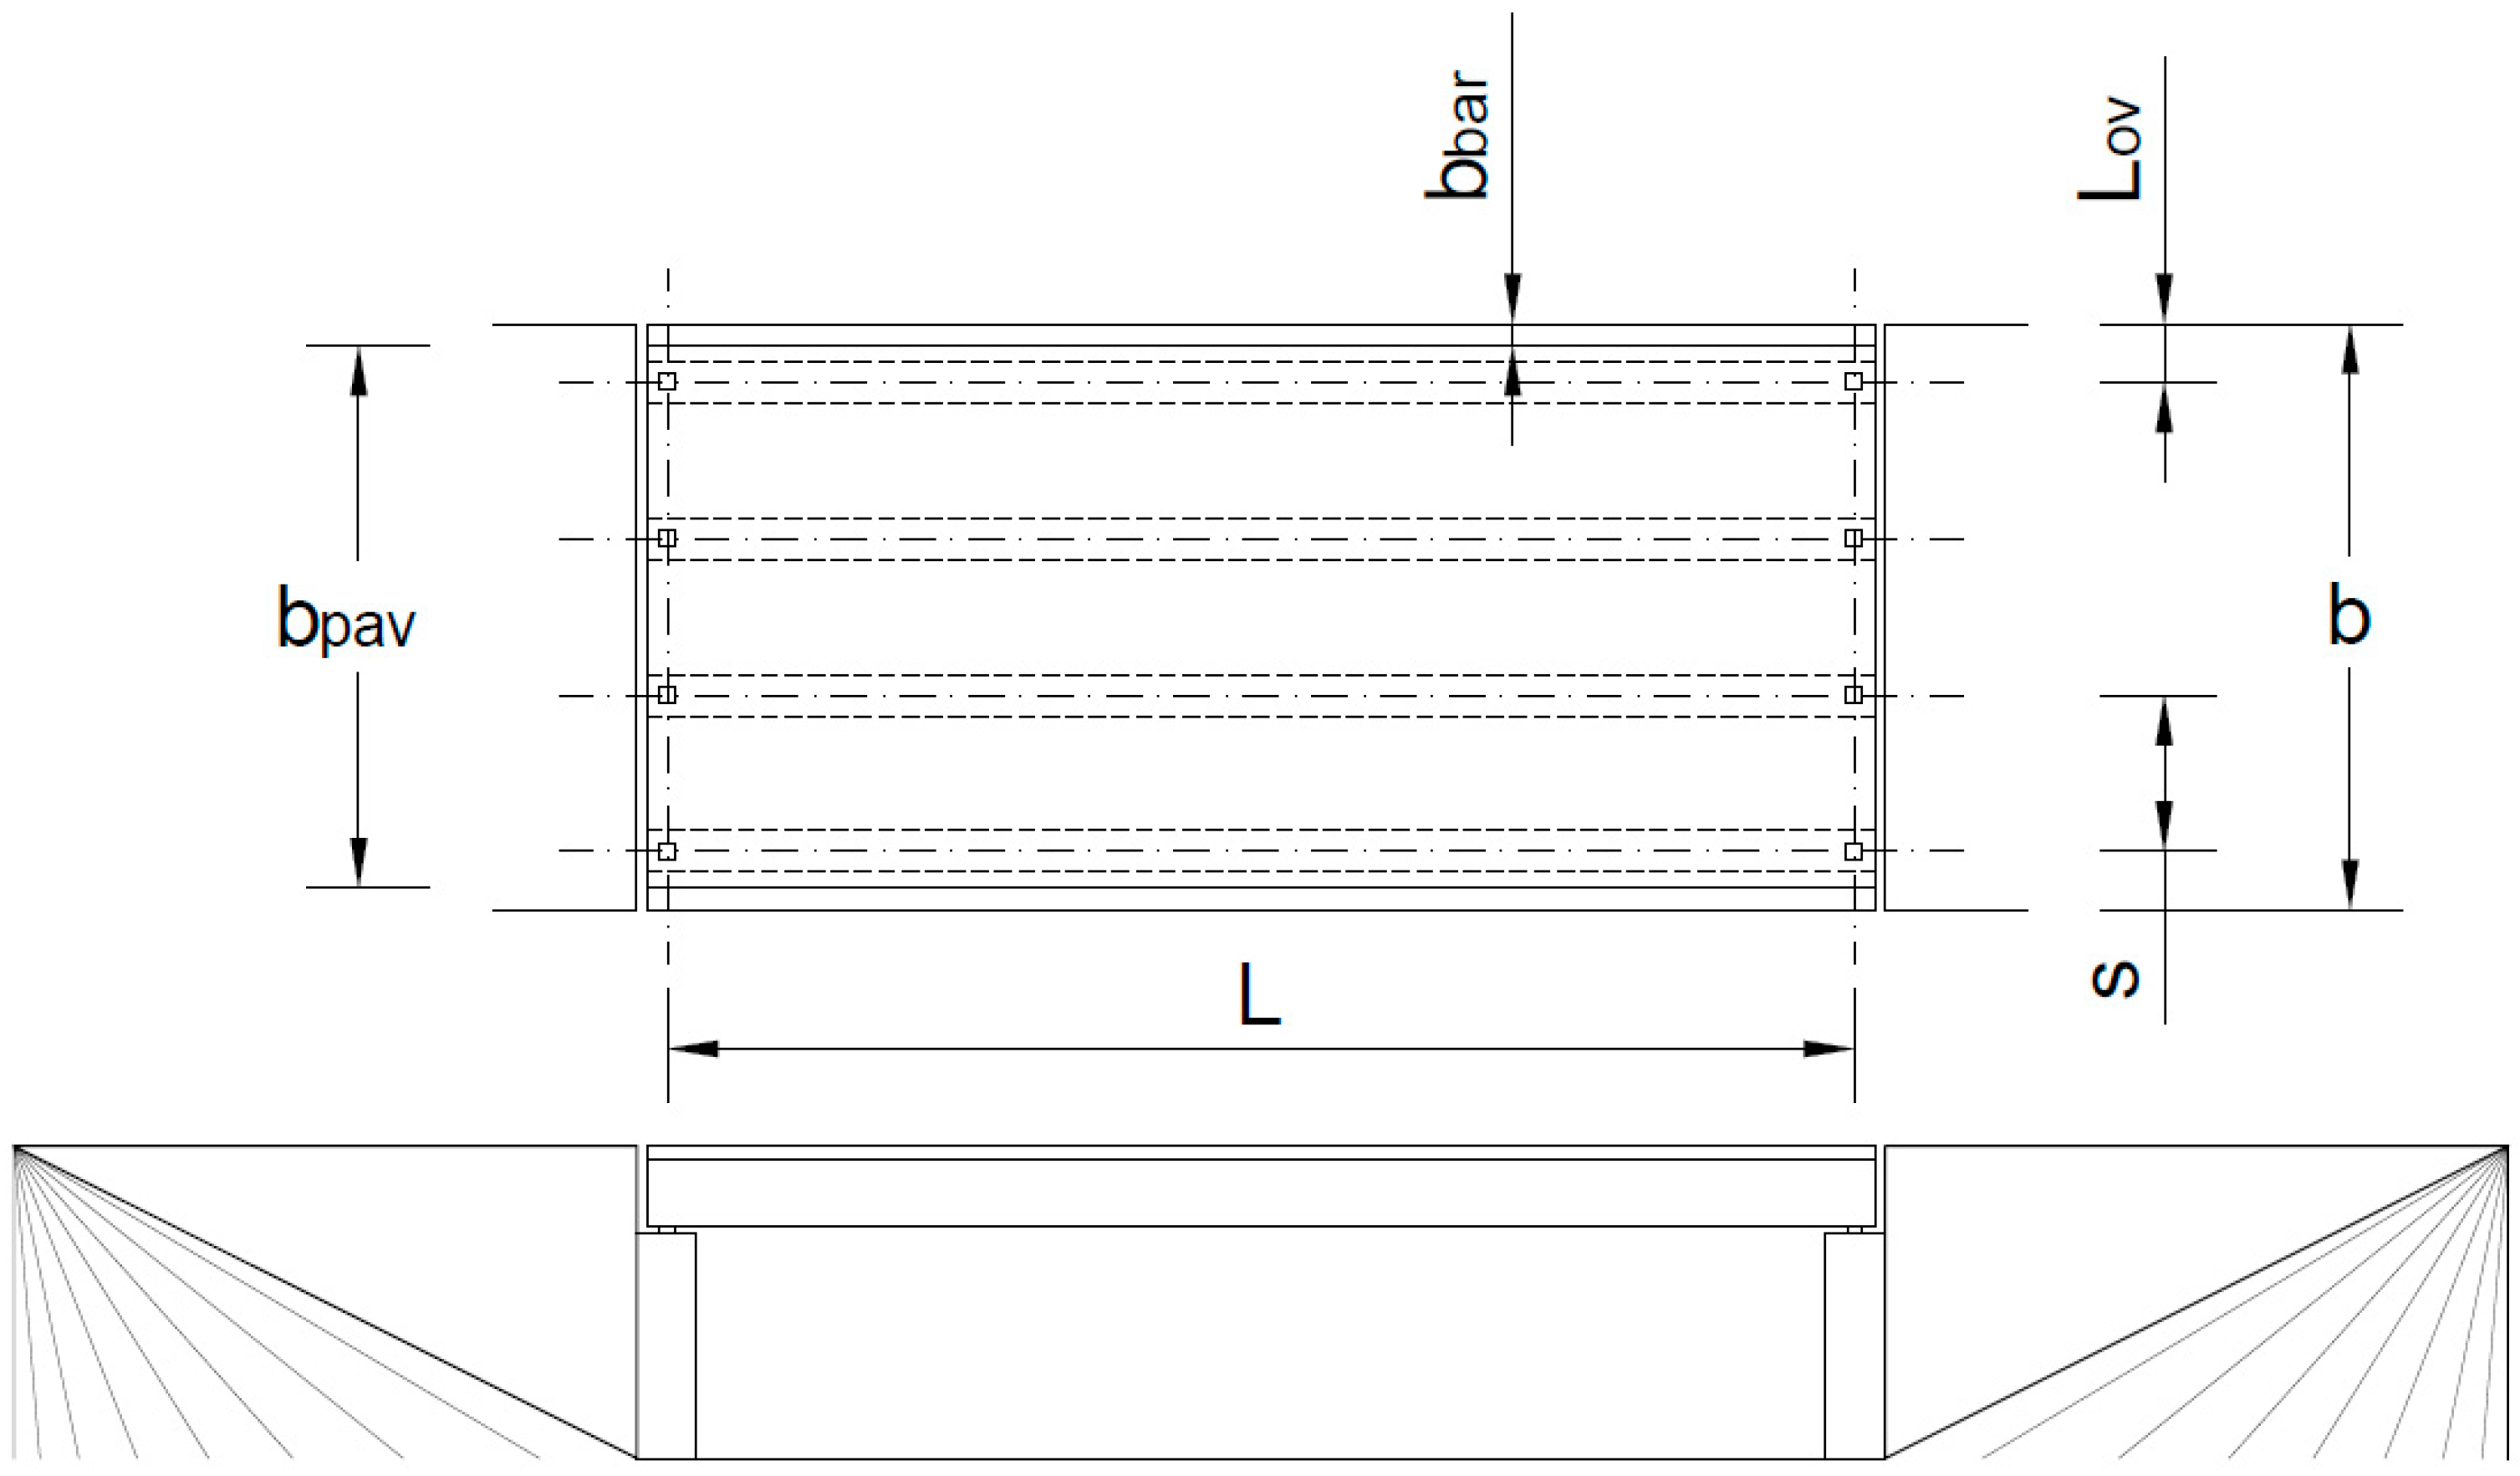
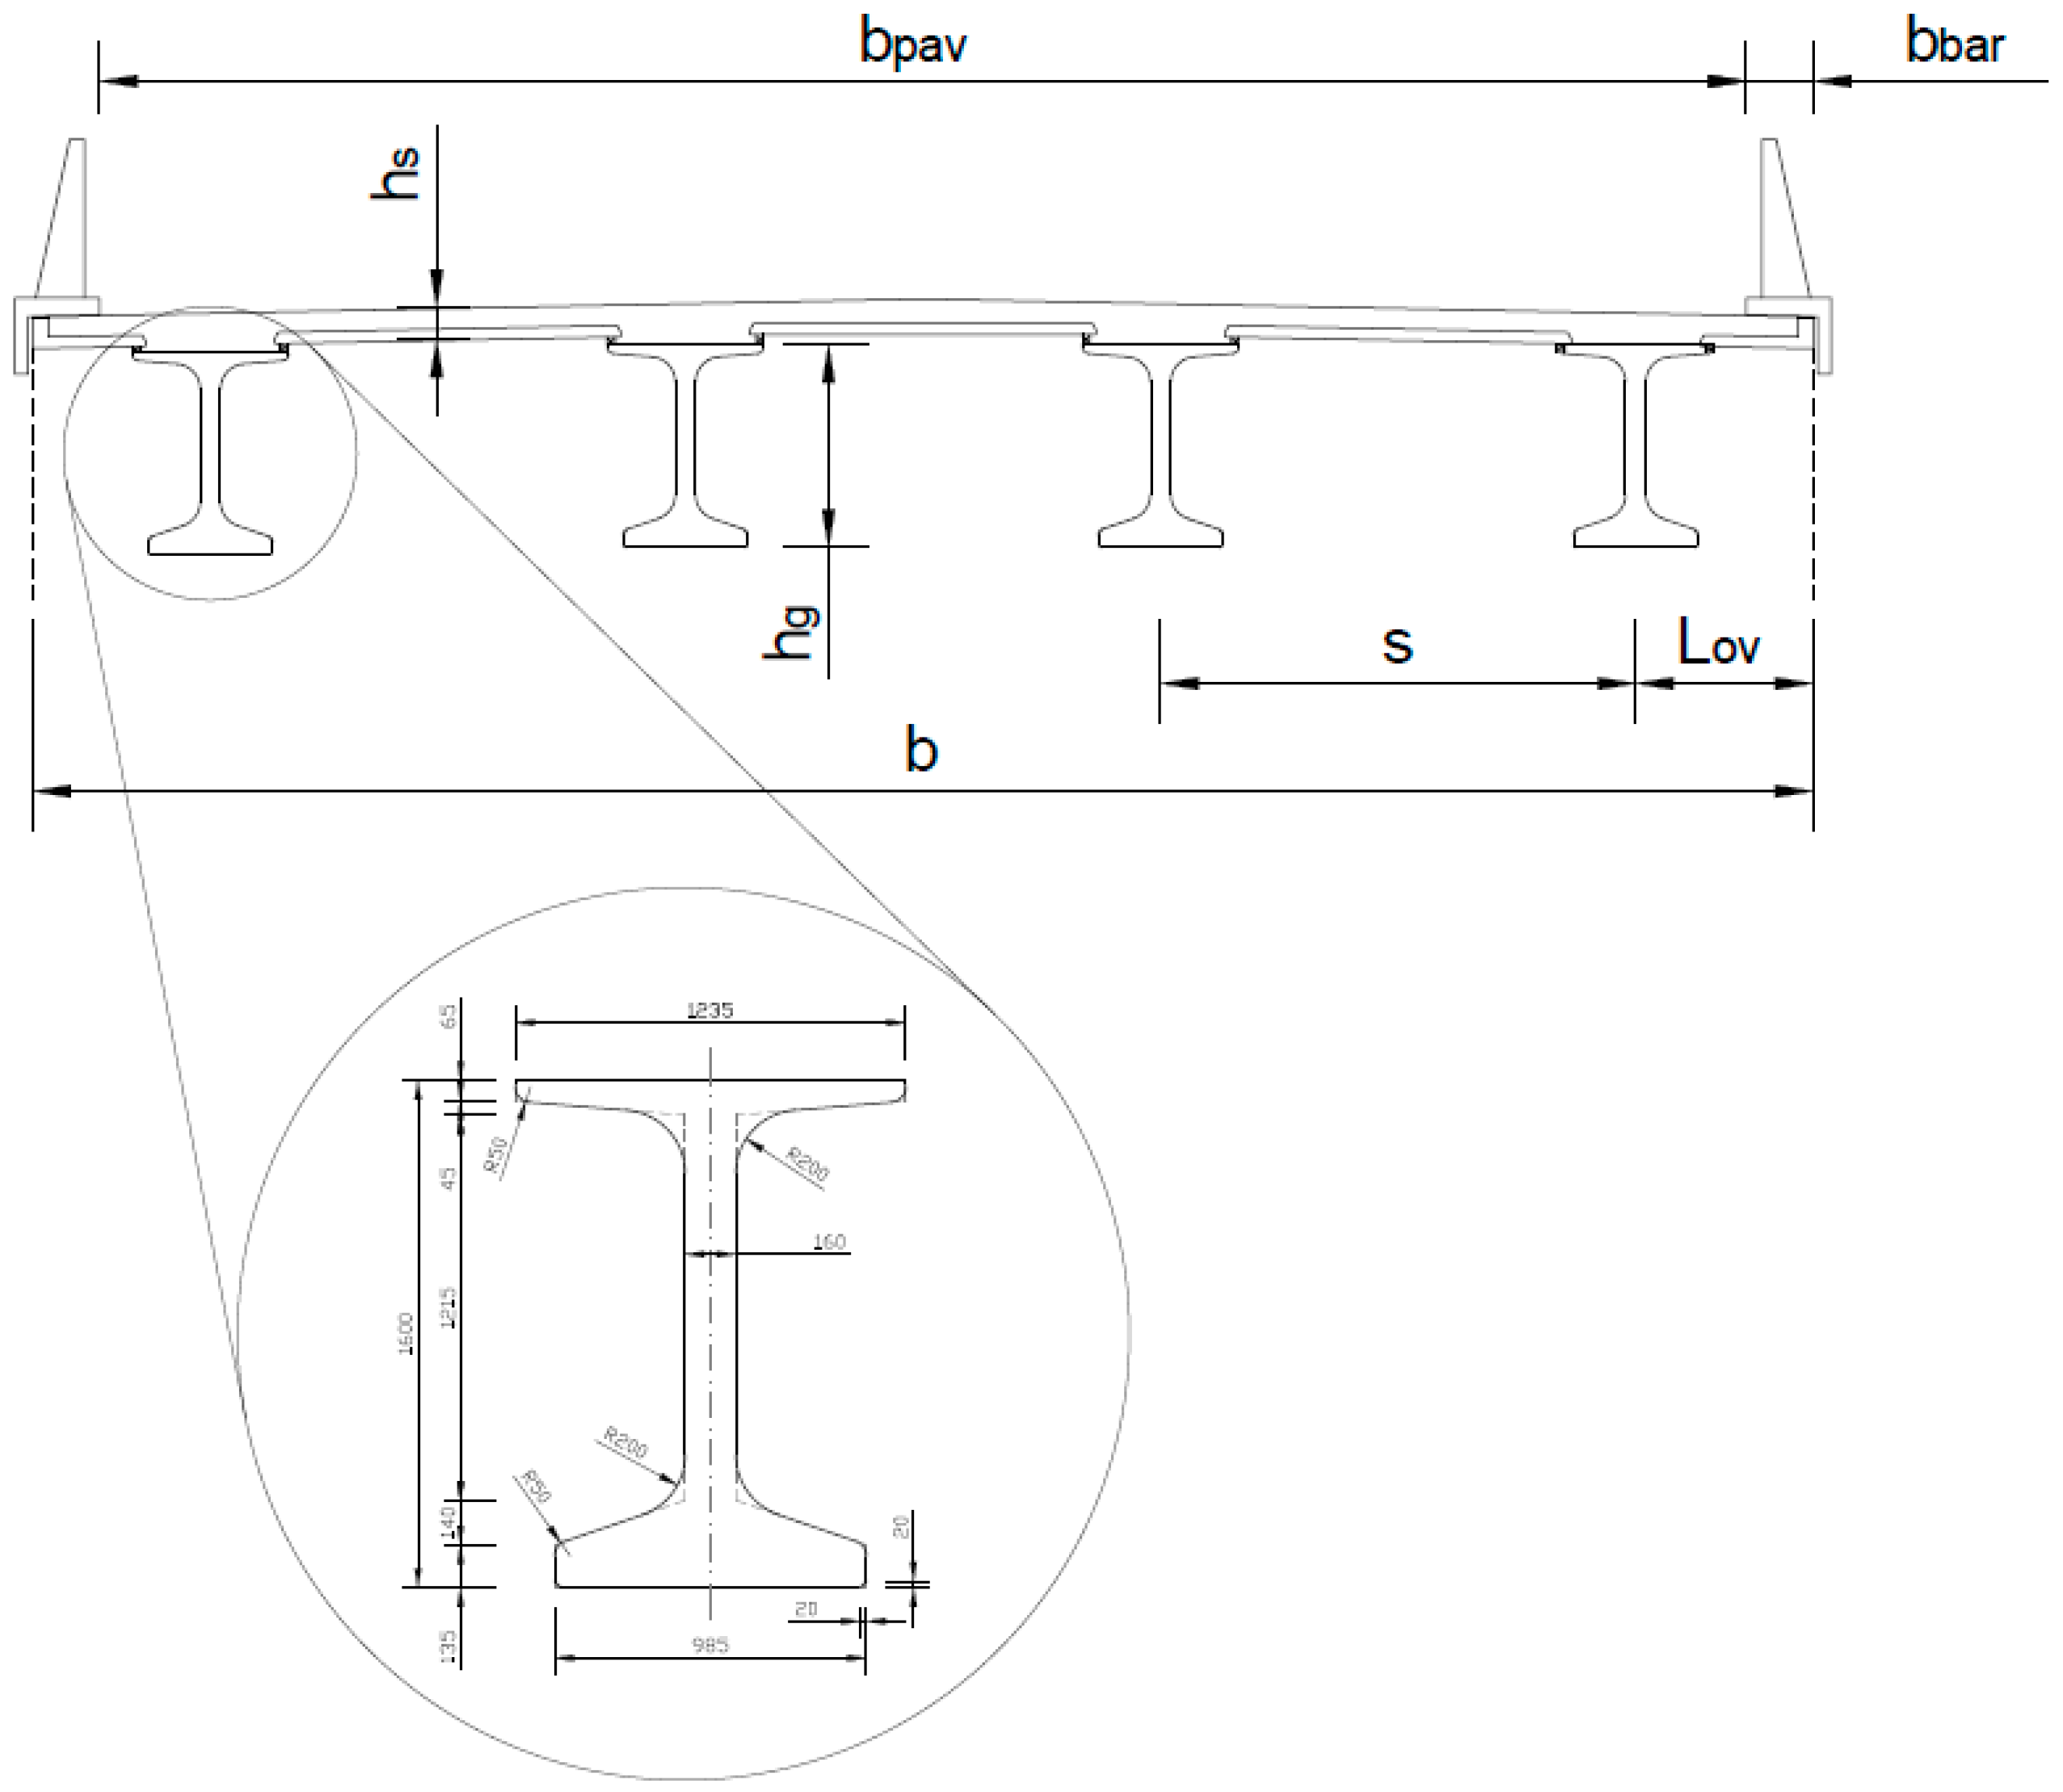
This reference bridge has four prefabricated beams with a height hg = 1.60 m that support the slab over a single span of L = 28.50 m. The width of the deck is b = 14.05 m (ratio b/L ≈ 0.5) and the girders are spaced s = 3.75 m, which leaves an overhang of Lov = 1.40 m. The barriers on each side have a width of bbar = 0.525 m and between them there is a roadway pavement with bpav = 13.00 m. The depth of the slab is set at hs = 25 cm for all calculations. A sketch of the bridge can be seen in Figure 4. Moreover, the section of the bridge can be seen in Figure 5 where a detailed view of the girders section can be observed.
As the main target of the contribution deals with the reduction of impact caused by the substitution of conventional concrete by PFRC10, the slabs will be defined both for RC and PFRC10.
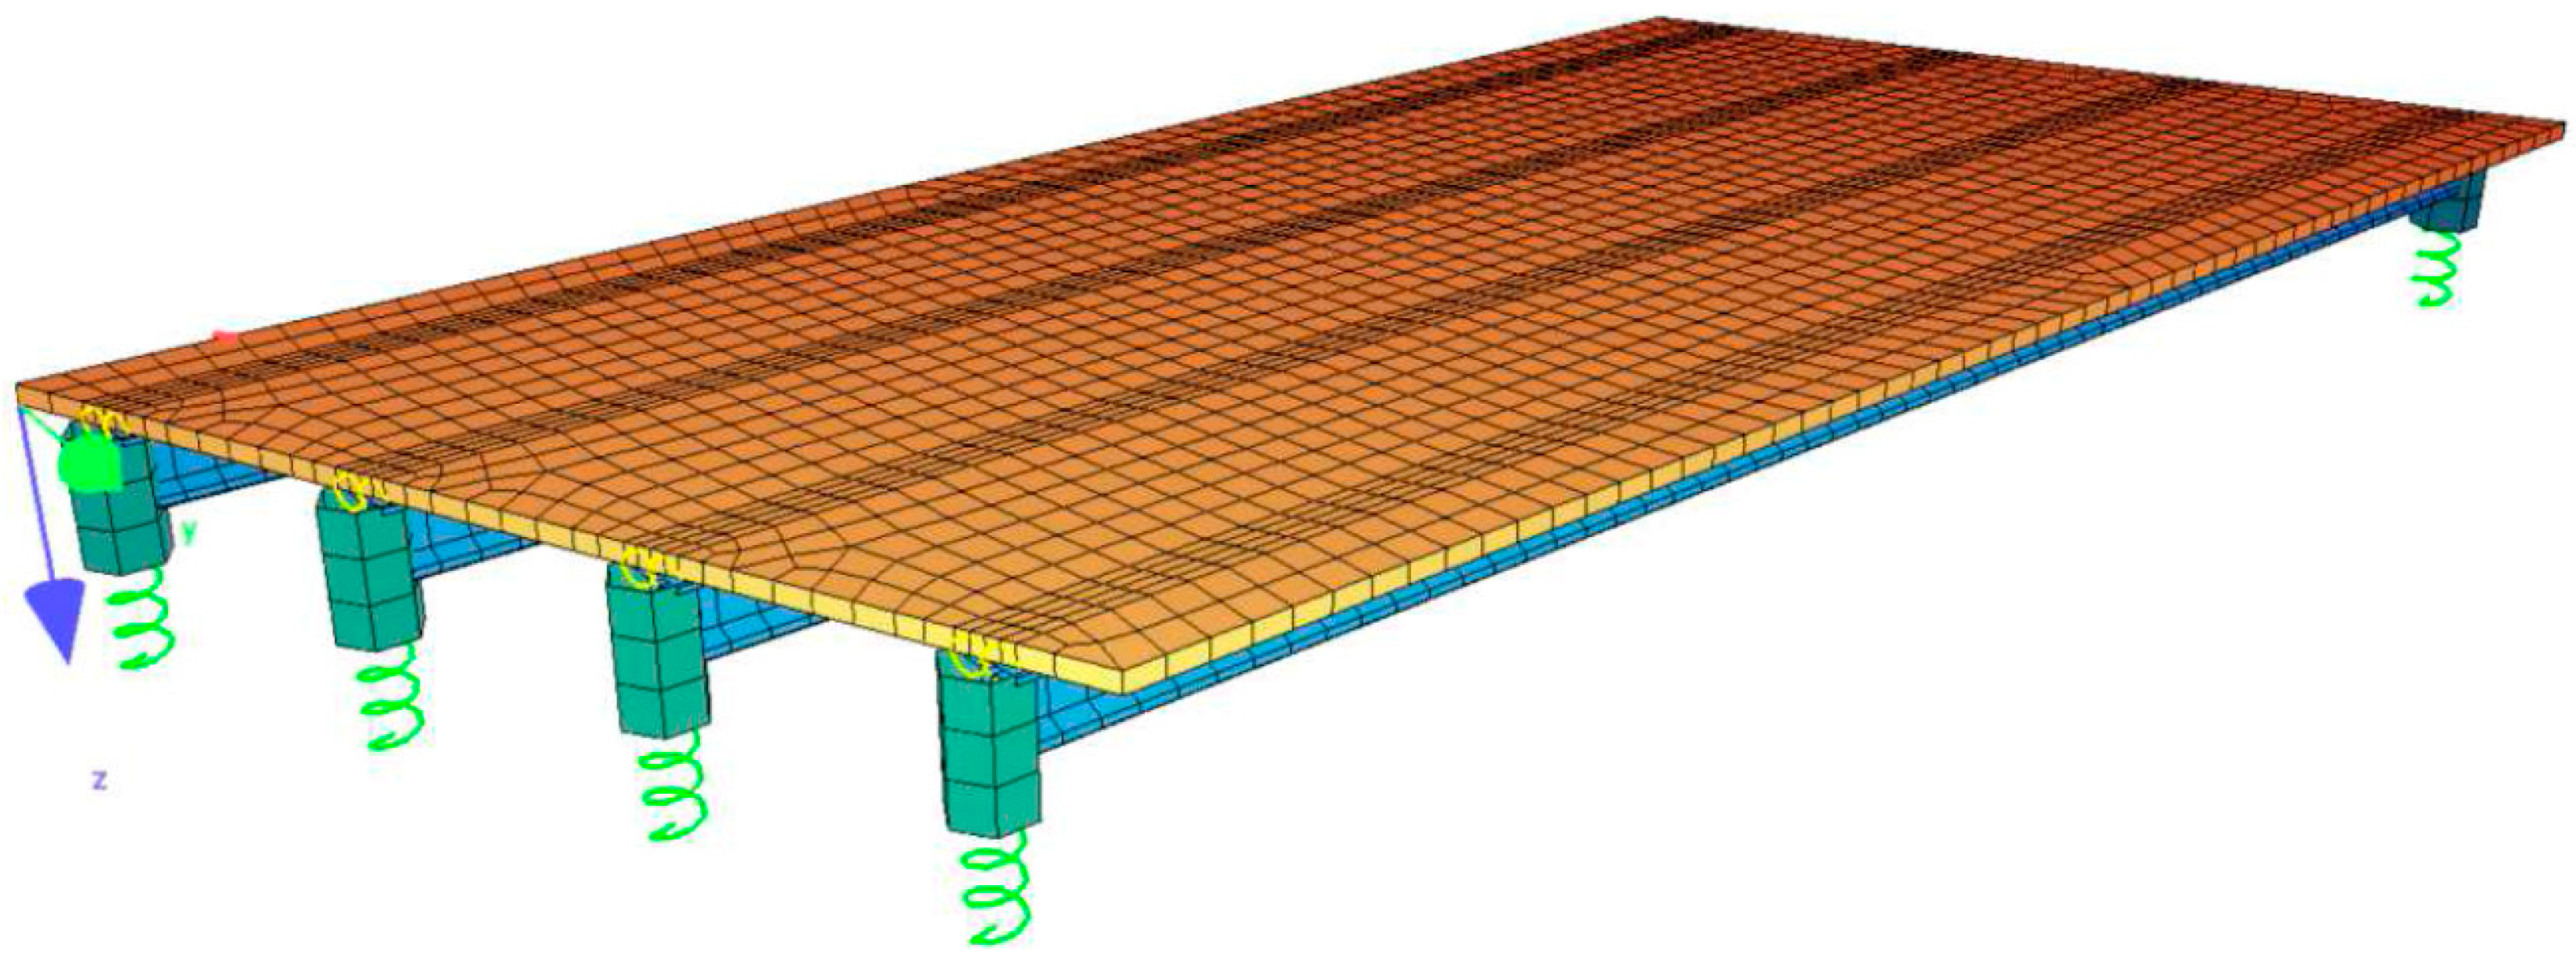
The bending moments and the shear forces in the slab are caused by permanent and live loads which have been estimated by means of a calculation model of the deck carried out in a commercial finite elements code called Sofistik. It is true that this example of a flyover bridge structural design does not take into account the influence of the dynamic loads or fatigue parameters. However, it should not be overlooked that the approach taken in order to assess the sustainability of the use a PFRC in this structure can be a valuable asset to structural designers even if the aforementioned situations have been omitted. As this study is focused on the slab, no exhaustive analysis of the precision of the results obtained in the beams has been carried out. The geometry of the model, together with the boundary conditions of the model, can be seen in Figure 6.
The plate elements are given a thickness equal to the depth of the slab and a characteristic compressive strength of fck,s = 35 MPa, as mentioned above. The beam elements are assigned a cross-section identical to that defined in the structural drawings for girders shown in Figure 5 and a higher quality concrete with fck,g = 50 MPa was chosen. As was stated in previous sections there is not a undisputed evidence about how the presence of fibres influence the modulus of elasticity and the compressive strength of PFRC if compared with plain concrete [19,20]. Consequently, and due to the limited influence that this matter has in the structural application analysed, it has been considered that the behaviour of concrete under compressive stresses for RC and PFRC10 might be considered the same without introducing notable imprecisions. The slab moves jointly with the beam by imposing a master-slave system at the central portion of the upper wing. The beams were supported at the abutments and linear springs were attached to the lower face.
4.2. Results Obtained and Calculation of the Reinforcement
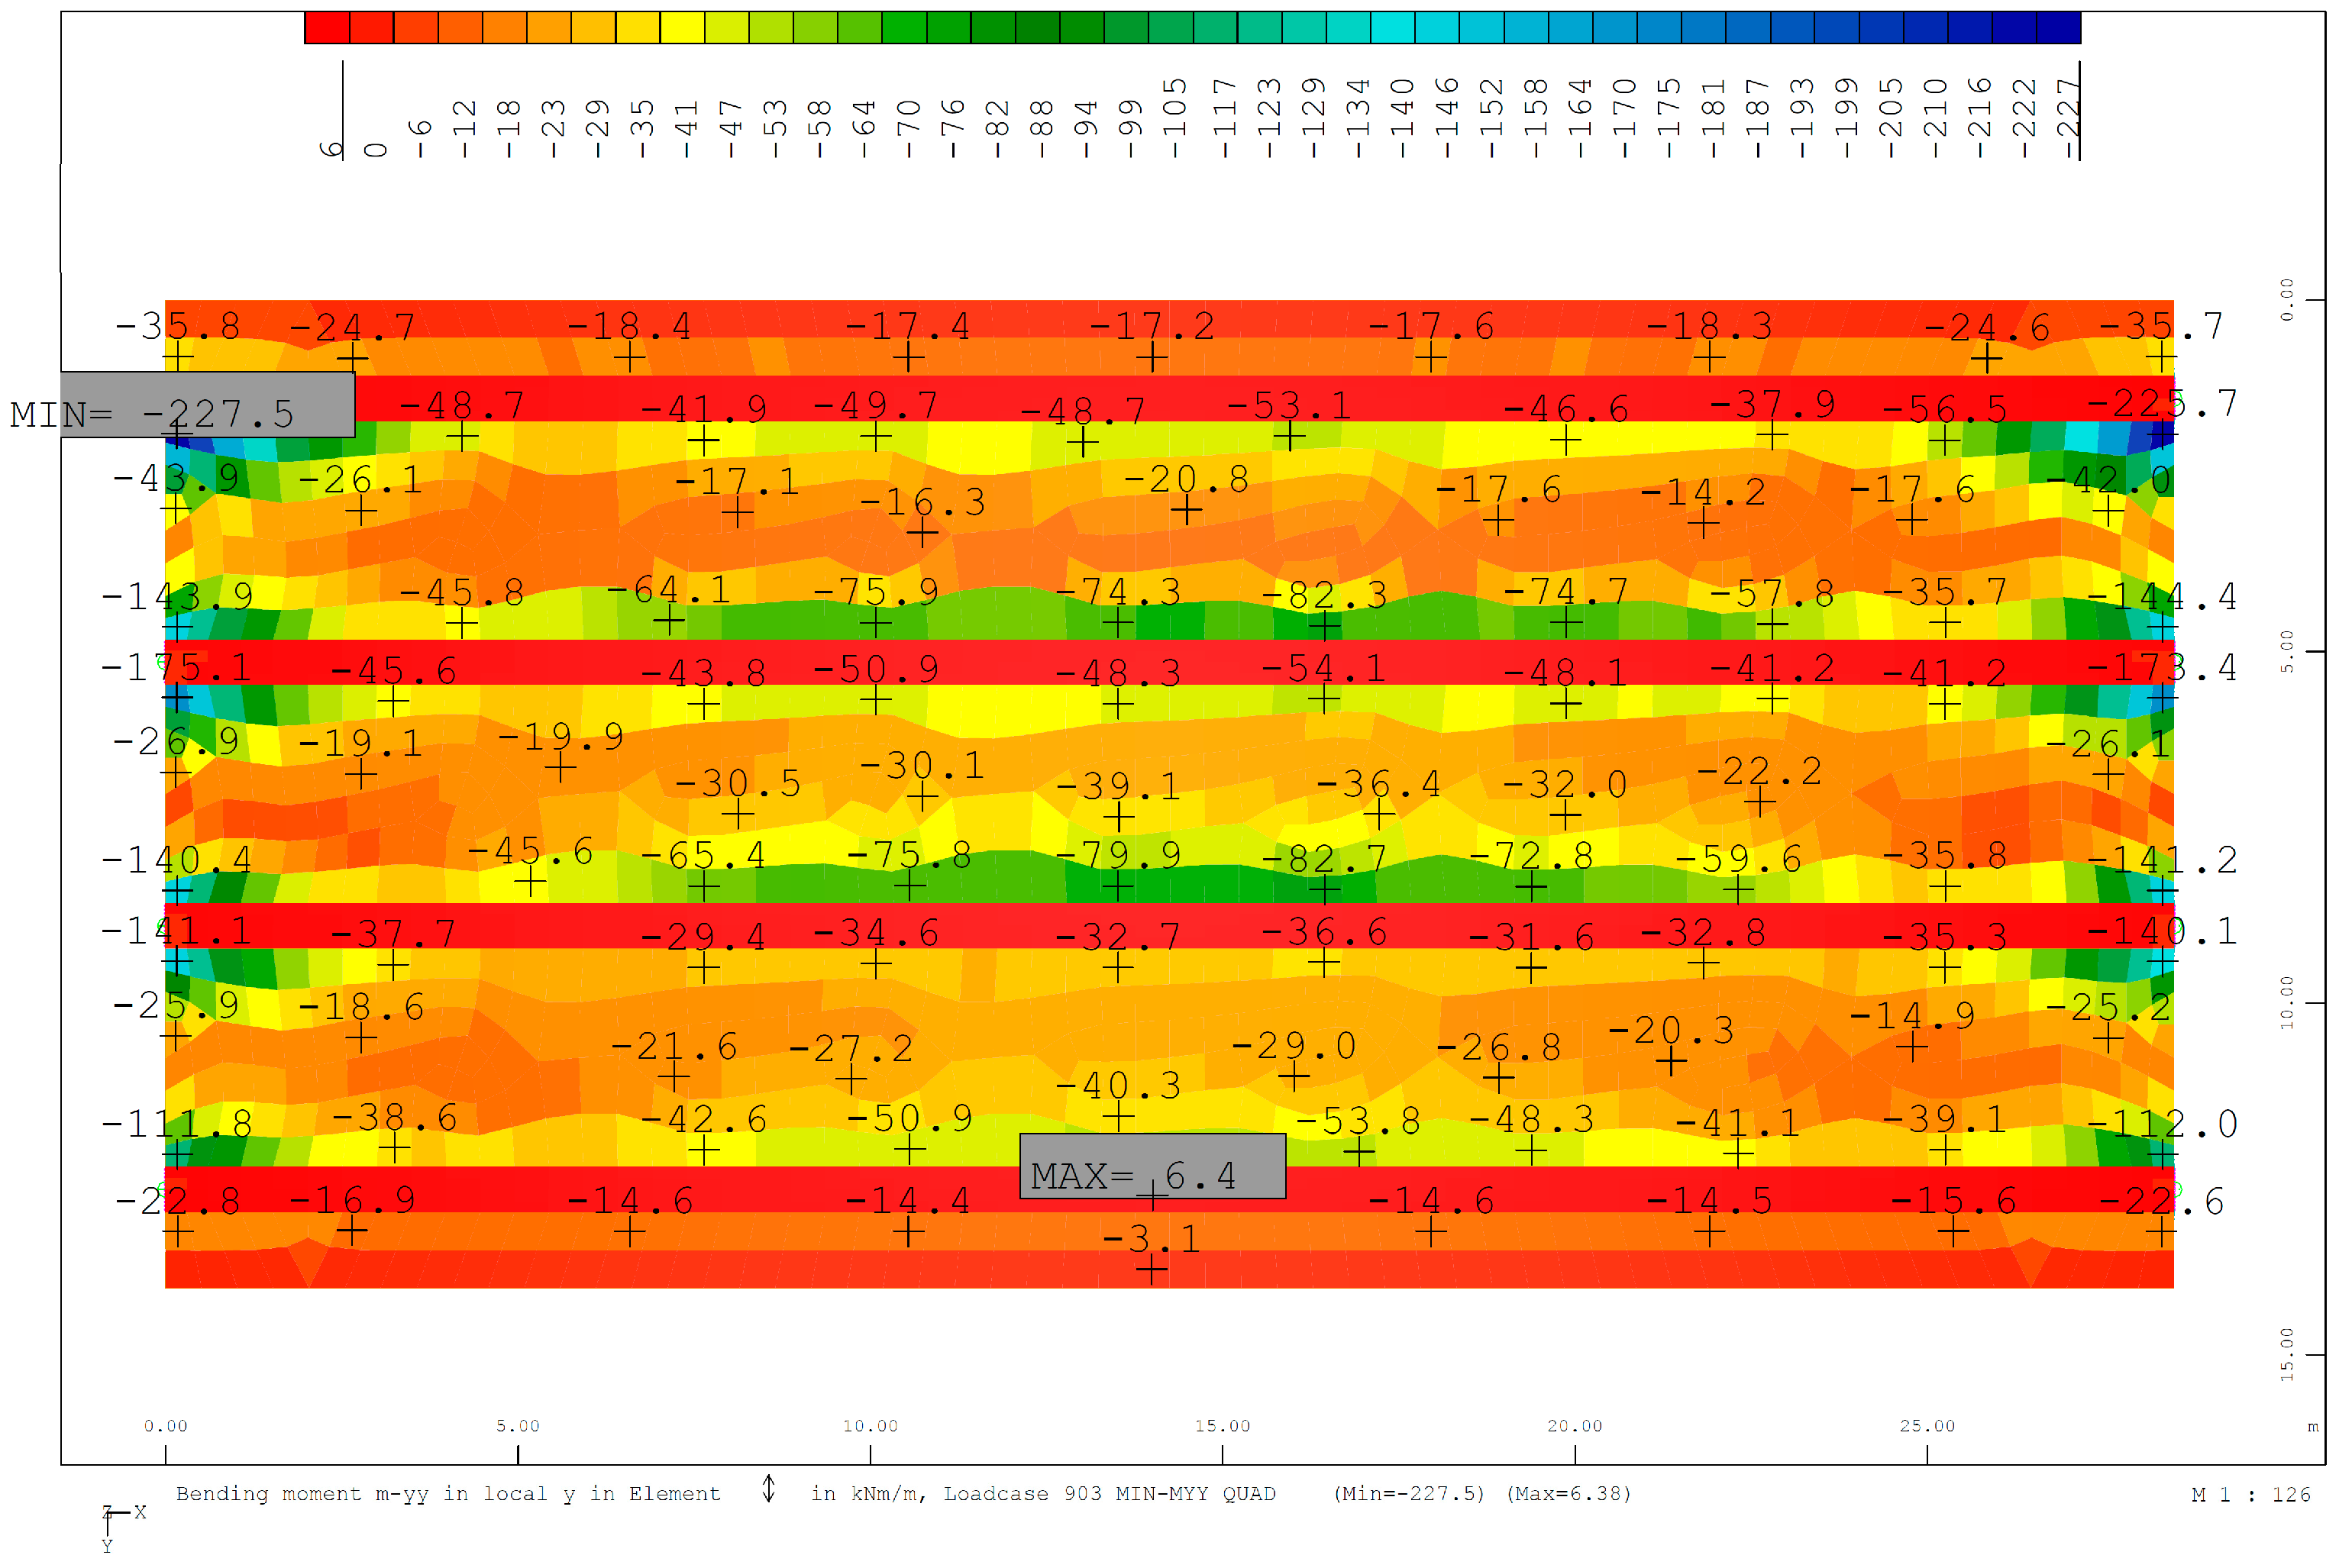
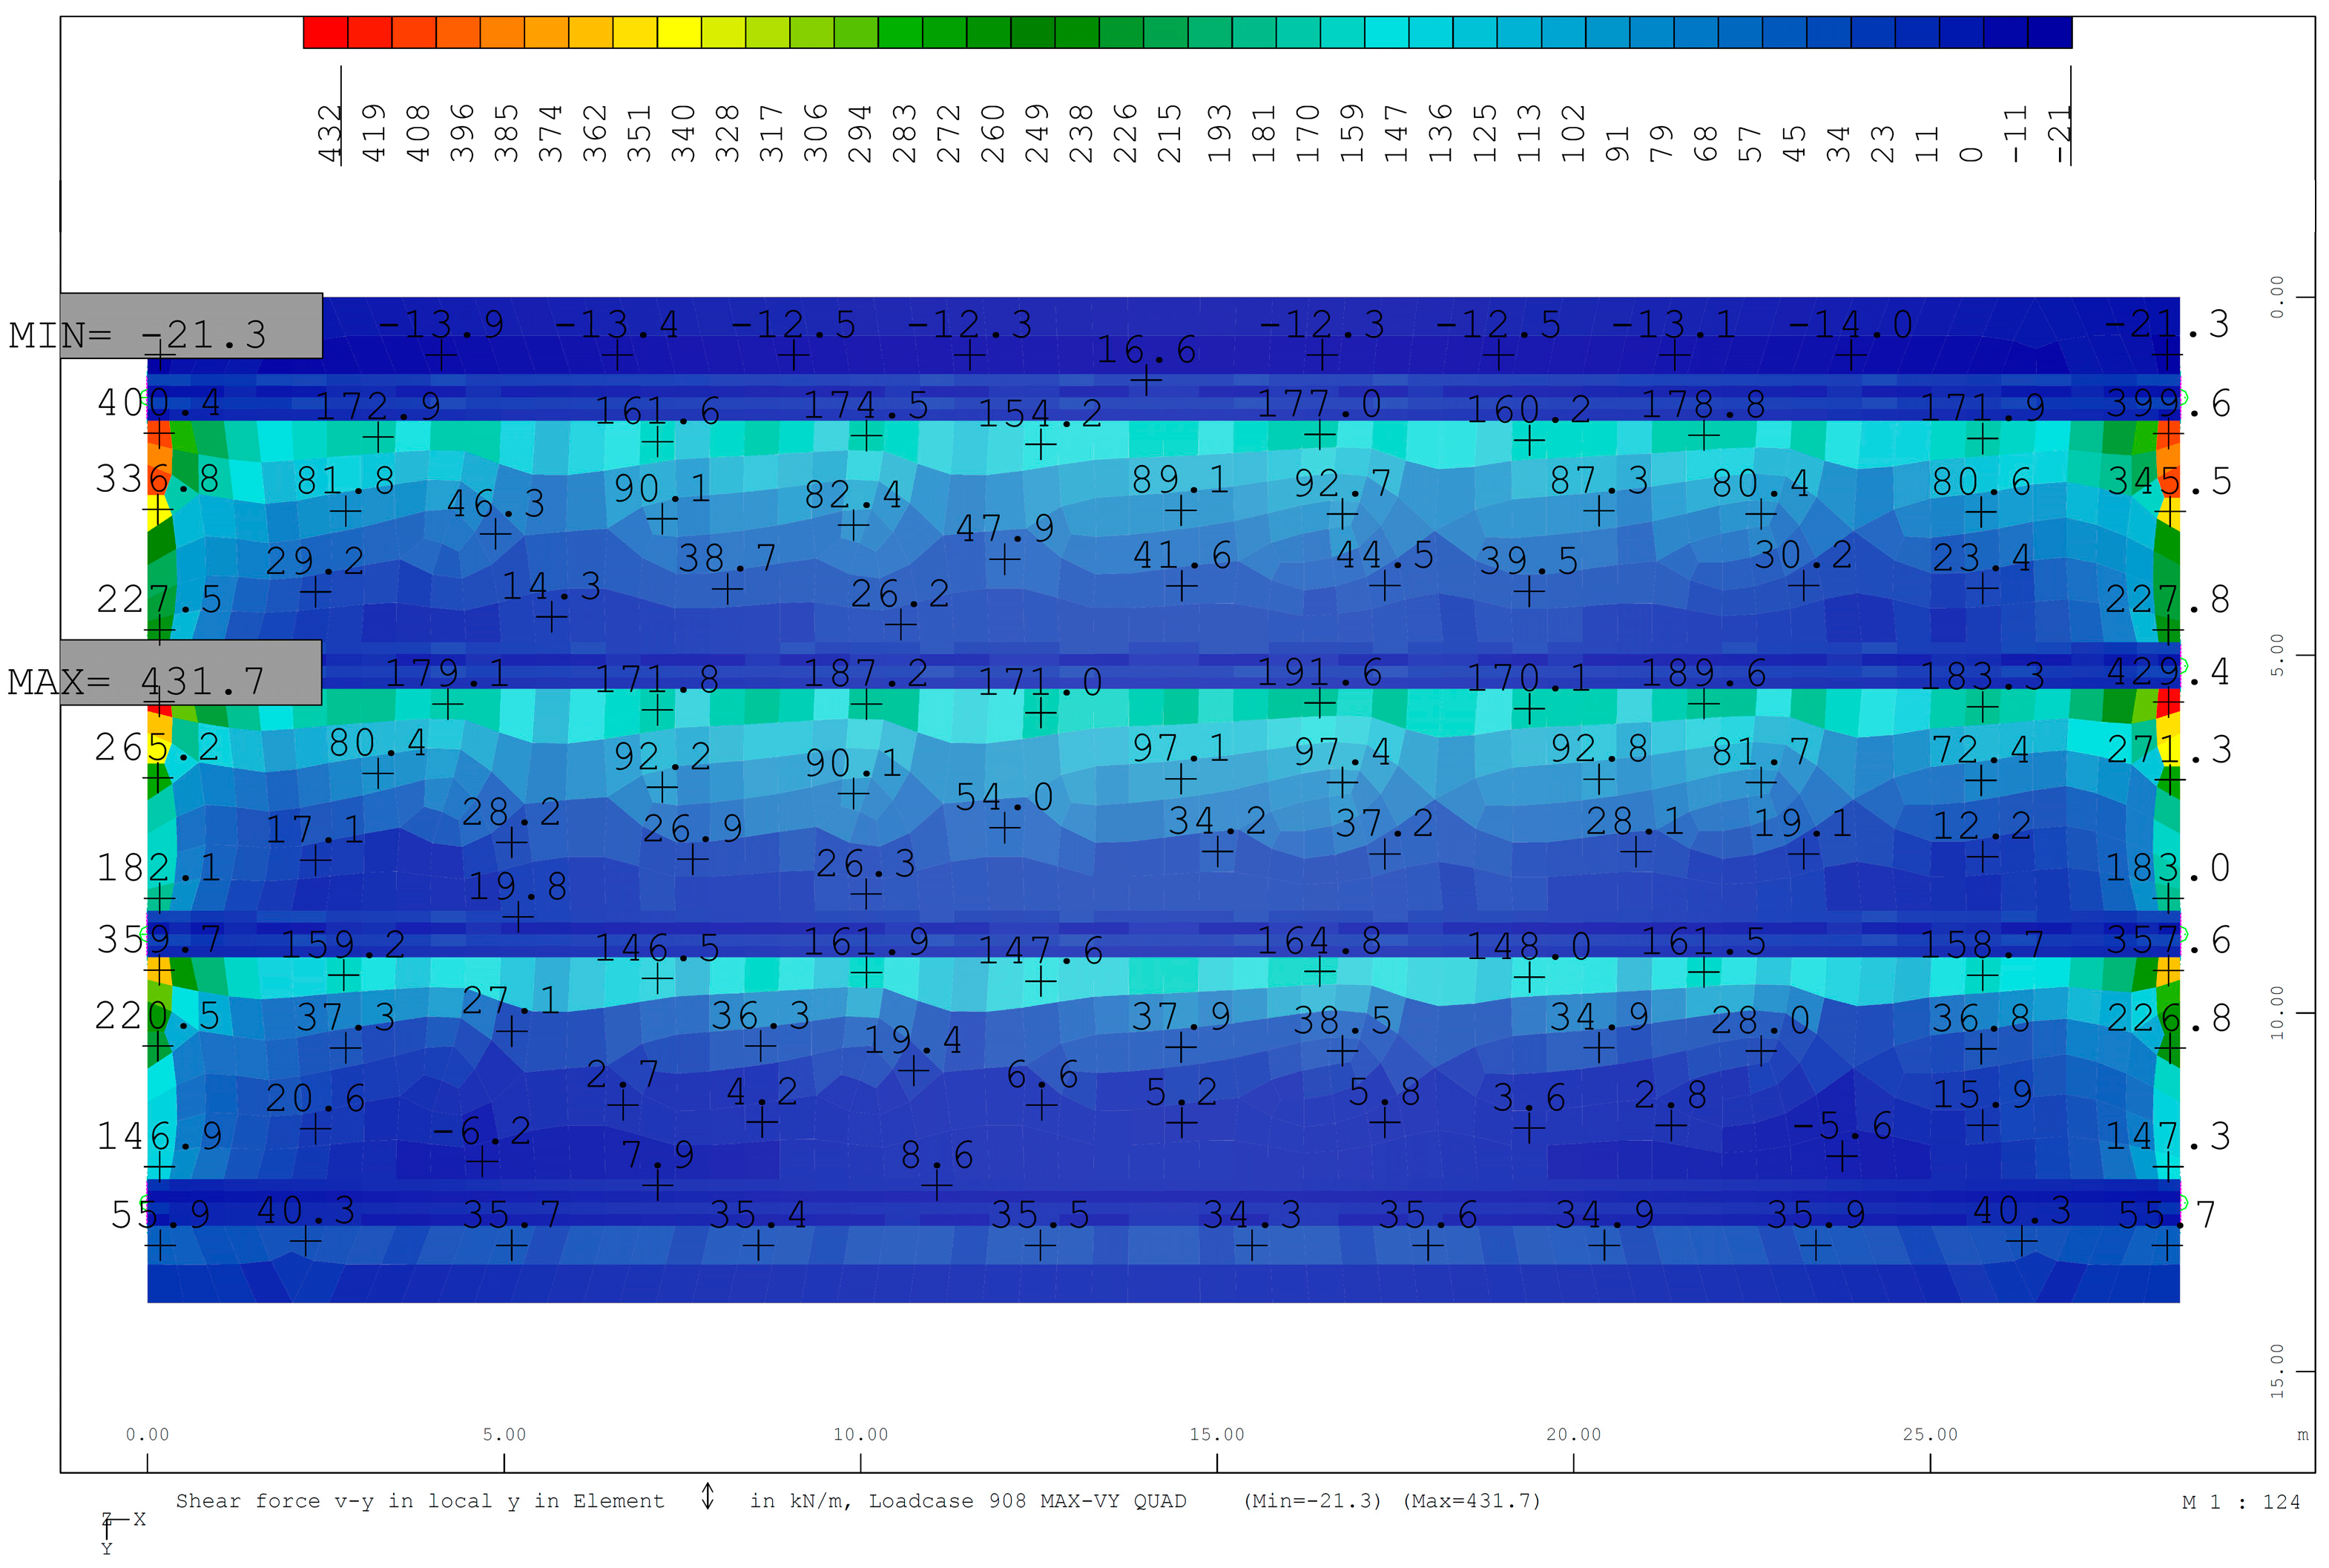
The design moments and shear forces to be borne by the slab are analysed by using the maximum moments and shear forces envelopes. Figure 7 and Figure 8 illustrate the maximum negative bending moments and shear forces in a transversal direction for the orthogonal bridge. Similar images were obtained for the forces, moments and stresses that defined the structural design of the bridge studied.
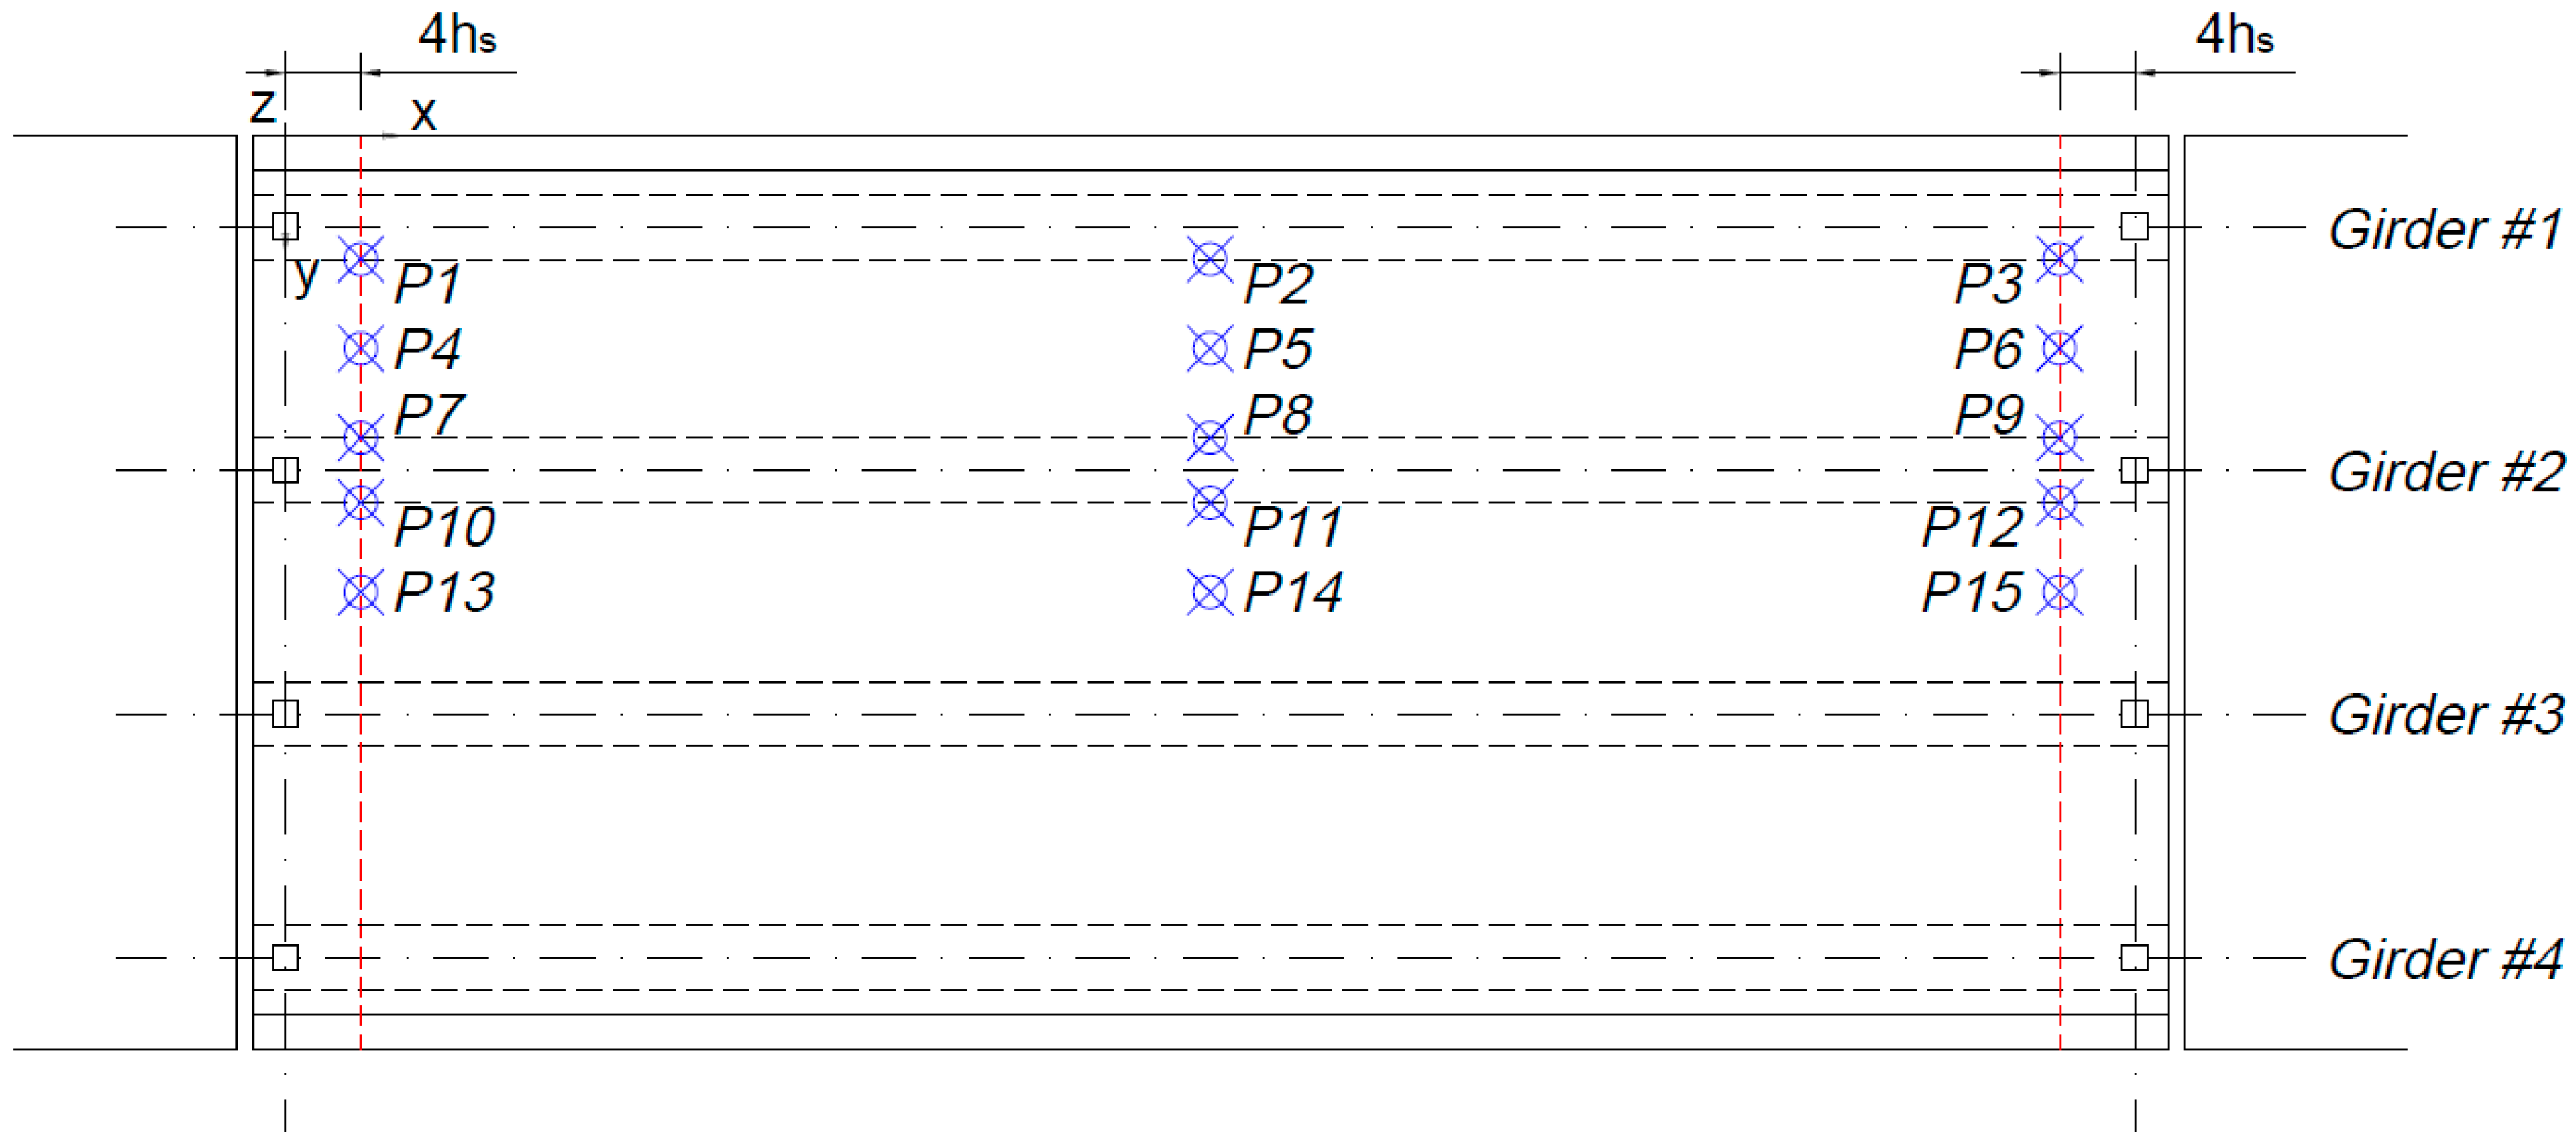
The calculation of the reinforcement has been performed by using the aforementioned envelopes of moments, forces and stresses applied at the 15 points shown in Figure 9. In the case of the reinforcement defined by the positive and negative moments, the commercial configurations of the reinforcing bars can be seen in Table 2. Moreover, the feasible reductions that can be achieved by using a PFRC10 can also be perceived.
Table 2 shows that the presence of 10 kg/m3 of fibres, in most cases, does not change the amount of reinforcement in most of the points analysed. Mainly in the points closest to Girder #2 can a certain reduction of steel bars be noticed. The main difference lies in the increment of the distance of the reinforcement bars which, in the case of points P5, P7 and P9, varies from 15 cm to 20 cm both for positive and negative bending moments. A similar trend is observed in the case of P8 where the distance between bars changes from 20 cm to 30 cm. Regarding P12 for negative moments and P14 for positive moments, it can be seen that a reduction of the diameter of the bars used is also feasible.
When the shear reinforcement is analysed, greater changes could be made when compared with the flexural case previously mentioned. As can be seen in Table 3, the presence of fibres enables elimination of almost all shear reinforcement. The positive influence of the presence of fibres should be noted which, in most cases, are capable of sustaining the stresses borne by the shear stirrups. This change is not only important due to the savings achieved in the material cost, but also because of the reduction of working processes that they involve. In Table 3 VRd,c stands for shear resistance of conventional RC with longitudinal reinforcement and without shear reinforcement, fFtuk is the characteristic value of the ultimate residual strength of FRC, determined by considering an ultimate crack width wu = 1.5 mm, VRd,F is the shear resistance of FRC with longitudinal reinforcement and without shear reinforcement and VRd,s is the contribution of shear reinforcement in shear resistance. Moreover, the shear force is only evaluated at the edges of the girders (calculation points P1–P3 and P97–P12) in order to calculate the deck reinforcement with these values as lower shear forces are between girders.
In order to obtain a definition of the steel-bar reinforcement that could be employed in day-to-day practice, the bridge has been divided into two zones depending on the influence of the support. A central zone of the bridge has been defined at 4.25 m of each of the sides, leaving a central zone of 20 × 14.05 m. The central zone and the sides have been designed by considering the possibility of using different amounts of steel-bar reinforcement, though in these zones the amount of reinforcement will be constant. Taking this into consideration, the total reinforcement per square meter can be seen in Table 4.
5. MIVES Evaluation of the Proposed Bridges
5.1. Description of the MIVES Method
Environmental impact caused by humans has increased ever since the Industrial Revolution. However, the awareness of such impact did not emerge until the second half of the previous century. Since then, several methods of quantifying environmental impact have been developed. For instance, life-cycle assessment (LCA) promotes sustainable development by taking into account the socioeconomic and environmental impact of humans. This was one of the first approaches in examining the impact that humankind inflicts on the environment. Such evaluation is performed by considering environmental inputs, outputs and impact which are evaluated through the life cycle of an infrastructure, buildings or even from parts of them [33,34,35,36,37]. Another approach is termed as life-cycle cost (LCC) [38] which is focused on the financial analysis of the operating and purchasing phases of the subject of study over a period of time. Some others are life-cycle energy (LCE) analysis, material-flow analysis (MFA) and material and energy flow analyses (MEFA). The aforementioned methods are focused on energy consumption, flows and stocks of materials, and the respective energy balances [39,40,41]. These tools are examples of scientific methods used to assess environmental impact [42]. Although some other methods have been developed, at the time of writing there is no method that covers all phases because most are specialised in quantifying specific branches of sustainability, such as the environmental or the economic. Only a few methods are capable of quantifying all the socioeconomic and environmental requirements that permit researchers to derive a global sustainability index. However, some studies have shown that application of some of the methods previously mentioned to infrastructure or even to buildings might be unsuitable [43,44,45].
In addressing this, MIVES has been developed [21]. The method seeks to evaluate the sustainability of the construction sector, assessing the importance of the socioeconomic and environmental impact in order to reduce it and foster environmental awareness. MIVES is considered a multi-criteria decision-making (MCDM) method capable of obtaining global sustainability indices across the construction sector [46,47,48,49,50,51].
This contribution is not dedicated to discussing the insight of MIVES (which can be found in reference [21]), but to applying it to a certain infrastructure. However, it can be summarised as a hierarchical process that can be performed by following several steps. After identifying the problem, it has to be applied to the decision-making diagram and the aspects/variables (either quantitative or qualitative) established. Then, the qualitative or quantitative evaluations have to be transformed into a set of variables with the same unit and scales by applying value functions to them. After this step, the relative weight of each aspect considered in the assessment has to be determined. The various design alternatives that could solve the problem should then be defined. Lastly, such solutions should be evaluated by using the previously created model. Table 5 shows the main parameters considered.
5.2. Discussion of the Case Study
Table 6 shows the partial and final results of each of the indicators. The final score of the conventional solution for the slab, with steel-bar reinforced concrete, received a total score of 71 points out of 100. The conventional construction manner harms the total evaluation of such an option due to the higher cost in human resources and, consequently, in the possible errors that may occur during construction.
Regarding the environmental costs, it should be underlined that the differences in the material consumption lie principally in the reduction of the amount of reinforcement used in the conventional option because the rest of the parameters were considered equal. When the maintenance costs are studied, the longer life cycle of the FRC due to the improved durability has been reflected in the results. It should be highlighted that the life cycle of the fibres of the FRC has been taken from data supplied by the manufacturer of the fibres and considering a correct structural and durability design of the concrete formulation. Nevertheless, the rest of costs related with the construction or maintenance of the infrastructure have been considered equal in both alternatives.
The social costs reflect only a slight variation between the two options in all the aspects related with the maintenance of the bridge which is considered more reduced in the case of the PFRC10 option. By comparing the partial scores of the two options, it could be said that only minor changes were detected when the economic aspects were studied. However, variations of 25% and 33% were shown when the environmental and social aspects, respectively, were contemplated. If all the factors are added by taking into account their respective weights, the final score of the conventional slab is 71 while the one of the PFRC options is 58. Such a difference represents a 22% variation which, as mentioned before, is related mostly with environmental and social aspects. This means that the contractor might not find a clear advantage in employing the PFRC10 option if only the economic balance is considered.
However, the use of MIVES helps to involve more parameters in the decision-making process that might provide a counterweight to the economic factors. In the case studied, if environmental and social aspects are considered together with the economic cost, the option of PFRC10 highlights from the traditional one.
6. Conclusions
The use of a multi-criteria decision-making method based on the value function concept and the seminars delivered by experts such as MIVES has been useful tool in assessing the sustainability of a flyover bridge built with RC or PFRC10.
The MIVES approach to the decision-making process has identified the differences between the options considered, considering not only socioeconomic but also environmental aspects. The evaluation of parameters aside from the economic ones has been a key factor in choosing the PFRC option over the conventional RC one.
While the economic evaluation of the two options differs only by 5%, the environmental and social scores show differences of 33% and 25%. The partial environmental and social scores have shown that slightly higher maintenance costs represent an important impact on the environment and on society if the disturbances generated are considered throughout the life cycle of the infrastructure.
The development and availability of enhanced data basis and life-cycle analysis of construction materials and procedures may supply more accurate results. In addition, the continuous use of MIVES could also supply accepted rules for the seminars provided by experts.
Author Contributions
All the authors have contributed to the whole development of the manuscript: designing the research, performing the calculations, writing the text, participating in the seminars for MIVES, discussing the results and obtaining the conclusions.
Funding
This research was funded by the Ministry of Economy, Industry and Competitiveness of Spain by means of grant number BIA2016-78742-C2-2-R.
Conflicts of Interest
The authors declare no conflict of interest.
References
- Chen, C.; Habert, G.; Bouzidi, Y.; Jullien, A. Environmental impact of cement production: Detail of the different processes and cement plant variability evaluation. J. Clean. Prod. 2010, 18, 478–485. [Google Scholar] [CrossRef]
- Mikulčić, H.; Vujanović, M.; Duić, N. Reducing the CO2 emissions in Croatian cement industry. Appl. Energy 2013, 101, 41–48. [Google Scholar] [CrossRef] [Green Version]
- Benhelal, E.; Zahedi, G.; Shamsaei, E.; Bahadori, A. Global strategies and potentials to curb CO2 emissions in cement industry. J. Clean. Prod. 2013, 51, 142–161. [Google Scholar] [CrossRef]
- China Statistic Yearbook; National Bureau of Statistics of the People’s Republic of China: Beijing, China, 2012.
- He, F.; Zhang, Q.; Lei, J.; Fu, W.; Xu, X. Energy efficiency and productivity change of China’s iron and steel industry: Accounting for undesirable outputs. Energy Policy 2013, 54, 204–213. [Google Scholar] [CrossRef]
- El Fattah, A.A.; Al-Duais, I.; Riding, R.; Thomas, M. Field evaluation of corrosion mitigation on reinforced concrete in marine exposure conditions. Constr. Build. Mater. 2018, 165, 663–674. [Google Scholar] [CrossRef]
- Xu, F.; Xiao, Y.; Wang, S.; Li, W.; Liu, W.; Du, D. Numerical model for corrosion rate of steel reinforcement in cracked reinforced concrete structure. Constr. Build. Mater. 2018, 180, 55–67. [Google Scholar] [CrossRef]
- Thompson, N.; Yunovich, M.; Dunmire, D. Cost of corrosion and corrosion maintenance strategies. Corros. Rev. 2007, 25, 247–262. [Google Scholar] [CrossRef]
- Val, D.V.; Stewart, M.G. Life-cycle cost analysis of reinforced concrete structures in marine environments. Struct. Saf. 2003, 25, 343–362. [Google Scholar] [CrossRef]
- Angulo-Ramírez, D.; de Gutiérrez, R.M.; Puertas, F. Alkali-activated Portland blast-furnace slag cement: Mechanical properties and hydration. Constr. Build. Mater. 2017, 140, 119–128. [Google Scholar] [CrossRef]
- Li, G.; Zhang, A.; Song, A.; Liu, S.; Zhang, J. Ground granulated blast furnace slag effect on the durability of ternary cementitious system exposed to combined attack of chloride and sulfate. Constr. Build. Mater. 2018, 158, 640–648. [Google Scholar] [CrossRef]
- Dalton, J.; Gardner, K.; Seager, T.; Weimer, M.; Spear, J.; Magee, B. Properties of Portland cement made from contaminated sediments. Resour. Conserv. Recycl. 2004, 41, 227–241. [Google Scholar] [CrossRef]
- Aydin, E.; Arel, H.Ş. Characterization of high-volume fly-ash cement pastes for sustainable construction applications. Constr. Build. Mater. 2017, 157, 96–107. [Google Scholar] [CrossRef]
- De Vries, P. Concrete recycled: Crushed concrete aggregate. In Proceedings of the International Conference: Concrete in the Service of Mankind. I. Concrete for Environment Enhancement and Protection, Scotland, UK, 24–26 June 1996; pp. 121–130. [Google Scholar]
- EHE-08. Spanish Structural Concrete Code; Spanish Minister of Public Works: Madrid, Spain, 2008; 720p.
- Fiol, F.; Thomas, C.; Muñoz, C.; Ortega-López, V.; Manso, J. The influence of recycled aggregates from precast elements on the mechanical properties of structural self-compacting concrete. Constr. Build. Mater. 2018, 182, 309–323. [Google Scholar] [CrossRef]
- Hossein, M.; Tahir, M.M. Durability performance of concrete incorporating waste metalized plastic fibres and palm oil fuel ash. Constr. Build. Mater. 2018, 180, 92–102. [Google Scholar]
- Frazão, C.; Camões, A.; Barros, J.; Gonçalves, D. Durability of steel fiber reinforced self-compacting concrete. Constr. Build. Mater. 2015, 80, 155–166. [Google Scholar] [CrossRef] [Green Version]
- Alberti, M.G.; Enfedaque, A.; Gálvez, J.C. On the mechanical properties and fracture behavior of polyolefin fiber-reinforced self-compacting concrete. Constr. Build. Mater. 2014, 55, 274–288. [Google Scholar] [CrossRef]
- Alberti, M.G.; Enfedaque, A.; Gálvez, J.C. Comparison between polyolefin fibre reinforced vibrated conventional concrete and self-compacting concrete. Constr. Build. Mater. 2015, 85, 182–194. [Google Scholar] [CrossRef]
- Pons, O.; de la Fuente, A.; Aguado, A. The use of MIVES as a sustainability assessment MCDM method for architecture and civil engineering applications. Sustainability 2016, 8, 460. [Google Scholar] [CrossRef] [Green Version]
- Fib. Model Code 2010; Fédération Internationale du Béton fib/International Federation for Structural Concrete: Paris, France, October 2013; 434p. [Google Scholar]
- Reyes, E.; Gálvez, J.; Casati, M.; Cendón, D.; Sancho, J.; Planas, J. An embedded cohesive crack model for finite element analysis of brickwork masonry fracture. Eng. Fract. Mech. 2009, 76, 1930–1944. [Google Scholar] [CrossRef] [Green Version]
- Gálvez, J.; Planas, J.; Sancho, J.; Reyes, E.; Cendón, D.; Casati, M. An embedded cohesive crack model for finite element analysis of quasi-brittle materials. Eng. Fract. Mech. 2013, 109, 369–386. [Google Scholar] [CrossRef] [Green Version]
- Sancho, J.; Planas, J.; Cendón, D.; Reyes, E.; Gálvez, J. An embedded crack model for finite element analysis of concrete fracture. Eng. Fract. Mech. 2007, 74, 75–86. [Google Scholar] [CrossRef]
- Zollo, R. Fiber-reinforced concrete: An overview after 30 years of development. Cem. Concr. Compos. 1997, 19, 107–122. [Google Scholar] [CrossRef]
- DBV. Merkblatt Stahlfaserbeton Deutsche Beton Vereins; DBV: Berlin, Germany, 2001. [Google Scholar]
- Guide for the Design and Construction of Fiber-Reinforced Concrete Structures; CNR-DT 204; Consiglio Nazionale delle Riserche: Roma, Italy, 2006.
- Blanco, A.; Pujadas, P.; de la Fuente, A.; Cavalaro, S.; Aguado, A. Application of constitutive models in European codes to RC–FRC. Constr. Build. Mater. 2013, 40, 246–259. [Google Scholar] [CrossRef] [Green Version]
- Di Prisco, M.; Plizzari, G.; Vandewalle, L. Fibre reinforced concrete: New design perspectives. Mater. Struct. 2009, 42, 1261–1281. [Google Scholar] [CrossRef]
- Alberti, M.G.; Enfedaque, A.; Gálvez, J.C.; Reyes, E. Numerical modelling of the fracture of polyolefin fibre reinforced concrete by using a cohesive fracture approach. Compos. Part B Eng. 2017, 111, 200–210. [Google Scholar] [CrossRef]
- Enfedaque, A.; Alberti, M.; Gálvez, J.; Domingo, J. Numerical simulation of the fracture behaviour of glass fibre reinforced cement. Constr. Build. Mater. 2017, 136, 108–117. [Google Scholar] [CrossRef]
- Buyle, M.; Braet, J.; Audenaert, A. Life cycle assessment in the construction sector: A review. Renew. Sustain. Energy Rev. 2013, 26, 379–388. [Google Scholar] [CrossRef]
- Ortiz, O.; Castells, F.; Sonnemann, G. Sustainability in the construction industry: A review of recent developments based on LCA. Constr. Build. Mater. 2009, 23, 8–39. [Google Scholar] [CrossRef]
- ISO 14040. Environmental Management–Life Cycle Assessment–Principles and Framework; International Organization for Standardization ISO: London, UK, 2006; 20p. [Google Scholar]
- European Commission. International Reference Life Cycle Data System (ILCD) Handbook e General Guide for Life Cycle Assessment e Detailed Guidance; Institute for Environment and Sustainability: Ispra, Italy, 2010. [Google Scholar]
- Glass, J.; Dyer, T.; Georgopoulos, C.; Goodier, C.; Paine, K.; Parry, T.; Baumann, H.; Gluch, P. Future use of life-cycle assessment in civil engineering. ICE Construct. Mater 2013, 166, 204–212. [Google Scholar] [CrossRef] [Green Version]
- Asiedu, Y.; Gu, P. Product life cycle cost analysis: State of the art review. Ind. J. Prod. Res. 1998, 36, 883–908. [Google Scholar] [CrossRef]
- Cabeza, F.; Rincón, L.; Vilariño, V.; Castell, G. Life Cycle Assessment (LCA) and life Cycle Energy Analysis (LCEA) of buildings and the building sector: A review. Renew. Sustain. Energy Rev. 2014, 29, 394–416. [Google Scholar] [CrossRef]
- Allesch, A.; Brunner, P. Material flow analysis as a decision support tool for waste management: A literature review. J. Ind. Ecol. 2015, 19, 753–764. [Google Scholar] [CrossRef]
- Liu, L.; Issam, S.; Hermreck, C.; Chong, W. Integrating G2G, C2C and resource flow analysis into life cycle assessment framework: A case of construction steel’s resource loop. Resour. Conserv. Recycl. 2015, 102, 143–152. [Google Scholar]
- Marjaba, G.; Chidiac, S. Sustainability and resiliency metrics for buildings—Critical review. Build. Environ. 2016, 101, 116–125. [Google Scholar] [CrossRef]
- Quale, J.; Eckelman, M.; Williams, K.; Slodits, G. Construction matters: Comparing environmental impacts of building modular and conventional homes in the United States. J. Ind. Ecol. 2012, 16, 243–253. [Google Scholar] [CrossRef]
- Malin, N. Life cycle assessment for whole buildings: Seeking the holy grail. Build. Des. Constr. 2005, 46, 6–11. [Google Scholar]
- Kohler, N.; Moffatt, S. Life-cycle analysis of the built environment. Sustain. Build. Constr. 2003, 26, 17–21. [Google Scholar]
- San-Jose, J.; Garrucho, I. A system approach to the environmental analysis industry of buildings. Build. Environ. 2010, 45, 673–683. [Google Scholar] [CrossRef]
- San-Jose, J.; Cuadrado, J. Industrial building design stage based on a system approach to their environmental sustainability. Constr. Build. Mater. 2010, 24, 438–447. [Google Scholar] [CrossRef]
- Reyes, J.; San-Jose, J.; Cuadrado, J.; Sancibrian, R. Health & Safety criteria for determining the value of sustainable construction projects. Saf. Sci. 2014, 62, 221–232. [Google Scholar]
- San-José, J.T.; Losada, R.; Cuadrado, J.; Garrucho, I. Approach to the quantification of the sustainable value in industrial buildings. Build. Environ. 2007, 42, 3916–3923. [Google Scholar] [CrossRef]
- Pardo-Bosch, F.; Aguado, A. Investment priorities for the management of hydraulic structures. Struct. Infrastruct. Eng. 2015, 11, 1338–1351. [Google Scholar] [CrossRef] [Green Version]
- De la Fuente, A.; Armengou, J.; Pons, O.; Aguado, A. Multi-criteria decision-making model for assessing the sustainability index of wind-turbine support systems: Application to a new precast concrete alternative. J. Civ. Eng. Manag. 2017, 23, 194–203. [Google Scholar] [CrossRef]
Figure 1.
Outlook of the polyolefin fibres used. (a) Single fibre, (b) general outlook.

Figure 2.
Fracture test configuration EN-14651.

Figure 3.
Fracture curves implemented in the structural design with PFRC10.

Figure 4.
Front and top view of the studied bridge.

Figure 5.
Cross-section of the studied bridge.

Figure 6.
Numerical model of the bridge.

Figure 7.
Envelope of negative bending moment in transversal direction for the orthogonal bridge.

Figure 8.
Envelope of shear forces in transversal direction for the orthogonal bridge.

Figure 9.
Points where the amount of steel bar reinforcement has been analysed.


Table 1.
Characteristics of the fibres used in the present study.
| Density (kg/m3) | Length (mm) | Equivalent Diameter (mm) | Tensile Strength (MPa) | Elastic Modulus (GPa) | Fibres Per kg | Ultimate Strain (%) |
|---|---|---|---|---|---|---|
| 910 | 60 | 0.903 | 400 | 9 | 27,000 | 20 |
Table 2.
Reinforcement design for RC and PFRC based on bending moments.
| Design Case: M+yy | Design Case: M−yy | |||||||
|---|---|---|---|---|---|---|---|---|
| Calc. Point | M+yy,max (mkN/m) | RC | PFRC 10 | M−yy,max (mkN/m) | RC | PFRC 10 | ||
| Reinforcement | Reduction Feasible? | Reinforcement | Reinforcement | Reduction Feasible? | Reinforcement | |||
| P1 | 80.5 | Ø16 @ 20 cm | - | - | −160.0 | Ø20 @ 15 cm | - | - |
| P2 | 57.8 | Ø16 @ 30 cm | - | - | −51.7 | Ø16 @ 30 cm | - | - |
| P3 | 83.0 | Ø16 @ 20 cm | - | - | −163.2 | Ø20 @ 15 cm | - | - |
| P4 | 86.2 | Ø16 @ 20 cm | - | - | −36.3 | Ø16 @ 30 cm | - | - |
| P5 | 90.4 | Ø16 @ 15 cm | Yes | Ø16 @ 20 cm | −20.8 | Ø16 @ 30 cm | - | - |
| P6 | 86.8 | Ø16 @ 20 cm | - | - | −42.0 | Ø16 @ 30 cm | - | - |
| P7 | 105.3 | Ø16 @ 15 cm | Yes | Ø16 @ 20 cm | −101.7 | Ø16 @ 15 cm | Yes | Ø16 @ 20 cm |
| P8 | 68.7 | Ø16 @ 20 cm | Yes | Ø16 @ 30 cm | −76.8 | Ø16 @ 20 cm | Yes | Ø16 @ 30 cm |
| P9 | 102.9 | Ø16 @ 15 cm | Yes | Ø16 @ 20 cm | −98.1 | Ø16 @ 15 cm | Yes | Ø16 @ 20 cm |
| P10 | 59.5 | Ø16 @ 30 cm | - | - | −114.3 | Ø16 @ 15 cm | - | - |
| P11 | 87.2 | Ø16 @ 20 cm | - | - | −51.5 | Ø16 @ 30 cm | - | - |
| P12 | 60.7 | Ø16 @ 20 cm | Yes | Ø16 @ 30 cm | −118.5 | Ø20 @ 20 cm | Yes | Ø16 @ 15 cm |
| P13 | 86.9 | Ø16 @ 20 cm | - | - | −22.9 | Ø16 @ 30 cm | - | - |
| P14 | 120.8 | Ø20 @ 20 cm | Yes | Ø16 @ 15 cm | −36.5 | Ø16 @ 30 cm | - | - |
| P15 | 87.1 | Ø16 @ 20 cm | - | - | −26.1 | Ø16 @ 30 cm | - | - |
Table 3.
Reinforcement design for RC and PFRC based on shear forces.
| Design Case: Vyy (PFRC) | |||||||||
|---|---|---|---|---|---|---|---|---|---|
| Calc. Point | |Vyy,max| (kN/m) | Longitudinal Reinforcement | RC | PFRC 10 | |||||
| VRd,c (kN/m) | VRd,s (kN/m) | Reinforcement ([cm2/m]/mL) | fFtuk (MPa) | VRd,F (kN/m) | VRd,s (kN/m) | Reinforcement ([cm2/m]/mL) | |||
| P1 | 211.2 | Ø20 @ 15 cm | 162.7 | 48.4 | 2.4 | 0.355 | 211.2 | - | No reinforc. |
| P2 | 168.6 | Ø16 @ 30 cm | 111.7 | 56.8 | 2.7 | 0.728 | 168.6 | - | No reinforc. |
| P3 | 216.8 | Ø20 @ 15 cm | 162.7 | 54.1 | 2.6 | 0.409 | 216.8 | - | No reinforc. |
| P7 | 212.1 | Ø16 @ 20 cm | 140.8 | 71.3 | 3.4 | 1.104 | 214.1 | - | No reinforc. |
| P8 | 190.0 | Ø16 @ 30 cm | 127.9 | 62.1 | 3.0 | 1.147 | 188.9 | 1.1 | 0.1 |
| P9 | 208.6 | Ø16 @ 20 cm | 140.8 | 67.8 | 3.3 | 1.000 | 208.6 | - | No reinforc. |
| P10 | 224.3 | Ø16 @ 15 cm | 140.8 | 83.5 | 4.0 | 0.911 | 224.3 | - | No reinforc. |
| P11 | 181.8 | Ø16 @ 30 cm | 111.7 | 70.1 | 3.4 | 0.991 | 181.8 | - | No reinforc. |
| P12 | 228.7 | Ø16 @ 15 cm | 147.9 | 80.9 | 3.9 | 0.985 | 228.7 | - | No reinforc. |
Table 4.
Amount of reinforcement chosen for the two zones of the bridge (kg/m2).
| Reinforced Concrete | PFRC 10 | |||||||
|---|---|---|---|---|---|---|---|---|
| Bending | Stress | Shear | Stress | Bending | Stress | Shear | Stress | |
| Centre | 8.6 | M+ | 2.3 | Vyy | 7.5 | M+ | 0 | Vyy |
| Sides | 8.1 | M+ | 2.9 | Vyy | 7.2 | M+ | 0.2 | Vyy |
| Centre | 6.1 | M− | 2.3 | Vyy | 5.7 | M− | 0 | Vyy |
| Sides | 9.7 | M− | 2.9 | Vyy | 8.9 | M− | 0.2 | Vyy |
| Partial reinforcement | 15.6 | 5.0 | 14.1 | 0.1 | ||||
| Total reinforcement | ρ | 20.6 | ρ | 14.2 | ||||
Table 5.
Requirements tree and weights.
| Requirement | (R. Weights) | Criteria | (C. Weights) | Indicators | (I. Weights) | |
|---|---|---|---|---|---|---|
| R1. Economic | 50% | C1 Total costs. Direct + Indirect | 40% | I1 Total costs including construction time | 100% | 100% |
| C2 Quality | 10% | I2 Non-quality costs | 100% | 100% | ||
| C3 Dismantling | 10% | I3 Dismantling costs | 100% | 100% | ||
| C4 Service-life | 40% | I4 Cost of service. Maintenance. Energy. Change of use. | 80% | 100% | ||
| I5 Resilience. Risk of disaster × cost of reconstruction + lack of use | 20% | |||||
| 100% | ||||||
| R2. Environmental | 30% | C5 Material consumption at construction time | 20% | I6 Cement | 25% | 100% |
| I7 Aggregates | 10% | |||||
| I8 Reinforcement (steel mesh, steel fibres and polyolefin fibres) | 15% | |||||
| I9 Water | 25% | |||||
| I10 Auxiliary Materials | 15% | |||||
| I11 Reused Material | 10% | |||||
| C5 Material consumption for maintenance | 20% | I6 Cement | 25% | 100% | ||
| I7 Aggregates | 10% | |||||
| I8 Reinforcement (steel mesh, steel fibres, polyolefin fibres) | 15% | |||||
| I9 Water | 25% | |||||
| I10 Auxiliary materials | 15% | |||||
| I11 Reused material | 10% | |||||
| C6 Emissions at construction time | 20% | I12 Global warming potential | 80% | 100% | ||
| I13 Total waste | 20% | |||||
| C6 Emissions for maintenance | 20% | I12 Global warming potential | 80% | 100% | ||
| I13 Total waste | 20% | |||||
| C7 Energy | 20% | I14 Embodied energy | 20% | 100% | ||
| I15 Construction energy | 40% | |||||
| I16 Service and maintenance energy | 40% | |||||
| 100% | ||||||
| R3. Social | 20% | C8 Third parties | 50% | I17 Comfort. Thermal, air and, among others, noise. | 10% | 100% |
| I18 Noise pollution. Construction | 15% | |||||
| I19 Particles pollution. Construction | 15% | |||||
| I20 Traffic disturbances. Construction | 15% | |||||
| I18 Noise pollution. Maintenance | 15% | |||||
| I19 Particles pollution. Maintenance | 15% | |||||
| I20 Traffic disturbances. Maintenance | 15% | |||||
| C9 Risks | 50% | I21 Health and safety during construction | 40% | 100% | ||
| I22 Health and safety during maintenance | 40% | |||||
| I23 Occupant safety. Risk of Disaster x cost of life disruption | 20% | |||||
| 100% | 100% |
Table 6.
Results of the MIVES application.
| Steel Mesh | Polyolefin Fibres | |||||||
|---|---|---|---|---|---|---|---|---|
| REQUIREMENT | Score * Rweights | Score * Cweights | Score * Iweights | Score (0–100) | Score * Rweights | Score * Cweights | Score * Iweights | Score (0–100) |
| R1. Economic | 35.39 | 33.71 | 84.28 | 84 | 28.28 | 21.74 | 54.34 | 54 |
| 4.54 | 45.40 | 45 | 3.28 | 32.82 | 33 | |||
| 8.00 | 80.00 | 80 | 7.00 | 70.00 | 70 | |||
| 24.53 | 48.00 | 60 | 24.53 | 48.00 | 60 | |||
| 13.33 | 67 | 13.33 | 67 | |||||
| R2. Environmental | 21.15 | 17.55 | 10.20 | 41 | 15.87 | 13.71 | 10.20 | 41 |
| 5.67 | 57 | 5.67 | 57 | |||||
| 61.74 | 412 | 42.54 | 284 | |||||
| 7.34 | 29 | 7.34 | 29 | |||||
| 2.81 | 19 | 2.81 | 19 | |||||
| 0.00 | 0 | 0.00 | 0 | |||||
| 8.72 | 10.42 | 42 | 4.36 | 5.21 | 21 | |||
| 4.93 | 49 | 2.47 | 25 | |||||
| 12.35 | 82 | 6.17 | 41 | |||||
| 6.51 | 26 | 3.26 | 13 | |||||
| 9.38 | 63 | 4.69 | 31 | |||||
| 0.00 | 0 | 0.00 | 0 | |||||
| 15.12 | 57.60 | 72 | 10.42 | 39.69 | 50 | |||
| 18.00 | 90 | 12.40 | 62 | |||||
| 15.12 | 57.60 | 72 | 10.42 | 39.69 | 50 | |||
| 18.00 | 90 | 12.40 | 62 | |||||
| 14.00 | 20.00 | 100 | 14.00 | 20.00 | 100 | |||
| 40.00 | 100 | 40.00 | 100 | |||||
| 10.00 | 25 | 10.00 | 25 | |||||
| R3. Social | 14.90 | 36.50 | 10.00 | 100 | 14.22 | 34.70 | 10.00 | 100 |
| 15.00 | 100 | 15.00 | 100 | |||||
| 15.00 | 100 | 15.00 | 100 | |||||
| 15.00 | 100 | 15.00 | 100 | |||||
| 6.00 | 40 | 4.80 | 32 | |||||
| 6.00 | 40 | 4.80 | 32 | |||||
| 6.00 | 40 | 4.80 | 32 | |||||
| 38.00 | 40.00 | 100 | 36.40 | 40.00 | 100 | |||
| 16.00 | 40 | 12.80 | 32 | |||||
| 20.00 | 100 | 20.00 | 100 | |||||
| 71 | Total | 58 | Total | |||||
© 2018 by the authors. Licensee MDPI, Basel, Switzerland. This article is an open access article distributed under the terms and conditions of the Creative Commons Attribution (CC BY) license (http://creativecommons.org/licenses/by/4.0/).
Share and Cite
MDPI and ACS Style
Enfedaque, A.; Alberti, M.G.; Gálvez, J.C.; Rivera, M.; Simón-Talero, J.M. Can Polyolefin Fibre Reinforced Concrete Improve the Sustainability of a Flyover Bridge? Sustainability 2018, 10, 4583. https://doi.org/10.3390/su10124583
AMA Style
Enfedaque A, Alberti MG, Gálvez JC, Rivera M, Simón-Talero JM. Can Polyolefin Fibre Reinforced Concrete Improve the Sustainability of a Flyover Bridge? Sustainability. 2018; 10(12):4583. https://doi.org/10.3390/su10124583
Chicago/Turabian StyleEnfedaque, Alejandro, Marcos G. Alberti, Jaime C. Gálvez, Marino Rivera, and José M. Simón-Talero. 2018. "Can Polyolefin Fibre Reinforced Concrete Improve the Sustainability of a Flyover Bridge?" Sustainability 10, no. 12: 4583. https://doi.org/10.3390/su10124583
Note that from the first issue of 2016, this journal uses article numbers instead of page numbers. See further details here.