Sustainable Queuing-Network Design for Airport Security Based on the Monte Carlo Method


1
College of Systems Engineering, National University of Defense Technology, Changsha 410073, Hunan, China
2
State Key Laboratory of Complex System Simulation, Beijing Institute of System Engineering, 10 An Xiang Bei Li Road, Beijing 100101, China
*
Author to whom correspondence should be addressed.
Sustainability 2018, 10(2), 1; https://doi.org/10.3390/su10020001
Submission received: 4 January 2018
/
Revised: 14 January 2018
/
Accepted: 16 January 2018
/
Published: 23 January 2018
(This article belongs to the Section Economic and Business Aspects of Sustainability)
Abstract
:The design of airport queuing networks is a significant research field currently for researchers. Many factors must to be considered in order to achieve the optimized strategies, including the passenger flow volume, boarding time, and boarding order of passengers. Optimizing these factors lead to the sustainable development of the queuing network, which currently faces a few difficulties. In particular, the high variance in checkpoint lines can be extremely costly to passengers as they arrive unduly early or possibly miss their scheduled flights. In this article, the Monte Carlo method is used to design the queuing network so as to achieve sustainable development. Thereafter, a network diagram is used to determine the critical working point, and design a structurally and functionally sustainable network. Finally, a case study for a sustainable queuing-network design in the airport is conducted to verify the efficiency of the proposed model. Specifically, three sustainable queuing-network design solutions are proposed, all of which not only maintain the same standards of security, but also increase checkpoint throughput and reduce passenger waiting time variance.
1. Introduction
With the rapid growth of the population and economy, the queuing networks of airports and stations are of great importance and require urgent optimization. However, the complex situations in airport security make the process more challenging because of the following: (1) Network chaos, such as congestion due to insufficient network capacity, delays in boarding because of inadequate sequencing, and repeated confusion in security operations; (2) Consequential outcomes, such as incurred higher costs by passengers and businesses, longer waiting time and unfriendly atmosphere of the queuing network, and increased accidents because of unorganized queuing personnel. These problems and contradictions are incompatible with today’s sustainable economy and the concept of sustainable development. Therefore, the motivation of this research is to find sustainable solutions to these aforementioned problems.
As a result, a sustainable queuing network, different from previous networks, is proposed. In general, a sustainable queuing network is less costly, has a better operating procedure, and most importantly, passenger waiting time is shorter and user experience is improved. A sustainable network is beneficial not only for passengers, but also for aircraft and train operators as it is an excellent way to increase their profits. Hence, a research on a sustainable queuing network is significant.
Queuing network was applied in many aspects. Gelenbe and Pujolle [1] made a study in a general queuing network with its single queue behavior. Perros [2] discussed Blocking and Feedback with a symmetrical exponential open queue network, and the approximate expression of queue-length probability distribution was mainly considered. Basharin and Tolmachev [3] applied queuing networks theory to model information-computing systems and defined characteristic properties of computing systems networks. Jun and Perros [4] proposed a good error-level algorithm for open tandem queuing networks by using an approximate analysis. Tsybakov and Georganas [5] elevated multi-queue system with finite capacity by deriving the asymptotic optimality of the queue service probability. Gurvich and Whitt [6] built a diminishing-returns property of flexibility to make the call center as efficient as a single-pool system as the total arrival rate increases.
Recently, there have been many studies on queuing optimization. Federgruen and Groenevelt [7] made a study on general (single facility) queuing systems with exponential service times, dealing with a finite number of distinct customer classes. Miller [8] considered the problem of access and service rate control in queuing systems as a general optimization problem for controlled Markov process with finite state space. To minimize the expected cost of the system, Lin and Ke [9] used the genetic algorithm to find the best thresholds of queue length in activating servers and their corresponding service rate. With the advancement of theoretical research, some new analytical methods have been put forward constantly. Xia [10] and Cao [11] established a difference equation of the customer-average performance in closed networks with exponentially distributed service times and state-dependent service rates, which provided a new perspective of performance optimization of queuing systems. Combined with theoretical research, some application examples were analyzed. A method for optimizing and coordinating people queues was proposed by Barajas and Harrington [12], which further included querying at least one queuing system to determine wait times associated with performing the tasks. Hess [13] demonstrated application of the queuing theory in modelling a port’s bulk cargo unloading terminal and Zhu [14] conducted the study on modeling and multi-objective optimization for quick pass system in an amusement park. A new technique was proposed to optimize the functions of fuzzy profit of queuing models by Pardo [15]. Ya-Qing [16] developed a physical examination queuing system, effectively shortening waiting time of the subjects and the doctors. There have also been some studies on airport queuing. Parlar [17] proposed a multi-counter queuing model with a special type of arrival process reflecting reality from the population of passengers booked for the flight and the main feature [18] was the use of empirical data collected at the Singapore Changi Airport.
Through research, it was found that the modeling and solving of the previous queuing optimization of passengers is more complicated. Therefore, Monte Carlo Method was used in this study to model and solve problems of airport-sustainable networks. Monte Carlo Method is often used in system optimization. Dubi [19] suggested a methodology that led to a satisfactory and viable solution to the problem in a very general sense with the Monte Carlo Method. Kushner and Yang [20] developed an effective Monte Carlo Method for obtaining good estimators of systems sensitivities with respect to system parameters. In addition, Monte Carlo method is often cited to form optimization method innovation. Sorella [21] introduced an appropriate iterative scheme for the minimization of the energy, based on the variational Monte Carlo (VMC) technique. To overcome the biases coming from the assumed variational form of the wave functions, Tahara and Imada [22] extensively improved variational wave functions with variational Monte Carlo (VMC) Method. Zhu and Li [23] combined the attractive features of evolutionary algorithm and Markov Chain Monte Carlo into a new Differential Evolutionary Markov Chain Monte Carlo (DE-MCMC) Method for multi-objective optimization problems with continuous variables. Besides, Monte Carlo Method is widely used to solve practical problems. Xu [24] employed Monte Carlo Method to simulate the queuing behaviors in banks. Beck [25] presented a method for determining the stationary phase points for multidimensional path integrals employed in the calculation of finite-temperature quantum time correlation functions. Kim [26] proposed the procedure of obtaining the best illumination for specific patterns by Monte Carlo simulation. Hu [27] applied the gradient-directed Monte Carlo (GDMC) Method to select optimal members in a discrete space of chemically viable proteins. Hua [28] solved the transient thermal conduction optimization problem with the Monte Carlo Method and the simulated annealing algorithm. It can be seen that Monte Carlo Method has a very wide range of applications.
The main purpose of this study is to create a sustainable queuing network model based on the Monte Carlo method and analyze the security process of airports. In this model, the average waiting time and variance of the queuing time of passengers are widely recognized as parameters reflecting the performance of the queuing network. In order to efficiently identify the key operation points of the queuing network, the queuing-network theory and Monte Carlo method combined with simulation, are utilized. Through analysis and comparison, it is determined that the main bottleneck in the security process is when passengers wait in line to remove their shoes, belts, jackets, and have other items individually inspected. Finally, three novel solutions are designed to solve these problems and a sensitivity analysis on cultural differences is conducted to facilitate the study and discussion.
The remainder of the paper is structured as follows: the queuing network is described in Section 2; the development of a sustainable queuing network design model using the Monte Carlo method is presented in Section 3; the case study for a sustainable queuing-network design and sensitivity analysis are contained in Section 4; discussions and conclusions of this study are presented in Section 5.
2. Problem Description
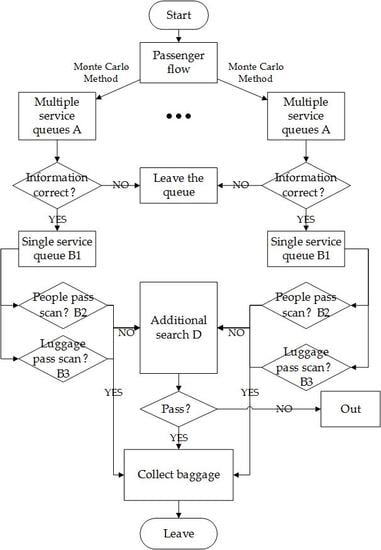
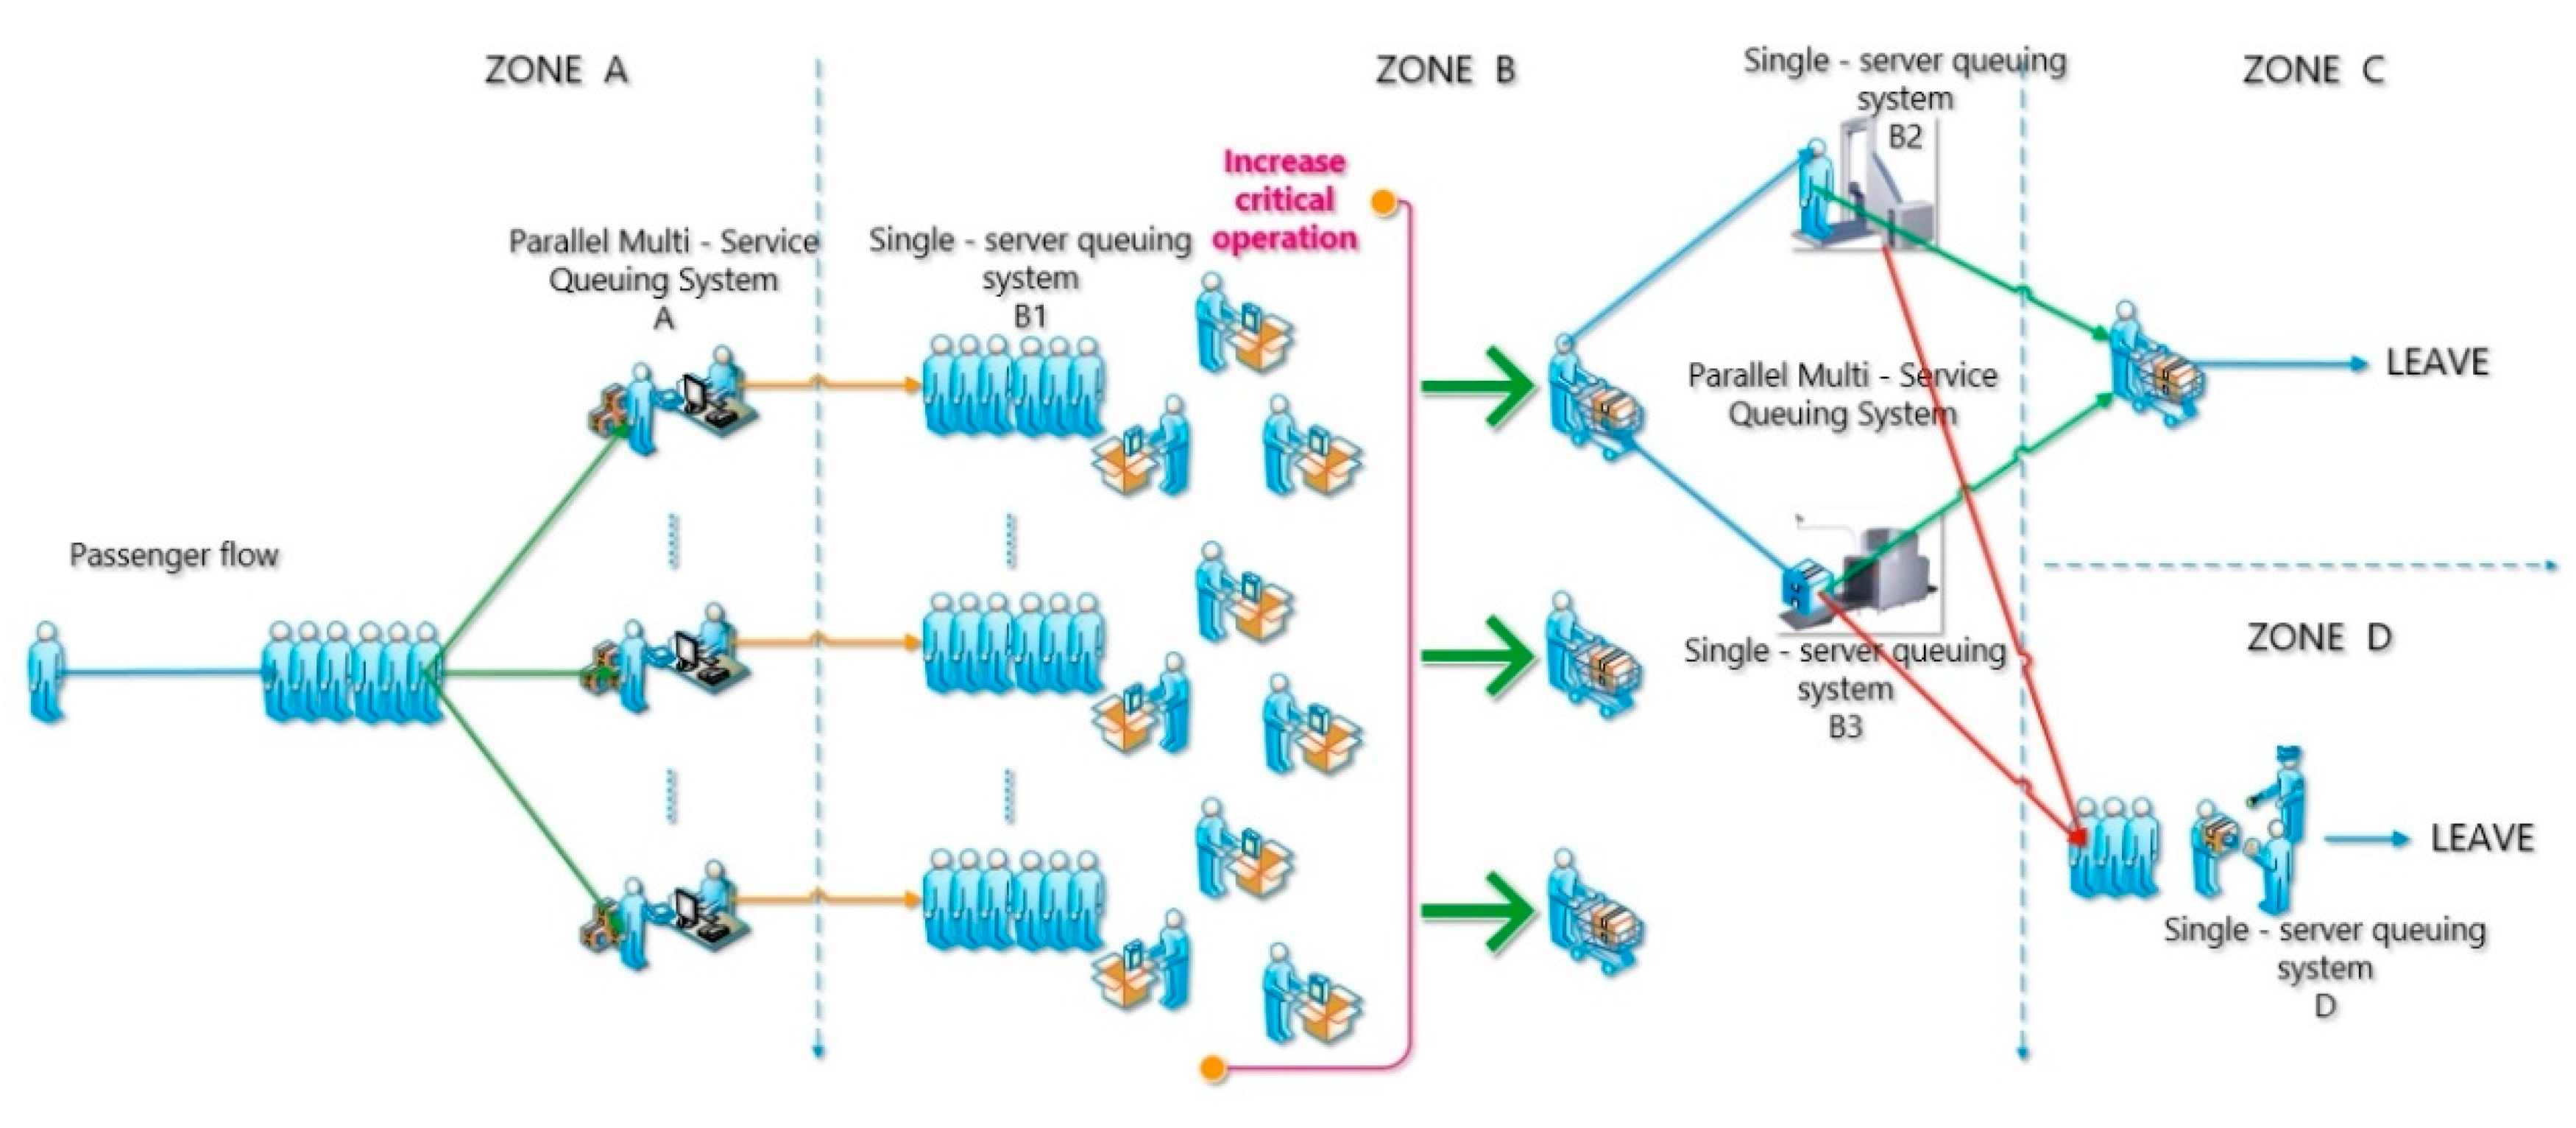
To simplify the model concept figure, we designed a step-by-step security procedure to be a subsystem of the queuing network. Procedure A refers to the verification of the identity information in Zone A. Procedure B1 refers to the inspection process of waiting in line and taking out all the items to be scanned in Zone B1. Procedure B2 refers to the human body microwave scanning in Zone B2. Procedure B3 refers to putting the carry-on luggage through the X-ray machine in Zone B. The marked items in the inspection procedure for further screening are referred to as Procedure D.
A random event stream is the sequence of events that occurs at random moments. If the event flow is smooth, independent, and general, it is called a Poisson event flow (Poisson flow). All modes of transportation utilized by passengers, such as taxies, trains and buses, and all arrival events satisfy the conditions of the Poisson event flow. Therefore, it can be assumed that the arrival time of passengers complies with the Poisson flow rule. Procedure A is the starting point of the whole queuing network, which is a multi-server parallel queuing system. Afterwards, passengers proceed to Zone B for procedure B1, which is a single-server queuing system, and queue according to the original order. Passengers from procedure B1 subsequently continue to procedures B2 and B3. Both procedures B2 and B3 are single-server queuing systems, but these two steps are simultaneous; a parallel system. Process D is a special situation and will not be considered in the initial setup of the model.
Through concept mapping of the model, the process can be intuitively understood.
Based on the queuing network system shown in Figure 1, the Monte Carlo method is used to perform a series of simulations, such as searching for key operating points to locate bottlenecks in the security process, optimizing the queuing system structure to optimize the overall queuing efficiency, and reducing the queuing time and time variance.
3. Sustainable Queue-Network Model Based on Monte Carlo Method
3.1. Model Framework
The Monte Carlo method is a stochastic simulation method, which is based on the probabilistic and mathematical statistical theory method. It is a method for solving many computational problems by using random numbers (or known as pseudo-random numbers). The problem to be solved with a certain probability model is associated with computer technology in order to achieve statistical simulation or sampling and obtain the approximate solution. To solve the problem, the model framework is developed.
The security procedure in the queuing process shown in Figure 2 is based on the typical security process and security requirements. To elaborate on the problem, the above process is decomposed. In the figure, there are five queuing system models, which are interlinked to form a queuing network through passenger flow. The five queuing systems are as follows: (1) Queuing system A: In Zone A, passengers randomly arrive at the checkpoint and wait in queue until their IDs and boarding documents are checked by security personnel; (2) Queuing system B1: In Zone B1, passengers prepare all of their belongings for X-ray screening. Passengers must remove items, such as shoes, belts, jackets, metal objects, electronics, and containers with liquids, and place them in a bin to be X-rayed separately; laptops and some medical equipment also need to be removed from their bags and placed in a separate bin; (3) Queuing system B2: In Zone B2, passengers go through either a millimeter wave scanner or a metal detector; (4) Queuing system B3: In Zone B3, all passenger items, including luggage, are placed on a moving conveyor and checked by an X-ray machine; (5) Queuing system D: In Zone D, if passengers or their carry-on baggage fail in the security check, additional search or screening is conducted.
3.2. Queuing Network Modeling on Monte Carlo Method
The queuing system has the following three basic components: input part, queuing rules, and service organization. It is assumed that the arrival time of different passengers is random, the time spent by each security process is stationary, and the expected value and variance of the distribution are stable. In the input process, the passenger arrival flow basically satisfies smoothness, and no rear-effect and universality. Thus, it is presumed that passenger arrival is a Poisson flow, which satisfies single arrival, infinite source, and independency from each other. The queuing rules include the waiting and first-come-first-checked rules. The system capacity is enormous to the extent that it can be approximated as infinite. Under service rules, passengers are individually screened, the security window is a parallel window, and the service time has no memory and obeys a negative exponential distribution, and the service time of each security window is independent. According to the process of airport security check and the basic model parameters of the queuing theory, the five queuing systems mentioned above are standardized.
(1) Queuing System A is a multi-service queuing system. Suppose that the parameter of the arrival of passengers as a Poisson flow is , the service lane for verifying identity is independent, the average service rate is , and the number of multi-service stations is . According to the standard M/M/c, it is found that:
System A service intensity:
The probability that the system A is idle:
where k is a natural number from 0 to c − 1.
The average number of passengers in the queue A:
where n is the total number of passengers in the system A.
Average waiting time for passengers in the queue A:
(2) Queuing System B1 is a single-service queuing system. The passenger flow comes from passengers passing through Zone A, and only passengers passing through Zone B1 can pass through Zones B2 and B3. Therefore, passengers passing through Zone A are assigned to respective service queues. Initially, assuming that the passenger queue is short, then, Zone B1 of the queuing system has the same single-service queuing system. The service time of Zone A obeys a negative exponential distribution, and so the passenger arrival flow of Zone B1 is still a Poisson flow obeying the parameter . Suppose the average service rate is and one of the queuing systems is taken as the research object. According to the standard M/M/1 model, it can be learned that:
System B1 service intensity:
The probability that the system B1 is idle:
The average number of passengers in the queue B1:
Average waiting time for passengers in the queue B1:
According to the relations of the passenger arrival flow in Zone B1 and the passenger flow going through Zone A, it can be learned:
(3) Queuing System B2 is a single-service queuing system. In Zone B2, the passenger flow comes from the corresponding zone, B1. The service time of Zone B1 obeys the negative exponential distribution. Thus, the passenger arrival flow at Zone B2 remains a Poisson flow, which obeys the parameter . Suppose the average service rate is . Then, according to the standard M/M/1 model, it can be learned that:
System B2 service intensity:
The probability that the system B2 is idle:
The average number of passengers in the queue B2:
Average waiting time for passengers in the queue B2:
According to the relations of the passenger arrival flow in Zone B2 and the passenger flow going through Zone B1, it can be learned:
(4) Queuing System B3 is a single-service queuing system. In Zone B3, the baggage flow comes from the corresponding zone, B1. The service time of Zone B1 follows the negative exponential distribution and therefore, the baggage arrival flow at Zone B2 continues as a Poisson flow obeying the parameter . Suppose the average service rate is . Then, according to the standard M/M/1 model, it can be learned that:
System B3 service intensity:
The probability that the system B3 is idle:
The average number of passengers in the queue B3:
Average waiting time for passengers in the queue B3:
According to the relations of the baggage arrival flow in Zone B3 and the passenger flow going through Zone B1, it can be learned:
(5) Queuing system D is a single-service queuing system. In Zone D, the passengers are those who do not pass through Zone B2 or whose bags do not pass through Zone B3. Consequently, the passenger arrival at Zone D is a random event with a low probability. For the entire security process, Zone D performs a small function, and therefore, the security congestions can be formed in the whole process beyond Zone D.
3.3. Airport Security Simulation on Monte Carlo Method
According to the Poisson distribution in probability theory, it can be learned:
P(N(t) = n) is the probability of reaching n passengers in t hour. E(Nt) is the expectation to reach the N passengers in t hours. The Poisson process has a steady increment and satisfies:
Let λ be the rate or intensity of the process, which is the average number of events per unit time. According to the knowledge of probability theory and mathematical statistics, the passenger arriving time interval obeying negative exponential distribution with parameter λ:
Using the Monte Carlo method, a pseudorandom number, , is generated by a computer program and the time interval, t, is calculated according to the above formula. Simulate the negative exponential distribution of the service process, and generate a Poisson flow for the input process.
The airport security simulation process using the Monte Carlo method is as follows: (1) Data in the table are processed to obtain the average waiting time, that is, the average service rate, , of the service station; (2) The generated pseudo-random number is used to generate the passenger arrival time. The service time of the four queuing systems through Zones A, B1, B2, and B3 are then generated by the pseudo-random number; (3) The queuing rules for passengers based on the first-come-first-checked rule are developed. Moreover, passengers can only wait until the security check-in lane is available. Obviously, default passengers automatically select the lane with the shortest queue. After the passenger enters a queue, their choice can no longer be changed. Because passengers need to pass through together with their luggage, these passengers spend longer waiting times at Zones B2 and B3; (4) By automatically generating the arrival time of passengers, the whole process of airport security, the average waiting time, and queue length of the four queuing systems are simulated; (5) The whole process of the airport security inspection is simulated several times, and the average of the indicators is selected to minimize the impact of random errors.
4. Case Study
4.1. Analysis of Simulation Data to Find Key Operations
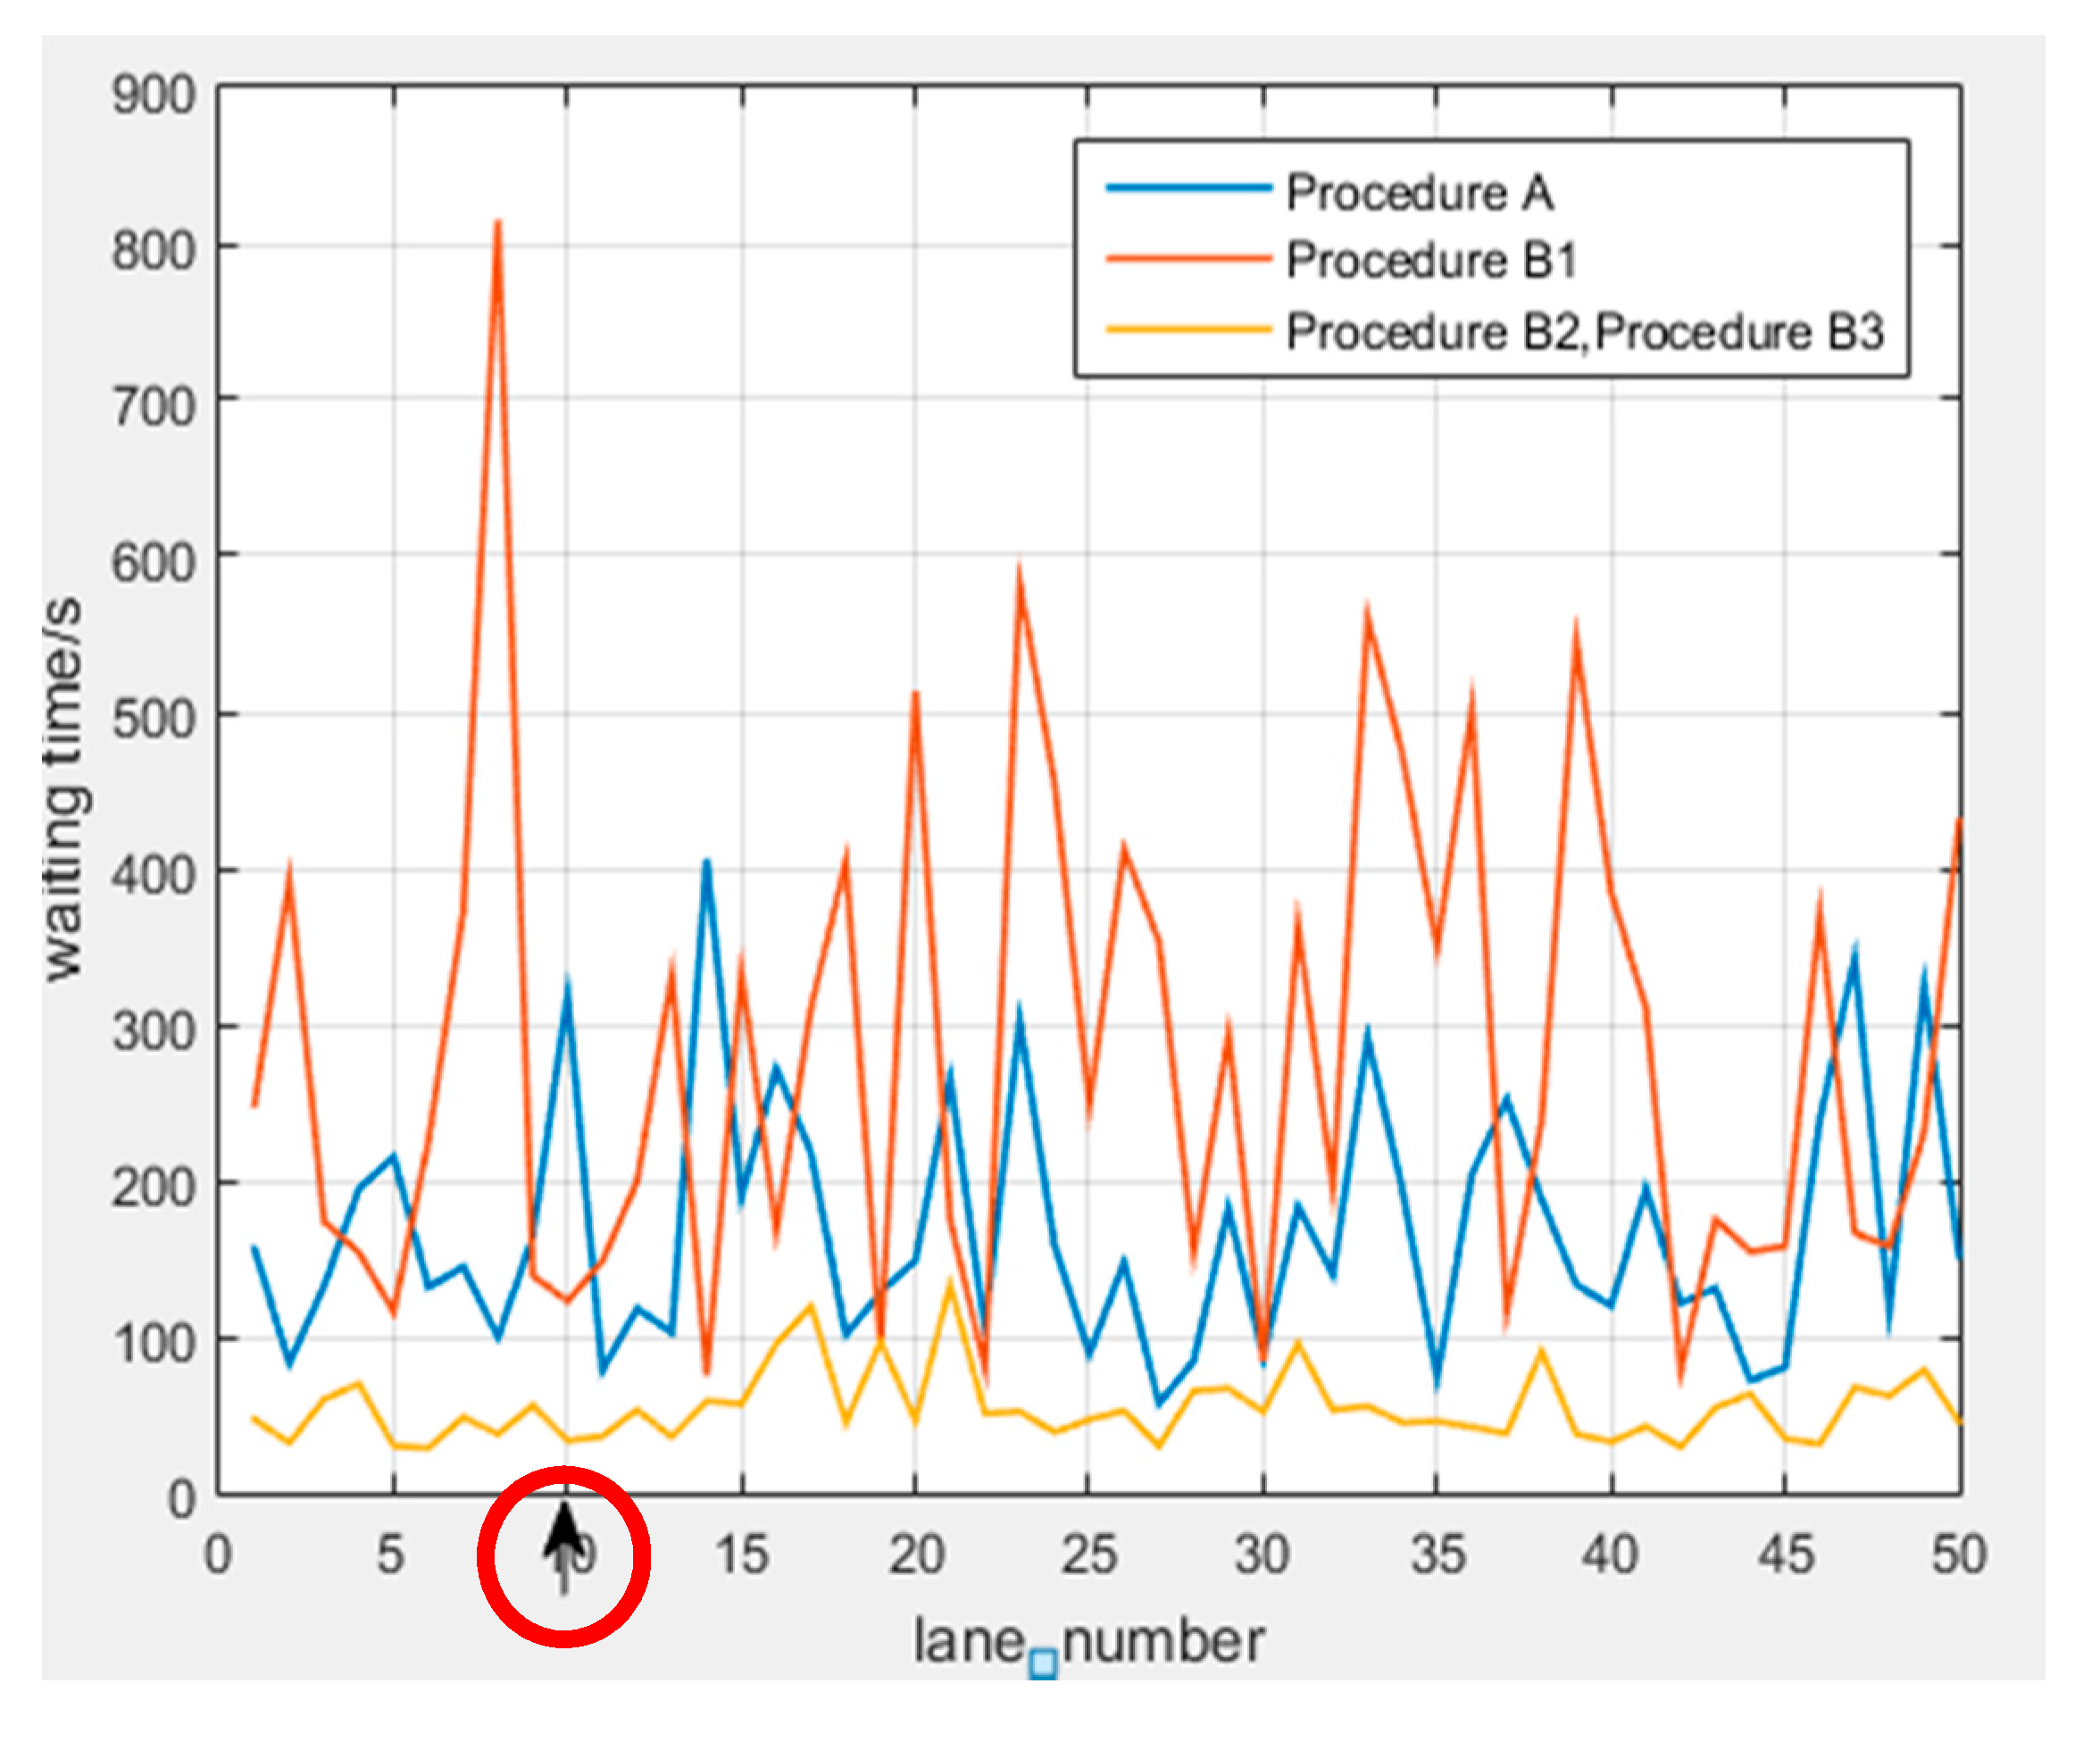
In the search for congestions in the queuing process, an airport security scenario is designed to conduct the simulation. Each of the 50 security lanes has an input of 100 passengers, and the average waiting time of passengers per lane are observed in three processes (B2 and B3 is a parallel process). The observed results is shown in the Figure 3.
Through an observation and analysis of the list in Table 1, the following points are found: (1) There is a large difference in the waiting time for each lane, particularly in process B1, as shown in Figure 3. Through the analysis, it is presumed that the passenger arrival time and service time of processes A, B1, B2, and B3 are random in the passenger security process, whereas the waiting time of the passengers in the queuing process substantially differs; (2) The average waiting times of processes B2 and B3 are the shortest, and the average waiting time of process B1 is the longest. Consequently, it is considered that the passenger congestion is caused by process B1. Thus, it can be concluded that process B1 is the bottleneck in the security process; (3), the waiting time in process A exceeds the waiting time in process B1 in several lanes (as indicated by the arrow on lane 10), as shown in Figure 3. Furthermore, as more passengers arrive during a busy time when other passengers have already crowded, congestion occurs in process A. As a result, the waiting time in process B1 is shorter than that in process A.
4.2. Security Process Optimization
Based on the above model and through the simulation of the existing security process, it is found that the passenger waiting time is long and waiting time variance is quite large. The problem this brings is that arriving passengers are either unnecessarily early or miss their scheduled flight. Therefore, it is crucial to reduce the average waiting time of passengers and improve its stability by optimizing the security process or staff configuration.
4.2.1. Increase the Productivity of Key Operations
Throughout the security process, the bottleneck that hinders security efficiency is called the key operation. Through simulation, it is concluded that Zone B1 is the key operation of the entire security inspection process. In other words, passengers prepare all items for X-ray inspection, including taking off shoes, belts, jackets, and taking out metal objects, electronic items, containers containing liquids, laptops and some medical equipment. This process is time consuming and causes passengers to wait in line. Based on this model, Zone B1 of the queuing system is adjusted as shown in Figure 4.
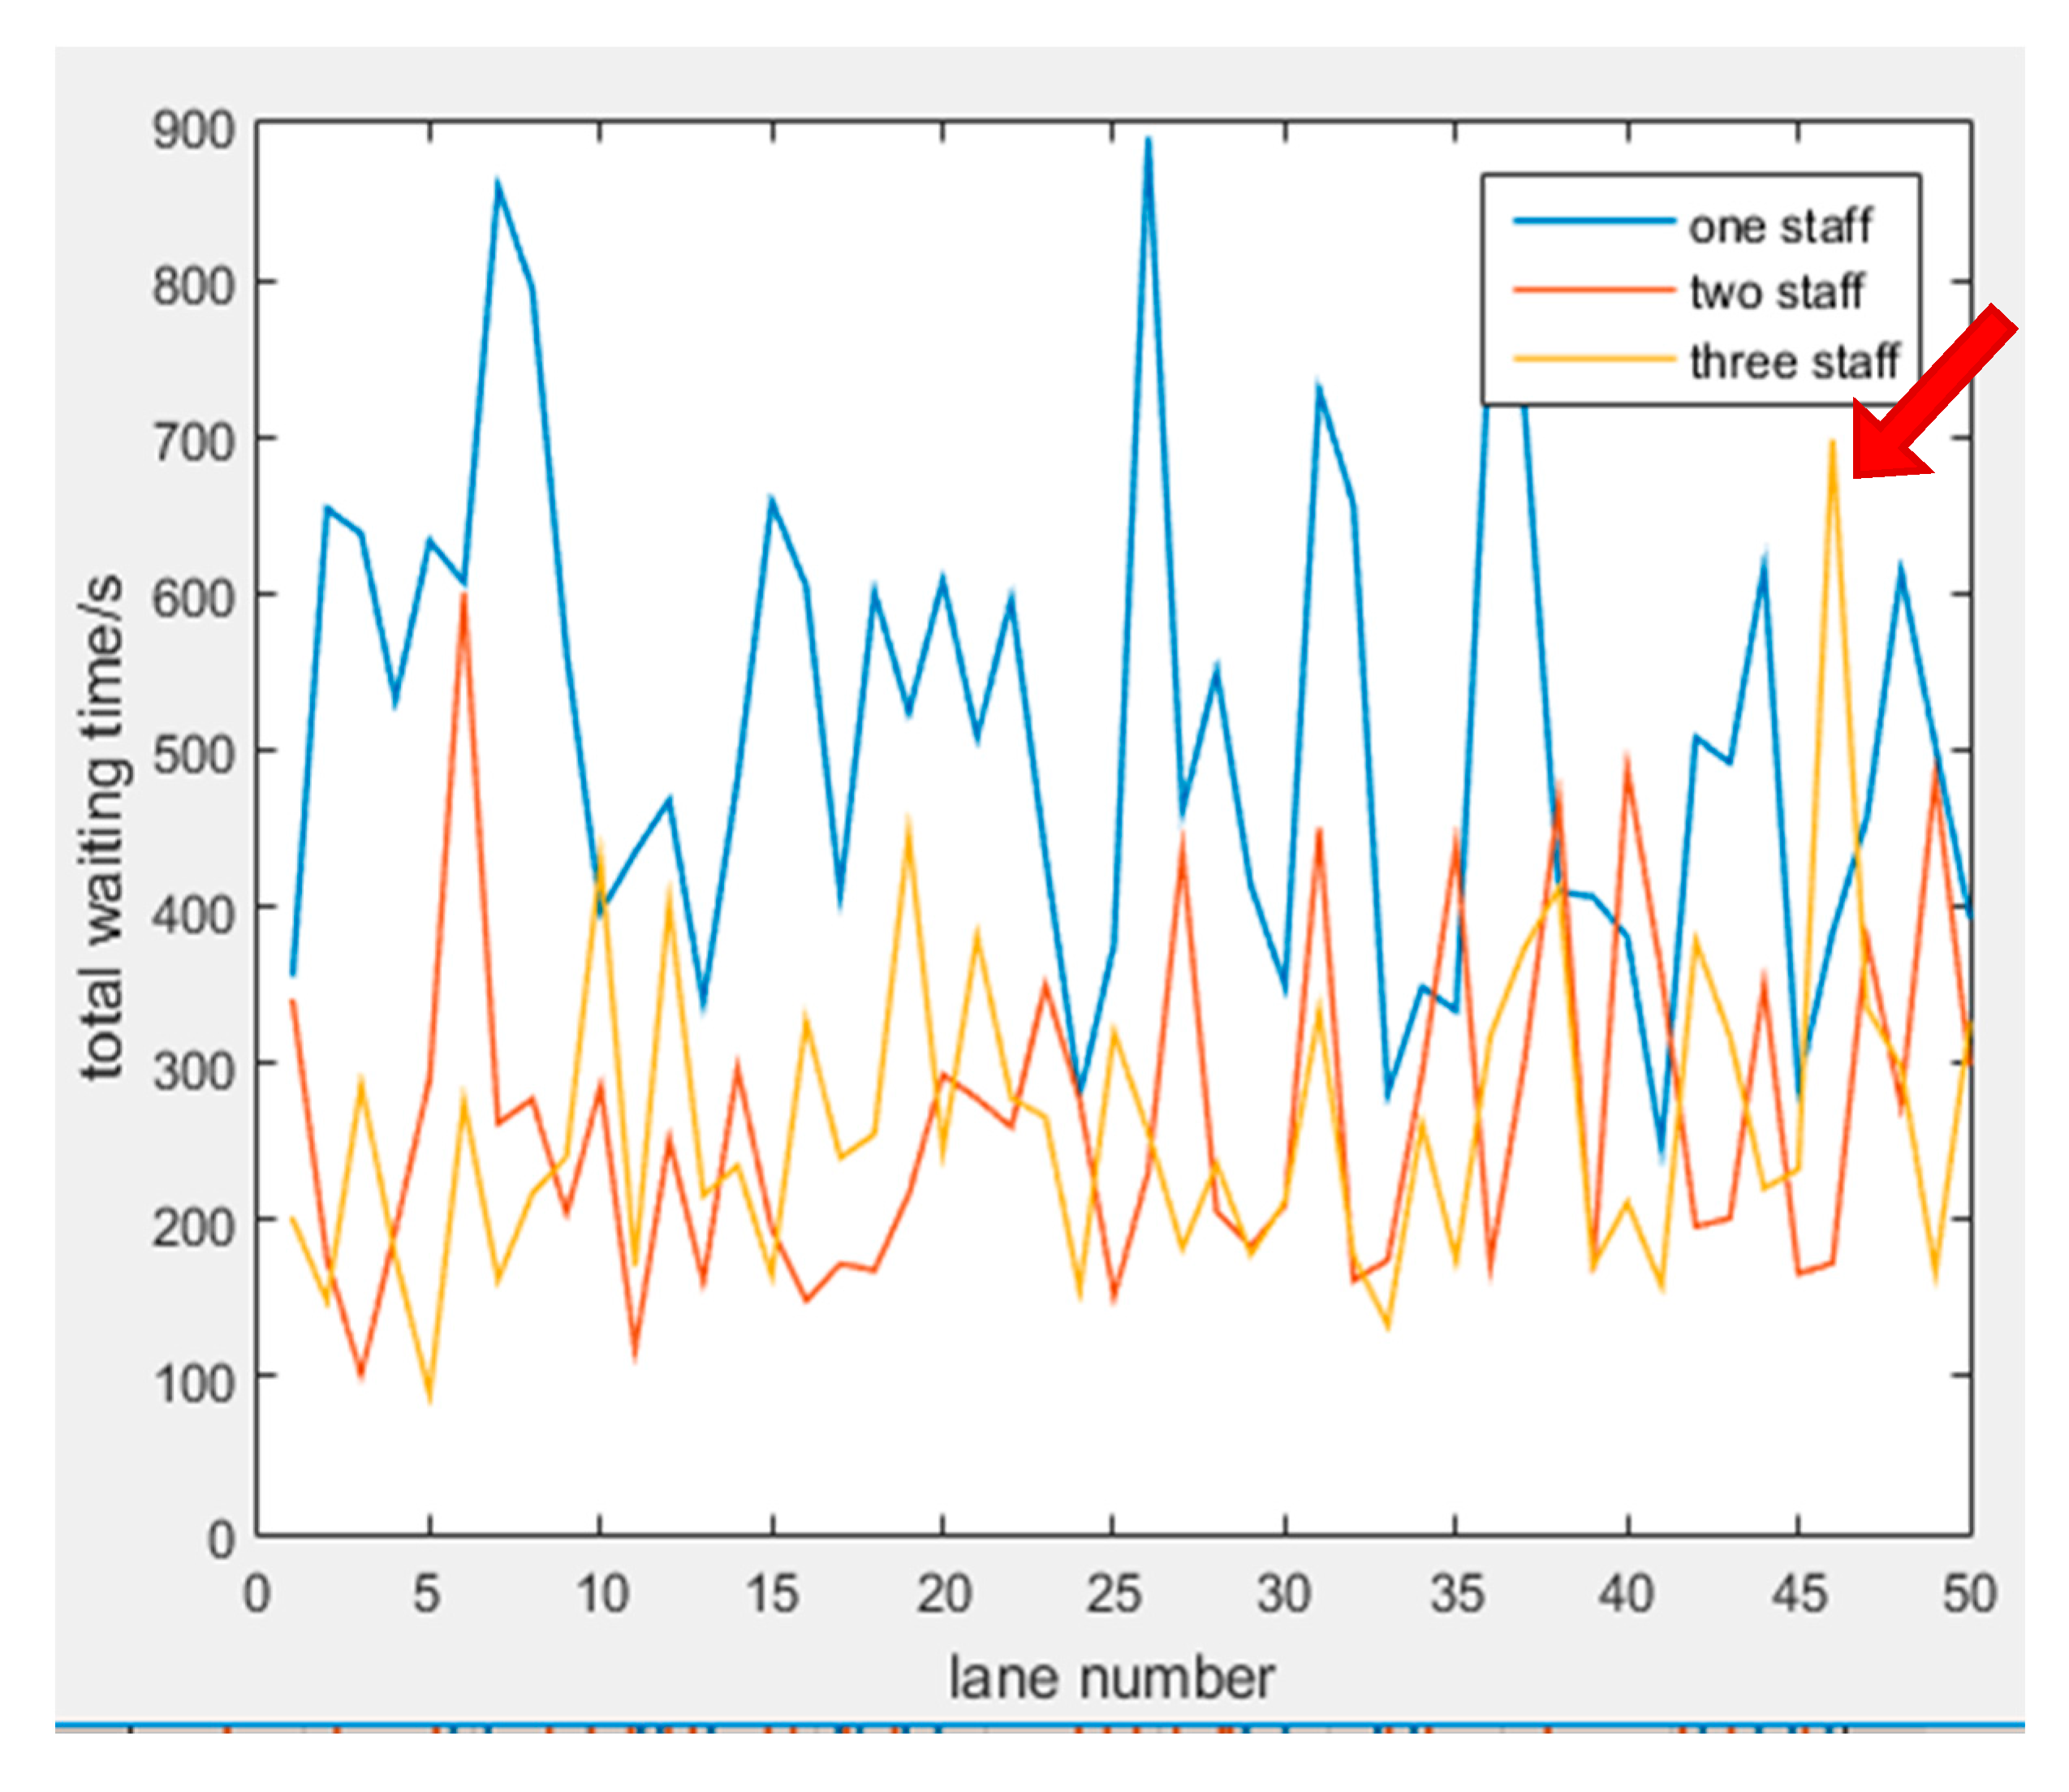
The extent of the multi-service set in Zone B1 is extremely important because an appropriate amount of service does not only improve security efficiency, but also effects good cost control. The same simulation method is adopted for a number of different service lanes based on the average waiting time of passengers. The simulation is used to observe the average waiting time of the multi-service and a single server respectively, the results shown below.
As indicated by the arrow in Figure 5, there are some anomalies that evidently do not conform to the norm. After an analysis, the conditions at exception points can explained as follows. By observing the specific data of sample points, it was found that the reason for the sharp increase in waiting times at these points is that processes B2 and B3 have long service times. Moreover, because B1 has three service stations, the processing time of passengers is significantly reduced, and as a result, more passengers flock to zones B2 and B3, and continuously block the processes in these zones. Seldom do the waiting times of the three service stations exceed the waiting time of the latter stations.
Based on the summary in Table 2, the multi-service stations significantly reduced the average waiting time and its variance in the simulation of the 50 lanes. When c = 2, the average waiting time is 52.8% less than that of the single server, and the variance is only a quarter that of the single server. When c = 3, the average waiting time and variance are slightly larger than those when c = 2, indicating that adding more service lanes do not necessarily improve efficiency. When the work efficiency of Zone B1 significantly improves, passenger flow through it increases. However, this leads to the congestion of Zones B2 and B3 because of their low efficiencies. Accordingly, additional bottlenecks occur in the security process.
In summary, the improvement of security efficiency is feasible by increasing the service efficiency in the key operation of Zone B1. The airport only needs to increase the number of staff and upgrade the single-service queuing system to c = 2 multi-service queuing system in Zone B1.
4.2.2. Increase the Number of Pre-Check Lane
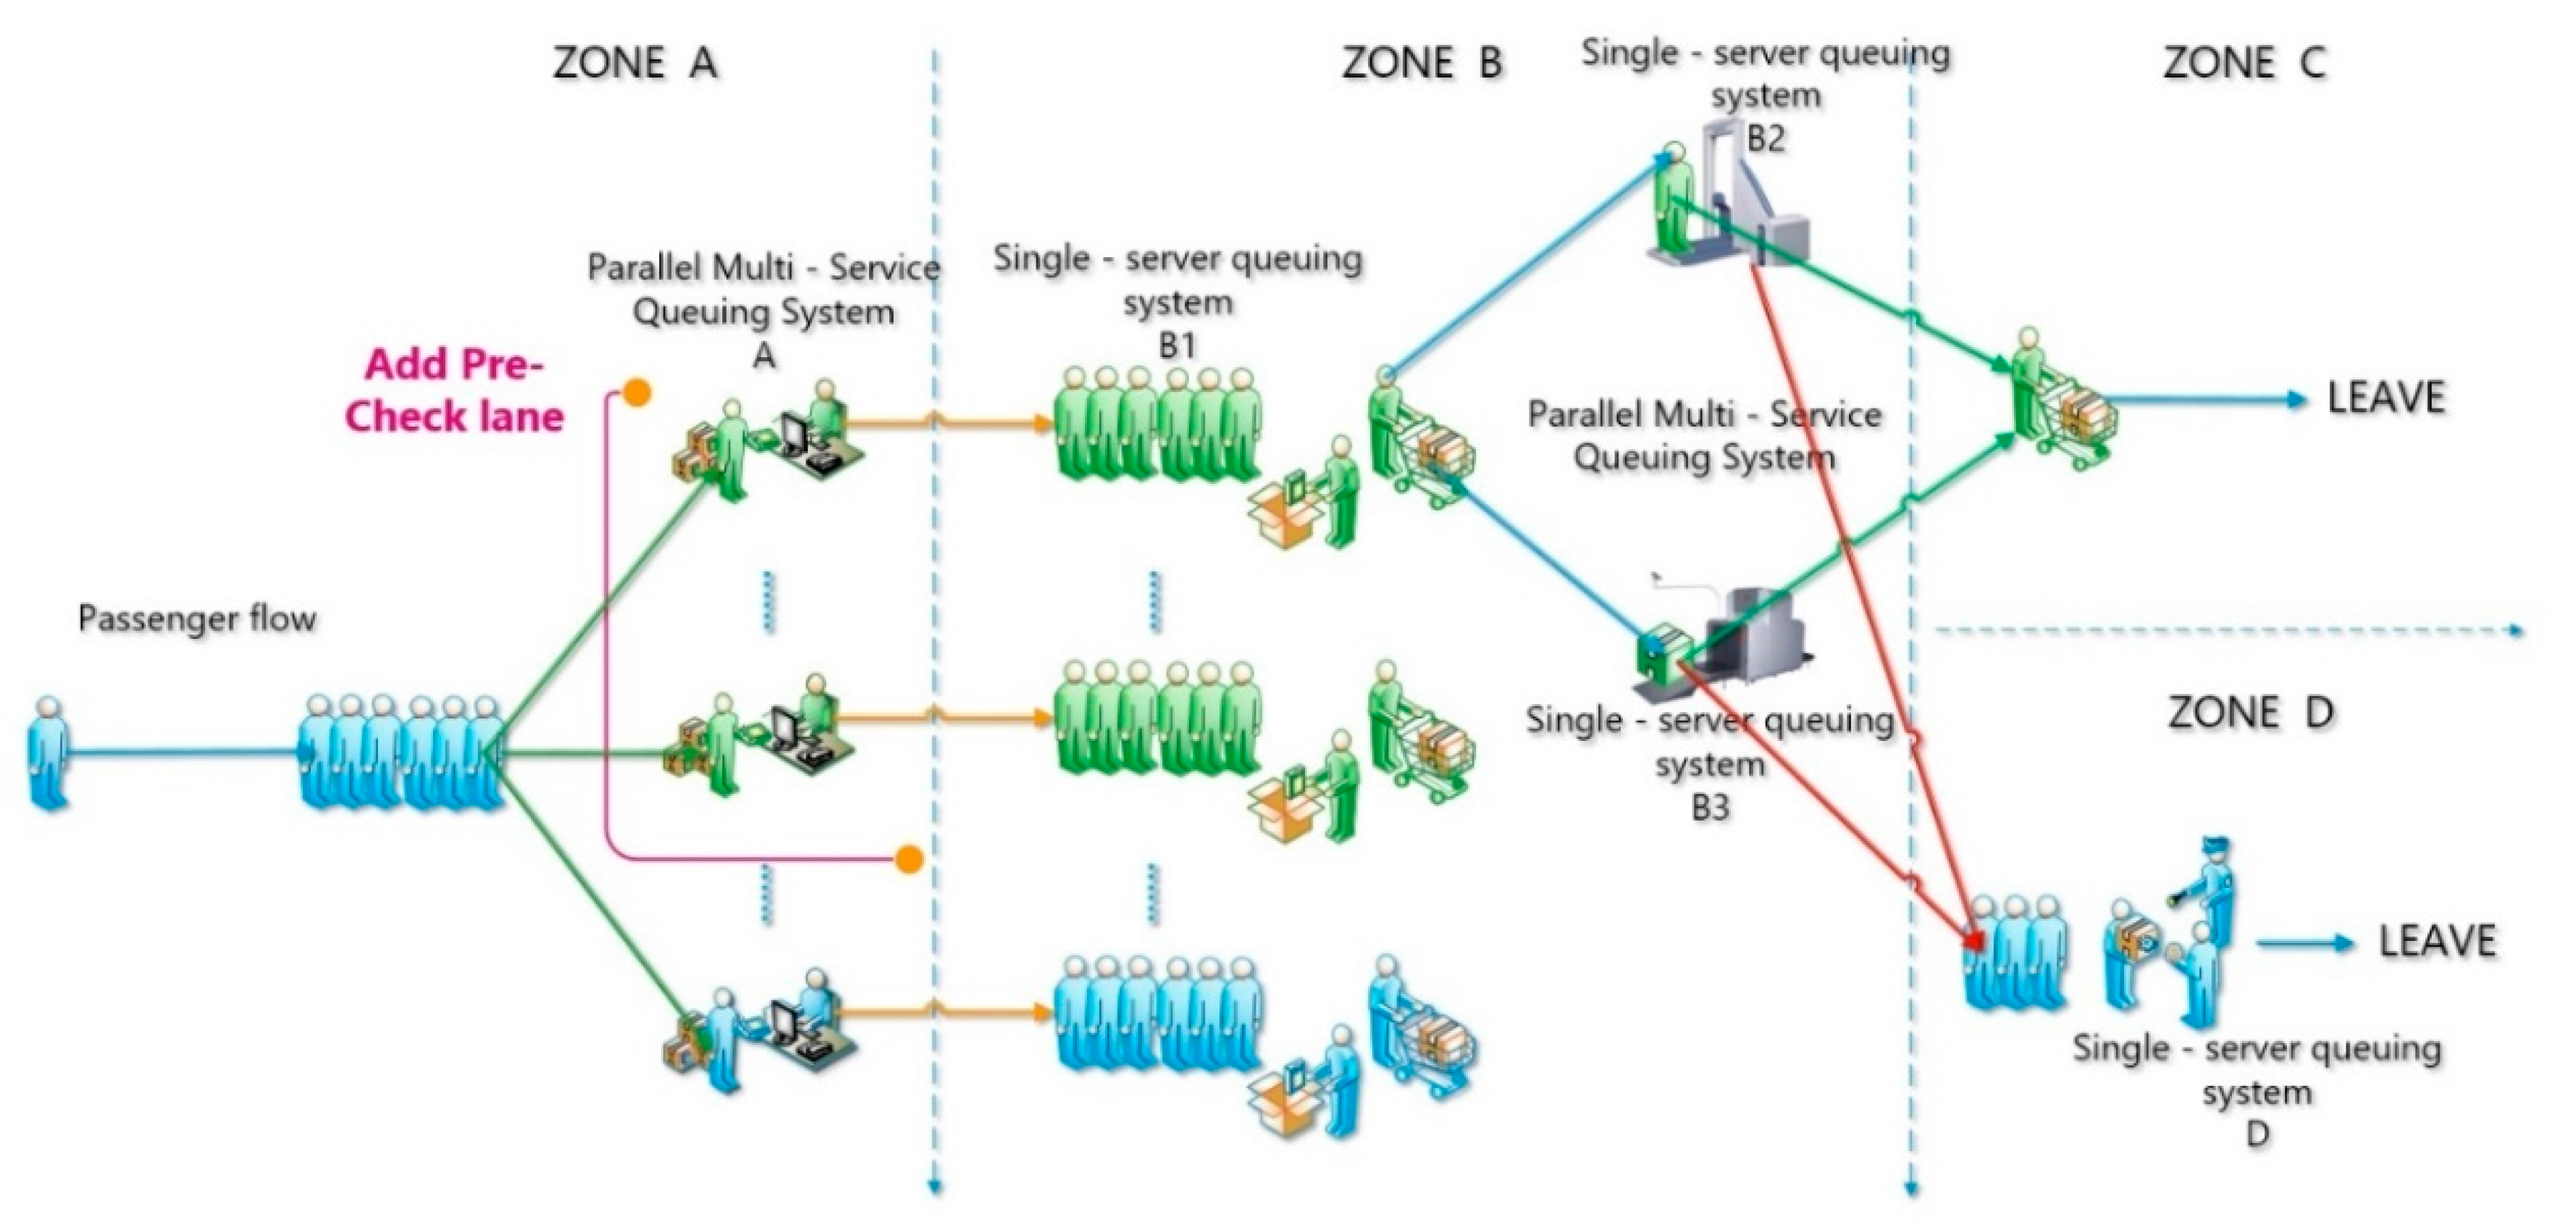
Approximately 45% of passengers are assumed to enroll in the program called Pre-check for trusted travelers. Pre-check passengers and their bags go through the same screening process, but with a few modifications designed to expedite screening. These passengers must still bring out metal and electronic items for scanning, as well as any liquids. However, they are not required to their remove shoes, belts, or light jackets; they also do not need to take out their computers from their bags. Consequently, not only will the processing time be significantly reduced, but the average service rate of Zone B1 will also be improved. Therefore, an increase in the number of pre-check lanes can similarly improve the security efficiency. Based on this model, the security process will be adjusted as shown in the Figure 6.
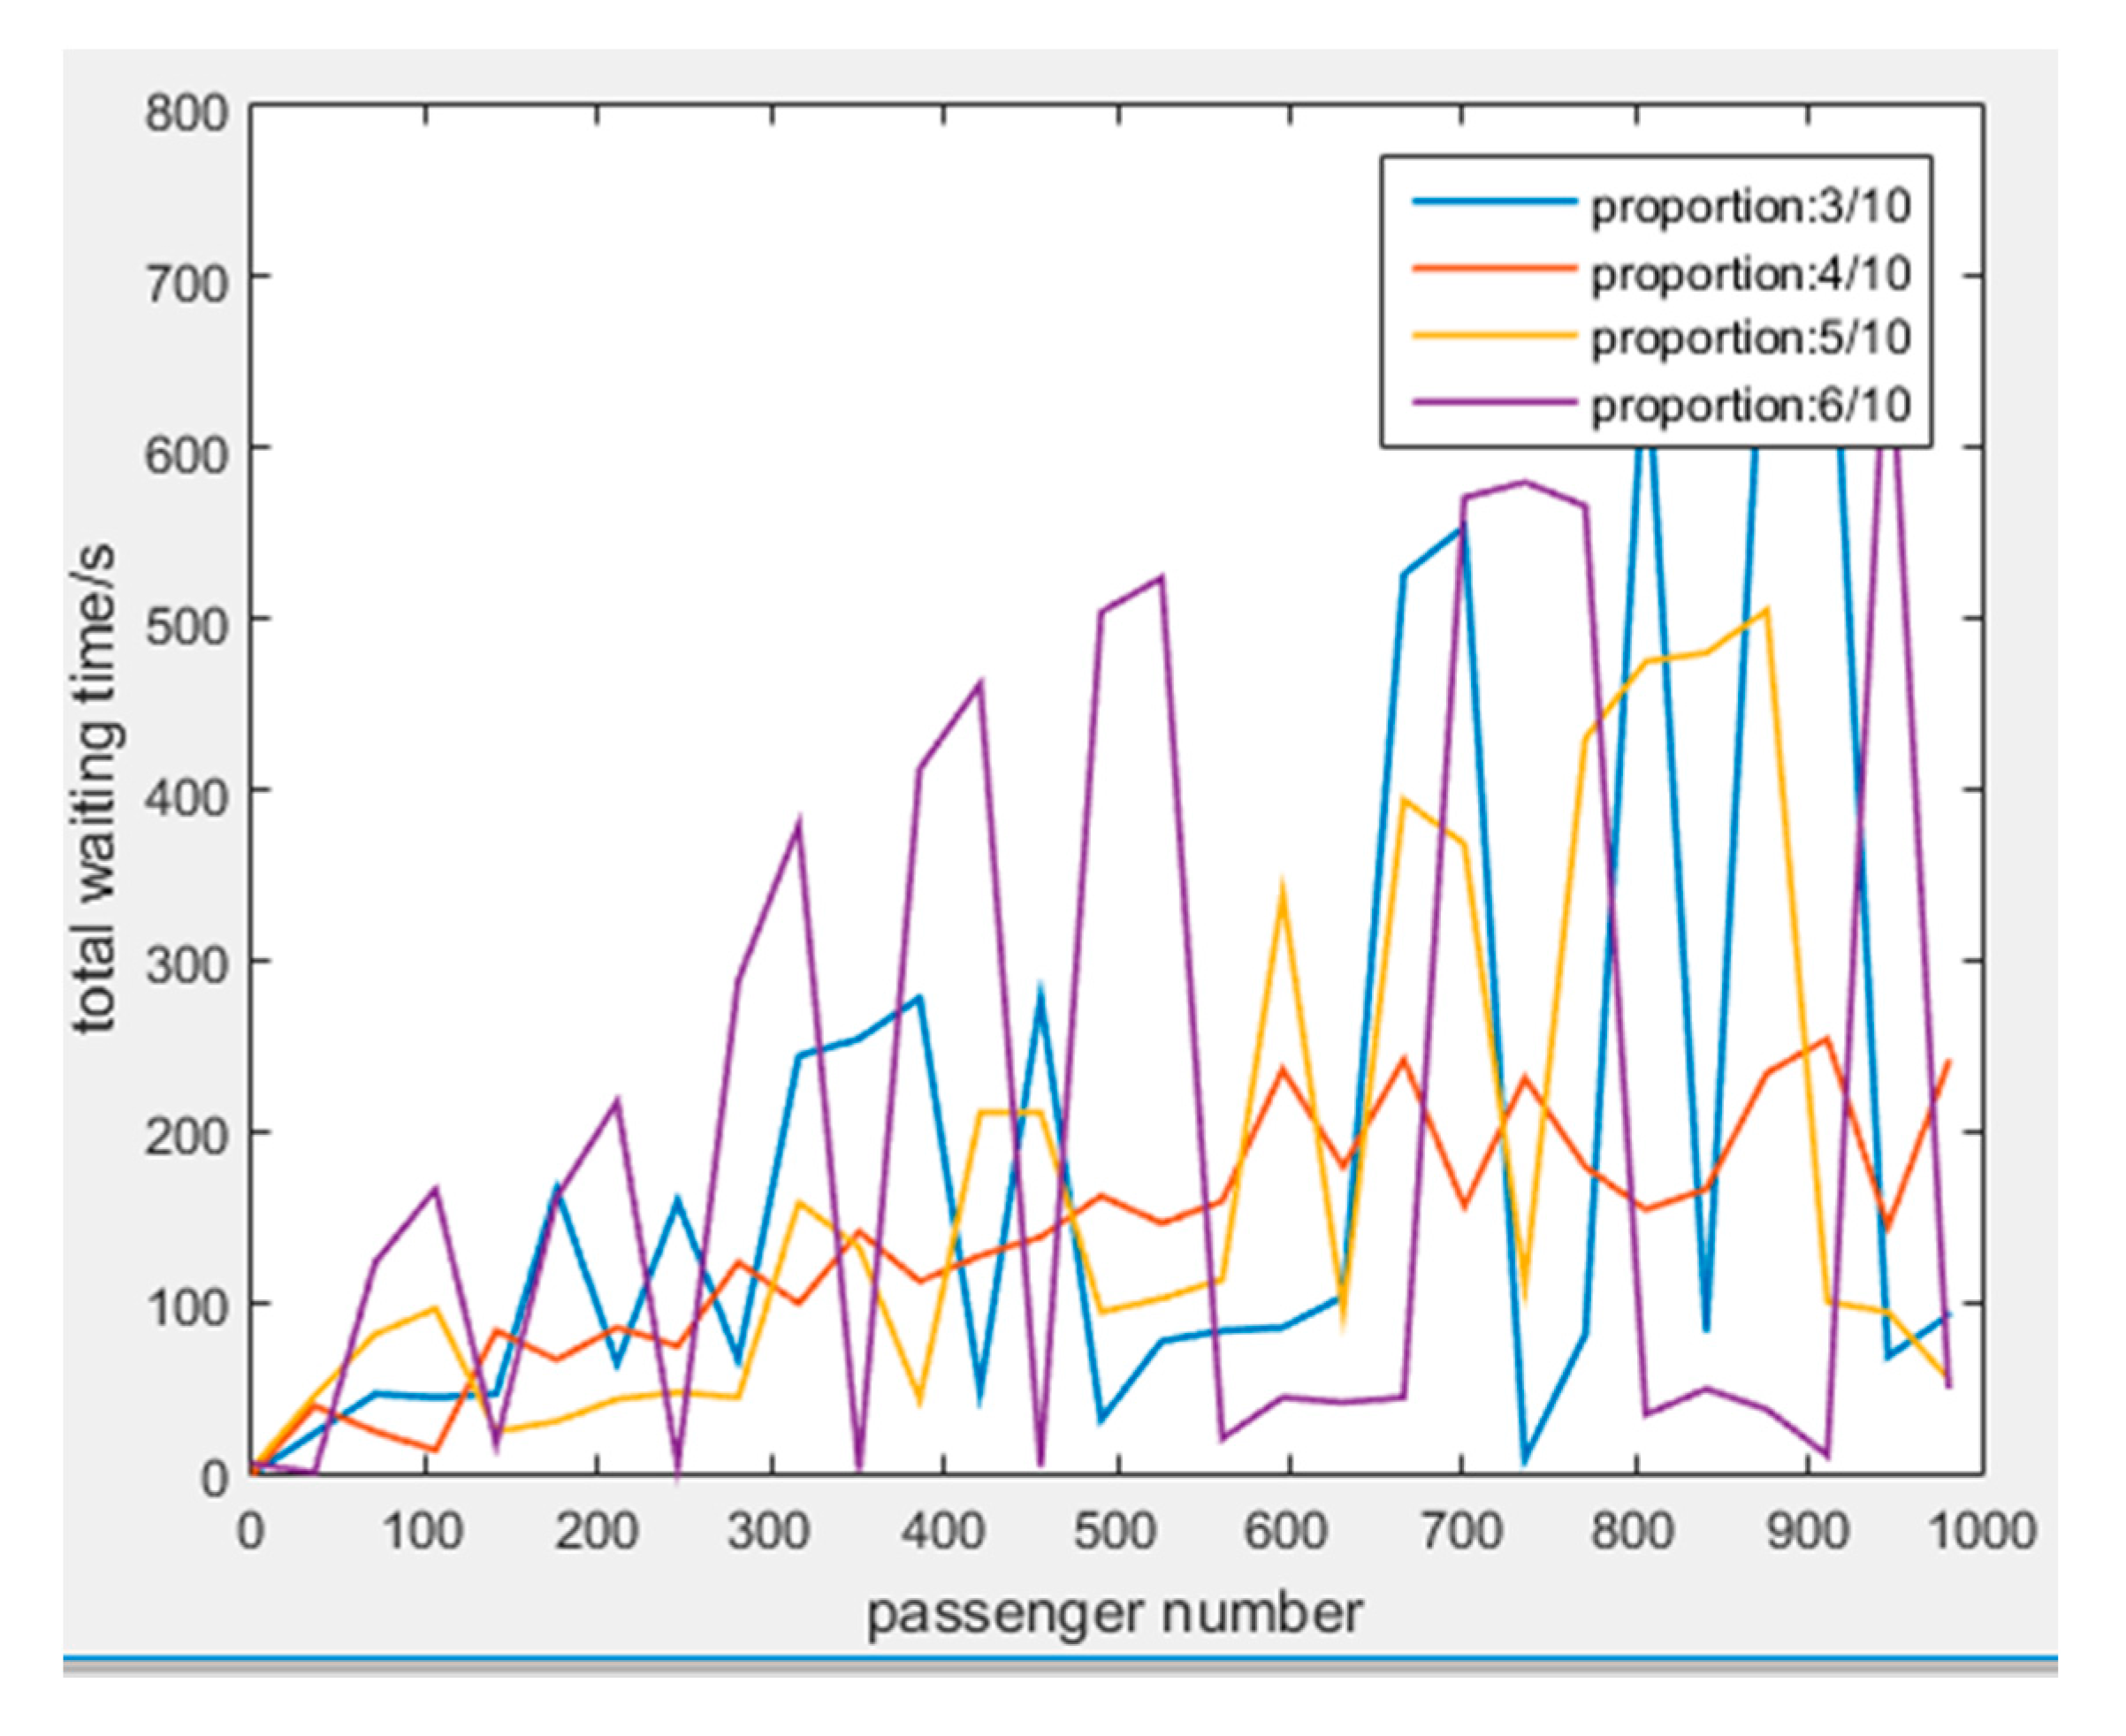
In order to determine the best proportions of the ordinary and pre-check lanes, the 10% proportional gradient and passenger waiting time are taken as the standards, and the same simulation method is adopted. The simulation is used to compare the average waiting time and its variance for different proportion coefficients. The results are as follows.
Figure 7 shows that only when the proportion is 4/10, the curve is most stable at a low degree. When the proportion is other value, the curve will fluctuate and the total waiting time will increase heavily.
According to Table 3, when the ratio of qualified passengers is about 45%, severe crowding occurs in pre-check lanes due to insufficient lanes and passenger flow resulting in an increased average waiting time for passengers. On the contrary, too many pre-check lanes will increase the pressure of other normal security lanes. For the simulation of the 50 lanes, apparently when the proportion of pre-check lane is 4/10, the average waiting time for passengers is the shortest and the waiting time variance is significantly smaller than the other ratios.
When the ratio of the passengers who enroll in pre-check program fluctuates within a certain range, the effect of adding pre-check lane is analyzed as following.
According to Figure 8, it can be found that different proportions (from 25–55%) of passengers who enroll in the pre-check program have different impacts on the effect of adding pre-check lanes. When the proportion of passengers who enroll in pre-check program increases, correspondingly increasing the proportion of the pre-check lane will have a better effect. The effect of 4/10 pre-check lanes is still the best when the proportion of the passengers who enroll in pre-check program changes from 25–55%.
To summarize, approximately one-third of the pre-check lanes cannot meet the needs of 25–45% of the pre-check passengers. Accordingly, the number of pre-check lanes is increased up to a proportion of approximately 40%.
4.2.3. Open Special Security Lanes for Passengers without Luggage
Under real conditions, a small number of passengers who do not carry luggage exists. As passengers are checked in Zone B1, passengers who do not carry luggage also need to wait in line, which increases the average waiting time for all passengers. As a remedy, the airport can use the subway security strategy by opening special security lanes for checking the identity of passengers without luggage. By having their boarding information scanned by a millimeter-wave scanner, passengers can quickly pass through, which reduces the average waiting time. Based on this model, the security process will be adjusted as shown in Figure 9.
If it is assumed that 15% of passengers do not carry luggage when passing through security, then the proportion of special security lanes set up will also significantly affect the security efficiency. Taking the 10% proportional gradient and passenger waiting time as standards, the same simulation method is adopted, and the average waiting time with its variance are compared according to different proportion coefficients. The results are shown in Figure 10.
According to Figure 10, it can be found that there is an arrow referring to the mutation value. After an analysis, it is supposed that the reason for the mutated value is that one special lane is insufficient to process all passengers without luggage. As a result, passenger waiting time is longer and abnormal points appear in the image.
According to the list in Table 4, because the security process of the passengers without luggage is fast, less security resources are consumed. Thus, a greater proportion of the resources is allocated to ordinary lanes of passengers with luggage. Consequently, resource allocation efficiency is improved.
When the ratio of the passengers who do not carry luggage fluctuates within a certain range, the effect of opening special security lanes for passengers without luggage is analyzed as following.
It can be observed in Figure 11 that different ratios (from 25–55%) of passengers without luggage have different impacts on the effect of opening special security lanes for them. When the proportion of the passengers who do not carry luggage increases, correspondingly increasing the proportion of the no-luggage lane has a better effect. In this regard, the ratio of 1/10 no-luggage lanes continues to yield the best effect until the proportion of passengers without luggage increases to 20%.
In summary, when the proportion of passengers without luggage exceeds 20%, it is advantageous to open more than 10% special lanes for them to improve security efficiency and minimize the passenger average waiting time and its corresponding variance.
4.3. Sensitivity and Solutions Analysis
4.3.1. Sensitivity Analysis
Passengers with different cultural backgrounds think and behave differently. This diversity leads to different levels of passenger cooperation with airport security processes, specifically in Zones B1 and B2. The main cultural regions of the world is shown in Figure 12.
For example, Americans are known for deeply respecting and prioritizing the personal space of others. Europeans are known for their emphasis on collective efficiency, whereas Asians are known for prioritizing individual efficiency. To better describe the impact of these differences in thinking on the security process, the average service time for passengers through security screening is divided into two categories, fast- and slow-moving, with an average service time of 60 and 140%, respectively. In the general model, a certain percentage of fast- and slow-moving passengers are added to conduct a sensitivity analysis.
(1) Single factor sensitivity analysis. 2%, 5%, 10%, and 20% of the passenger disturbance factors are added into the general model, and the results are shown in Table 5.
(2) Multi-factor sensitivity analysis. % of the fast-moving passengers and % of the slow-moving passengers are added into the general model, which satisfy . The results are shown in Figure 13.
Based on this analysis, when the disturbance factor is above 5%, the average waiting time and waiting-time variance of passengers, especially that of slow-moving passengers, will have distinct changes.
4.3.2. Solutions Analysis
In order to allow the security process to adapt to more than 5% of the disturbance factor, Zones B1 and B2 need to add a backup security lane. Once the congestion peak has passed, this alternate lane can be closed to reduce the security cost.
When the proportion of slow-moving passengers is 2%, 5%, 10%, 20%, through simulation of alternate lane, results are shown in Table 6.
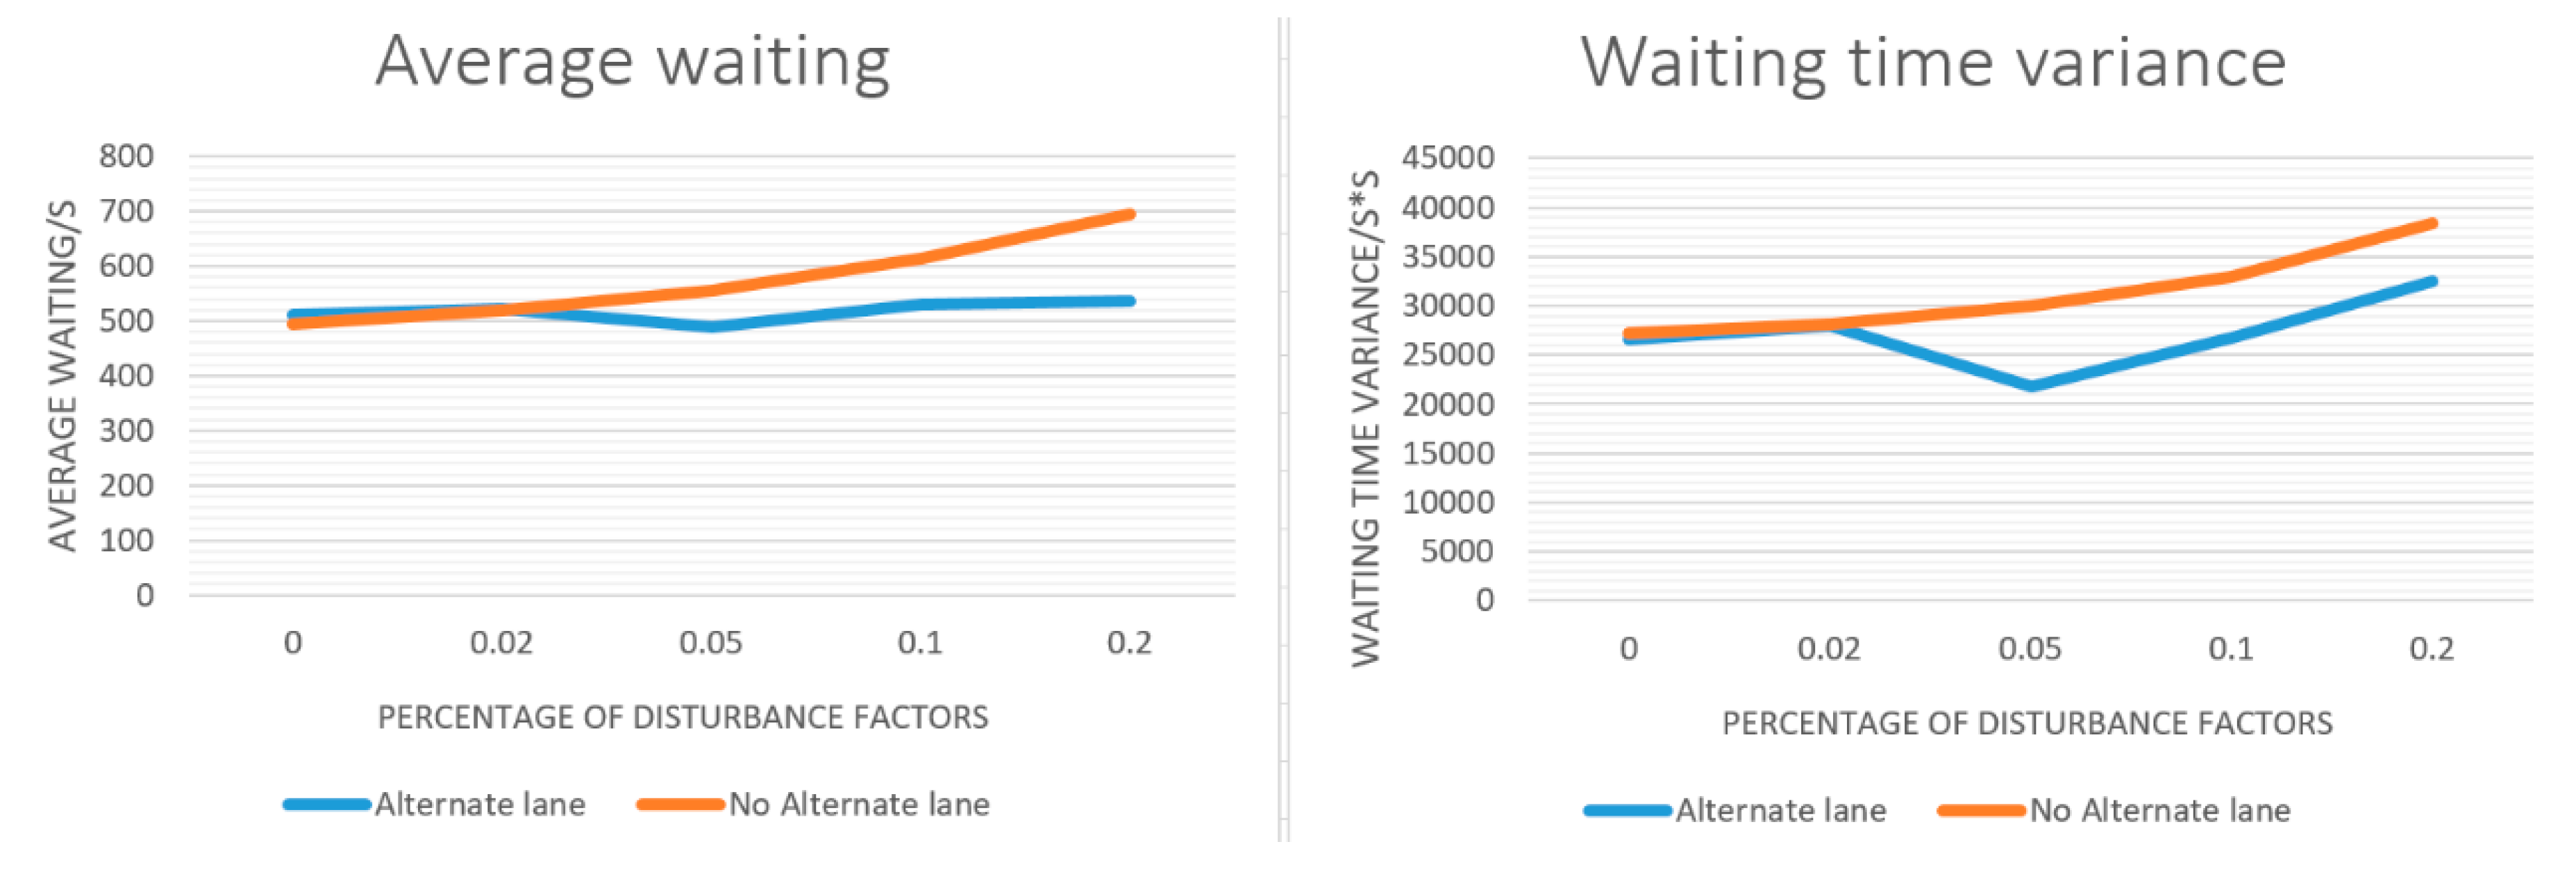
After adding the alternate lane, the average waiting time are significantly reduced with less variance under the increasing disturbance factor, as the results shown in Figure 14.
To sum up, the disturbance of service time caused by different modes of passenger thinking, especially passengers with slow movements, has a greater impact on the average waiting time when the proportion of these passengers exceeds 5%. To solve this problem, the technique is to set up an alternate lane, which can be opened only when temporary congestion occurs. The simulation demonstrated that this problem can be handled well and security cost can be reduced as low as possible through the aforementioned method.
5. Conclusions
Through the examination and modeling of airport security issues, the following conclusions are reached: (1) The airport-security queuing system belongs to a Monte Carlo Method-applicable network systems, in which several steps have serial and parallel relationships. When the entire network queuing system is operating, the longest-running process is called key operation. The solution to the problems encountered under key operation can effectively improve the airport passenger security throughput and airport operating efficiency; (2) Through simulation, it is found that the longest process in the entire security process is the process of waiting for passengers to line up, remove their shoes, belts, and jackets, as well as bring out items that need to be scanned. Because the process usually takes about 250 s per passenger, passenger flow is immobilized. This process is considered the key operation of the security network queuing system; (3) By analyzing the O’Hare airport security process data, it is evident that the queuing times of passengers vary. After the actual situation analysis, this variation may be because the number of passengers who carry luggage significantly differ from and approximately half of the passengers are registered in the pre-check program. Nevertheless, this part of the passenger security process needs to be swift and simplified; (4) Cultural differences may have a significant impact on the choice of airport security. Every passenger who goes through the airport security process needs to be satisfied to a certain extent. The higher the degree of satisfaction is, the smoother and quicker the security process becomes. However, as the degree of satisfaction gets lower, the process becomes less smooth and slower, which may cause some security problems and add more time to the entire security process.
In this paper, the queuing-network model based on the Monte Carlo method is used to model and analyze the airport security process. Based on the average waiting time of passengers and the use of the aforementioned model and method, the main holdup in the security process occurs when passengers line up to remove their clothing accessories and take out items from their luggage. Accordingly, based on the conclusions drawn from the model analysis and existing security programs in the airport, the structure and function of the model are optimized. Three novel solutions are designed to solve the identified problems so that the average waiting time spent through the airport security process is reduced by 51.1–72.9%, and the variance of passenger queuing time is effectively reduced by 33.2–82.4%. It is evident that the solutions are good and can benefit airport staff and passengers. Furthermore, a sensitivity analysis on cultural differences is conducted to facilitate the study and discussion. Through a sustainable queuing-network design for the airport security process based on the Monte Carlo method, the model fully considers applicability and fault tolerance. It also has high authenticity, being closely related to the problem and actual situation. Nevertheless, this research has a few limitations. The cost of operating the entire airport security process and the intensity of the work are not considered in this model. In future studies, the effects of various airport service rules will be considered. Furthermore, the combination of multiple optimization schemes will be examined in order to identify the best system design for security efficiency and cost.
Acknowledgments
We thank Wei Xu from Washington University School of Medicine (St. Louis, MO, USA) for critical reading of this paper. We thank the Editor and the reviewers for their valuable comments and detailed suggestions to improve the paper. Further, we also acknowledge the partial support by the National Science Foundation of China under grants No. 71690233, No. 71671186, and No. 71401167.
Author Contributions
Xiangqian Xu and Zhexuan Zhou conceived and designed the experiments; Xiangqian Xu performed the experiments; Yajie Dou and Yuejin Tan analyzed the data; Yajie Dou and Tianjun Liao contributed reagents/materials/analysis tools; Xiangqian Xu wrote the paper.
Conflicts of Interest
The authors declare no conflict of interest.
References
- Gelenbe, E.; Pujolle, G. The behaviour of a single queue in a general queueing network. Acta Inform. 1976, 7, 123–136. [Google Scholar] [CrossRef]
- Perros, H.G. A Symmetrical Exponential Open Queue Network with Blocking and Feedback. IEEE Trans. Softw. Eng. 2006, SE-7, 395–402. [Google Scholar] [CrossRef]
- Basharin, G.P.; Tolmachev, A.L. Theory of queuing networks and its applications to the analysis of information-computing systems. J. Sov. Math. 1985, 29, 951–1050. [Google Scholar] [CrossRef]
- Jun, K.P.; Perros, H.G. An approximate analysis of open tandem queueing networks with blocking and general service times. Eur. J. Oper. Res. 1990, 46, 123–135. [Google Scholar] [CrossRef]
- Chen, M.S.; Yen, H.W. Asymptotic Optimality of the Queue Service Probability for the Radial Basis Function Network-Based Queue Selection Rule. Comput. Ind. Eng. 2016, 94, 269–279. [Google Scholar] [CrossRef]
- Gurvich, I.; Whitt, W. Service-Level Differentiation in Many-Server Service Systems: A Solution Based on Fixed-Queue-Ratio Routing. Oper. Res. 2007, 58, 316–328. [Google Scholar] [CrossRef]
- Federgruen, A.; Groenevelt, H. Characterization and Optimization of Achievable Performance in General Queueing Systems. Oper. Res. 1988, 36, 733–741. [Google Scholar] [CrossRef]
- Miller, B.M. Optimization of queuing system via stochastic control. Automatica 2009, 45, 1423–1430. [Google Scholar] [CrossRef]
- Lin, C.; Ke, J. Optimization analysis for an infinite capacity queueing system with multiple queue-dependent servers: Genetic algorithm. Int. J. Comput. Math. 2011, 88, 1430–1442. [Google Scholar] [CrossRef]
- Xia, L.; Chen, X.; Cao, X.R. Policy iteration for customer-average performance optimization of closed queueing systems. Automatica 2009, 45, 1639–1648. [Google Scholar] [CrossRef]
- Xia, L.; Cao, X.R. Performance optimization of queueing systems with perturbation realization. Eur. J. Oper. Res. 2012, 218, 293–304. [Google Scholar] [CrossRef]
- Gonzalez, E.B.; Harrington, S.E.; Reed, D.C.; Smith, M.D. People Queue Optimization and Coordination. U.S. Patent Application No. US20160217412A1, 28 July 2016. [Google Scholar]
- Hess, M.; Kos, S.; Hess, S. Queueing System in Optimization Function of Port’s Bulk Unloading Terminal. Promet Traffic Transp. 2007, 19, 61–70. [Google Scholar] [CrossRef]
- Zhu, G.E.; Li, H.; Zhao, Z.H.; Li, J.T. Modeling and Multi-objective Optimization for Queuing System with QuickPass. J. Henan Norm. Univ. 2012, 3, 21–23. [Google Scholar]
- Pardo, M.J.; Fuente, D.D.L. A new technique to optimize the functions of fuzzy profit of queuing models: Application to a queuing model with publicity and renouncement. Comput. Math. Appl. 2009, 57, 850–864. [Google Scholar] [CrossRef]
- Ya-Qing, H.E.; Xie, Y.L.; Song, Q. Queuing Process Optimization of Medical Examination. Med. Innov. China 2013, 1, 090. [Google Scholar]
- Parlar, M.; Sharafali, M. Dynamic Allocation of Airline Check-In Counters: A Queueing Optimization Approach. Manag. Sci. 2008, 54, 1410–1424. [Google Scholar] [CrossRef]
- Parlar, M.; Rodrigues, B.; Sharafali, M. Event-based allocation of airline check-in counters: A simple dynamic optimization method supported by empirical data. Int. Trans. Oper. Res. 2016. [Google Scholar] [CrossRef]
- Dubi, A. The monte carlo method and optimization of spare parts in complex realistic scenarios. In Proceedings of the Rams ‘06 Reliability and Maintainability Symposium, Newport Beach, CA, USA, 23–26 January 2006; pp. 649–656. [Google Scholar] [CrossRef]
- Kushner, H.J.; Yang, J. A Monte Carlo method for sensitivity analysis and parametric optimization of nonlinear stochastic systems: The ergodic case. SIAM J. Control Optim. 1992, 30, 440–464. [Google Scholar] [CrossRef]
- Sorella, S. Wave function optimization in the variational Monte Carlo method. Phys. Rev. B Condens. Matter 2005, 71, 1103. [Google Scholar] [CrossRef]
- Tahara, D.; Imada, M. Variational Monte Carlo Method Combined with Quantum-Number Projection and Multi-Variable Optimization. J. Phys. Soc. Jpn. 2008, 77, 3304–3314. [Google Scholar] [CrossRef]
- Zhu, W.; Li, Y. GPU-accelerated differential evolutionary Markov Chain Monte Carlo method for multi-objective optimization over continuous space. In Proceedings of the 2nd Workshop on Bio-Inspired Algorithms for Distributed Systems, Washington, DC, USA, 11 June 2010; pp. 1–8. [Google Scholar] [CrossRef]
- Xu, X.; Zhang, A.; Cheng, Z.; Xiong, N. The performance of queue problem based on Monte Carlo method. J. Comput. Inf. Syst. 2012, 8, 3091–3099. [Google Scholar]
- Beck, T.L.; Doll, J.D.; Freeman, D.L. Locating stationary paths in functional integrals: An optimization method utilizing the stationary phase Monte Carlo sampling function. J. Chem. Phys. 1989, 90, 3181–3191. [Google Scholar] [CrossRef]
- Kim, H.C.; Nam, D.S.; Chan, H.; Kang, Y.S.; Woo, S.G.; Cho, H.K.; Han, W.S. Layer-specific illumination optimization by Monte Carlo method. Proc. SPIE 2003. [Google Scholar] [CrossRef]
- Hu, X.; Beratan, D.N.; Yang, W. A gradient-directed Monte Carlo method for global optimization in a discrete space: Application to protein sequence design and folding. J. Chem. Phys. 2009, 131, 154117. [Google Scholar] [CrossRef] [PubMed]
- Hua, Y.C.; Zhao, T.; Guo, Z.Y. Transient Thermal Conduction Optimization for Solid Sensible Heat Thermal Energy Storage Modules by the Monte Carlo Method. Energy 2017, 133, 338–347. [Google Scholar] [CrossRef]
Figure 1.
Model conceptual diagram.
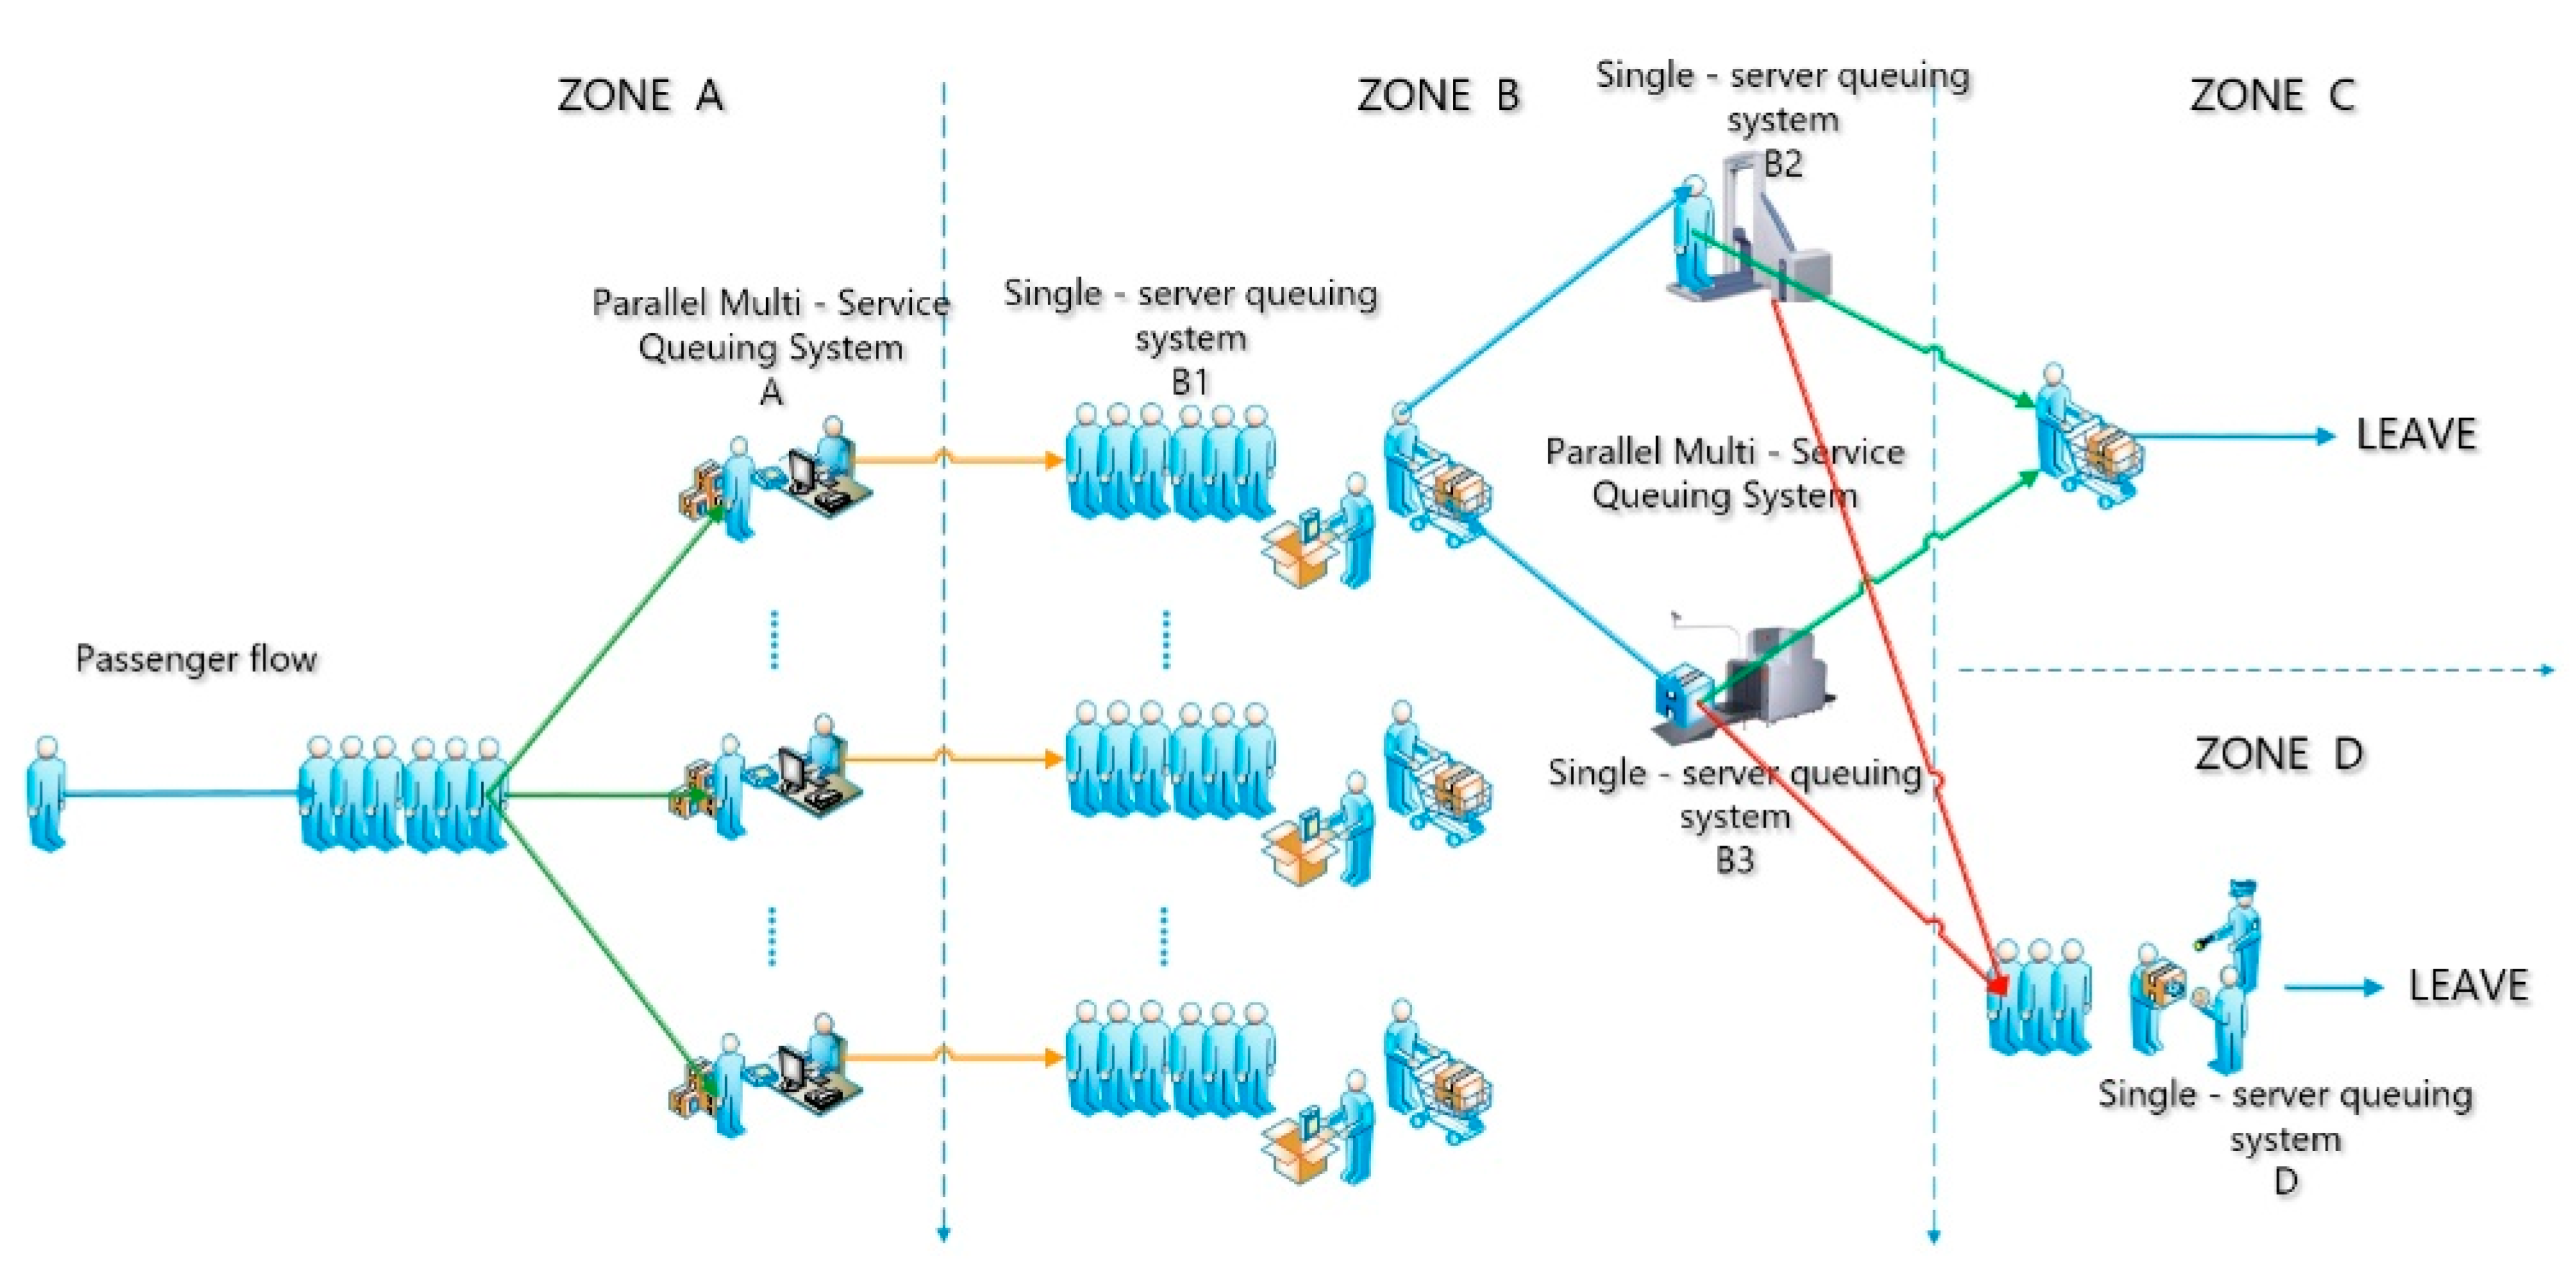
Figure 2.
Model framework.
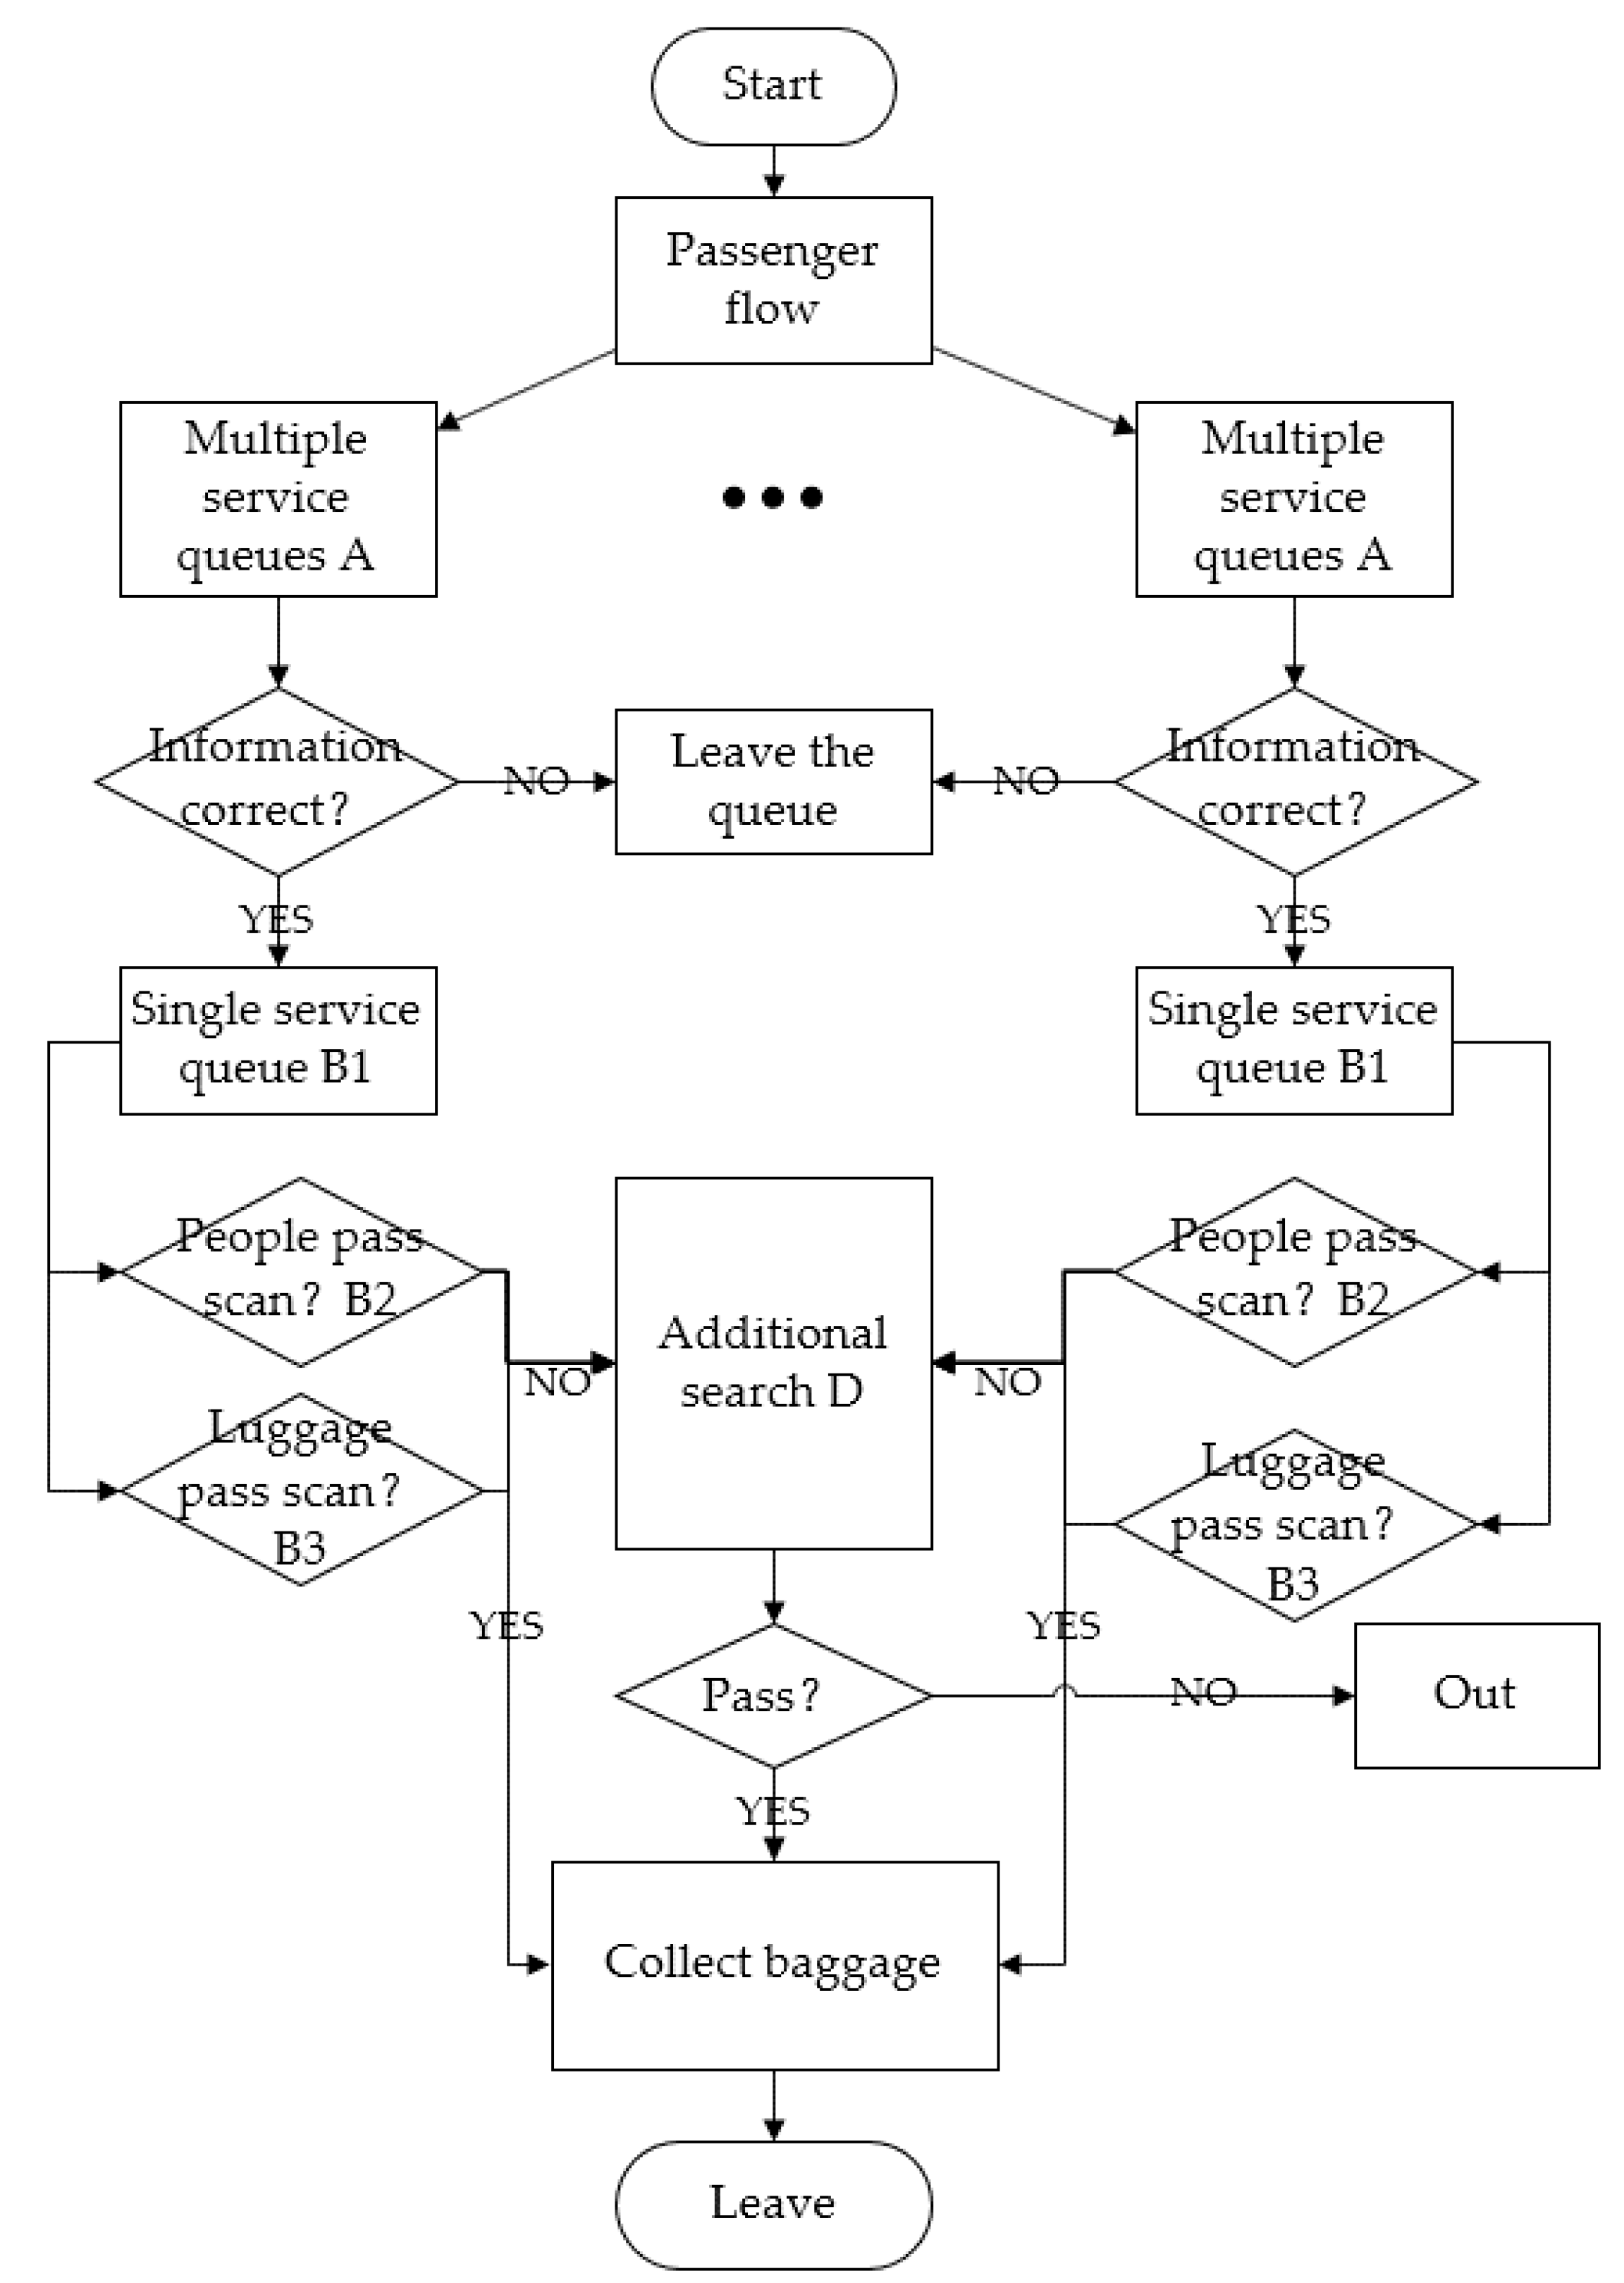
Figure 3.
Model simulation data.

Figure 4.
Model optimization diagram.

Figure 5.
Model optimization data diagram.

Figure 6.
Model optimization diagram.

Figure 7.
Model optimization data diagram.

Figure 8.
Model optimization data diagram.
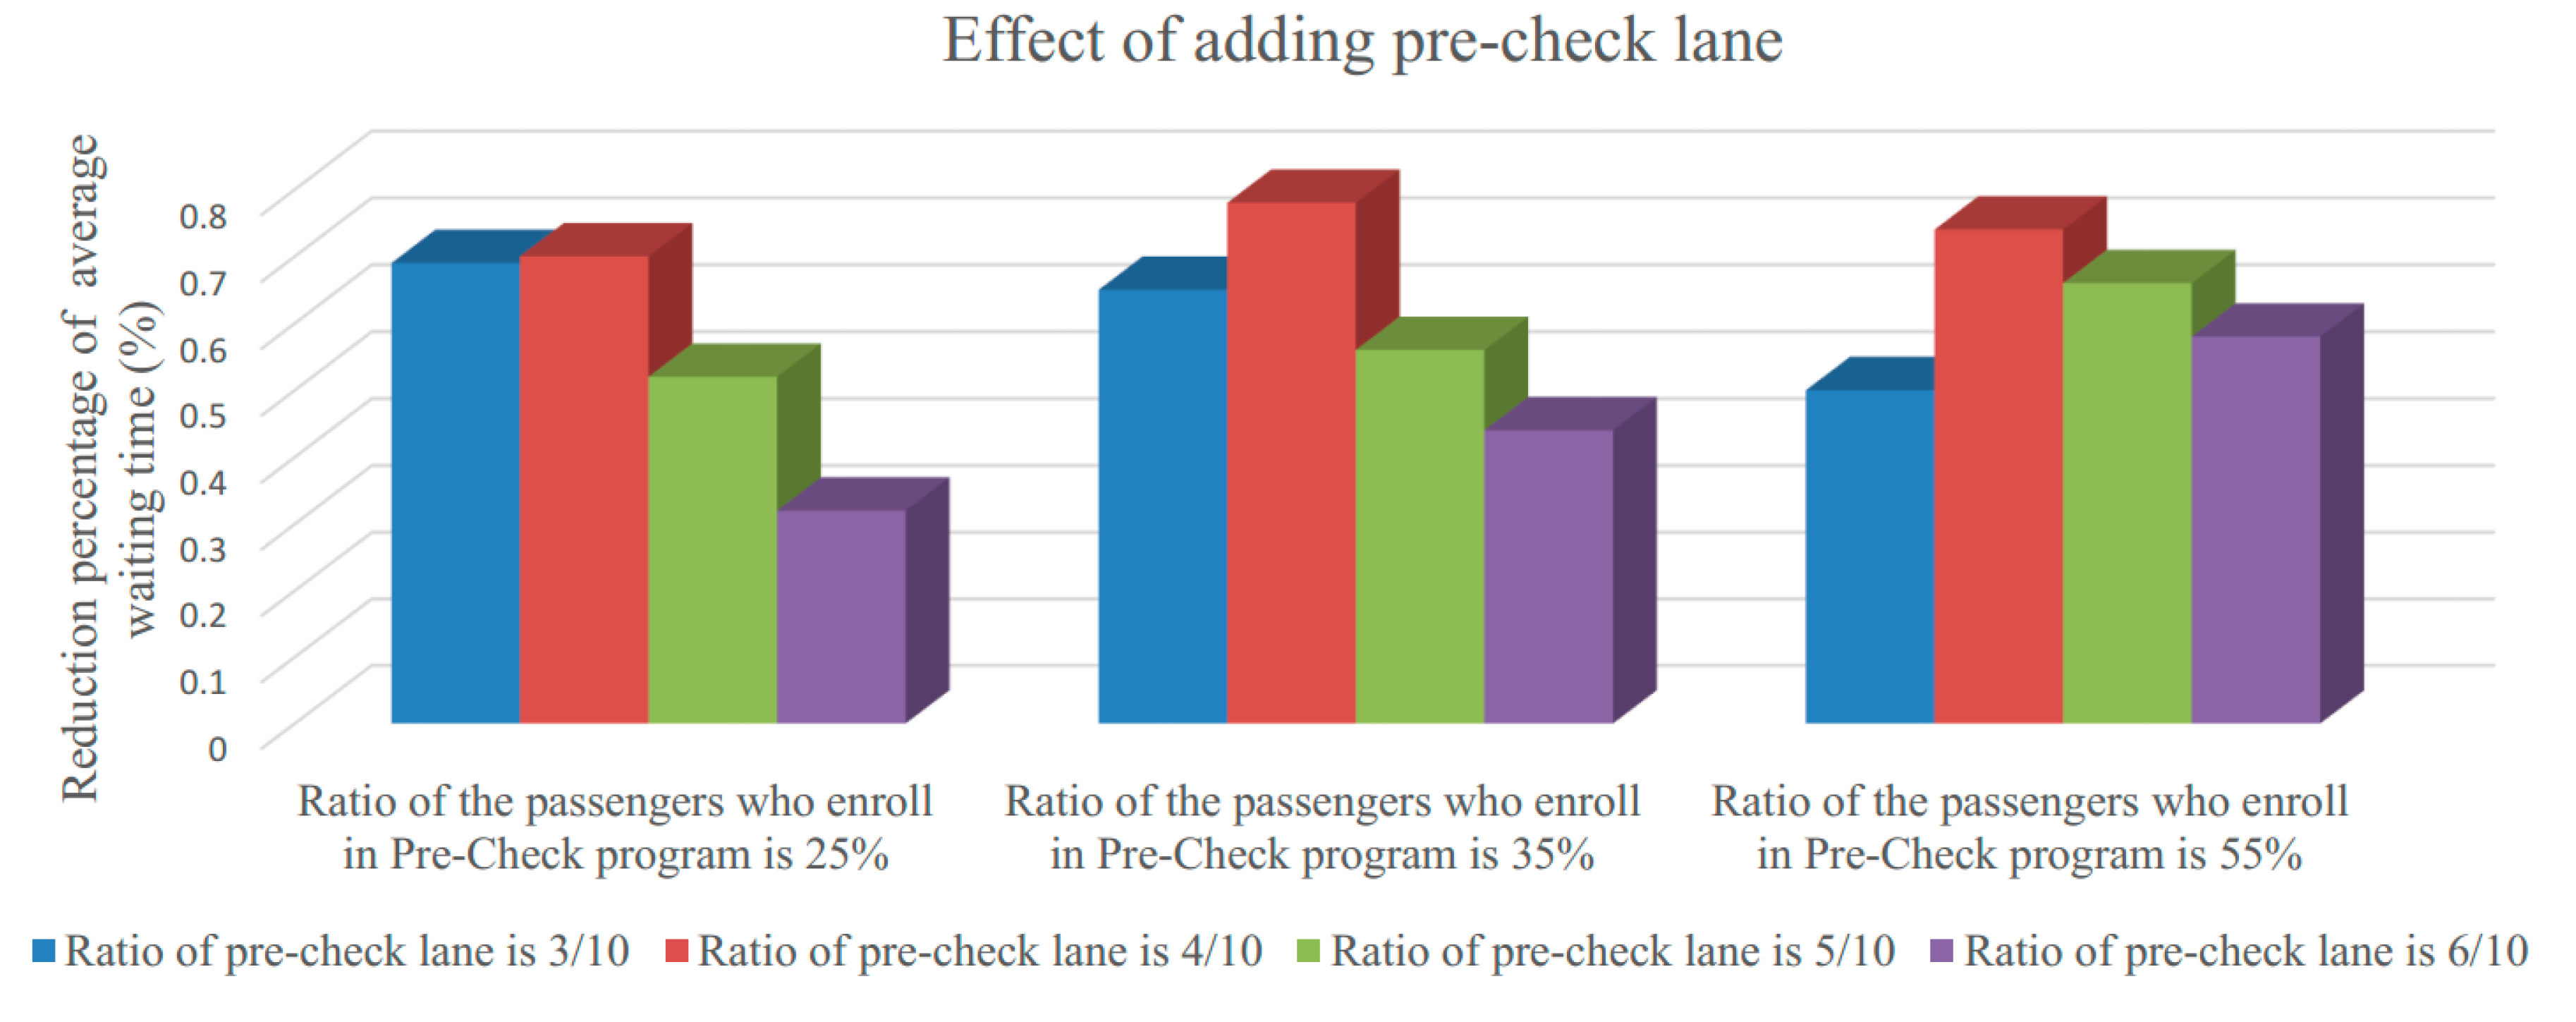
Figure 9.
Model optimization diagram.
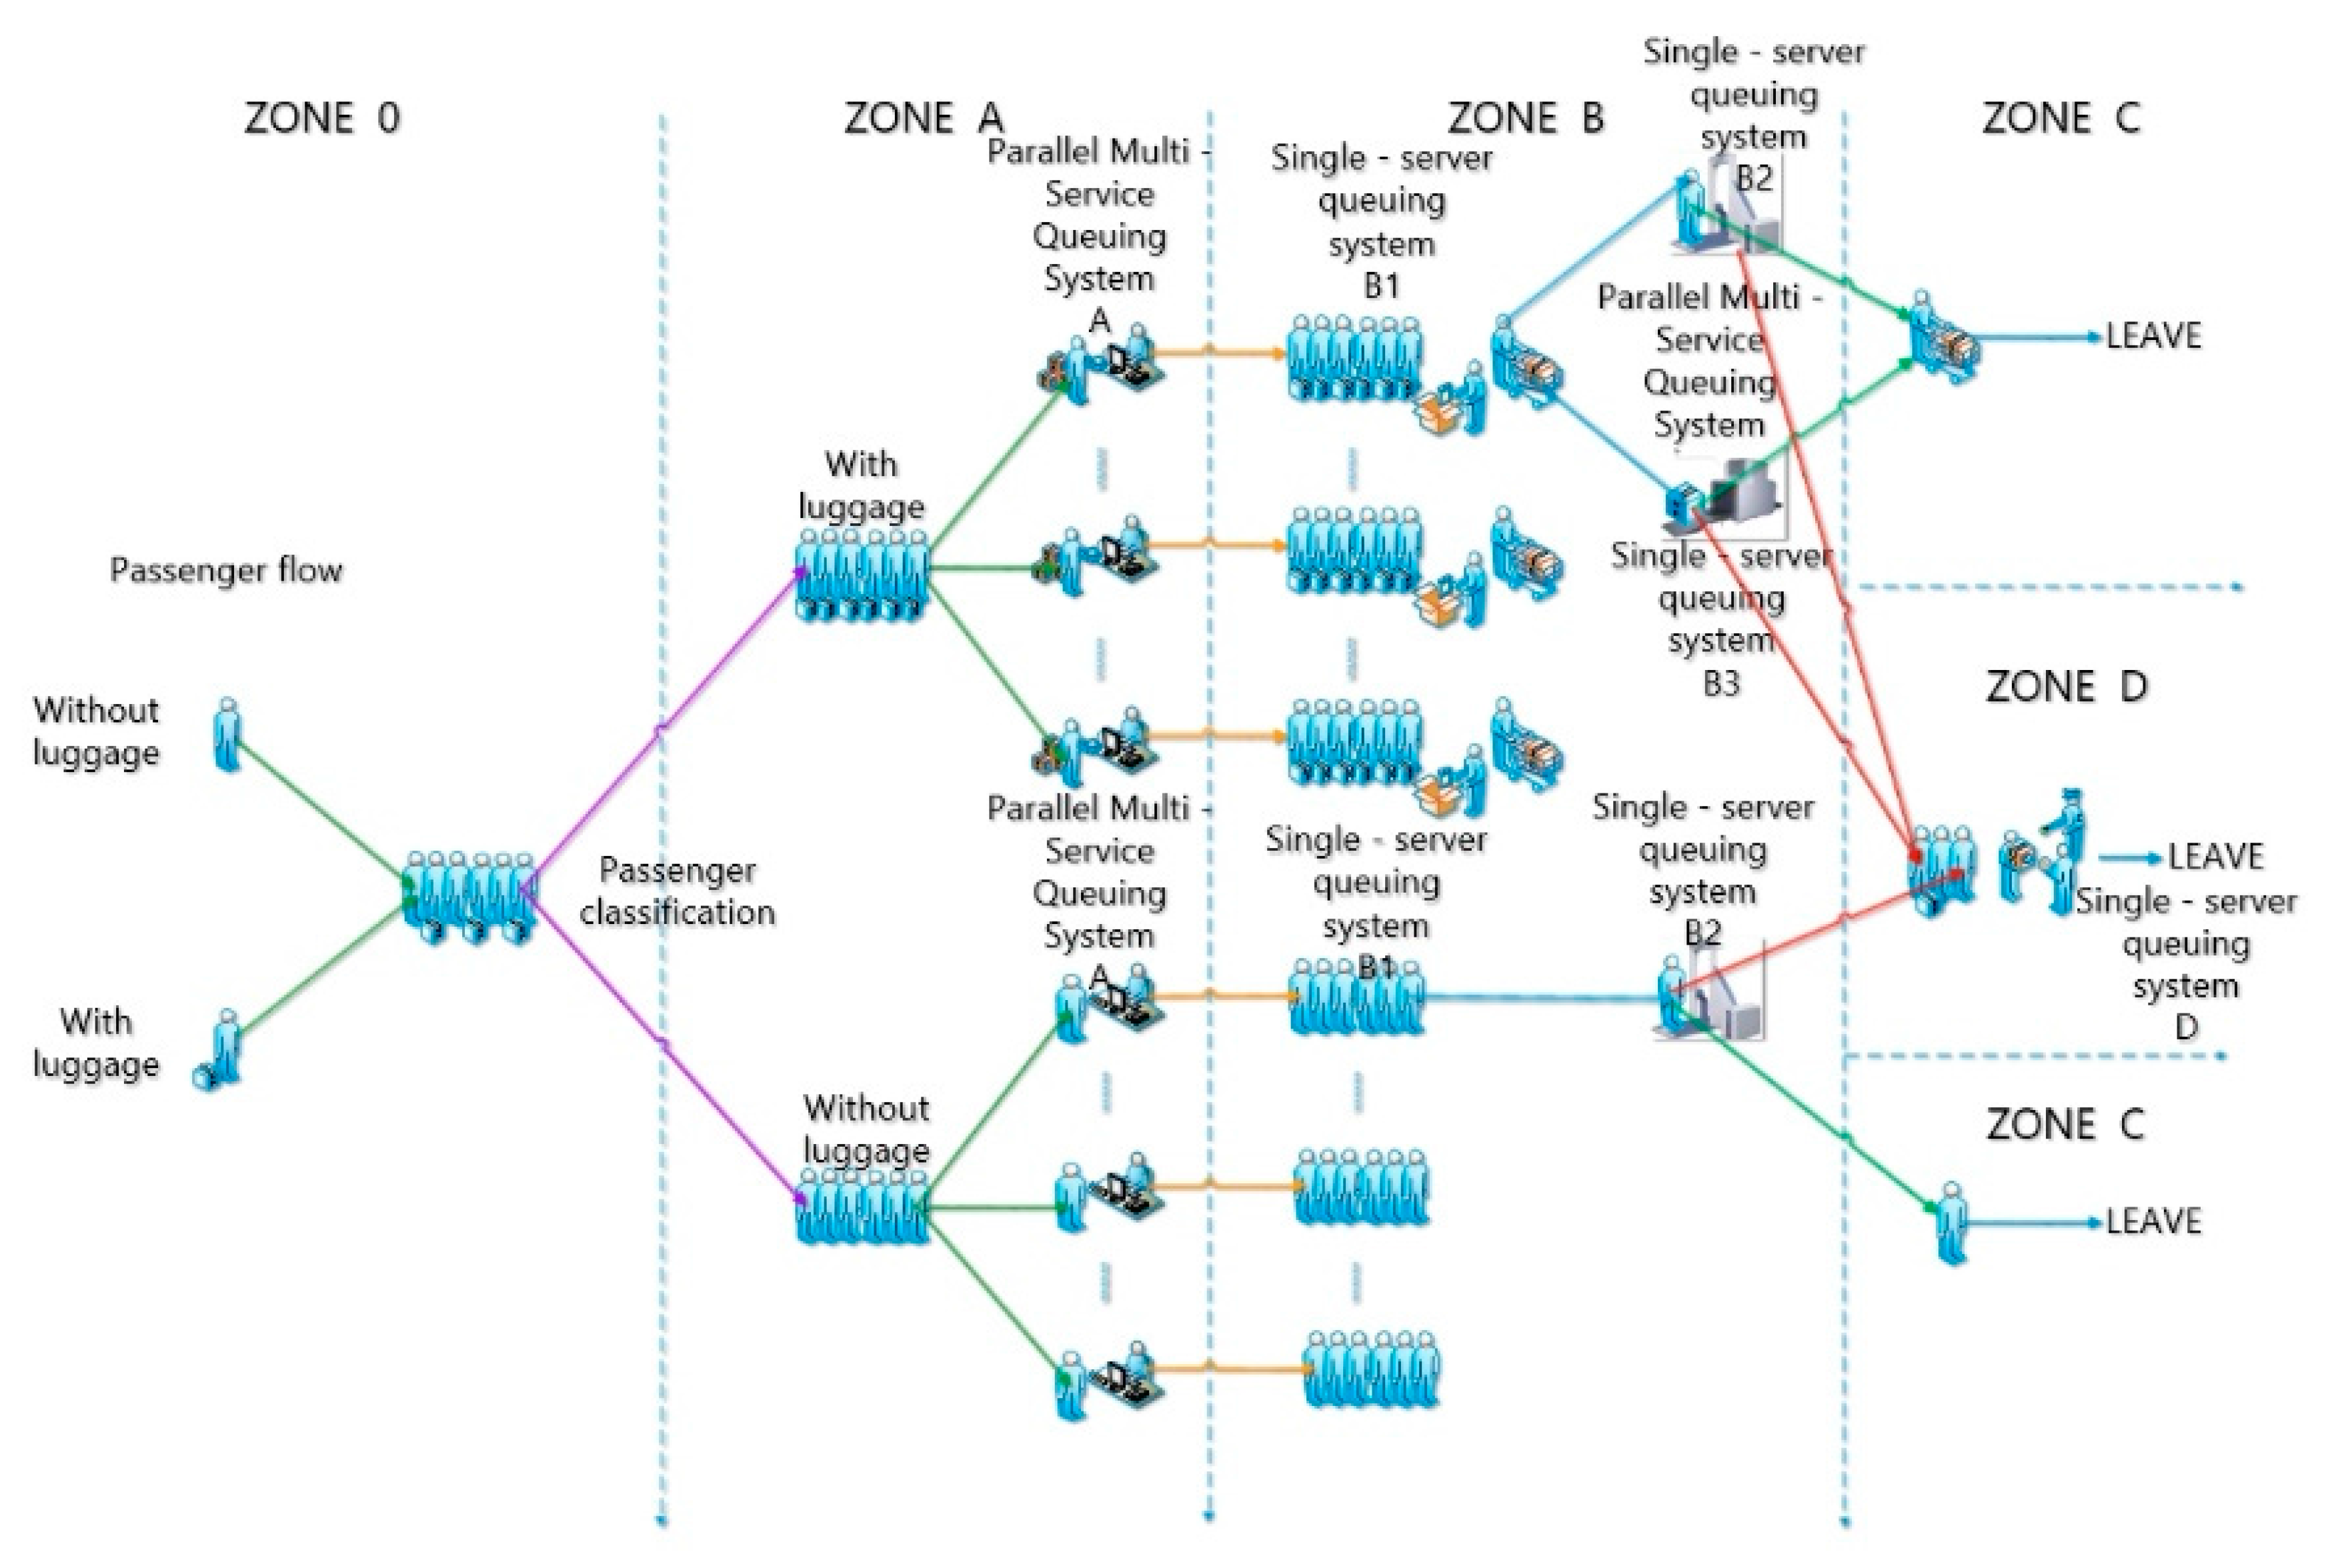
Figure 10.
Model optimization data diagram.
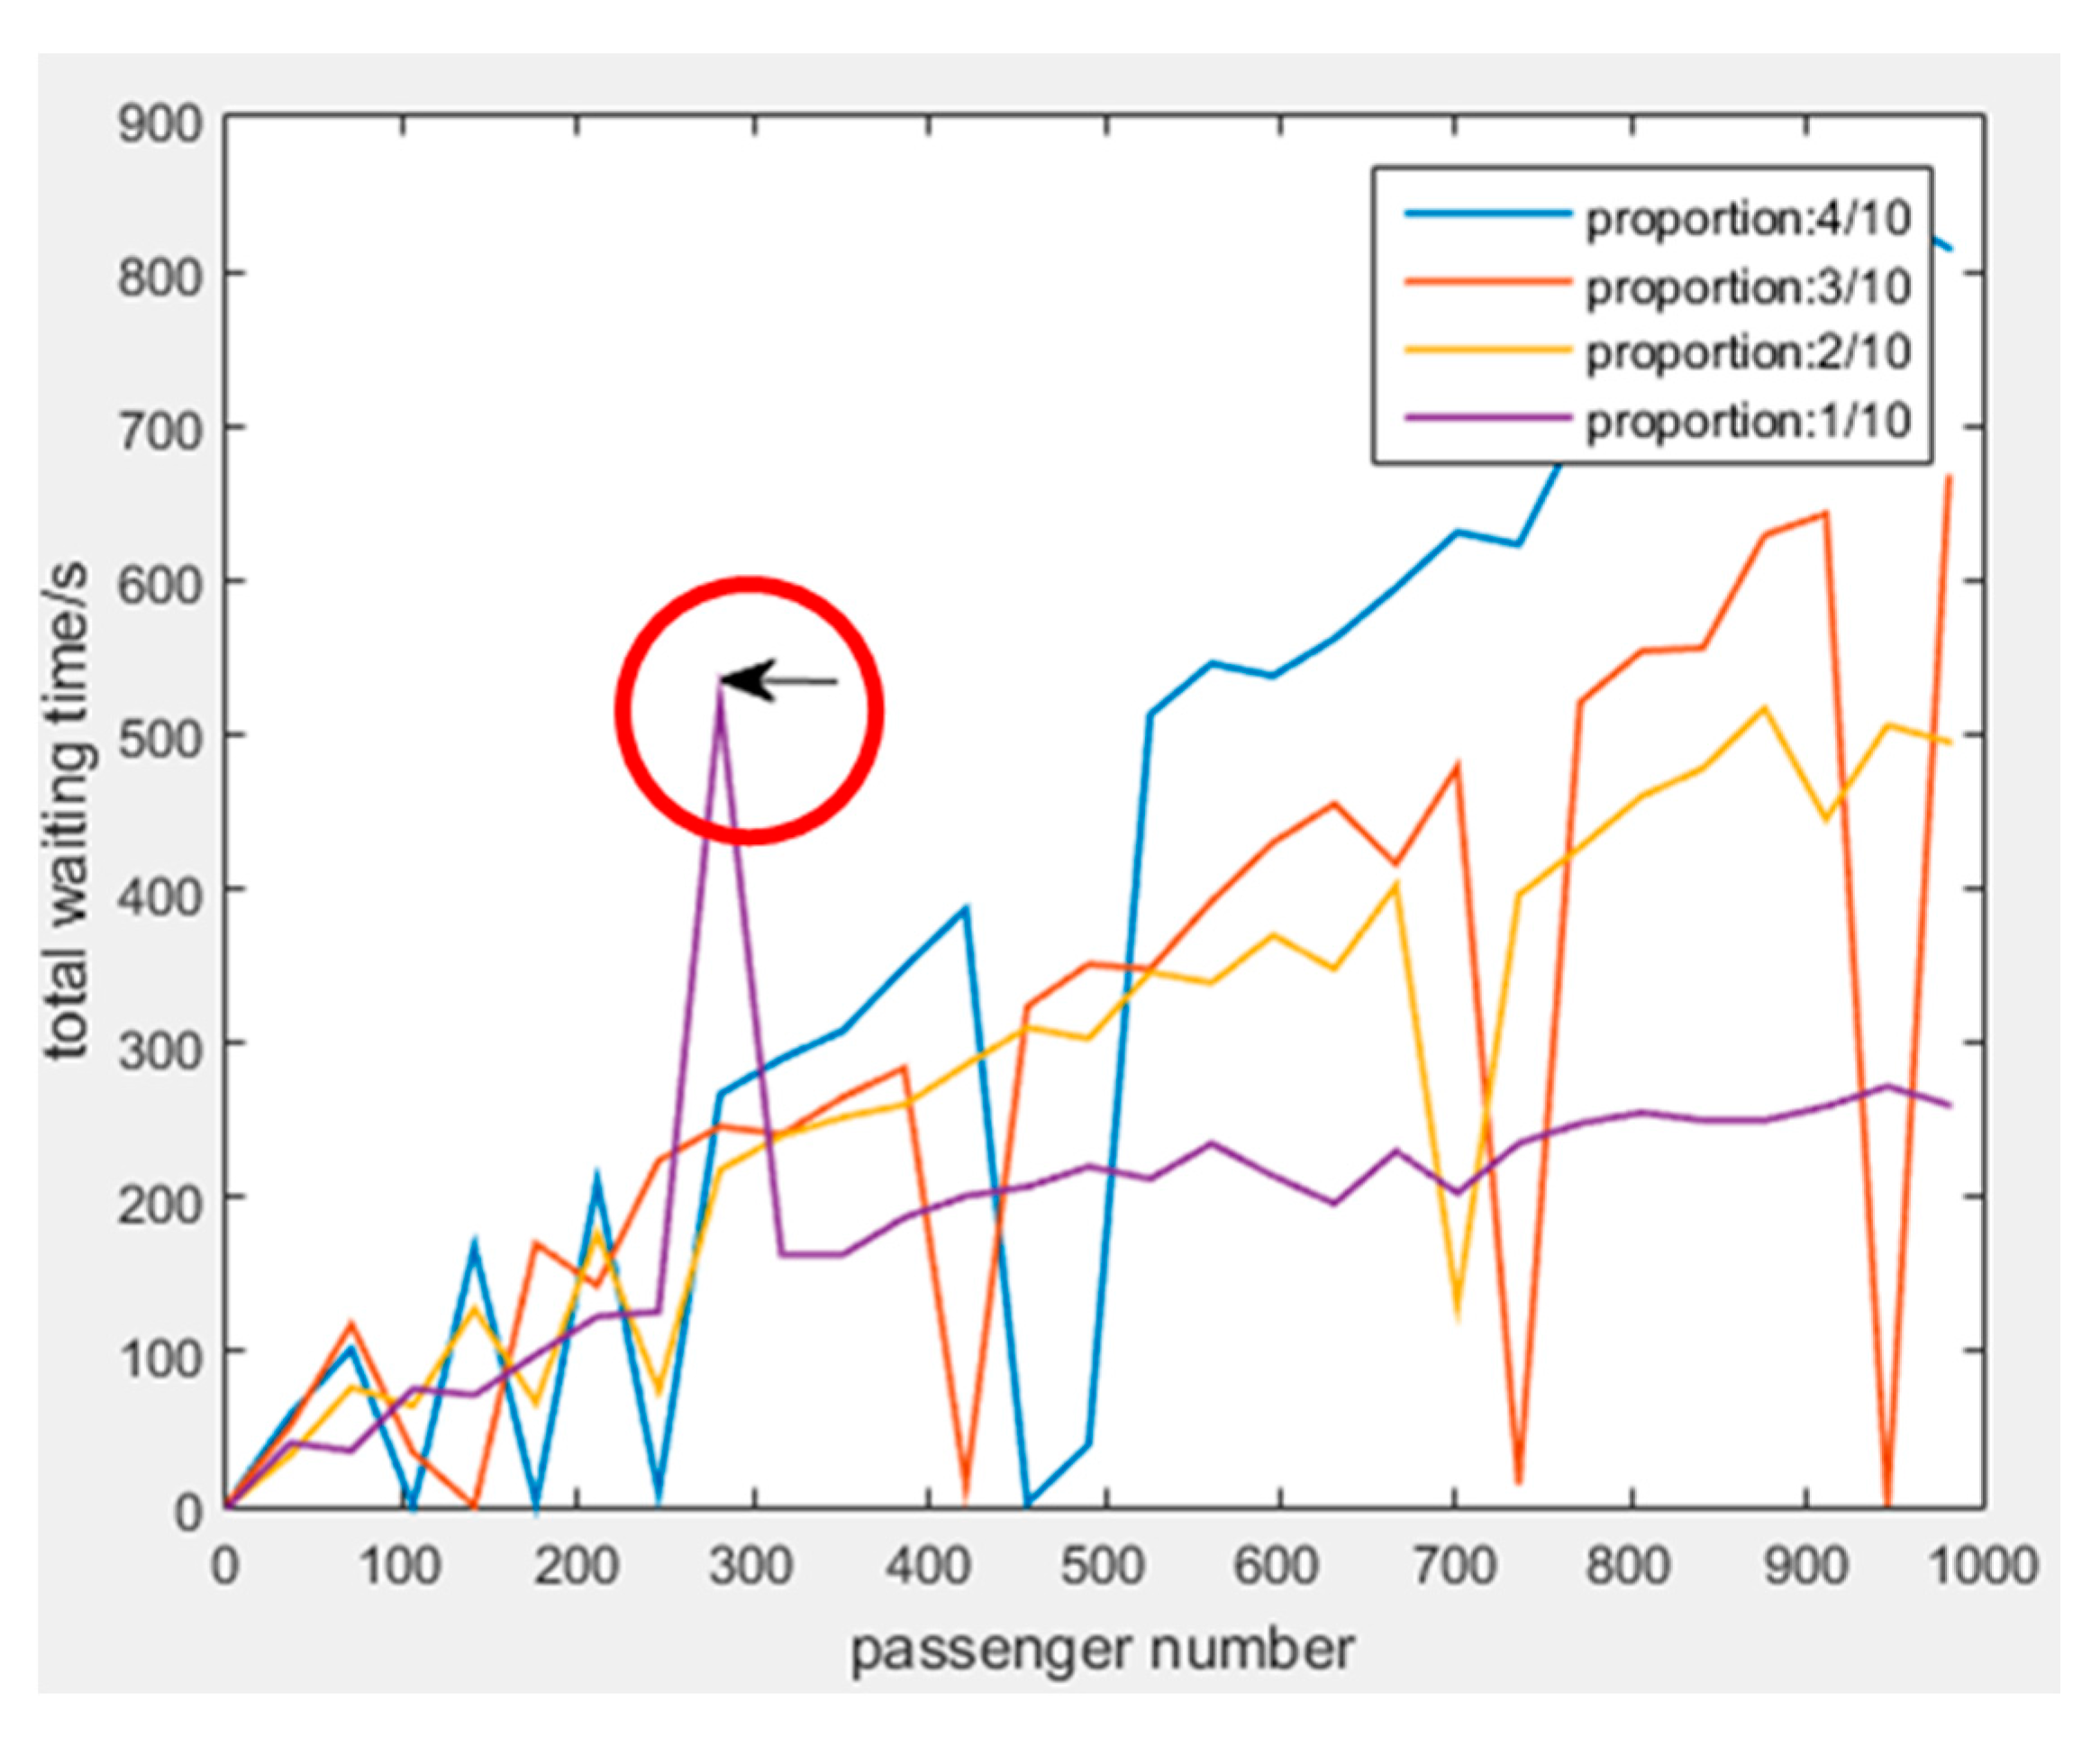
Figure 11.
Model optimization data diagram.
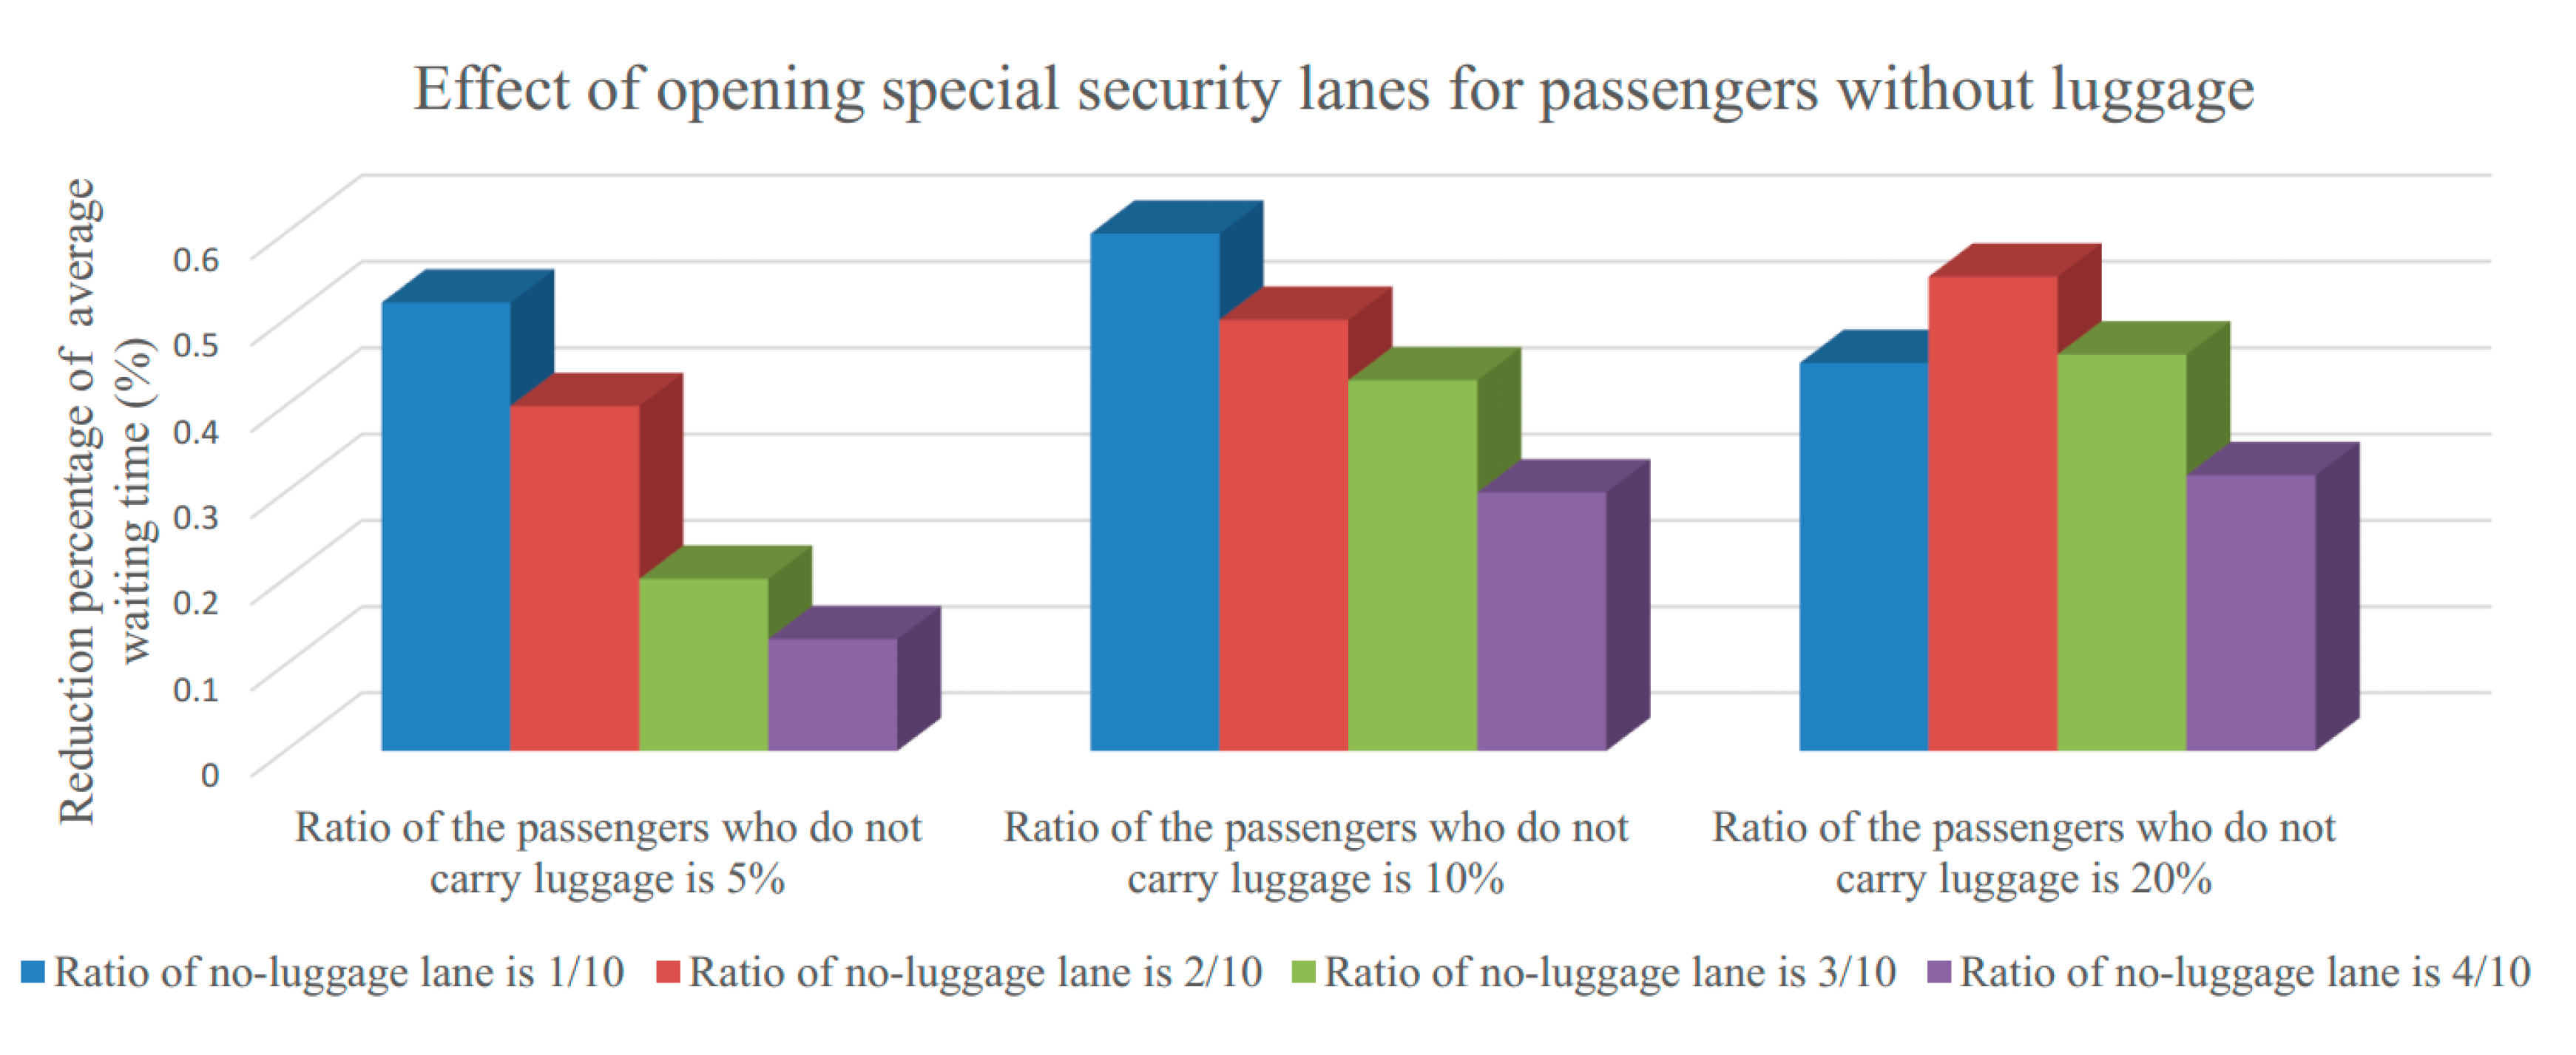
Figure 12.
World cultural regions.

Figure 13.
Sensitivity analysis.
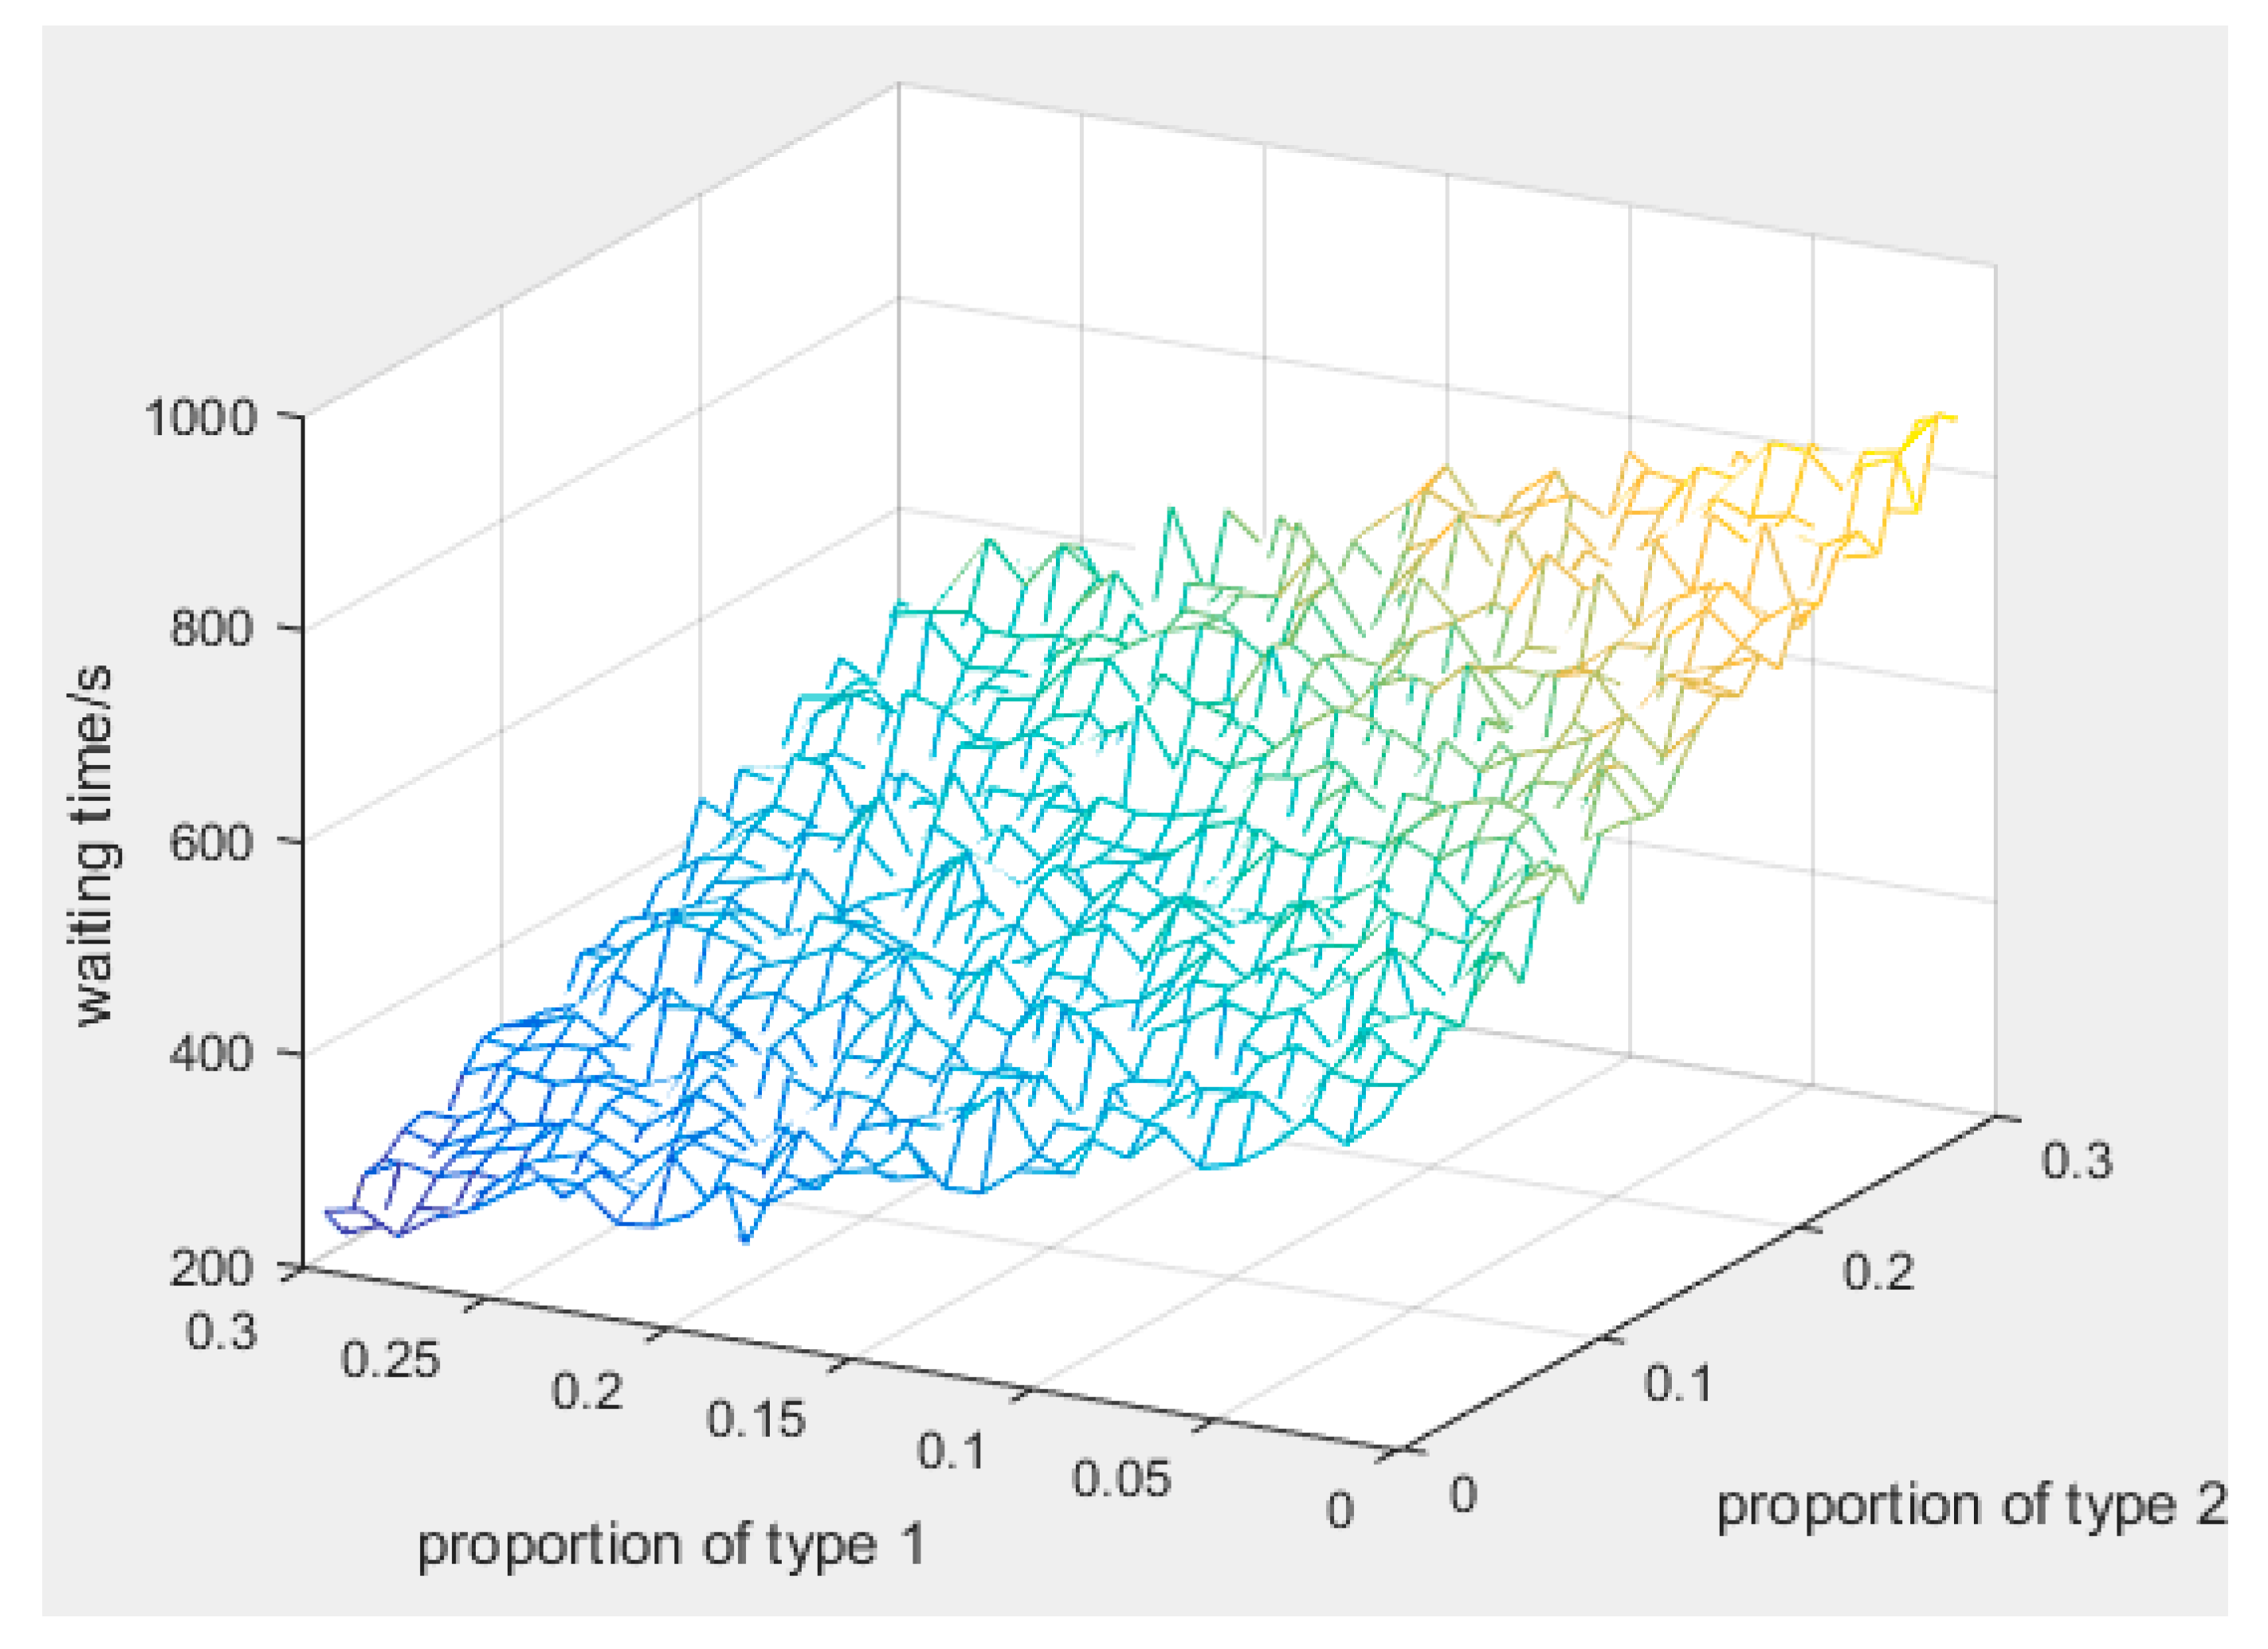
Figure 14.
Effectiveness analysis of solutions.

Table 1.
Model simulation data.
| Procedure A | Procedure B1 | Procedure B2, B3 | |
|---|---|---|---|
| Average waiting () | 173.165 | 251.5098 | 62.91596 |
| Max waiting time () | 401.956 | 821.216 | 140.774 |
| Min waiting time () | 71.196 | 82.696 | 25.004 |
| Bottleneck | √ |
Table 2.
Model optimization data chart.
| Single-Service () | Multi-Service () | Multi-Service () | |
|---|---|---|---|
| Average waiting (s) | 503.1824 | 237.358 | 268.4849 |
| Waiting time variance (s2) | 29,052.37 | 7286.412 | 13,666.57 |
| Reduction percentage of (%) | 0 | 52.8 | 46.6 |
| Reduction percentage of (%) | 0 | 74.9 | 52.9 |
| Optimal choice | √ |
Table 3.
Model optimization data chart.
| Ratio of Special Lane | 0/10 | 3/10 | 4/10 | 5/10 | 6/10 |
|---|---|---|---|---|---|
| Average waiting (s) | 503.1824 | 221.129 | 136.436 | 192.769 | 256.906 |
| Waiting time variance (s2) | 29,052.37 | 57,578.8193 | 4835.7776 | 27,367.1699 | 63,822.9771 |
| Reduction percentage of (%) | 0 | 56.1 | 72.9 | 61.7 | 48.9 |
| Reduction percentage of (%) | 0 | −98.2 | 83.4 | 5.8 | −119.7 |
| Optimal choice | √ |
Table 4.
Model optimization data chart.
| Ratio of Special Lane | 0/10 | 4/10 | 3/10 | 2/10 | 1/10 |
|---|---|---|---|---|---|
| Average waiting (s) | 503.1824 | 391.251 | 306.626 | 276.379 | 246.317 |
| Waiting time variance (s2) | 29,052.37 | 78,635.154 | 43,227.802 | 21,501.949 | 19,401.721 |
| Reduction percentage of (%) | 0 | 22.2 | 39.1 | 45.1 | 51.1 |
| Reduction percentage of (%) | 0 | −170.7 | −48.8 | 25.9 | 33.2 |
| Optimal choice | √ |
Table 5.
Sensitivity analysis.
| Percentage of Disturbance Factors | 0 | 2% | 5% | 10% | 20% | |
|---|---|---|---|---|---|---|
| fast-moving passengers | Average waiting (s) | 495.4621 | 473.3676 | 443.1484 | 392.262 | 298.7188 |
| Waiting time variance () | 26,834.33 | 26,424.1 | 24,306.35 | 20,921.87 | 14,766.16 | |
| slow-moving passengers | Average waiting (s) | 494.7805 | 519.0616 | 554.232 | 613.7367 | 693.7367 |
| Waiting time variance () | 27,256.42 | 28,080.21 | 29,962.46 | 32,970.74 | 38,334.89 | |
Table 6.
Sensitivity analysis of solutions.
| Percentage of Disturbance Factors | 0 | 2% | 5% | 10% | 20% | |
|---|---|---|---|---|---|---|
| Alternate lane | Average waiting (s) | 512.052 | 521.9077 | 488.0674 | 531.435 | 537.2645 |
| Waiting time variance () | 26,669.16 | 27,942.5 | 21,803.74 | 26,705.46 | 32,517.42 | |
| No Alternate lane | Average waiting (s) | 494.7805 | 519.0616 | 554.232 | 613.7367 | 693.7367 |
| Waiting time variance () | 27,256.42 | 28,080.21 | 29,962.46 | 32,970.74 | 38,334.89 | |
© 2018 by the authors. Licensee MDPI, Basel, Switzerland. This article is an open access article distributed under the terms and conditions of the Creative Commons Attribution (CC BY) license (http://creativecommons.org/licenses/by/4.0/).
Share and Cite
MDPI and ACS Style
Xu, X.; Zhou, Z.; Dou, Y.; Tan, Y.; Liao, T. Sustainable Queuing-Network Design for Airport Security Based on the Monte Carlo Method. Sustainability 2018, 10, 1. https://doi.org/10.3390/su10020001
AMA Style
Xu X, Zhou Z, Dou Y, Tan Y, Liao T. Sustainable Queuing-Network Design for Airport Security Based on the Monte Carlo Method. Sustainability. 2018; 10(2):1. https://doi.org/10.3390/su10020001
Chicago/Turabian StyleXu, Xiangqian, Zhexuan Zhou, Yajie Dou, Yuejin Tan, and Tianjun Liao. 2018. "Sustainable Queuing-Network Design for Airport Security Based on the Monte Carlo Method" Sustainability 10, no. 2: 1. https://doi.org/10.3390/su10020001
Note that from the first issue of 2016, this journal uses article numbers instead of page numbers. See further details here.