Article

Physical Forcing-Driven Productivity and Sediment Flux to the Deep Basin of Northern South China Sea: A Decadal Time Series Study

1
Taiwan Ocean Research Institute, National Applied Research Laboratories, Kaohsiung 80143, Taiwan
2
Department of Oceanography, National Sun Yat-sen University, Kaohsiung 80424, Taiwan
3
Geosat Aerospace and Technology Inc., Tainan 701, Taiwan
*
Author to whom correspondence should be addressed.
Sustainability 2018, 10(4), 971; https://doi.org/10.3390/su10040971
Submission received: 30 January 2018 / Revised: 23 March 2018 / Accepted: 26 March 2018 / Published: 27 March 2018
(This article belongs to the Special Issue Marine Carbon Cycles)

Abstract

:
Understanding the driving forces of absorption of anthropogenic CO2 by the oceans is critical for a sustainable ocean carbon cycle. Decadal sinking particle flux data collected at 1000 m, 2000 m, and 3500 m at the South East Asia Time Series Study (SEATS) Station (18° N, 116° E), which was located in the northern South China Sea (nSCS), show that the fluxes undergo strong seasonal and interannual variability. Changes in the flux data are correlated with the satellite-derived chlorophyll-a concentration, indicating that the mass fluxes of the sinking particles are largely controlled by the export production at or near the SEATS station. The cooling of seawater and the strengthening of wind in winter increase the nutrient inventories in the euphotic zone, thus also increasing export production in the nSCS. This study reveals that the intrusion of low-nutrient seawater from the West Philippine Sea into the nSCS significantly reduces the productivity, and hence the flux, of sinking particles.

1. Introduction

The oceans absorb about 1/4 of anthropogenic (human released) CO2, reducing CO2 concentration, and thus mitigate the greenhouse effect of the atmosphere [1,2,3]. Atmospheric CO2 dissolves into the surface oceans through air-sea CO2 exchange, and then transports to the deeper oceans by thermohaline circulation, in a process that is called the physical pump. Phytoplankton turn some of the dissolved CO2 into organic carbon through photosynthesis. Some fixed organic carbon sinks to the deeper oceans and decompose, and may eventually settle onto the seabed as sediments. The sequestration of CO2 from the atmosphere or euphotic layer through ocean microorganisms and to deeper oceans via particle sinking is called the biological pump. The process has several major steps, namely photosynthesis, grazing, respiration, dying, sinking, organic matter decomposition, CaCO3 dissolution, and sedimentation. Quantifying the carbon fluxes to the deep oceans is a prerequisite for understanding global carbon cycles and budgets.
Seawater in oceans contains 50 times as much CO2 as the atmosphere [4]. Hence, understanding how carbon cycles in the oceans is critical to predicting the influence of the ocean on released anthropogenic CO2 and the changing climate. The Joint Global Ocean Flux Study (JGOFS) is an international and multi-disciplinary program, which was launched in 1987 with participants from over 20 nations, and has significantly improved understanding of the role of the oceans in the carbon cycle and climate change. The South East Asia Time Series Study (SEATS) was initially established at the west of the Luzon Strait in August 1998 as a part of the time series study in the JGOFS. The site was then relocated to the northern South China Sea (nSCS) (18° N, 116° E) in August 1999 (Figure 1). The tasks in SEATS include continual seawater sampling at various depths, obtaining basic hydrographic data, and collecting sinking particles using moored sediment traps deployed at depths of either 1000 m and 3500 m or 2000 m and 3500 m. Wong et al. [5] describes the SEATS program in detail.
The National Center for Ocean Research (NCOR, Taiwan) collected moored sediment trap samples between 2003 and 2009. The Taiwan Ocean Research Institute (TORI, Taiwan) has collected the sinking particles using the same moored system since 2013. This study presents the decadal mass, particulate organic carbon (POC), and particulate organic nitrogen (PON) fluxes at the SEATS site. It also discusses the strong inter-annual variations of the fluxes, and a previously unknown driving force of productivity, the intrusion of West Philippine Sea (WPS) seawater.

2. Materials and Methods

Sinking particles were collected by moored sediment traps (Technicap) with collecting areas of 1 m2 (PPS 5/2) or 0.05 m2 (PPS 4/3) deployed at depths of either 1000 m and 3500 m or 2000 m and 3500 m at the SEATS station (bottom depth 3800 m). Each trap was equipped with 24 × 500 mL receiving bottles. Generally, each deployment covered a half-year duration and had collection intervals of eight days (1 m2 sediment traps) or 16 days (0.05 m2 sediment traps). The deployment periods were (yyyy/mm/dd date format) 2003/4/15–2003/7/13, 2004/8/8–2005/2/15, 2005/4/1–2005/10/9, 2005/11/15–2006/5/25, 2006/7/8–2007/7/27, 2008/6/6–2008/12/14, 2008/12/24–2009/7/3, 2013/9/20–2014/3/30, 2014/4/15–2014/10/23, 2014/11/21–2015/5/31, 2015/6/26–2016/1/4 (16-day collection interval), and 2016/1/8–2016/7/18 (16-day collection interval). Each receiving bottle was filled before deployment 0.2 μm filtered in-situ seawater with additional NaCl brine equivalent to a salinity of 235. The toxic chemical HgCl2 was then added to make a concentration of 1 g/L for preservation. Upon retrieval of the traps, the receiving bottles were capped and stored at 4 °C before bringing them back to the laboratory. Each trap sample was pre-filtered by a 1 mm × 1 mm pore size sieve to remove swimmers and large particles, and were split into eight fractions for further experiments. One fraction was used to determine the mass flux.
The filtrate was filtered through a pre-weighted 47 mm MF™ Membrane filter paper (0.45 μm pore size). The filters were then rinsed by deionized water to remove salt, and freeze dried and weighted for the total mass. The mass flux in this study refers to the mass of flux that passed through the 1 mm × 1 mm pore size sieve. For reference, Figure 2 shows photos of particles on the 1 mm × 1 mm pore size sieve and on the filter paper. Several shells of Thecosomata (sea butterflies) can be recognized in the photos. Some almost-zero fluxes data observed in January to March 2014 and February to May 2015 for 2000 m depth, and February to March 2014 for 3500 m depth, are not shown in this study. The reason for these low outlying values remains unclear, but it may be due to mechanical failure.
Samples of approximate size 5 mg were taken from the MF™ filter paper and then put into a silver box to be adopted for POC and PON measurements. HCl was then added to the samples to dissolve the mineral CaCO3. Samples were dried and wrapped, and then loaded into an elemental analyzer to detect the total carbon and nitrogen contents. The POC and PON measurements had precision values that were better than 5%. The IVA High Organic Content Sediment Standard with POC and PON percentages of 9.15 ± 0.13% and 0.62 ± 0.03%, respectively, was used to monitor the instrumental condition after every five samples. The POC and PON of the samples that were collected between 2013/9/20 and 2016/1/4 were measured within two months after back to the laboratory, while those collected between 2016/1/8 and 2016/7/18 took several months longer to measure.
The potential temperature and salinity were measured by the Seabird manufactured 911 plus Conductivity-Temperature-Depth (CTD) unit at the SEATS station (R/V Ocean Researcher I cruise ORI-1144 on 2016/8/10, R/V Ocean Researcher III cruises ORIII-1814 on 2014/11/20, ORIII-1863 on 2015/6/25, ORIII-1906 on 2016/1/5, and R/V Ocean Researcher V cruises ORV-1309-3 on 2013/9/14, and ORV-0038 on 2014/5/25) and at the C13b station in the WPS (R/V Ocean Researcher V cruise ORV-0043 on 2014/8/25). The satellite-derived level-2 chlorophyll-a data were measured by Moderate Resolution Imaging Spectroradiometer (MODIS) by Terra and Aqua with 50 × 50 km2 in area (centered at SEATS, 18° N, 116° E ) and 1 km2 in resolution. The values were calculated by the O’Reilly band ratio OC3M algorithm [6] and the Hu color index algorithm [7] using remote sensing reflectances in the 440–670 nm spectral bands. The Terra and Aqua MODIS instruments each acquired data once daily in the South China Sea at around 01:00–03:15 (GMT) and 04:10–06:20 (GMT), respectively. The monthly moving average, referring to a 30-day average of both Terra and Aqua data, was adopted to remove daily fluctuations.

3. Results and Discussion

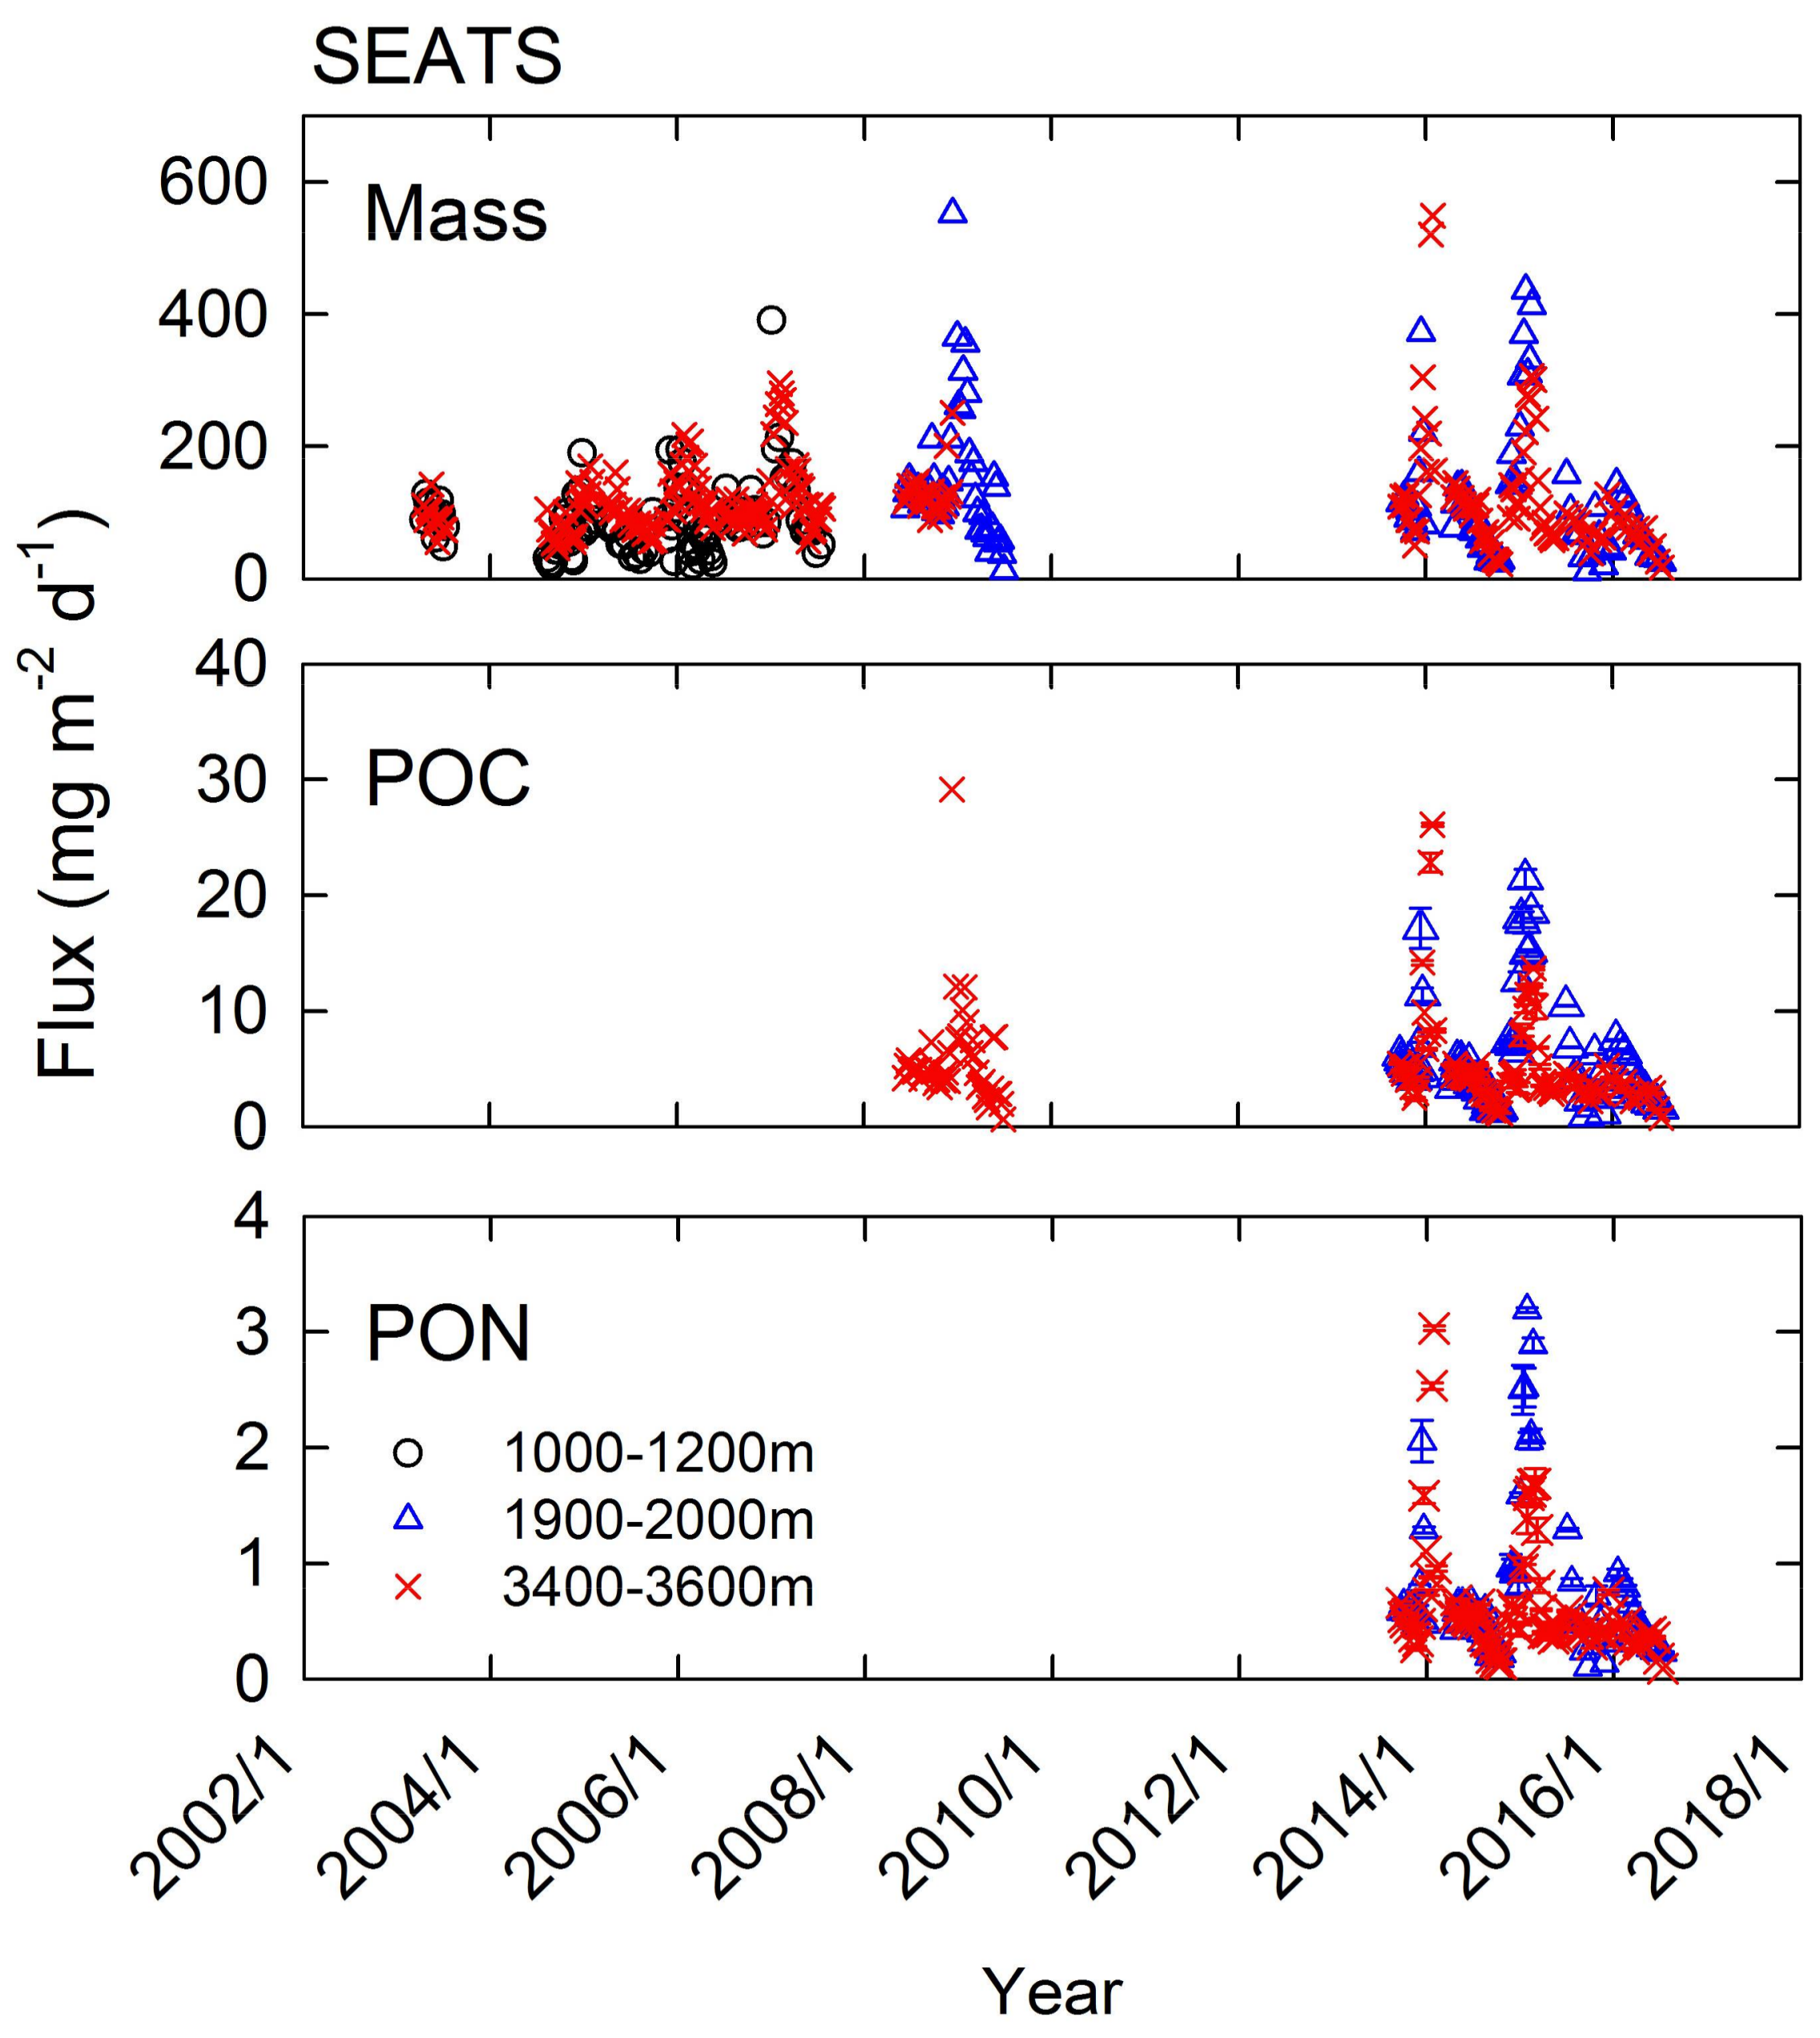
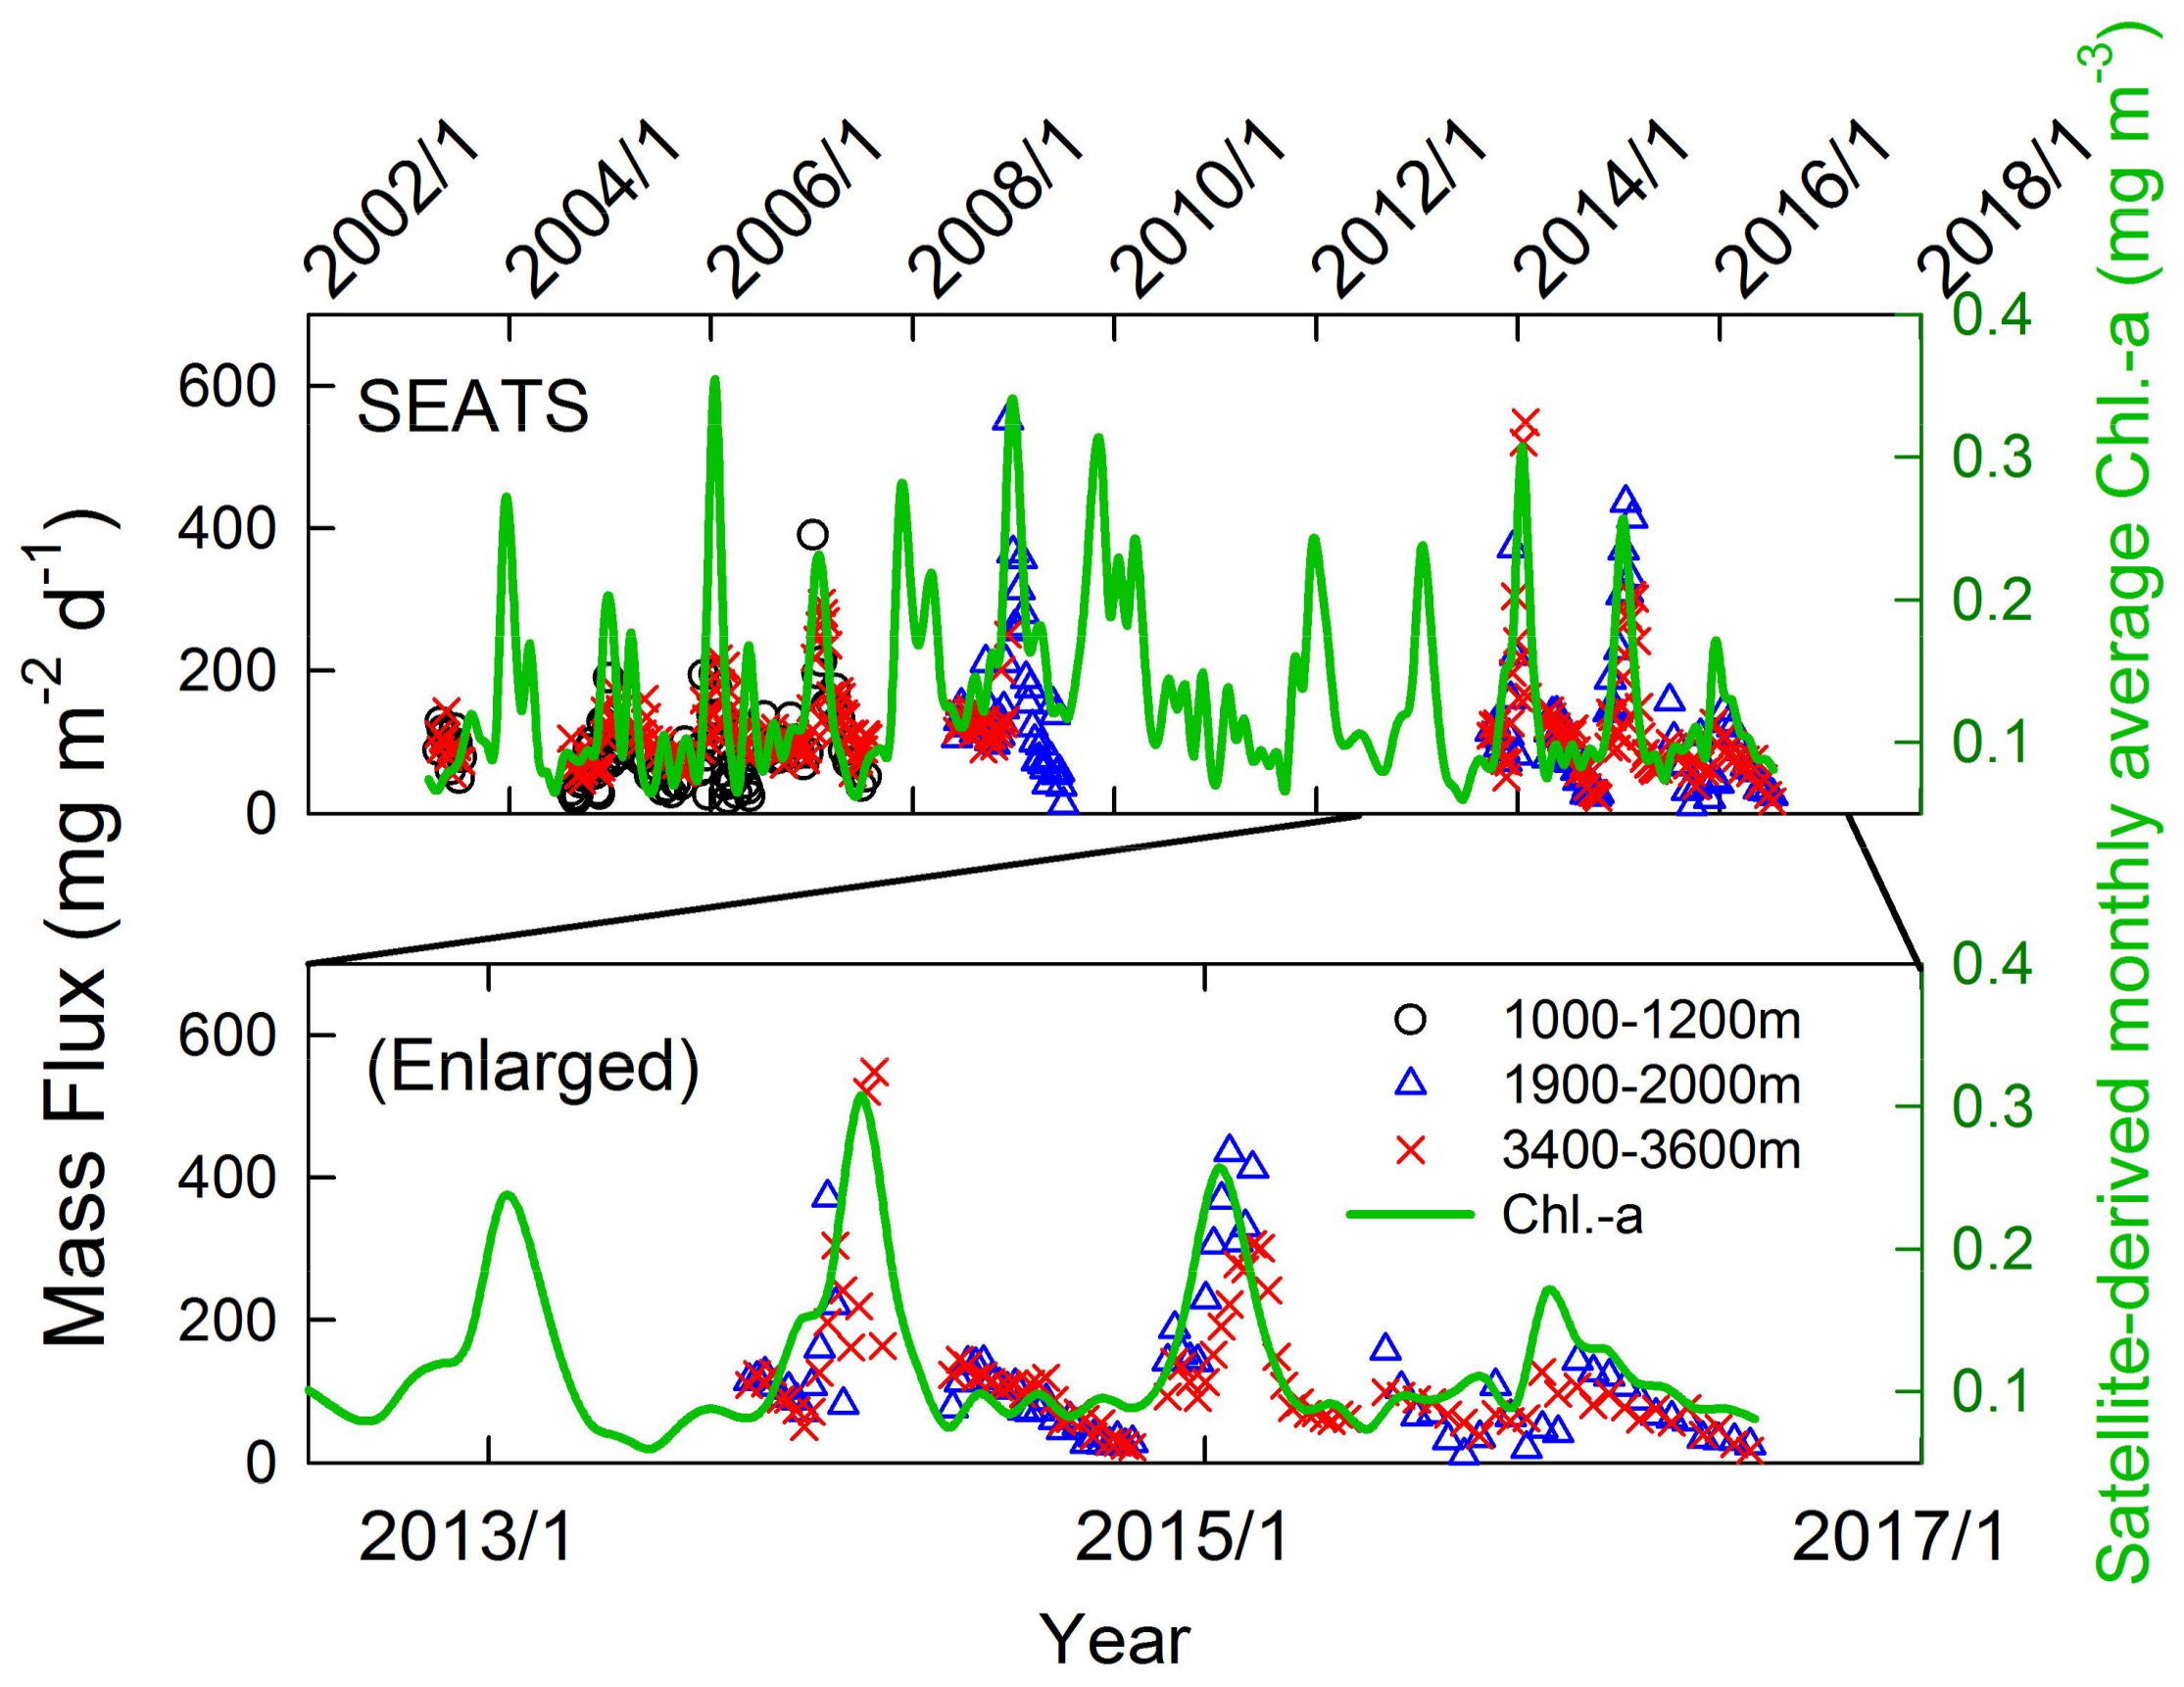
3.1. Consistences in Seasonal and Interannual Variations between Mass Flux and chlorophyll-a

Measurement results show that the mass fluxes at various depths at SEATS exhibit strong seasonal and inter-annual variations (Figure 3). The flux was generally high in winter but low in summer. The mass fluxes in winter (December–February) and summer (June–August) were 128 ± 73 (n = 27) and 63 ± 32 (n = 22) mg m−2 d−1 for 1000 m, 197 ± 153 (n = 38), and 87 ± 40 (n = 33) mg m−2 d−1 for 2000 m, and 179 ± 99 (n = 61) and 93 ± 26 (n = 63) mg m−2 d−1 for 3500 m. The values are generally in line with those from the Sea of Japan, but were higher than those from the Sargasso Sea and the Atlantic Ocean [8,9]. The flux is expected to fall with rising depth due to remineralization. Moreover, the temporal change of flux is slower at deeper ocean than at shallower depth. However, due to the insufficient resolution of the data, no significant difference was observed between the fluxes at various depths. Results from two-tailed t test with significance level 5% show that there are no significant differences between fluxes at 1000 m and 3500 m in summer (p = 0.008, n = 22) and winter (p = 0.164, n = 26), as well as at 2000 m and 3500 m in summer (p = 0.055, n = 29) and winter (p = 0.579, n = 30). This could be because the sinking particles were transported fairly quickly from the surface to the deep basin of the nSCS. The peak values in the winter gradually increased from the second lowest 169 mg m−2 d−1 in 2005/1 at 3500 m (no data for 2000 m depth) to the highest of 551 mg m−2 d−1 at 2000 m depth (no data for 3500 m depth) in 2008/12. The second highest peak value was 520 at 3500 m in 2014/1, and the peak value gradually fell to the lowest of 127 mg m−2 d−1 in 2015/12 at 3500 m depth and 143 mg m−2 d−1 in 2016/1 for 2000 m depth. In contrast, no observable seasonal change pattern was found for the currents at 2000 m and 3500 m (Figure 4), suggesting that lateral transport plays a minor role in the mass fluxes at various depths.
In the nSCS, high chlorophyll-a concentration generally refers to high productivity, as the integrated chlorophyll-a concentration is positively correlated with the integrated primary production in the euphotic layer [10,11,12]. As with the sinking particles, the chlorophyll-a concentration showed a peak value in winter, and a lower value in summer (Figure 5). The increase in nutrient inventories in the euphotic zone is widely recognized to be due to enhanced vertical mixing resulting from the strong winter monsoon and seawater cooling [10,11]. Notably, both seasonal and inter-annual variations of the satellite-derived monthly-smoothed chlorophyll-a concentration matched well with those of the mass fluxes at various depths at SEATS (Figure 5), implying that the particles that were collected at various depths mainly came from the euphotic layer at or near the SEATS station. As mentioned above, the fluxes of sinking particles showed no distinguishable difference at various depths. This finding matches those of previous studies that the winter blooms of phytoplankton are generally associated with fast-sinking particles with transparent exoploymer particles [13]. Additionally, the remineralization rate is generally lower in the winter than in the summer, causing the fast-sinking particles to export or sink efficiently in the winter [13].
Results from the TJ-A-1 mooring station (270 km off the northeast of SEATS) that was located in the continental slope of the nSCS indicate that sediments carried by mesoscale eddies may be an important source of sinking particles [14]. The changes in suspended particle concentration at 2069 m depth (31 m above the seafloor) at TJ-A-1 lagged those of the surface along-slope and cross-slope velocities by 29 and 21 days, respectively [14]. Assume suspended particle took 21–29 days to settle down from the surface to, 2069 m depth (71~96 m day−1). At the same speed, suspended particles should take about 20–28 and 35–49 days from the surface to reach 2000 m and 3500 m depths at SEATS. Namely, the transporting time from the depths of 2000 m to 3500 m is around 15–21 days. Our measurement results show that the mass fluxes between 2000 m and 3500 m depths were positively correlated (coefficient of determination, r2 = 0.41). The r2 was the highest at 0.64 when comparing the mass flux at 3500 m depth to the eight-day-lagged mass flux at 2000 m depth, revealing that the average time for sinking particles to transport from 2000 m to 3500 m depths at SEATS was around eight days, but less than 16 days. The sinking speed calculated herein is significantly faster than that of the TJ-A-1 station.

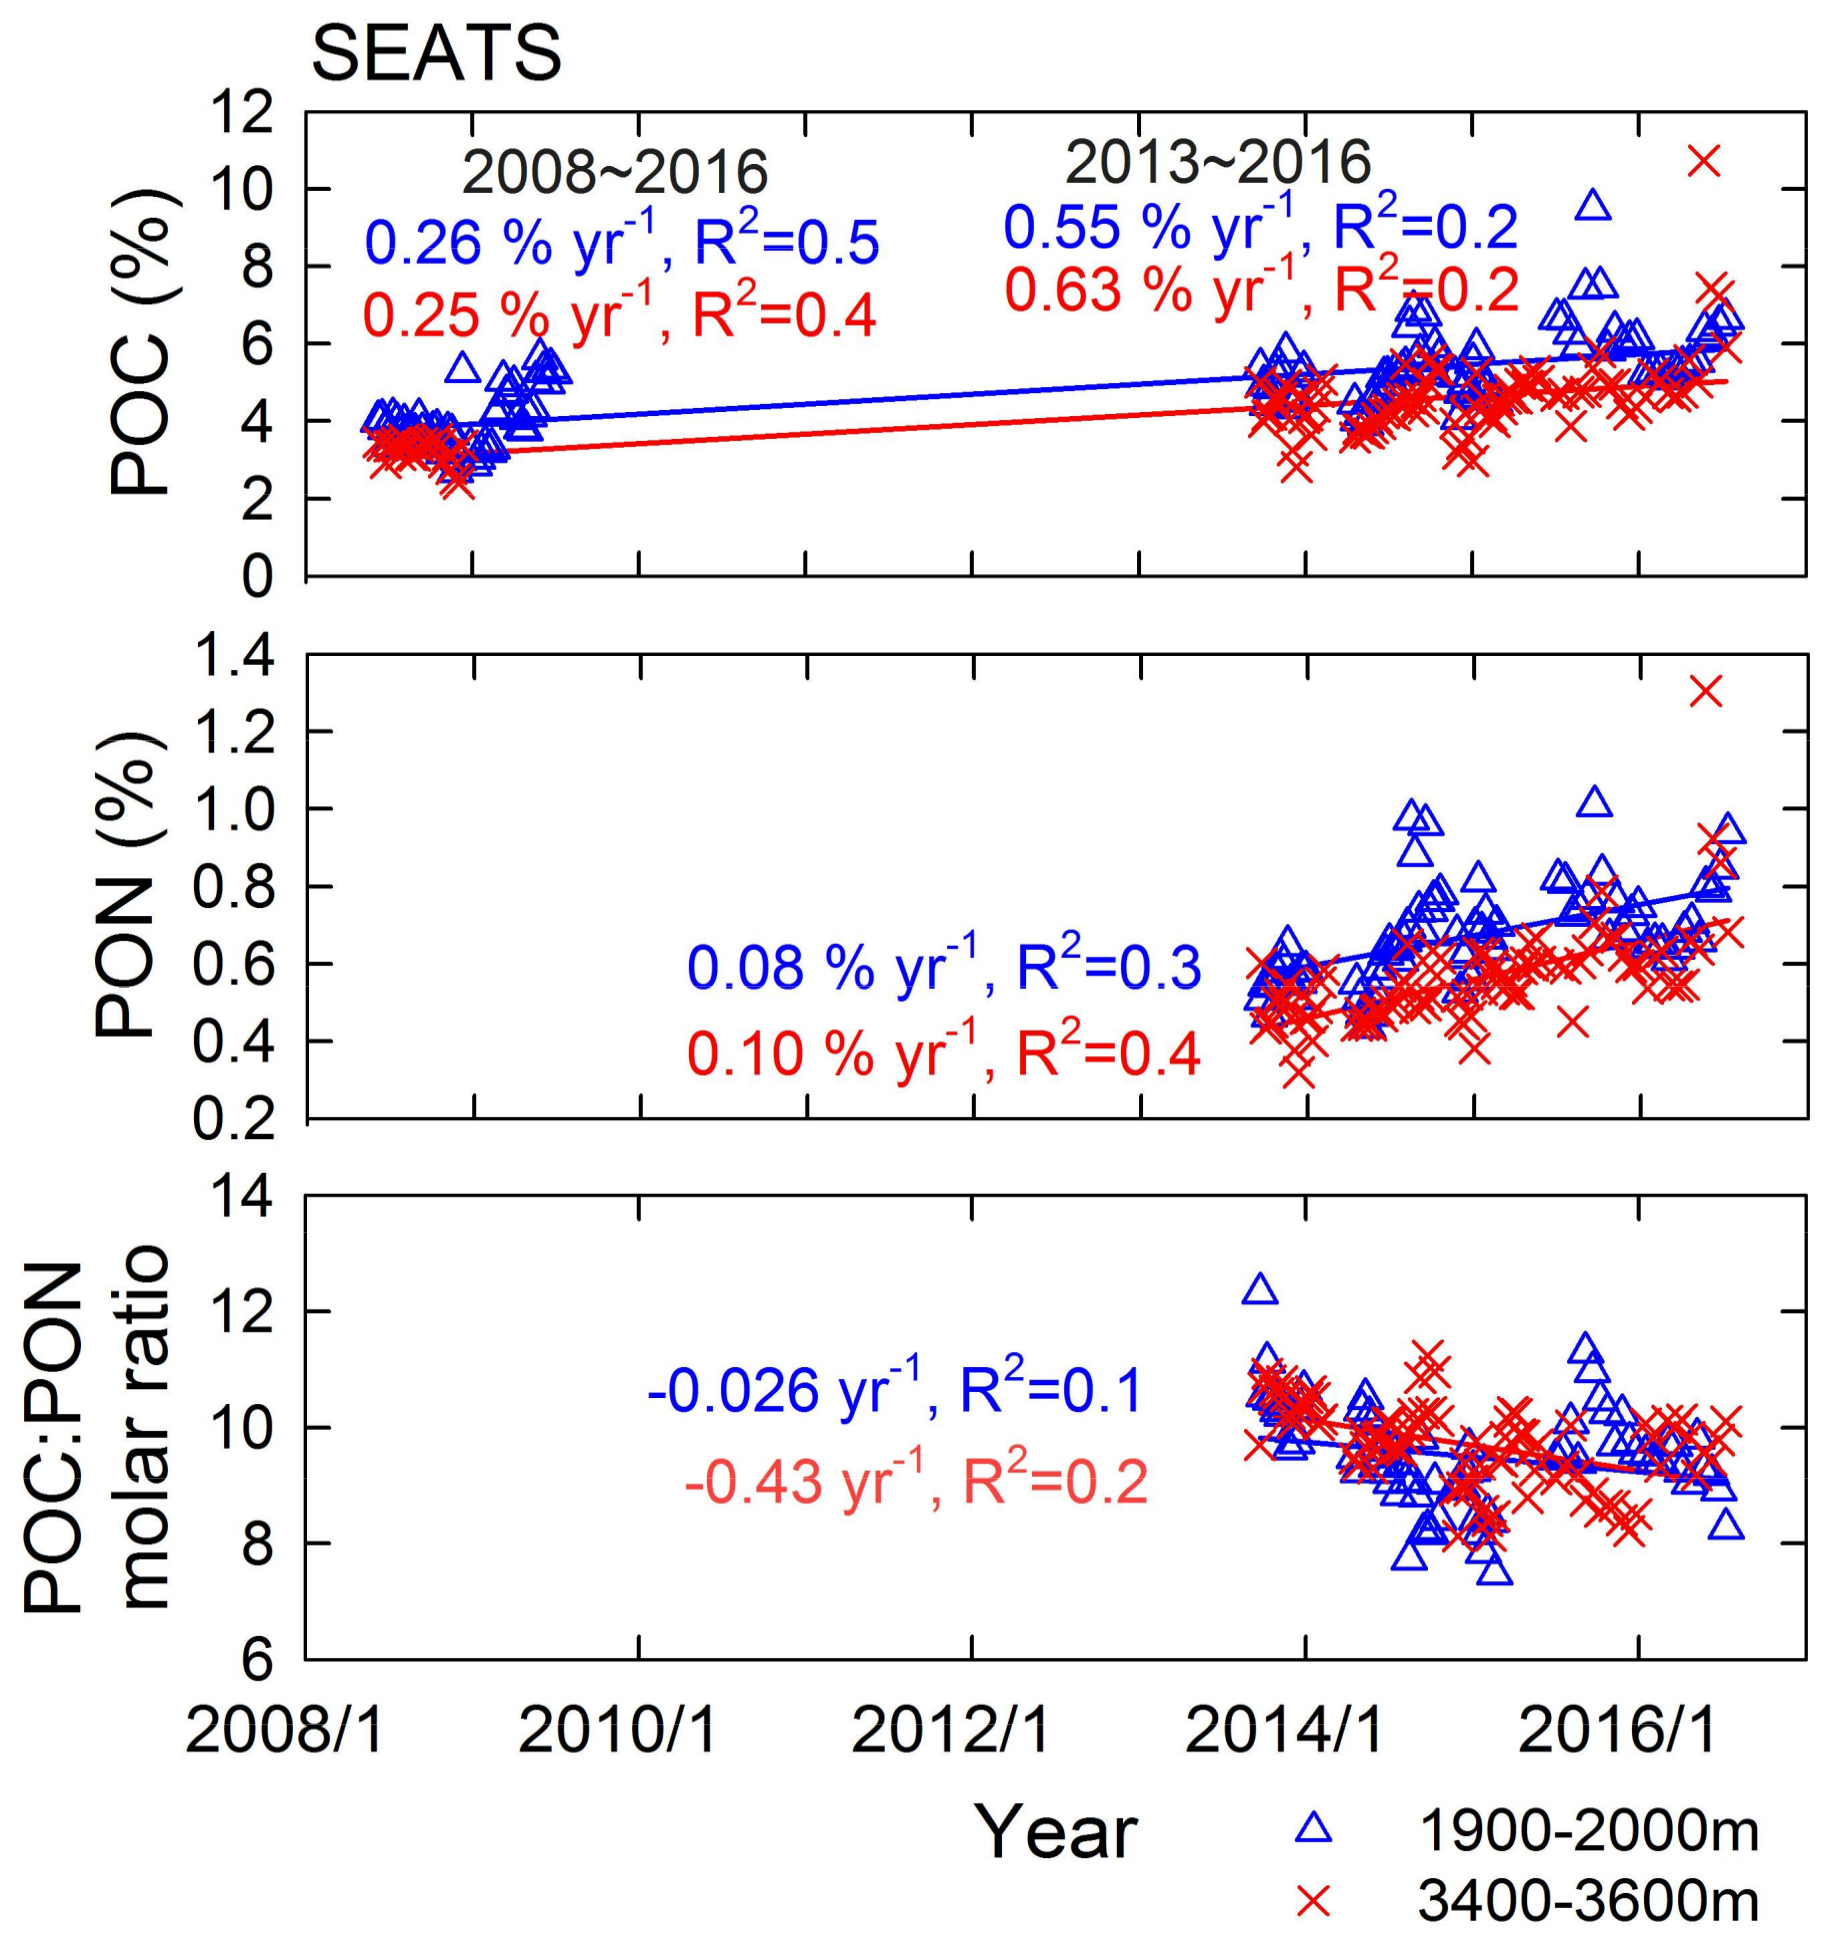
3.2. POC and PON Dynamics

Largely due to the degradation of the POC and PON, the contents of POC and PON of the sinking particles were slightly higher at 2000 m depth (averaging 5.4 ± 0.9% and 0.67 ± 0.12%, respectively, in 2013–2016) than that at 3500 m (averaging 4.6 ± 1.0% and 0.56 ± 0.13%, respectively, in 2013–2016) (Figure 6). The POC:PON ratios were mostly higher than the Redfield ratio of 6.6. This could be because PON and particulate organic phosphorus (POP) have shorter remineralization length-scales than POC, thus causing the POC:PON ratio of the sinking particles to deviate from the Redfield ratio at increasing depth [15,16]. Since the percentage contents of POC and PON varied much less than those of the mass fluxes at 2000 m and 3500 m, as expected, the POC and PON fluxes, followed the mass fluxes (Figure 3). The contents of POC and PON have no strong seasonal variations, with only some relatively low values occurring in the early state or during the winter bloom of phytoplankton (Figure 6). Overall, the POC (%) and PON (%) at 2000 m and 3500 m showed slightly rising temporal trends, while the POC:PON molar ratio showed a decreasing trend with time. Whether the temporal trends of changes for POC, PON, and the POC:PON molar ratio reflect the long-term trend of increasing chlorophyll-a concentration [17], an increasing sinking rate (better preservation) or a lower remineralization rate (better preservation) needs further investigation.
Using the power function of POC that was proposed by Martin, et al. [18], the percentages of POC is expected to be 6.2–8.5% at 2000 m depth and 3.3–4.8% at 3500 m depth when using an attenuation coefficient of 1.0–1.1, as suggested by Wei et al. [9]. Our result is in line with previous studies. The low POC and PON contents suggest that vertical migration of deep sea biota did not contribute significantly to the mass fluxes of sinking particles at 2000 m and 3500 m at the SEATS site. With 8–16 days of transportation time, the remineralization rates of POC and PON between 2000 m and 3500 m are estimated as 0.05–0.10% day−1 and 0.007–0.014% day−1, respectively.
Previous studies have indicated that the lateral transport or resuspension contributes some sinking particles onto the continental slopes of the nSCS [14,19,20,21]. Using the TJ-A-1 moored system, Zhang et al. [14] indicated that the southwestward propagation of two mesoscale eddies from the western Luzon Strait carried a considerable amount of suspended particles for the whole water column during January to March 2012 and November 2012 to January 2013, respectively, suggesting that the transportation of sinking particles from southwest of Taiwan. Such a result is consistent with that of Liu et al. [20] that particles collected at a site 160 km off the southern Hainan Island in the NW South China Sea were transported mainly from southwest of Taiwan, and partly from the Pearl River. Additionally, the increased suspended particle concentrations that were shown by Zhang et al. [14] occurred close to the time of winter blooms.
Interestingly, the lateral transport probably did not contribute significantly to the mass fluxes of sinking particles at the SEATS site. Using the sinking fluxes of 210Pb and 210Po, Wei et al. [9] showed that lateral transport plays an insignificant role of deep water sediment dynamics at SEATS. The tight correlations between the fluxes of POC and PIC shown by Wei et al. [9], as well as the mass flux and satellite-derived chlorophyll-a concentration found in this study, indicate that local biogenic sources contributed most of the sinking particle fluxes at various depths at SEATS. This assumption is also supported by the planktonic foraminifera collected by another study at 619 m and 3451 m at the SEATS station. The trapped foraminifera had similar oxygen isotopes were consistent with that towed from the euphotic layer, and the time-series results in both of the samples agreed well with the growth temperature [22]. The current at 2000 m and 3500 m did not show any regular seasonal pattern of change, supporting that the influence of lateral transport in the flux of suspended particles is minimal at SEATS.

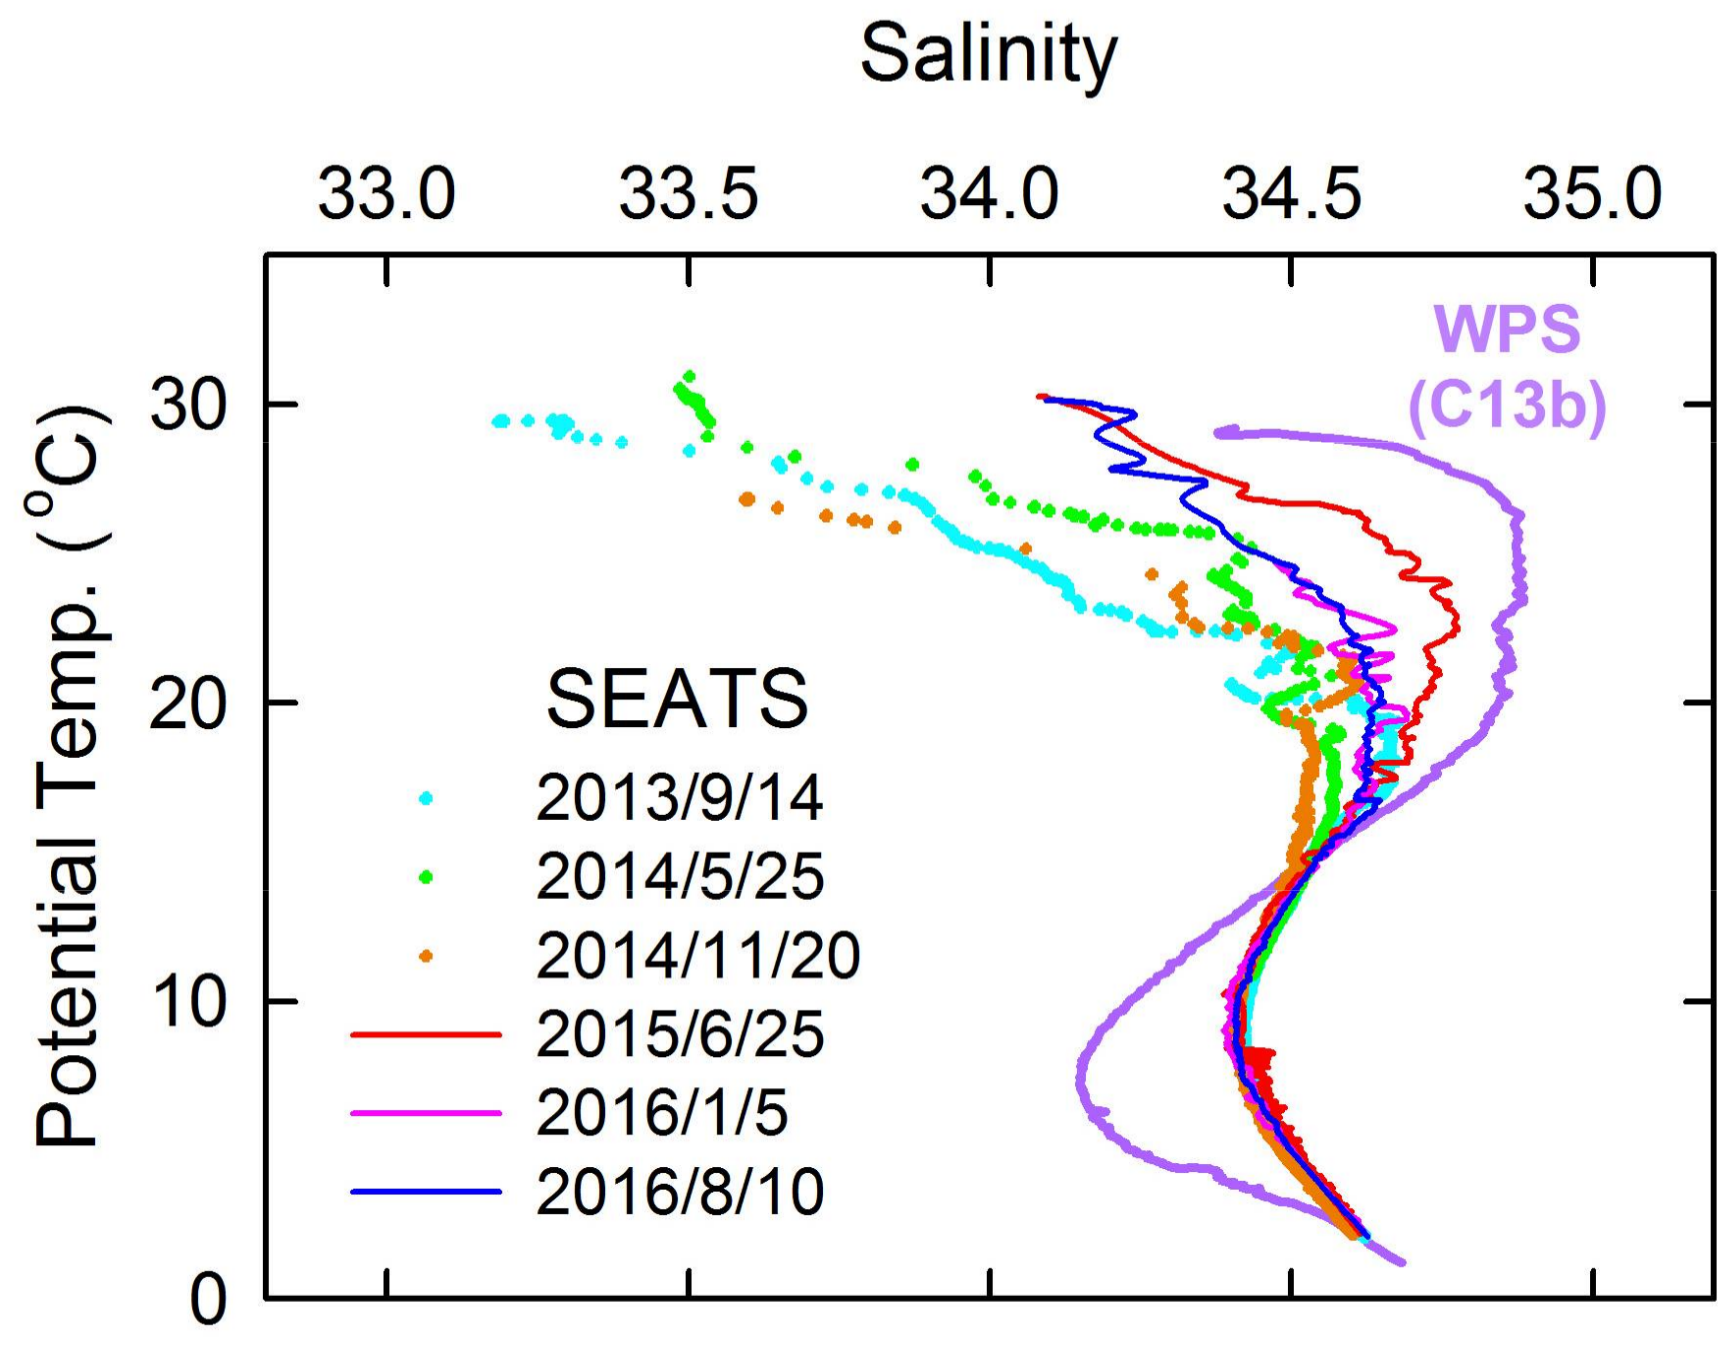
3.3. Intrusion of WPS Seawater Reduces Export Production and Mass Flux

The winter bloom is widely recognized to be triggered by the increased nutrient inventory under the influence of the strong northeast monsoon [11,23,24,25]. However, the northeast monsoon alone does not fully elucidate the strong inter-annual variations. For instance, the winter wind speed in El Niño years was 11–20% lower than the climatological mean between 1997 and 2003 [23]. Conversely, the peak value of the mass fluxes in December 2008 was almost three times that in January 2016 (Figure 3). These results suggest that other factors also control the mass flux. The temperature in the mixed layer at SEATS could be as high as 31 °C in summer and as low as 24 °C in winter. Tseng [10] noted that either cooling of seawater or strengthening of wind in winter increases the mixed layer depth, thus also increasing the nutrient inventories in the nSCS. Nutrient inventories, and hence chlorophyll-a concentration thus reach the highest level when the lowest sea surface temperature coincides with the highest wind speed in winter [10]. For instance, at SEATS, the mixed layer depth was about 80 m in winter and 15 m in summer in 2013, and the values were about 0.3 μM and 0 μM for average nitrate + nitrite in the mixed layer, and 300 mg m−2 d−1 and 100 mg m−2 d−1 for the integrated primary production [10].
Wei et al. [9] pointed out the importance of horizontal transport of 210Pb from the WPS into the South China Sea when estimating the 210Pb budgets in nSCS. This is because the 210Pb concentration in the WPS is much higher than that in the nSCS. Consequently, any intrusion of the WPS seawater into the nSCS would increase the 210Pb levels in the nSCS. Likewise, the intrusion of the WPS seawater into the nSCS also decreases the nutrient inventories of the euphotic layer, thus reducing the export production in the nSCS. Indeed, the decreasing trend in the mass fluxes that was observed between 2014 and 2016 accompanied a gradual increase in the WPS seawater portion for seawater at the SEATS site (Figure 7). This is because the nutrient concentrations in the mixed layer in the WPS are significantly lower than that in the nSCS [26]. Therefore, the large intrusion of the WPS seawater between 2014 and 2016 at the SEATS site reduces the nutrient inventories in the euphotic layer and hence the export production below the euphotic layer and the mass fluxes at various depths at SEATS.
It is widely recognized that the upper waters of the Kuroshio is most likely to intrude into the SCS during the El Niño years [27,28,29,30]. The year 2004 was a very strong El Niño year, and 2016 was the strongest El Niño year after 1997–1998. Consequently, the peak values of mass fluxes in 2004–2005 and 2015–2016 were the second lowest and lowest among the studied years, respectively. These results indicate that the primary production and the export production in the nSCS are sensitive to the changing hydrology, implying that changes in hydrology under a changing climate can significantly change the biogeochemical cycles in the nSCS. For instance, a fall in the amount of WPS seawater intrusion or the enhanced upwelling is expected to increase the primary production and export production in the nSCS, and vice versa.

4. Conclusions

This study analyzed decadal time-series mass, POC and PON data at the SEATS site, and found strong interannual variability for mass, POC and PON fluxes. The satellite-derived chlorophyll-a data and the measured current at 2000 m and 3500 m suggest that the flux of sinking particles were largely controlled by the export production at or near the SEATS station. The remineralization rates of POC and PON between 2000 m and 3500 m are estimated as 0.05–0.10% day−1 and 0.007–0.014% day−1, respectively. Previous studies have found that the strengthening of the winter monsoon and the mixed layer depth are the two main factors that are governing the nutrient inventories in the euphotic layers, and hence the export production of the nSCS. This study suggests that the intrusion of WPS seawater into the nSCS may also play a critical role in controlling the productivity and biogeochemical cycles in the nSCS.

Acknowledgments

The members of mooring system deploying groups of NCOR and TORI are acknowledged for deploying the mooring system. We acknowledge the captain and crew of the R/V Ocean Researchers I, III and V for assistance. C.-T.A. Chen acknowledges the Ministry of Science and Technology of Taiwan (MOST105-2611-M-110-017, MOST105-2119-M-110-004, MOST104-2611-M-110-016, and MOST104-2611-M-110-015) for financially supporting this research. Y.W. Chiu at National Cheng Kung University is acknowledged for assisting the classification of shells in trap samples. Three anonymous reviewers provided valuable comments that strengthened the manuscript.

Author Contributions

C.-J.T. analyzed the mass flux, POC and PON data between 2013 and 2016. J.-W.C. provided the satellite-derived chlorophyll-a data. H.-L.L. and S.-H.H. provided expertise on the dynamics of sinking particles. Y.Y. processed and analyzed the current data. H.-K.L. led the writing. C.-T.A.C., K.-Y.C. and B.-S.W. participated in drafting the manuscript. All authors read and commented on the final version of the~manuscript.

Conflicts of Interest

The authors declare no conflict of interest.

References

  1. Le Quere, C.; Takahashi, T.; Buitenhuis, E.T.; Rodenbeck, C.; Sutherland, S.C. Impact of climate change and variability on the global oceanic sink of CO2. Glob. Biogeochem. Cycles 2010, 24. [Google Scholar] [CrossRef]
  2. Sabine, C.L.; Feely, R.A.; Gruber, N.; Key, R.M.; Lee, K.; Bullister, J.L.; Wanninkhof, R.; Wong, C.S.; Wallace, D.W.R.; Tilbrook, B.; et al. The oceanic sink for anthropogenic CO2. Science 2004, 305, 367–371. [Google Scholar] [CrossRef] [PubMed] [Green Version]
  3. Takahashi, T.; Sutherland, S.C.; Wanninkhof, R.; Sweeney, C.; Feely, R.A.; Chipman, D.W.; Hales, B.; Friederich, G.; Chavez, F.; Sabine, C.; et al. Climatological mean and decadal change in surface ocean pCO2, and net sea–air CO2 flux over the global oceans. Deep-Sea Res. Part II 2009, 56, 554–577. [Google Scholar] [CrossRef] [Green Version]
  4. Sarmiento, J.L.; Gruber, N. Sinks for Anthropogenic Carbon. Phys. Today 2002, 55, 30–36. [Google Scholar] [CrossRef]
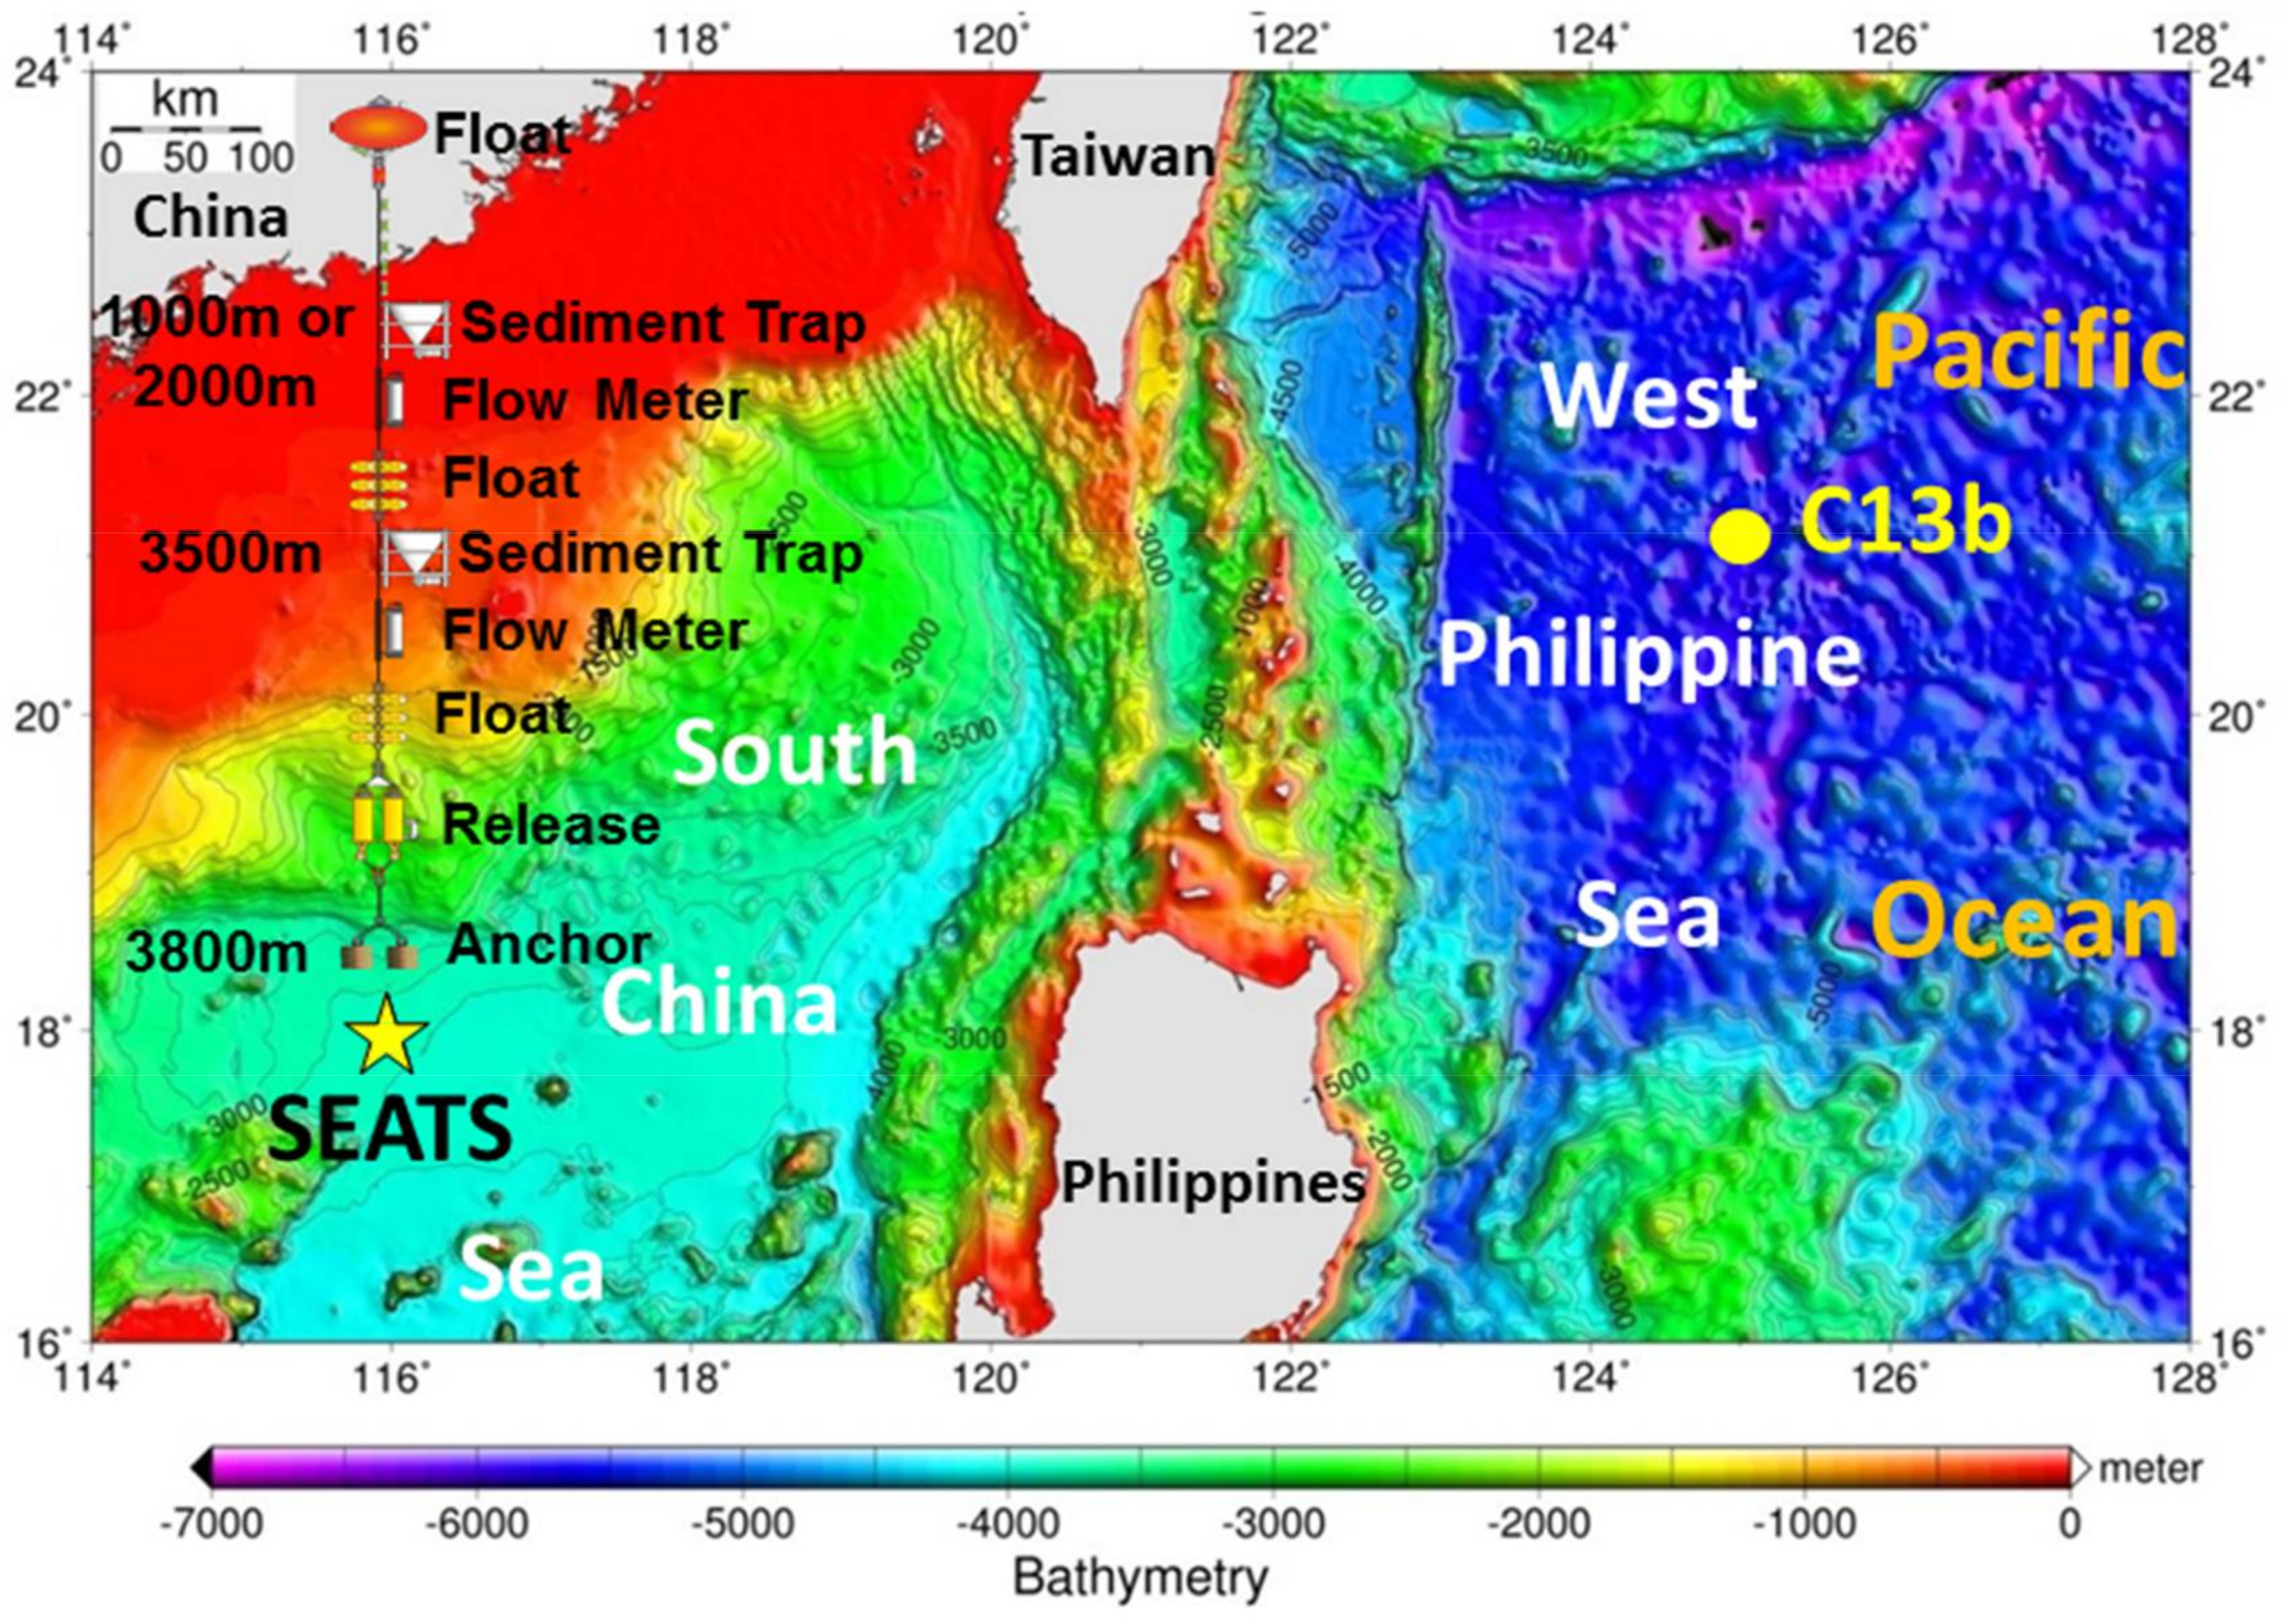
  5. Wong, G.T.F.; Ku, T.L.; Mulholland, M.; Tseng, C.M.; Wang, D.P. The SouthEast Asian Time-series Study (SEATS) and the biogeochemistry of the South China Sea—An overview. Deep-Sea Res. Part II 2007, 54, 1434–1447. [Google Scholar] [CrossRef]
  6. O’Reilly, J.E.; Maritorena, S.; Mitchell, B.G.; Siegel, D.A.; Carder, K.L.; Garver, S.A.; Kahru, M.; McClain, C. Ocean color chlorophyll algorithms for SeaWiFS. J. Geophys. Res. 1998, 103, 24937–24953. [Google Scholar] [CrossRef]
  7. Hu, C.; Lee, Z.; Franz, B. Chlorophyllaalgorithms for oligotrophic oceans: A novel approach based on three-band reflectance difference. J. Geophys. Res. 2012, 117. [Google Scholar] [CrossRef]
  8. Abell, R.E.; Brand, T.; Dale, A.C.; Tilstone, G.H.; Beveridge, C. Variability of particulate flux over the Mid-Atlantic Ridge. Deep-Sea Res. Part II 2013, 98, 257–268. [Google Scholar] [CrossRef]
  9. Wei, C.L.; Chia, C.Y.; Chou, W.C.; Lee, W.H. Sinking fluxes of 210Pb and 210Po in the deep basin of the northern South China Sea. J. Environ. Radioact. 2017, 174, 45–53. [Google Scholar] [CrossRef] [PubMed]
  10. Tseng, C.M. A unique seasonal pattern in phytoplankton biomass in low-latitude waters in the South China Sea. Geophys. Res. Lett. 2005, 32. [Google Scholar] [CrossRef]
  11. Liu, K.K.; Wang, L.W.; Dai, M.; Tseng, C.M.; Yang, Y.; Sui, C.H.; Oey, L.; Tseng, K.Y.; Huang, S.M. Inter-annual variation of chlorophyll in the northern South China Sea observed at the SEATS Station and its asymmetric responses to climate oscillation. Biogeosciences 2013, 10, 7449–7462. [Google Scholar] [CrossRef]
  12. Cai, P.; Zhao, D.; Wang, L.; Huang, B.; Dai, M. Role of particle stock and phytoplankton community structure in regulating particulate organic carbon export in a large marginal sea. J. Geophys. Res. 2015, 120, 2063–2095. [Google Scholar] [CrossRef]
  13. Martin, P.; Lampitt, R.S.; Jane Perry, M.; Sanders, R.; Lee, C.; D'Asaro, E. Export and mesopelagic particle flux during a North Atlantic spring diatom bloom. Deep-Sea Res. Part. I 2011, 58, 338–349. [Google Scholar] [CrossRef]
  14. Zhang, Y.; Liu, Z.; Zhao, Y.; Wang, W.; Li, J.; Xu, J. Mesoscale eddies transport deep-sea sediments. Sci. Rep. 2014, 4, 5937. [Google Scholar] [CrossRef] [PubMed]
  15. Schneider, B.; Schlitzer, R.; Fischer, G.; Nöthig, E.-M. Depth-dependent elemental compositions of particulate organic matter (POM) in the ocean. Glob. Biogeochem. Cycles 2003, 17. [Google Scholar] [CrossRef]
  16. Martiny, A.C.; Vrugt, J.A.; Lomas, M.W. Concentrations and ratios of particulate organic carbon, nitrogen, and phosphorus in the global ocean. Sci. Data 2014, 1, 140048. [Google Scholar] [CrossRef] [PubMed]
  17. Bai, Y.; He, X.; Yu, S.; Chen, C.T.A. Changes in the Ecological Environment of the Marginal Seas along the Eurasian Continent from 2003 to 2014. Sustainability 2018, 10. [Google Scholar] [CrossRef]
  18. Martin, J.H.; Knauer, G.A.; Karl, D.M.; Broenkow, W.W. VERTEX: Carbon cycling in the northeast Pacific. Deep-Sea Res. Part A 1987, 34, 267–285. [Google Scholar] [CrossRef]
  19. Yang, J.-Y.T.; Kao, S.-J.; Dai, M.; Yan, X.; Lin, H.-L. Examining N cycling in the northern South China Sea from N isotopic signals in nitrate and particulate phases. J. Geophys. Res. 2017, 122, 2118–2136. [Google Scholar] [CrossRef]
  20. Liu, J.; Clift, P.D.; Yan, W.; Chen, Z.; Chen, H.; Xiang, R.; Wang, D. Modern transport and deposition of settling particles in the northern South China Sea: Sediment trap evidence adjacent to Xisha Trough. Deep-Sea Res. Part I 2014, 93, 145–155. [Google Scholar] [CrossRef]
  21. Ho, T.Y.; Chou, W.C.; Lin, H.L.; Sheu, D.D. Trace metal cycling in the deep water of the South China Sea: The composition, sources, and fluxes of sinking particles. Limnol. Oceanogr. 2011, 56, 1225–1243. [Google Scholar] [CrossRef]
  22. Lin, H.L.; Sheu, D.D.D.; Yang, Y.; Chou, W.C.; Hung, G.W. Stable isotopes in modern planktonic foraminifera: Sediment trap and plankton tow results from the South China Sea. Mar. Micropaleontol. 2011, 79, 15–23. [Google Scholar] [CrossRef]
  23. Tseng, C.M.; Gong, G.C.; Wang, L.W.; Liu, K.K.; Yang, Y. Anomalous biogeochemical conditions in the northern South China Sea during the El-Niño events between 1997 and 2003. Geophys. Res. Lett. 2009, 36. [Google Scholar] [CrossRef]
  24. Tseng, C.M.; Wong, G.T.F.; Chou, W.C.; Lee, B.S.; Sheu, D.D.; Liu, K.K. Temporal variations in the carbonate system in the upper layer at the SEATS station. Deep-Sea Res. Part II 2007, 54, 1448–1468. [Google Scholar] [CrossRef]
  25. Tseng, C.M.; Liu, K.K.; Wang, L.W.; Gong, G.C. Anomalous hydrographic and biological conditions in the northern South China Sea during the 1997–1998 El Niño and comparisons with the equatorial Pacific. Deep-Sea Res. Part I 2009, 56, 2129–2143. [Google Scholar] [CrossRef]
  26. Chen, C.T.A.; Wang, S.L.; Wang, B.J.; Pai, S.C. Nutrient budgets for the South China Sea basin. Mar. Chem. 2001, 75, 281–300. [Google Scholar] [CrossRef]
  27. Wu, C.R.; Hsin, Y.C. The forcing mechanism leading to the Kuroshio intrusion into the South China Sea. J. Geophys. Res. 2012, 117. [Google Scholar] [CrossRef]
  28. Wu, C.R.; Wang, Y.L.; Lin, Y.F.; Chiang, T.L.; Wu, C.C. Weakening of the Kuroshio Intrusion Into the South China Sea under the Global Warming Hiatus. IEEE J. Sel. Top. Appl. Earth Obs. Remote Sens. 2016, 9, 5064–5070. [Google Scholar] [CrossRef]
  29. Huang, T.H.; Chen, C.T.A.; Zhang, W.Z.; Zhuang, X.F. Varying intensity of Kuroshio intrusion into Southeast Taiwan Strait during ENSO events. Cont. Shelf Res. 2015, 103, 79–87. [Google Scholar] [CrossRef]
  30. Chen, C.T.A.; Yeh, Y.T.; Chen, Y.C.; Huang, T.H. Seasonal and ENSO-related interannual variability of subsurface fronts separating West Philippine Sea waters from South China Sea waters near the Luzon Strait. Deep-Sea Res. Part I 2015, 103, 13–23. [Google Scholar] [CrossRef]
Figure 1. Bathymetry of the study area with station locations of South East Asia Time Series Study (SEATS) and C13b, and a schematic diagram of the mooring system.
Sustainability 10 00971 g001
Figure 2. Particles on the 1 mm × 1 mm pore size sieve (top) and on the 47 mm MFTM filter paper (bottom). The letters show shells of (A) Clio pyramidata; (B) Hyalocylis striata; and (C) Limacina spp.
Sustainability 10 00971 g002
Figure 3. Mass, particulate organic carbon (POC), and particulate organic nitrogen (PON) fluxes at SEATS between 2003 and 2016 at various depths.
Sustainability 10 00971 g003
Figure 4. Two-day smoothed velocity at depths of 2000 m and 3500 m at SEATS.
Sustainability 10 00971 g004
Figure 5. Mass fluxes at various depths, and monthly average chlorophyll-a concentration, at SEATS between 2003 and 2016.
Sustainability 10 00971 g005
Figure 6. Percentages of POC and PON, and the POC:PON molar ratio at various depths, at SEATS between 2008 and 2016. The POC data between 2008/6/10 and 2009/6/30 were taken from Wei et al. [9]. Solid lines and numbers denote regression lines, slopes, and coefficient of determination, respectively. All of the regression lines have p < 0.0001, apart from that of POC:PON ratio at 2000 m with 0.04.
Sustainability 10 00971 g006
Figure 7. Salinity vs. potential temperature plot at SEATS between 2013 and 2016 and in 2014 at C13b (purple line, representing the typical WPS water mass).
Sustainability 10 00971 g007

