Can Legislation Promote a Circular Economy? A Material Flow-Based Evaluation of the Circular Degree of the Chinese Economy

1
School of Law, Shanghai University of Finance and Economics, 777 Guoding Road, Shanghai 200433, China
2
School of Public Economics and Administration, Shanghai University of Finance and Economics, 777 Guoding Road, Shanghai 200433, China
3
School of Law, University of Strathclyde, Lord Hope Building, 141 St James Road, Glasgow G4 0RQ, Scotland, UK
*
Author to whom correspondence should be addressed.
Sustainability 2018, 10(4), 990; https://doi.org/10.3390/su10040990
Submission received: 31 January 2018
/
Revised: 19 March 2018
/
Accepted: 21 March 2018
/
Published: 27 March 2018
Abstract
:The circular economy has been widely developed in China and other countries. However, China has been the most proactive country in upgrading its economic model by enacting a Circular Economy Promotion Law (CEPL). Nearly 10 years have passed since the adoption of the CEPL, and it is thus essential to evaluate the progress of circular economy development to see if the targets have been achieved. Although it is extremely difficult to evaluate the role of the CEPL in the development of a circular economy in China, we think that if we can estimate the circular degree of the Chinese economy and identify the changes of some key indicators before and after the adoption of the CEPL, it will be helpful in judging whether the CEPL has played a key role in promoting the transition of the economic development model. Since the existing circular economy indicators and evaluation systems have focused mainly on the recycling of resources, we designed a methodology based on the material flow that can be used to evaluate the circular degree of the whole national economy. Through a detailed observation of the circular economy indicators of China, we conclude that the CEPL has not yet played a significant role in promoting the circular economy as was previously believed.
1. Introduction
The circular economy is a new economic development model which came to the fore after the emergence of the concept of sustainable development in 1992 at the United Nations Conference on Environment and Development [1,2]. The purpose of the circular economy is to increase resource-utilization efficiency and environmental efficiency, and to reduce the dependence of economic development on natural resources. China’s economy has grown rapidly in the last 30 years, but the economic miracle has been achieved at the expense of its natural capital and environment [3].
Therefore, after the concept of a circular economy was first proposed by scholars in China in 1998 [4], the national government formally accepted this idea in 2002 as a new development strategy which aimed to alleviate the contradiction between rapid economic growth and the shortage of raw materials and energy [5,6,7] by providing guidelines for developing a circular economy, particularly for the planning and operation of eco-industrial parks, through the State Environmental Protection Administration (SEPA) [8]. In 2004, the National Development and Reform Commission (NDRC), instead of SEPA, was appointed by the Chinese State Council to take over the duty to promote and implement the circular economy in the country, which meant the Chinese government actually took the circular economy to be an integrated state strategy rather than simply an environmental policy [6,9].
In this context, the “Circular Economy Promotion Law of the People’s Republic of China” was enacted in 2008 and came into effect in January 2009 [10]. It is “the world’s first national law proclaiming an economy model” different from the mainstream model, namely, the linear model involving “raw materials in” at one end and “waste out” at the other, and takes the circular economy to be China’s central development goal [11] (p. 436). Since the approval of this law, there have been many studies focusing on the development of the circular economy in China [11,12,13], and in the global context [14,15]. Major research efforts have been made towards the nationwide implementation of the circular economy in China, especially towards the implementation of a circular economy at corporate, inter-firm and social levels [16].
Existing studies have made great contributions to the understanding of how to promote the circular economy in China. However, since the circular economy has been promoted in China for many years, and the Circular Economy Promotion Law (CEPL) has been in force for nearly 10 years, we also need to reflect in-depth and evaluate what progress, if any, has been made. The most important issue which needs consideration is the impact of the CEPL, which was issued with great expectations of promoting the transition of the development model of the Chinese economy, and whether or not the CEPL has contributed to the circularization of Chinese economy significantly. As early as 2015, the Environmental Protection and Resource Conservation Committee of the National People’s Congress stated that the economy, resources and environmental situations had changed significantly in China and, in order to adapt to the changes, the CEPL required amendment. The legislative procedure to amend the CEPL has been initiated [17]. In November 2016, the CEPL Amendment Forum was held in Beijing, China. In the forum, the impact of the CEPL, and the guidelines, key areas, as well as difficulties concerning its amendment were discussed [18]. There were some controversies around the legislative model and the functions of the law among scholars in the forum. Some of them believed that the circular economy in China is still in the period of theoretical advocacy. The CEPL could provide guidance for the transition to a different development model in China. Enterprises, industrial parks, as well as local regions are the basic elements and facilitators of circular-economy development. The CEPL should keep its original legislative model, to regulate and support the circular economy models in the most micro and comprehensive sense. Other scholars thought that the existing CEPL focused too much on the establishment of the circular economy model, and the legal structure and contents were designed mainly on principles instead of specific rules. This focus on principles had reduced the utility and impact of the CEPL, and meant that it could not realize the legislative targets [19]. It should be noted that the controversies between the two sides were established on the basis of their subjective feelings and positions. No clear evidence for their opinions was offered.
It must be admitted that evaluation of the impact of legislation is extremely difficult. In this study, we put forward a fundamental hypothesis, that is: if the CEPL is helpful for the development of a circular economy in China, after the adoption of this law in 2009 indicators of the circularization of the Chinese economy should show significant increases. That means, if we can estimate the circular degree of the Chinese economy, and if we can observe changes of major circular degree indicators before and after the key time points of the implementation of the CEPL, we will be able to postulate whether or not the CEPL has played an important role in promoting the transition to a different economic development model. Both the concrete evaluation of the circular degree of the Chinese economy and the legislative reform of the CEPL have rarely been communicated to international communities. The knowledge gained from this discussion should be valuable to nations seeking to realize sustainable development within their regulatory systems.
2. Methods and Data
2.1. Indicators Characterizing the Circular Degree of the National Economy
The circular degree of the economy could be used to measure the result of the promotion of the circular economy in an economy. It could be measured from different perspectives. For example, from the perspective of development objectives, we could measure the natural resource utilization efficiency and environmental efficiency of economic development. From the perspective of the circular economy development features, we could measure the length and diversity of industrial chains for major sectors and industrial parks. From the perspective of performance, we could measure the results of waste reduction, reuse and recycling within an economy.
Natural resource utilization efficiency (also known as the primary resource productivity (PRP), which refers to the average contribution of the use of natural resources per unit to the national economy and is usually expressed as the ratio of GDP in constant prices to the amount of primary resources consumed), represents the economic, social and environmental consequences generated by using units of natural resources. Usually, we use GDP to divide the consumption amount of major resources. This can be subdivided into individual indicators such as energy productivity, water resource productivity, construction land productivity, etc. [20]. Environmental efficiency can be defined as the product quantity (or output value or quantity of service) provided through unit environmental load. It can be calculated using GDP to divide the discharge amount of major pollutants. It can be subdivided into air environmental efficiency, water environmental efficiency, etc.
Resources can be divided into primary and secondary resources. The former are the natural resources in their original states, while the latter is the recycled waste that could be reused, including industrial waste (solid waste, wastewater, etc.), and waste materials generated in production and social processes.
Actually, China has already released nationally focused circular economy evaluation indexes. The Evaluation Index System of Circular Economy Development which was formulated by the National Development and Reform Commission (NDRC) was firstly published in 2007 (EIS 2007) [3,21], and then updated in 2017 (EIS 2017) [22]. The indicators of these two versions of circular economy evaluation indexes are listed in Table 1 as follows:
We only listed the indicators at macro level of the EIS 2007 in Table 1, since the indicators for evaluating industrial parks at the micro level are not fit for an assessment from a national perspective. It should be noted that the indicators of the EIS 2007 and that of the EIS 2017 do not act in the same way. The four indicators of the EIS 2007 should be used together to make an evaluation, while in the EIS 2017 the first “comprehensive indicator” plays the main role. According to the interpretation of the EIS 2017, the first five sub-indicators of the second “single indicator” are used to calculate the major secondary resource recycling rate (SRRR), one of the two sub-indicators of the comprehensive indicator. The calculation methods of the other sub-indicators of the second “single indicator” are introduced but there is no detailed explanation about the use of these indicators. Primary resource productivity (PRP), the other sub-indicator of the comprehensive indicator, is defined as the ratio of GDP to the actual consumption of major resources. Furthermore, the third “reference indicator” is the waste disposal index containing environmental concerns at the end of a lifecycle, but plays no role in the evaluation and is just listed there for reference [22].
It is believed that the EIS 2007 did not conform to the actual situation of China, and there were difficulties in finding data [3]. Some scholars also think the existing circular economy indicators and evaluation system could not provide a feasible method for evaluating the circular performance of the national economy [23,24]. The formulation instructions of the EIS 2017 stated that the problems of the original 2007 system have been largely solved through the selection of mature indicators under existing statistical calibers and the specification of measurement methods [22]. In this study, we accept the two core sub-indicators in the EIS 2017, the PRP and the major SRRR, as the basic indicators.
Based on the reduction, reuse and recycling activities, both the forefront of raw material exploitation and the final waste discharge phase are integral parts of the circular economy. Many scholars believe indicators reflecting mineral resources productivity and waste disposal and pollutant-emission efficiency are essential for an evaluation of the circular degree of the Chinese economy [9,12,25]. Therefore, we also incorporate indicators concerning the mining stage and pollutant-emission rate, which is actually the environmental efficiency, as the basic indicators of our system. We use the mineral resources comprehensive utilization rate instead of the mineral resources productivity because the latter overlaps with the resources in the PRP and the comprehensive utilization rate is the right index to be considered in this phase. Therefore, we also borrow some features from the EIS 2007 by including its first and fourth indicators to some extent.
However, after having selected the indicators, there is still the problem of how to use them for evaluation, since neither the EIS 2007 nor the EIS 2017 demonstrates how to make the indicators work together and how to make an integrated assessment [21,22]. The circular economy has been positioned as a key strategy for national economic and social development by the national government [26]. It is thus essential to design a feasible methodology to carry out an evaluation of the circular degree of the Chinese economy. With the adoption of material flow analysis (MFA), we specified the sub-indicators and the whole calculation method. We believe that, in the selection of key indicators, we have attempted to take as full account of the different aspects of a circular economy as is possible given the available data. The detailed analysis will be shown in the following paragraphs.
2.2. Evaluation Model for the Circular Degree of the National Economy
The MFA is a widely accepted methodology among various evaluation tools available for the development of the circular economy, and MFA-based indicators are generally recognized as the most applicable at the national (macro) level [27,28]. The MFA can be used to analyze the quantitative procedure for determining the flow of materials through the economy on multiple scales, by considering the changes of weight of a substance [3,28].
In order to evaluate the circular degree of the Chinese economy, based on the individual indicators mentioned above and referenced on the MFA methodology, we propose an economy circular degree evaluation system. We divide the economic system into four stages (Figure 1) based on the MFA idea, which is in line with the flow of natural resources. The flow of natural resources in the economic and social system will go through four processes: Stage I is that natural resources are mined to become available resource products; Stage II is that resource products are converted into various types of commodities and consumed; Stage III is the generation of waste during production and consumption, and the waste is partially recycled; Stage IV is the process of unrecycled waste returning to nature, and the strength of nature in terms of decomposition and digestion is applied in this process. The flow of natural resources actually takes place throughout the entire process of economic and social systems.
A circularized economy means that in the all above four stages, the resource inputs and waste generation should be minimized, and waste should be recycled. In order to evaluate the circular degree of the Chinese economy, we therefore select corresponding indicators at each stage which could be used to reflect the circular degree in that stage, and compose a comprehensive indicator to evaluate the overall circular degree of the national economy in China. Besides evaluating a circular economy from a comprehensive perspective, sometimes we should evaluate this from a particular perspective. Since the circular economy should be applied in the whole process of the lifecycle of products covering reduction, reuse and recycling processes, most previous studies have not differentiated the sub-stages and explored the analytical results of sub-indicators of the degree of circularization [9,12,25]. Thus, our method could provide a richer and more diversified approach for the evaluation of the circular economy.
An issue about the creation of individual and comprehensive indicators is how to decide the weight of each sub-indicator. There are a number of weighting methods such as the expert scoring method and analytic hierarchy process (AHP) method [29,30]. In this study, in order to specify the calculation process, we consider different levels of indicators and set the weights through considering the relative importance of each indicator based on previous discussions of circular economy practices in China, while also consulting some experts in the circular economy field, which together represent a combination of the expert scoring method and the AHP method.
In Stage I, the utilization efficiency of natural resources can be determined mainly by the total recovery rate of mineral resources and the comprehensive utilization rate of associated mineral resources. We chose the weighted average of the two aforementioned indicators to serve as the measuring indicator of the mineral resource comprehensive utilization rate (MRCUR) in this stage. (In Stage I, two indicators are involved. That is: the total recovery rate of mineral resources and the comprehensive utilization rate of associated mineral resources. The contributions of these two indicators are different. It is obvious that the total recovery rate of mineral resources plays a more important role in comparison with that of the associated mineral resources. We consulted some experts on the circular economy field and set the weighted average coefficients as 70% to 30%. We used this weighted average of the two aforementioned indicators to serve as the measuring indicator of resource utilization efficiency in this stage). In Stage II, primary resource productivity and the length of the industrial chain would decide the utilization efficiency of resources. However, the length of the industrial chain could not be obtained. Therefore, primary resource productivity (PRP) is used to measure the resource efficiency in this stage. In Stage III, comprehensive utilization of industrial wastes, renewable resource collection and recycling rates can be used to reflect the resource-utilization efficiency. Therefore, we used the weighted mean of the comprehensive utilization rate of industrial solid wastes, the recycling rate of industrial wastewater, and the renewable resource recycling rate to measure the resource-utilization efficiency (The contributions of these recycling activities to the SRRR are different. The CEPL focuses more on solid waste than on waste water due to the intrinsic characteristics of the circular economy. Among solid waste, the amount of industrial solid waste produced is far larger than the amount of renewable resources, which is related to waste produced in life. After consulting with some experts in the circular economy field, we set the weighted average coefficients as 50%, 30% and 20%). We call this the secondary resource recycling rate (SRRR). In Stage IV, environmental efficiency (EE) can be used to reflect the relationship between the emissions into the natural environment and economic outputs.
Based on the above definitions, and the commonly used indicators that can be used to measure and evaluate the circular degree of the Chinese economy [31,32,33], this study put forward the calculations of the individual and comprehensive indicators that are shown in Table 2.
As for Single Indicator (2) of Table 2, a number of primary resources are used in economic activities. In this study, we chose seven bulk resources (petroleum, natural gas, coal, iron ore, non-ferrous metal ore, non-metallic resources and biomass resources, among which petroleum, natural gas and coal are all fossil fuels) in the calculation. Since the inventory data is hard to obtain, we used the apparent consumption (output plus net income) to replace consumption.
As for Single Indicator (3) of Table 2, the secondary resource recycling usually includes industrial solid waste comprehensive utilization, industrial water recycling, crop waste comprehensive utilization, forestry waste comprehensive utilization, renewable resource recycling, urban waste comprehensive utilization, urban reclaimed water recycling, etc. [32]. Considering the availability of data as well as their relative contributions, we chose the industrial solid waste comprehensive utilization rate, renewable resource recycling rate (the recycling rate refers to the ratio of the amount of recycled waste products to the annual output of that kind of products, and the renewable resource recycling rate is the average recycling rate of various wastes) and the industrial water recycling rate to calculate the SRRR. Again, because of the lack of data, the sub-indicator, renewable resources in this study, includes only waste iron and steel, waste non-ferrous metals, waste plastic, waste paper, scrap cars, and waste electronic and electric products (for the calculation of the renewable resource recycling rate, according to the national circular economy index system in 2017, we adopted an average weighting method). The contributions of these recycling activities to the SRRR are different, due to the differences in scale of waste recycling. Therefore, the SRRR is the weighted average of individual recycling rates of these different waste streams.
To calculate EE, considering the availability of data, the major industrial pollutants in Single Indicator (4) of Table 2 include chemical oxygen demand (COD), NH4-N, SO2, smoke, dust and solid waste.
Since the dimensions of the indicators of (2) and (4) of Table 2 are different, we have to find a way to create a comprehensive index to reflect the circular degree of the economy. We first combine the primary resource productivity and environmental efficiency into resource-environmental efficiency, to represent the ratio of humans gaining materials from nature and discharging wastes back to nature, i.e., the ratio of resources used by a socio-economic system and total resource input as (11) of Table 2.
Therefore, we can combine the mineral resource comprehensive utilization rate, resource-environmental efficiency and secondary resource recycling rate to create a comprehensive economic circular degree index. We call this the comprehensive circular degree (CCD) of a national economy. The calculation function is (5) of Table 2. To be specific in (5), CCD is the comprehensive circular degree of a national economy, MRCUR is the mineral resource comprehensive utilization rate, REE is the resource-environmental efficiency, and SRRR is the secondary resource recycling rate. In Table 2, we summarize the evaluation indicator system of the circular degree of a national economy, and evaluation models.
The indicators selected in this paper are mainly based on the two national versions of the circular economy evaluation index of China. By the use of the MFA methodology, the method and the selection of key indicators we have attempted to take full account of the different aspects of the circular economy.
However, we recognize that the indicators we chose in Table 2 do not reflect all potential indicators. Some possible indicators are omitted due to the lack of data. We recognize that indicators we have chosen might not provide a perfect evaluation of the circular degree of the Chinese economy. Nevertheless, they provide a feasible method of evaluation, particularly taking account of the purpose of this study which is to consider the effectiveness of the CEPL of China instead of determining with absolute accuracy the degree of circularization.
Most importantly, the CEPL in China is a big issue. Our view is that effective legislation can greatly affect the promotion of the circular economy in the country. As long as the selection of the indicators before and after the implementation of the CEPL is consistent, and the calculation method remains the same, all major indicators should have obvious changes if the cornerstone law is effective. The relative rationality of the selection of indicators (we believe absolute rationality cannot be achieved), and the consistency of data sampling and method before and after, make this approach feasible.
Since the Chinese economy is usually structured in five-year periods [34], and the effects of the implementation of laws usually lag behind, although the CEPL was implemented in the later period of the 11th Five-year Plan (the 11th Five-year Plan was from 2006 to 2010 and the law came into effect in 2009), the effects of the CEPL occurred mainly in the 12th Five-year Plan period which was from 2011 to 2015. In the indicator setting and discussion processes, the key is to compare the indicators between the 11th Five-year Plan period (before the CEPL’s implementation) and the 12th Five-year Plan period (after the CEPL’s implementation).
2.3. Data Sources
In this study, the years of 2000, 2005 and 2010 are set as the base years of the 10th, 11th, and 12th Five-year Plan periods, respectively. Data were collected from published statistical yearbooks, governmental reports, and peer-reviewed journal papers, as shown below.
3. Results
3.1. Individual Estimation for the Four Stages of Natural Resource Utilization
3.1.1. Stage 1: Mineral Resource Comprehensive Utilization Rate
Due to the data limitations, we could not find the specific annual data of the total recovery rate of major mineral resources, the comprehensive utilization rate of associated mineral resources and other related data from published statistical yearbooks. Instead, we obtained the data of the total recovery rate of major mineral resources and the comprehensive utilization rate of associated mineral resources of the year 2000 from journal papers [35], as well as the total recovery rate of major mineral resource and the comprehensive utilization rate of associated mineral resources of 2005, 2010 and 2015 from the normative documents of the NDRC and the State Council [32,33]. Among which, the 2005 data could be confirmed by the China Mining Yearbook 2008 [36], and the 2015 data was actually the expected mineral resource comprehensive utilization target [32]. In order to evaluate the MRCUR for the comprehensive level of the circular degree of the economy, we assumed that the expected target of 2015 had been achieved, and supposed the MRCUR increased evenly among each five-year period. In combining the existing studies, we can see that the MRCUR increased from 27% in 2000 to 31.5% in 2005 and 36.5% in 2010, and the anticipated target was 41.5% in 2015.
3.1.2. Stage 2: Primary Resource Productivity
Table 3 presents the apparent consumption amounts of major primary resources in China since 2001 [36,37]. In this study, seven primary resources including coal, petroleum, natural gas, iron ore, non-ferrous metal ores, non-metallic resources and biomass resources were considered. The apparent consumption amount is the sum of outputs and imports.
Based on the data provided in Table 3, we calculated the PRP since 2005, presented in Table 4. In this table, GDP were calculated based on the constant prices of 2005 and 2010 separately, in order to correspond to the periods of the 11th and 12th Five-year Plans. We could see that the average PRP in the 11th Five-year Plan period is 4089.16 yuan RMB/ton, and the number increased to 6067.83 yuan RMB/ton in the 12th Five-year Plan period. A 48.39% increase in this period has been observed. It is clear that the PRP in China has increased significantly since 2001. The significant increase of PRP could be explained partly by the promotion of the circular economy by the Chinese government comprehensively through policy measures. However, through the observation of the data, we found that the PRP did not significantly change before and after the adoption of the CEPL. The PRP remained unchanged or even declined around 2008 to 2010, probably due to the macroeconomic fluctuation caused by the economic crisis in 2008. The data changed smoothly from 2010 to 2013, and changed to an accelerating increase in 2014 and 2015. This demonstrated that the changes might not be brought about by the adoption of the CEPL. Figure 2 and Figure 3 present more clear changes in the data.
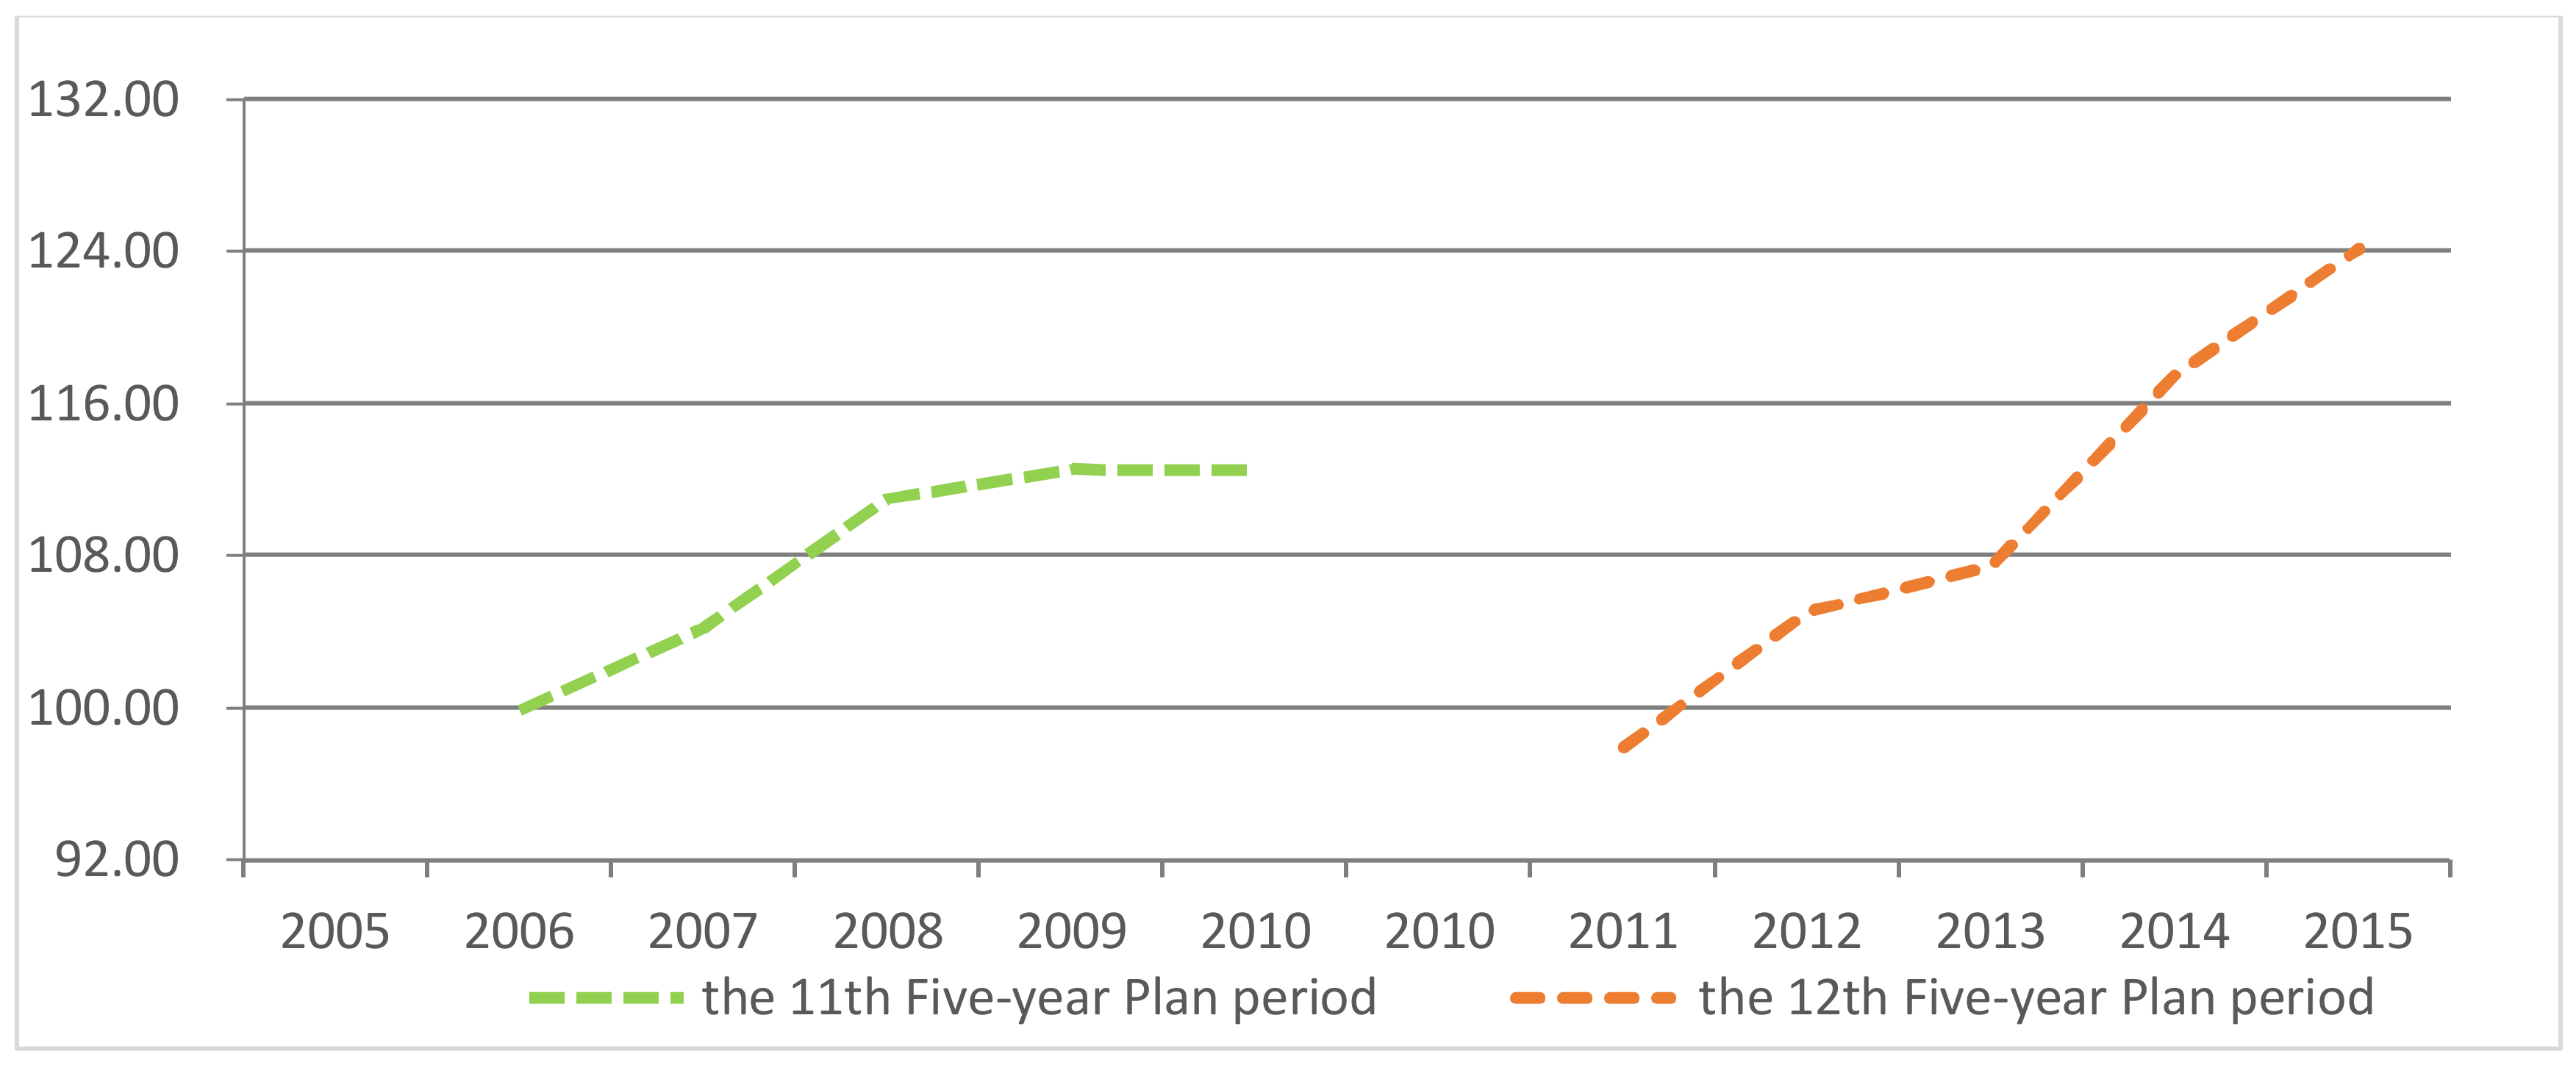
Figure 2 presents the yearly changes of PRP. It shows that in the 11th Five-year Plan period, PRP kept stable and then increased. In the 12th Five-year Plan period, PRP increased significantly, especially in 2014 and 2015. A small fluctuation was observed in 2011. The Index of PRP remained stable and increased in the two Five-year Plan periods, while it increased significantly in 2014 and 2015 (Figure 3).
3.1.3. Stage 3: Secondary Resource Recycling Rate
The SRRR (secondary resource recycling rate) is a combination of the industrial solid waste comprehensive utilization rate, renewable resource recycling rate, and industrial water recycling rate. Table 5 presents the recent progress of industrial solid waste comprehensive utilization in China. This table presents the 2000–2015 produced volume of industrial solid waste and the volume of comprehensive utilization of industrial solid waste which come from the China Environmental Statistical Yearbook [38]. The base year of the comprehensive utilization rate index was set at 2000 for the 10th Five-year Plan period, 2005 for the 11th Five-year Plan period, and 2010 for the 12th Five-year Plan period. From Table 5, we can see that the comprehensive utilization rate of industrial solid waste increased in fluctuation after 2000, rising from 45.9% in 2000 to 60.2% in 2015. However, a significant decline was seen in 2011. It reduced 10.34% in that year. The reduction might have been caused by declining economic growth. When the economy slows down, the utilization of industrial waste can be affected. It also demonstrated that more efforts should be made to promote industrial solid waste utilization. The comprehensive utilization rate of industrial solid waste showed a trend of decline, instead of increase, after the adoption of the CEPL. The comprehensive utilization rate of industrial solid waste was 67% in 2009, and the data from 2010 to 2015 declined a lot, compared with the data in 2009.
Table 6 presents the renewable resource recycling situation in recent years in China. In China, there are no systematic governmental statistics for renewable resource collection and recycling information. Scattered data can be found in the reports of relevant governmental agencies and sector associations. In this study, some of them were applied, including the Renewable Resource Collection Sector Development Report [39], Mid-term and Long-term Plan for the Construction of the Renewable Resource Collection System (2015–2020) [40], China Circular Economy Yearbook 2008–2015 [41], and China Statistical Yearbooks [37].
Due to data limitations, we chose six kinds of bulk wastes: waste iron and steel, waste non-ferrous metals, waste plastics, waste paper, scrap cars and waste electrical and electronic products in order to calculate the renewable resource recycling rate. Also due to data limitations, the collection amount and production amount of the first four kinds of wastes were calculated on their weights, while the last two wastes were calculated on their numbers. The recycling rate of the six wastes was calculated on the arithmetical average of the percentage of collection amount taking the production amount. Since the data of 2005 were unavailable, we only calculated the recycling rate of the 12th Five-year Plan period, with the year 2010 as the base year.
From Table 6, we can see that the recycling of major renewable resources has improved slightly in recent years. The recycling rate increased from 19.30% in 2008 to 21.05% in 2015. However, this is an increase of less than 2% in eight years. In 2010 and 2012, we observed significant fluctuations. Among the six wastes, the recycling rate of waste plastic, scrap cars, waste electrical and electronic wastes declined 1.40%, 2.61%, and 2.52% in the eight years, respectively. For the other three wastes, the recycling rates increased in this period. The decline and weak increase of recycling rates in this period could be attributed partly to the influence of the financial crisis in 2008. Due to the crisis, the speed of economic growth slowed, the demand for resources declined, and thus the demand for renewable resources was affected significantly. The recycling rate of major renewable resources remained almost unchanged after 2009, which demonstrated that the CEPL did not play a positive role in this area.
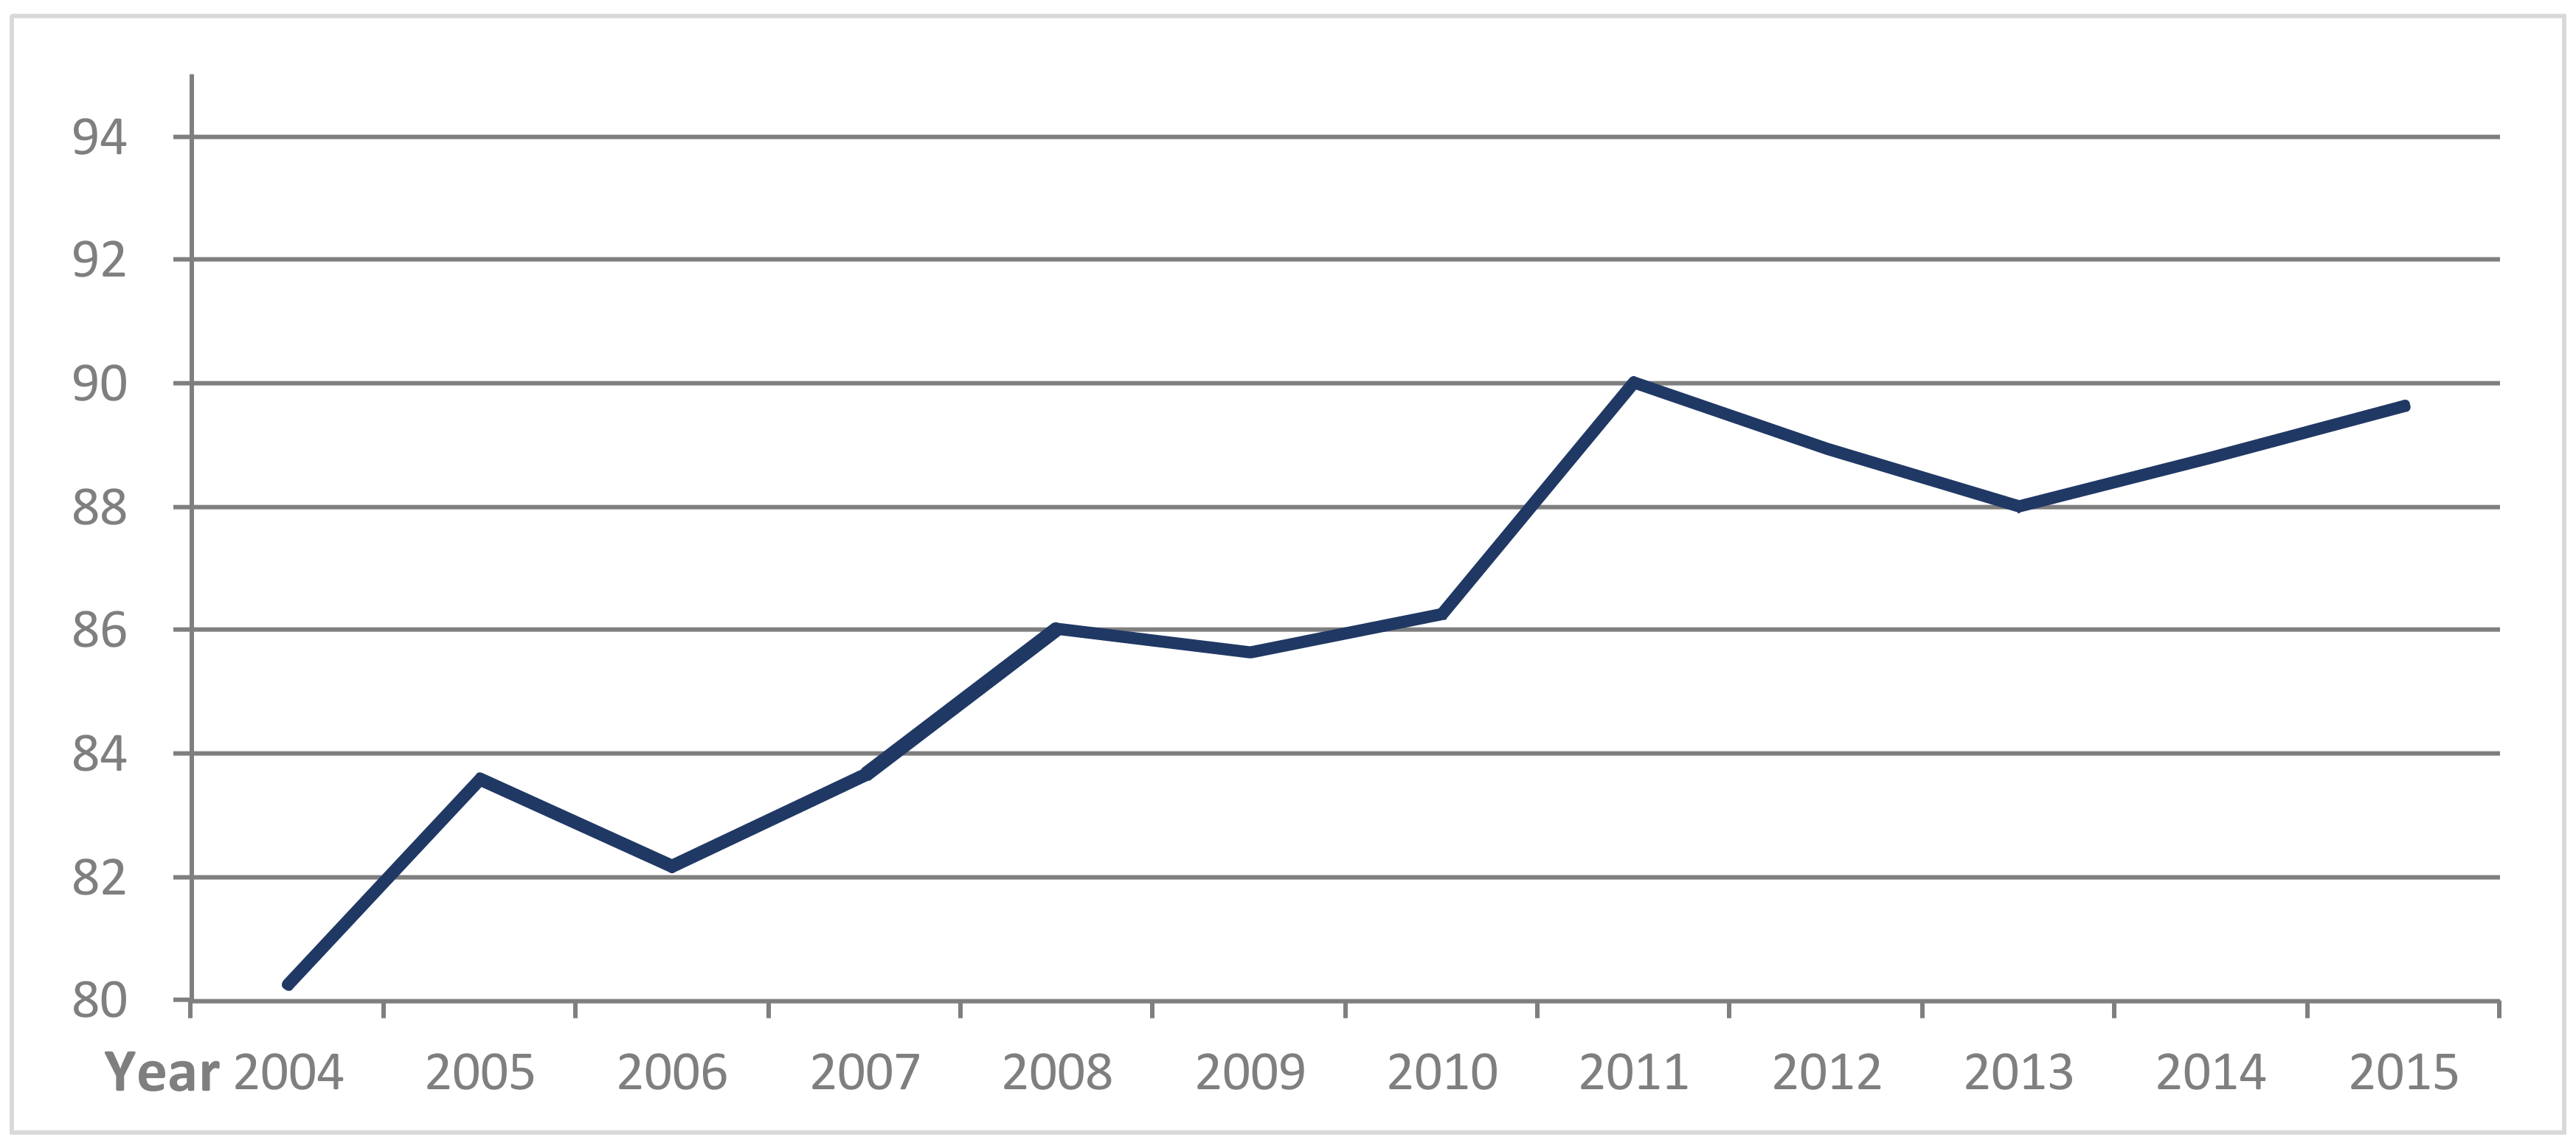
Industrial water recycling rate information is presented in Figure 4 and Table 7. The data are drawn from the China Environmental Statistical Yearbook [38]. We can see that the industrial water recycling rates kept on an increasing trend, although fluctuations can be seen over the years. By 2015, the recycling rate had reached 89.64%. Similarly, before and after the adoption of the CEPL, the industrial water recycling rate did not show obvious fluctuation changes.
The SRRR was calculated based on the information above, and is presented in Table 8. The year 2010 was set as the base year. It is clear that, since 2011 the SRRR has fluctuated significantly, but no significant change was observed. The comprehensive utilization rate of industrial solid waste increased gradually from 2011 to 2014, but declined significantly in 2015. The renewable resource recycling rate showed a significant fluctuation in 2012, but an overall increasing trend could be seen in the period. Industrial water recycling rate showed a declining trend first, and then an increasing trend. From the variation of the SRRR, we did not see a continuous increase after the adoption of the CEPL in 2009.
3.1.4. Stage 4: Environmental Efficiency
The industrial pollutant discharges and environmental efficiency (EE) since 2000 are presented in Figure 5 and Table 9. The base years of the 10th, 11th, and 12th Five-year Plan periods were set to 2000, 2005 and 2010, respectively. The data originate from the China Environmental Statistical Yearbook [38] and China Statistical Yearbooks [37]. The major pollutants in this study include COD and NH4-N in industrial wastewater, SO2 and smoke in industrial waste gases, as well as industrial solid waste. From Figure 5 and Table 9, we can see that EE has increased significantly since 2000. In 2000, each unit environmental load could support 0.11 million yuan RMB growth. In 2015, the number had increased to 1.02 million yuan RMB growth. The EE increased 8 times in the 16 years. The Index of EE increased fastest in the 11th Five-year Plan period, and the speed of increase slowed down in the 12th Five-year Plan period. The CEPL exerted influence mainly in the 12th Five-year Plan period, but Figure 5 shows the increase of Index of EE during this period actually slowed down.
3.2. Comprehensive Evaluation of the Circular Degree of the National Economy
3.2.1. Resource-Environmental Efficiency
The resource-environmental efficiency (REE) is calculated with (total consumption amount of major primary resources – total discharge of major industrial pollutants)/total consumption amount of major primary resources × 100%. The REE is high if the emission of pollutants, the discharged waste to nature, is low, while the total consumption amount of major primary resources remains unchanged. The changes of REE in China since 2001 are presented in Figure 6 and Table 10. We can see that the REE was relatively high in these years, while it increased gradually from 2001 to 2015. However, the increase in the rate is quite low, probably due to the weak improvement of waste recycling in these years, which might partly be caused by the weak structure of the CEPL, as mentioned above. In 2011, the Ministry of Environmental Protection amended the indicator system, investigation guideline and relevant technical specifications of discharged pollutants, and thus the data of 2011 presented a notable drop [42]. Taking 2011–2015 as the observation period, we found that the increase of the Index of Resource-environmental efficiency stopped in this period.
3.2.2. Comprehensive Circular Degree (CCD) of the National Economy
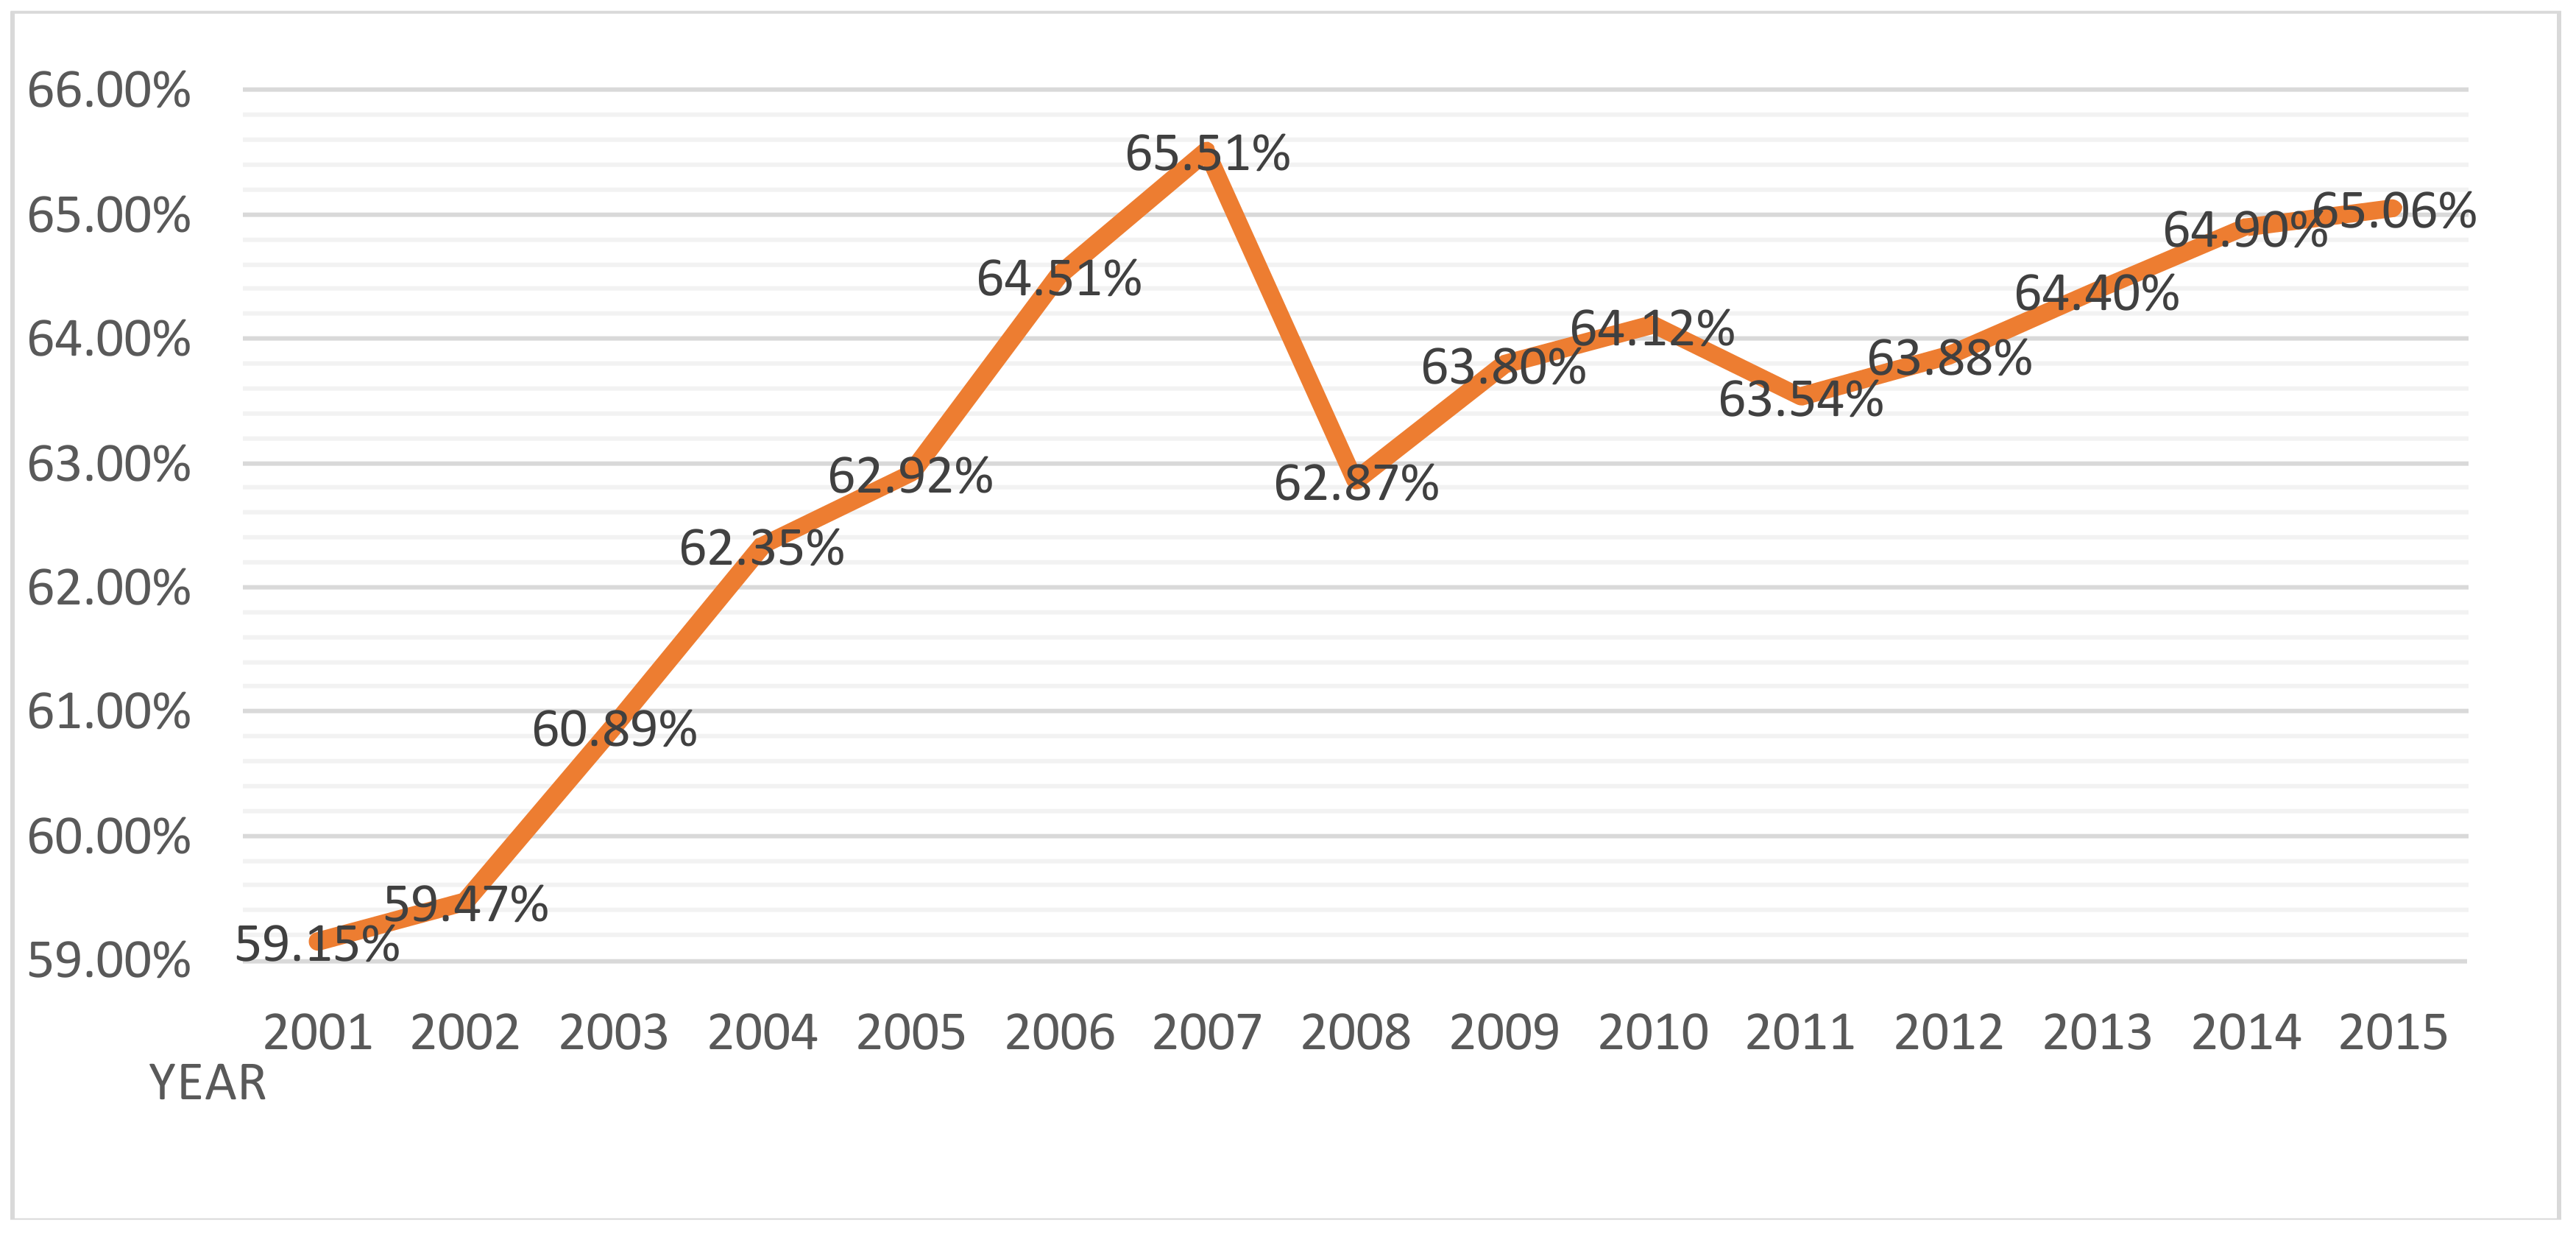
In this study, CCD was used as a comprehensive indicator to evaluate the circular degree of the Chinese national economy. CCD has combined the estimation results of the mineral resource comprehensive utilization rate, resource-environmental efficiency and secondary resource recycling rate. Based on the previous data and our calculation function, we obtained the CCD values since 2001 in China, which are listed in Figure 7 and Table 11.
It can be seen that the CCD in China increased slightly from 59.15% in 2001 to 65.06% in 2015, which is an increase of 5.9 percentage points. The annual increase rate is 0.68%.A significant fluctuation was seen around 2007 and 2008, when the international and domestic economy experienced significant volatility. In the time of the 12th Five-year Plan period, a low point can be identified in 2011. The CEPL came into force in 2009. We found that in the whole period of the 12th Five-year Plan, the CCD showed very little increase, far below the increases of the CCD in the 10th and 11th Five-year Plan periods. On the one hand, this demonstrates that the CEPL had limited effects in promoting the circular economy in China. On the other hand, progress appeared to be closely linked to the macroeconomic situation. For example, the recycling of renewable resources could be influenced significantly by the economic situation. If the price of bulk resources declines, the demand for renewable resources will also decline.
4. Discussion
Based on the above quantitative evaluations of the circular degree of the Chinese national economy, we can see that MRCUR, PRP, SRRR and EE, and their index indicators, except PRP and the Index of PRP, all showed either a slow increase or even a decline after the implementation of the CEPL. The significant increases of PRP and Index of PRP might not be related to the implementation of the CEPL, but could be the result of technological innovation and market competition, since the significant increase of PRP happened in 2014 and 2015. For the relatively comprehensive indicator of REE, from 2011 to 2015, no increase was observed. For the comprehensive indicator CCD, in the whole 12th Five-year Plan period this showed a very slow increase, far slower than in the 10th and 11th Five-year Plan periods before the implementation of the CEPL. Overall, although the increases of some indicators slowed significantly in the 12th Five-year Plan period, resource efficiencies were increasing in the calculation period, different fluctuations could be identified, and it seems that the fluctuation could be attributed more to changes in the macro-economic situation and the consequent reduced demand for raw and secondary materials rather than the implementation of the CEPL.
It should be noted that resource recycling is the basis of the circular economy [14,43]. In the evaluation of the circular degree of the Chinese national economy in this study, SRRR is the key resource recycling indicator. Compared with 2010, SRRR showed a general trend of decline in the 12th Five-year Plan period. SRRR includes three sub-indicators, which are industrial water recycling rate, industrial solid waste comprehensive utilization rate, and renewable resource recycling rate. Among them, the industrial water recycling rate changed from 90.01% in 2011 to 89.64% in 2015. Stagnation was observed. The industrial solid waste comprehensive utilization rate was 66.7% in 2010, 59.8% in 2011 and 60.2% in 2015. Comparing the 11th and 12th Five-year Plan periods, its growth has fallen back. The renewable resource recycling rate was 20.22% in 2011 and 21.05% in 2015. Only tiny growth could be observed. While the resource recycling rate in China is quite low and marginal effects are far from being generated, the extremely low renewable resource recycling rate in the 12th Five-year Plan period demonstrated that the CEPL did not realize its intended goals, especially in the resource recycling area.
Of course, there are still several limitations in this study. For example, the low circular degree of Chinese economy in the 12th Five-year Plan period might be caused by a number of factors, such as the fluctuation of the international economy, as well as the marginal utility diminishing effect of resource utilization, the limitation of indicators selected in this study, and data availability, etc. However, since these factors all existed before and after the implementation of the CEPL, and the Chinese government provided continuous support to circular economy development in the whole period, including the construction of a large number of circular economy industrial parks [33,44], the unsatisfactory nature of these circular economy development indicators in China in the 12th Five-year Plan period showed that the formulation and implementation of the CEPL did not play an important role in promoting the development of the circular economy in China.
Domestic studies also supported our findings. Some researchers believed that the CEPL could not be easily implemented in practice, and the CEPL could not play an important role in promoting the circular economy [17,19,45,46,47,48]. Zhai Yong, the leader of the Legal Office of the Environmental Protection and Resource Conservation Committee of the National People’s Congress (the National People’s Congress is the legislative organ of China, and the Legal Office of the Environmental Protection and Resource Conservation Committee of the National People’s Congress is the major legislation research and proposal institution within environmental and resource law areas) pointed out that, in the 10 years since the adoption of the CEPL, it has not been implemented effectively. The reason lies in the fact that the concept and definition of the circular economy in the law is not clear, and it is thus very difficult to establish a behavior system that conforms to the legal norms [17,45]. The CEPL did not take resource strategy as core, but created its legal structure and content based on the models and ideas of the so-called emerging economy. This made the government spend a large amount of manpower, material resource, capital and policies in establishing the models but not in creating an effective legal framework to ensure a highly efficient utilization of resources [17,45]. Specifically, the CEPL focused on the creation of industrial parks, and establishing a large and all-inclusive eco-economic model combining industrial parks, industrial chains, arterial industries and venous industries, etc. This has encouraged local governments to create their own circular economy development models through establishing circular economy industrial models by means such as attracting investment, establishing industrial chains, etc. “Creating a model for model’s sake” became the mainstream, and deviated from the core target of highly efficient utilization of resources [17,19,45,47]. In addition, the deficiency of the associated subordinate law and the lack of a relevant legal framework are also among the key issues affecting the implementation of the CEPL [49,50].
In the process of developing a circular economy, China has undoubtedly learned from the experiences of Germany and Japan [51], but the model also has distinctively Chinese characteristics. Geng and Zhang (2013) [52] pointed out that Japan’s effort focuses on redeveloping eco-industry and Germany’s on waste hierarchy, whereas China’s circular economy is a broader systemic policy which is more integrated at the national level, requiring development planning and collaboration by government agencies [3]. The circular economy has three-level closed-loop initiatives: single enterprise cleaner production, eco-industrial parks constructed by cluster enterprises, and an urban circular economy. Only China is promoting the third-level circular economy [11]. In facing serious environmental and resource problems, the Chinese government adopted the most radical theoretical form, and tried to solve the dilemma between economic development and a shortage of resources. The CEPL was applied to promote the transition of the economic development model, and realize the circularization of the economy. However, legislation can only realize the target or vision of a “circular economy” through the regulation of human behavior. Legislation cannot really adjust an economic model from the very beginning. It can only affect the choice and action of individuals, enterprises and other types of groups. For legislation regulating people’s behavior, the main content should be focused on the norms of rights, obligations and liabilities to promote the intended changes in behavior. Although this should include some legal principles and concepts, the main content should be legal rules with a strict logical structure [48]. On the surface, the circular economy legislation in China seems to have adopted a more high-end industry promotion and economic model transition route. In essence, the legislation has deviated from the concrete issues which legislation could help to solve. Ít is thus, arguably, a misuse of legislation by the legislative body [47,48]. Although Japan also formulated the Basic Act on Establishing a Sound Material-Cycle Society, which looks similar to the CEPL in China, it is nevertheless based on resource recycling norms, and there are also a large number of lower-level laws and regulations to support the implementation of this Act [53,54,55,56]. Therefore, circular economy legislation can only be effective if it is formulated based on national conditions, faces the problems in reality, and follows the rules of legislation whereby it sets out detailed obligations, norms and provides for relevant liabilities in order to influence behavior in the direction of the circular economy.
5. Conclusions
From the results above we can see that, using a quantitative methodology to evaluate the circular performance of a national economy is feasible, and the four-step evaluation methodology can be used to carry out the evaluation. This can help to identify the circular degree of the national economy in the different phases of natural resource utilization during production, consumption, recycling etc. It can also be used to identify the integrated circular degree of the economy, as well as the development trend of the circular degree. By proposing the method and quantitative analysis, we have provided relatively clear evidence that the CEPL has not realized its target of promoting the transition of the economic development model.
In order to create initiatives to change currently unsustainable practices, it is necessary to reform existing policy and legislation [57,58]. While the circular economy is a diverse bundle of complicated ideas which have nonetheless collectively taken hold, “Its actual enactment is limited and fragile” [59] (p. 218). Therefore, legislation is sometimes necessary, but we must be cautious at the same time. Considering the concrete situation in China, the economic development model transition could be promoted by the policy system and government actions, instead of legislation [60,61]. The amendment of the CEPL has been included in the legislative plan of the Standing Committee of the 12th National People’s Congress [62]. The key point of a “circular economy” lies in the comprehensive utilization of resources, and focuses on the reduction of pollutant generation and the improvement of resource utilization efficiency, instead of the economic development model. The principles for the amendment of the CEPL should return to resource utilization issues, and concrete provisions should be formulated to regulate the behavior of people in the utilization of material resources.
Supplementary Materials
The following are available online at https://www.mdpi.com/2071-1050/10/4/990/s1. Table S1: Mineral resource comprehensive utilization rate in China (2000–2015); Table S2: Domestic recovery amount of renewable resource in China (2008–2015); Table S3: Output of six products in China (2008–2015); Table S4: Index of secondary resource recycling rate (2011–2015); Table S5: Discharge amount of major pollutants (2000–2015); Table 3, Table 4, Table 5, Table 6, Table 7, Table 8, Table 9, Table 10 and Table 11 and Figure 2, Figure 3, Figure 4, Figure 5, Figure 6 and Figure 7 in main text are also included in the Supplementary Materials to maintain the integrity, transparency and reproducibility of research records. The digits in the Tables have been automatically rounded to two decimal points as shown in the supplementary excel file. However all numerical calculations are based on the detailed numerical value in the excel, not based on the omitted number.
Acknowledgments
The study was supported by the Key Project (14ZS075) of the Innovation Program of Shanghai Municipal Education Commission and the Key Project (14SFB20,045) of the Ministry of Justice of the PRC. We would like to thank Xuejun Wang from the Environmental School of Beijing University for his great help in providing support for the methods of this study.
Author Contributions
Yuan Hu designed this study, carried out the empirical work and the data analysis, wrote the literature review, and drafted the manuscript. Xuan He participated in the empirical studies and helped to draft the primary data. Mark Poustie participated in the design of the study, made revisions and finalized this study. All authors read and approved the final manuscript.
Conflicts of Interest
The authors declare no conflict of interest.
References
- United Nations (UN). Report of the UN Conference on Environment and Development, Rio de Janeiro, 3–14 June 1992; UN Doc A/CONF.151/26/Rev.1; United Nations: Rio de Janeiro, Brazil, 1992; Volume I–III. [Google Scholar]
- Robinson, N.A.; Hassan, P.; Burhenne-Guilmin, F. Agenda 21 and the UNCED Proceedings; Oceana Publications: New York, NY, USA, 1993. [Google Scholar]
- Geng, Y.; Fu, J.; Sarkis, J. Towards a national circular economy indicator system in China: An evaluation and critical analysis. J. Clean. Prod. 2012, 23, 216–224. [Google Scholar] [CrossRef]
- Zhu, D.J. Sustainable development calls for circular economy. Sci. Technol. Rev. 1998, 9, 39–42. (In Chinese) [Google Scholar]
- Su, Y.; Zhou, H.C. Discussion on some issues concerning the development of circular economy in China. Econ. Res. Ref. 2005, 10, 15–20. (In Chinese) [Google Scholar]
- Yuan, Z.; Bi, J.; Moriguichi, Y. The Circular Economy: A New Development Strategy in China. J. Ind. Ecol. 2010, 10, 4–8. [Google Scholar] [CrossRef]
- Lieder, M.; Rashid, A. Towards circular economy implementation: A comprehensive review in context of manufacturing industry. J. Clean. Prod. 2016, 115, 36–51. [Google Scholar] [CrossRef]
- Wang, Y.Q. How to promote circular economy in environmental protection department. Environ. Prot. 2004, 9, 3–7. (In Chinese) [Google Scholar]
- Geng, Y.; Zhu, Q.; Doberstein, B. Implementing China’s circular economy concept at the regional level: A review of progress in Dalian, China. Waste Manag. 2009, 29, 996–1002. [Google Scholar] [CrossRef] [PubMed]
- The Standing Committee of the National People’s Congress China. Circular Economy Promotion Law of the People’s Republic of China. 2008. Available online: http://www.fdi.gov.cn/1800000121_39_597_0_7.html (accessed on 23 August 2017). (In Chinese)
- Mathews, J.A.; Tan, H. Progress toward a Circular Economy in China. J. Ind. Ecol. 2011, 15, 435–457. [Google Scholar] [CrossRef]
- Su, B.; Heshmati, A.; Geng, Y. A review of the circular economy in China: Moving from rhetoric to implementation. J. Clean. Prod. 2013, 42, 215–227. [Google Scholar] [CrossRef]
- Ying, F.; Zhao, W.P. Circular economy development phase research based on the IPAT equation: The case of Shaanxi. Econ. Horiz. 2015, 17, 33–44. [Google Scholar] [CrossRef]
- Murray, A.; Skene, K.; Haynes, K. The circular economy: An interdisciplinary exploration of the concept and application in a global context. J. Bus. Ethics 2017, 140, 369–380. [Google Scholar] [CrossRef]
- Schneider, P.; Anh, L.H.; Wagner, J.; Reichenbach, J.; Hebner, A. Solid waste management in Ho Chi Minh City, Vietnam: Moving towards a circular economy? Sustainability 2017, 9, 286. [Google Scholar] [CrossRef]
- Geng, Y.; Doberstein, B. Developing the circular economy in China: Challenges and opportunities for achieving 'leapfrog development’. Int. J. Sustain. Dev. World Ecol. 2008, 15, 231–239. [Google Scholar] [CrossRef]
- Zhang, H.B. Environmental legislation should not focus on the purpose of establishing the concept model but on the actual effect of environmental and economic benefits: The view of a legislative expert on revising the “Circular Economy Promotion Law of the People’s Republic of China”. Resour. Regen. 2015, 8, 22–27. (In Chinese) [Google Scholar]
- China Energy Network. Available online: http://www.cnenergy.org/hb/201611/t20161129_409270.html (accessed on 18 June 2017). (In Chinese).
- Yu, J.X. The confusion and the way out of the law on the promotion of circular economy: Rational reflection for eight years’ practice. Environ. Econ. 2017, 3, 56–61. (In Chinese) [Google Scholar]
- West, J.; Schandl, H.; Heyenga, S. Resource Efficiency: Economics and Outlook for China (Chinese Version). United Nations Environment Programme, Research Report, 2013. Available online: https://www.researchgate.net/publication/255723165_Resource_Efficiency_Economics_and_Outlook_for_China_Chinese_Version (accessed on 23 September 2017). (In Chinese).
- National Development and Reform Commission of the PRC (NDRC). Notice of the Evaluation Index System for the Development of Circular Economy, 2007, No. 1815 [2007] of the NDRC Environmental and Resource Division. Available online: http://ishare.iask.sina.com.cn/f/33945394.html (accessed on 16 December 2017). (In Chinese).
- National Development and Reform Commission of the PRC (NDRC). Notice of the Evaluation Index System for the Development of Circular Economy, 2017, No. 2749 [2016] of the NDRC Environmental and Resource Division. Available online: http://www.ndrc.gov.cn/zcfb/zcfbtz/201701/t20170112_834922.html (accessed on 7 December 2017). (In Chinese)
- Liu, Z.; Geng, Y.; Park, H.S.; Dong, H.J.; Dong, L.; Fujita, T. An emergy-based hybrid method for assessing industrial symbiosis of an industrial park. J. Clean. Prod. 2016, 114, 132–140. [Google Scholar]
- Pan, H.Y.; Zhang, X.H.; Wang, Y.Q.; Qi, Y.; Wu, J.; Lin, L.L. Emergy evaluation of an industrial park in Sichuan Province, China: A modified emergy approach and its application. J. Clean. Prod. 2016, 135, 105–118. [Google Scholar] [CrossRef]
- Jiang, J. The compiling method and empirical study of circular economy development index. Res. Dev. 2013, 1, 89–92. (In Chinese) [Google Scholar]
- Liu, C.; Côté, R. A Framework for Integrating Ecosystem Services into China’s Circular Economy: The Case of Eco-Industrial Parks. Sustainability 2017, 9, 1510. [Google Scholar] [CrossRef]
- Bringezu, S.; Schutz, H.; Mooll, S. Rationale for and interpretation of economy-wide materials flow analysis and derived indicators. Ind. Ecol. 2003, 7, 43–64. [Google Scholar] [CrossRef]
- Wang, N.; Lee, J.C.K.; Zhang, J.; Chen, H.; Li, H. Evaluation of urban circular economy development: An empirical research of 40 cities in china. J. Clean. Prod. 2018, 180, 876–887. [Google Scholar] [CrossRef]
- Chen, S.J.; Hwang, C.L.; Hwang, F.P. Fuzzy multiple attribute decision making: Methods and applications. Eur. J. Oper. Res. 1992, 4, 287–288. [Google Scholar]
- Ulukan, Z.; Kahraman, C.; Cebeci, U. Multi-criteria supplier selection using fuzzy AHP. Logist. Inf. Manag. 2003, 16, 382–394. [Google Scholar]
- Ofcen, English Section. The Twelfth Five-Year Plan for National Economic and Social Development of the People’s Republic China Central Compilation & Tr. 2011. Available online: http://www.gbv.de/dms/zbw/720612306.pdf (accessed on 23 August 2017).
- National Development and Reform Commission of the PRC (NDRC). Notice on the Guidance of the Comprehensive Utilization of Resource of the 12th Five-Year Plan and the Implementation Plan of Comprehensive Utilization of Bulk Solid Wastes. No. 2919 [2011] of the NDRC Environmental and Resource Division. Available online: http://zfxxgk.ndrc.gov.cn/PublicItemView.aspx?ItemID=%7becba8923-08ac-4949-bf55-b9c65bc7dede%7d (accessed on 23 August 2017). (In Chinese)
- State Council. Notice of the State Council on Issuing the Circular Economy Development Strategy and Near-Term Action Plan, 2013. No. 5 [2013] of the State Council. Available online: http://www.gov.cn/zwgk/2013-02/05/content_2327562.htm (accessed on 23 August 2017). (In Chinese)
- Wikipedia. Five-Year Plans of China. Available online: https://en.wikipedia.org/wiki/Five-year_plans_of_China (accessed on 7 September 2017).
- Cai, S.F.; Yang, D. Comprehensive utilization research of mineral resources. Compr. Util. Chin. Resour. 2000, 2, 3–5. (In Chinese) [Google Scholar]
- Editorial Office of China Mining Yearbook. China Mining Yearbooks, 2002–2015; China Earthquake Press: Beijing, China, 2002–2016. (In Chinese) [Google Scholar]
- National Bureau of Statistics. China Statistical Yearbooks, 2000–2016; China Statistics Press: Beijing, China, 2000–2016. (in Chinese) [Google Scholar]
- National Bureau of Statistics and Ministry of Environmental Protection. China Environmental Statistical Yearbook, 2000–2016; China Statistics Press: Beijing, China, 2000–2016. (In Chinese) [Google Scholar]
- Department of Circulation Industry Development Division of Ministry of Commerce. Renewable Resource Collection Sector Development Report 2013–2015. Government Report. Available online: http://ltfzs.mofcom.gov.cn/article/ztzzn/an/201406/20140600629599.shtml (accessed on 15 July 2017). (In Chinese)
- Ministry of Commerce. Midterm and Long-term Plan for the Construction of Renewable Resource Collection System (2015–2020). Government Document, No. 21 [2015] of the Department of Circulation Industry Development Division of Ministry of Commerce. Available online: http://www.mofcom.gov.cn/article/h/redht/201501/20150100878083.shtml (accessed on 15 July 2017). (In Chinese)
- Xie, Z.H.; Zhang, Y. China Circular Economy Yearbook 2008–2010; 2011–2013; 2014–2015; Chinese Financial and Economic Publishing House: Beijing, China; Metallurgical Industry Press: Beijing, China. (In Chinese)
- National Bureau of Statistics. Note of the Environmental Statistical Data 2013. Available online: http://www.stats.gov.cn/ztjc/ztsj/hjtjzl/2013/201412/t20141219_655870.html (accessed on 15 October 2017). (In Chinese)
- European Environmental Agency (EEA). Circular Economy in Europe—Developing the Knowledge Base (No. 2). European Environmental Agency, 2016; Available online: https://www.eea.europa.eu/publications/circular-economy-in-europe (accessed on 9 August 2017).
- State Council. Several Opinions of the State Council on Speeding up the Development of Circular Economy; Interpretation of Administrative Regulations; No. 22 [2005] of the State Council. Available online: http://www.lawinfochina.com/display.aspx?id=4559&lib=law (accessed on 5 June 2017).
- Zhai, Y. Research on circular economy and circular economy legislation. J. Shanghai Univ. Political Sci. Law (Rule Law Rev.) 2017, 6, 11–20. (In Chinese) [Google Scholar]
- Peng, F.; Chen, S.Q. EU “circular economy” legislation: Origin, concept and evolution. J. Shanghai Univ. Political Sci. Law (Rule Law Rev.) 2017, 6, 21–28. (In Chinese) [Google Scholar]
- Peng, F. Resource, waste or industry promotion—China’s “Circular Economy Promotion Law” revision path rethinking. Politics Law 2017, 9, 98–109. (In Chinese) [Google Scholar]
- Guo, Y.J. The legislation is to promote circular economy or regulate the comprehensive utilization of material resources: A perspective on the revision of China’s Circular Economy Promotion Law. Politics Law 2017, 8, 130–141. (In Chinese) [Google Scholar]
- Xue, S.L. Research on the difficulties and countermeasures in the implementation of the Circular Economy Promotion Law. Leg. Expo. 2017, 27, 50–51. (In Chinese) [Google Scholar]
- Qu, Y. Comparison and reconstruction of the legal system of circular economy. J. Shanghai Univ. Political Sci. Law (Rule Law Rev.) 2017, 6, 29–37. (In Chinese) [Google Scholar]
- Moriguchi, Y. Material flow indicators to measure progress toward a sound material-cycle society. J. Mater. Cycles Waste Manag. 2007, 9, 112–120. [Google Scholar] [CrossRef]
- Geng, Y.; Zhang, P. Measuring China’s circular economy. Science 2013, 339, 1526–1527. [Google Scholar] [CrossRef] [PubMed]
- Despeisse, M.; Kishita, Y.; Nakano, M.; Barwood, M. Towards a circular economy for end-of-life vehicles: A comparative study UK—Japan. Procedia CIRP 2015, 29, 668–673. [Google Scholar] [CrossRef]
- Hiratsuka, J.; Sato, N.; Yoshida, H. Current status and future perspectives in end-of-life vehicle recycling in Japan. J. Mater. Cycles Waste Manag. 2014, 16, 21–30. [Google Scholar] [CrossRef]
- Environment Agency Japan. Basic Law for Establishing a Sound Material-Cycle Society (Tentative translation). Law No. 110 of 2000. March, 2008.
- Dong, H.L. The enlightenment of the legislation of circular economy in Japan on environmental legislation in China. Mod. Jurisprud. 2006, 1, 177–184. (In Chinese) [Google Scholar]
- Iacovidou, E.; Velis, C.A.; Purnell, P.; Zwirner, O.; Brown, A.; Hahladakis, J. Metrics for optimising the multi-dimensional value of resources recovered from waste in a circular economy: A critical review. J. Clean. Prod. 2017, 166, 910–938. [Google Scholar] [CrossRef]
- Silva, A.; Stocker, L.; Mercieca, P.; Rosano, M. The role of policy labels, keywords and framing in transitioning waste policy. J. Clean. Prod. 2016, 115, 224–237. [Google Scholar] [CrossRef]
- Crang, M. Interrogating the circular economy: The moral economy of resource recovery in the EU. Econ. Soc. 2015, 44, 218–243. [Google Scholar]
- Van Rooij, B. Implementation of Chinese Environmental Law: Regular Enforcement and Political Campaigns. Dev. Chang. 2006, 37, 57–74. [Google Scholar] [CrossRef]
- Wang, A. The Search for Sustainable Legitimacy: Environmental Law and Bureaucracy in China. Harv. Environ. Law Rev. 2013, 37, 365–440. [Google Scholar] [CrossRef]
- The National People’s Congress. Available online: http://www.npc.gov.cn/wxzl/gongbao/2017-03/30/content_2019527.htm (accessed on 20 September 2017).
Figure 1.
Four stages of natural resource flow in an economic and social system.
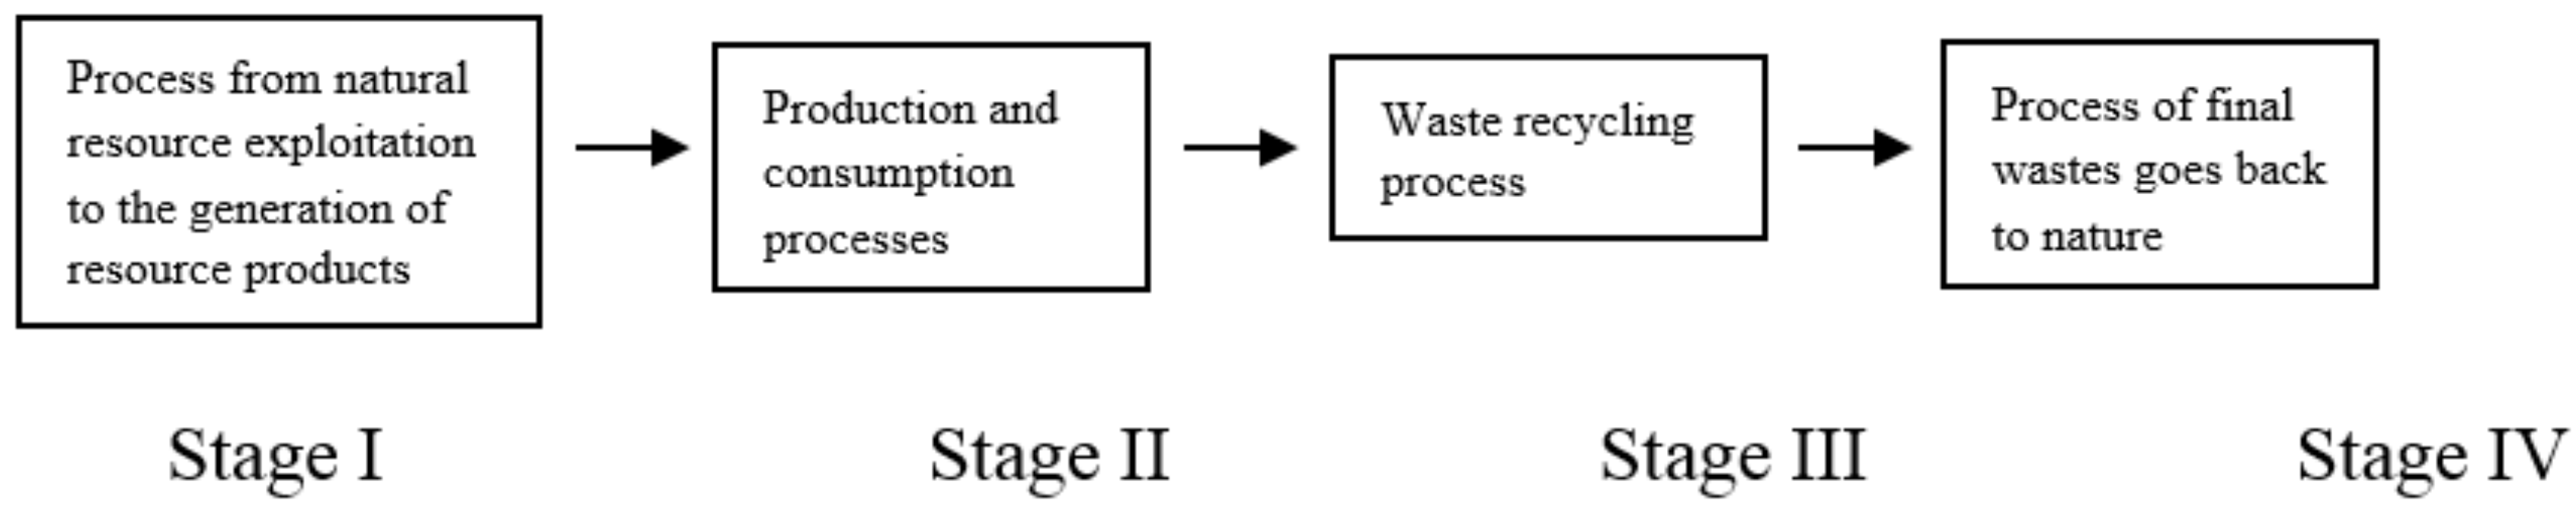
Figure 2.
Annual changes of PRP in the two Five-year periods.
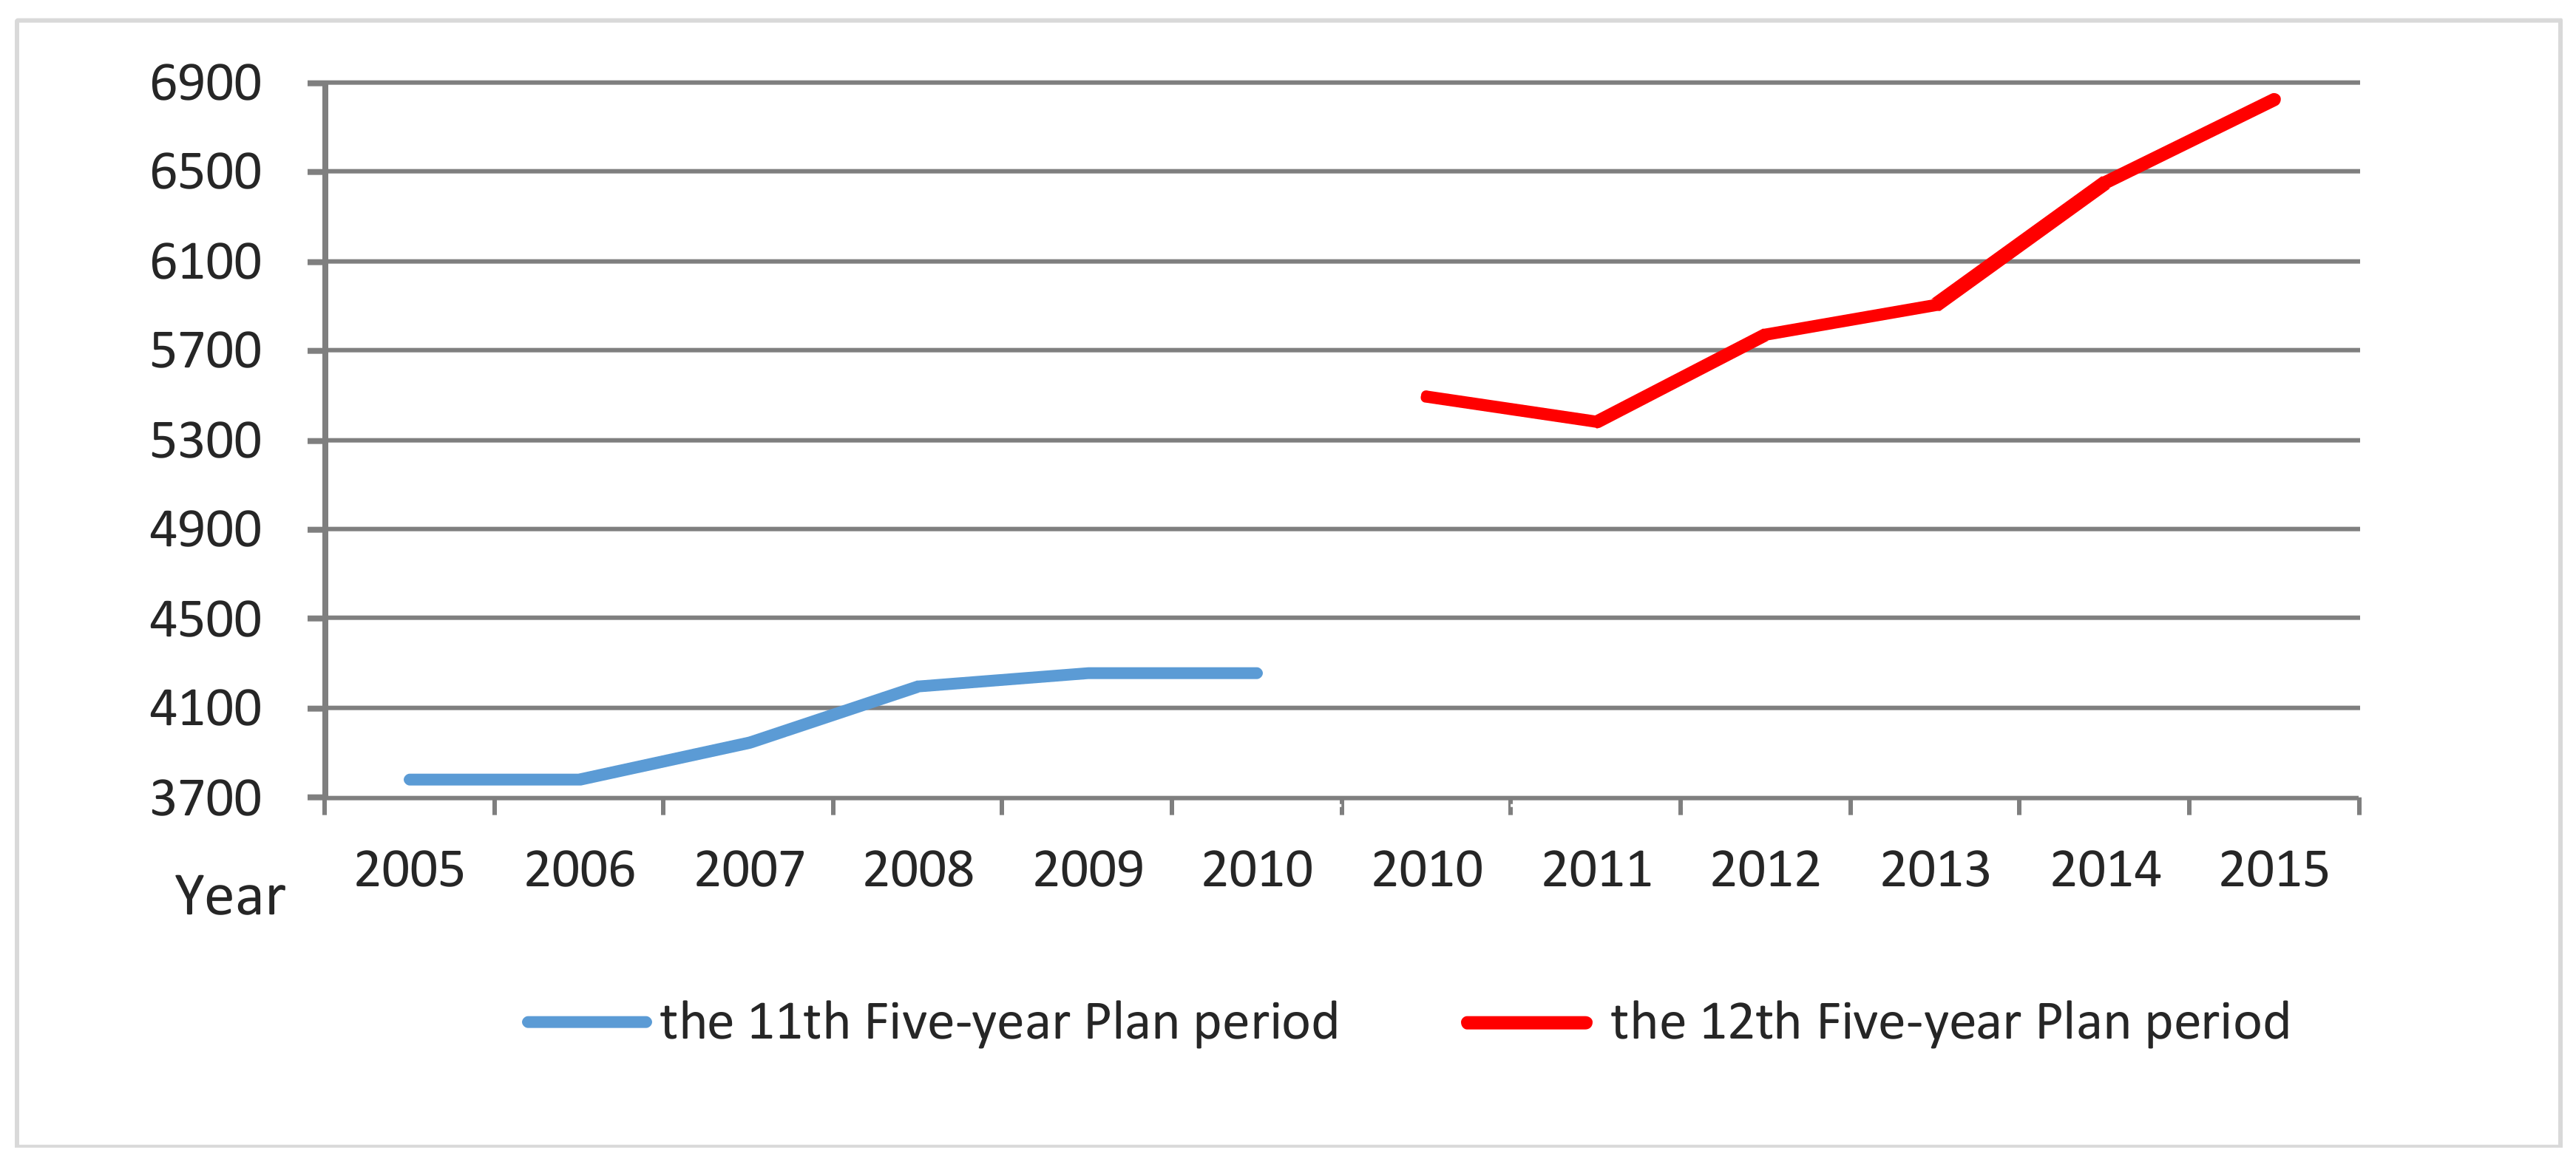
Figure 3.
Annual changes of PRP Index in the two Five-year periods.

Figure 4.
Industrial water recycling rates from 2004 to 2015.

Figure 5.
Changes of environmental efficiencies (EE) from 2000 to 2015.
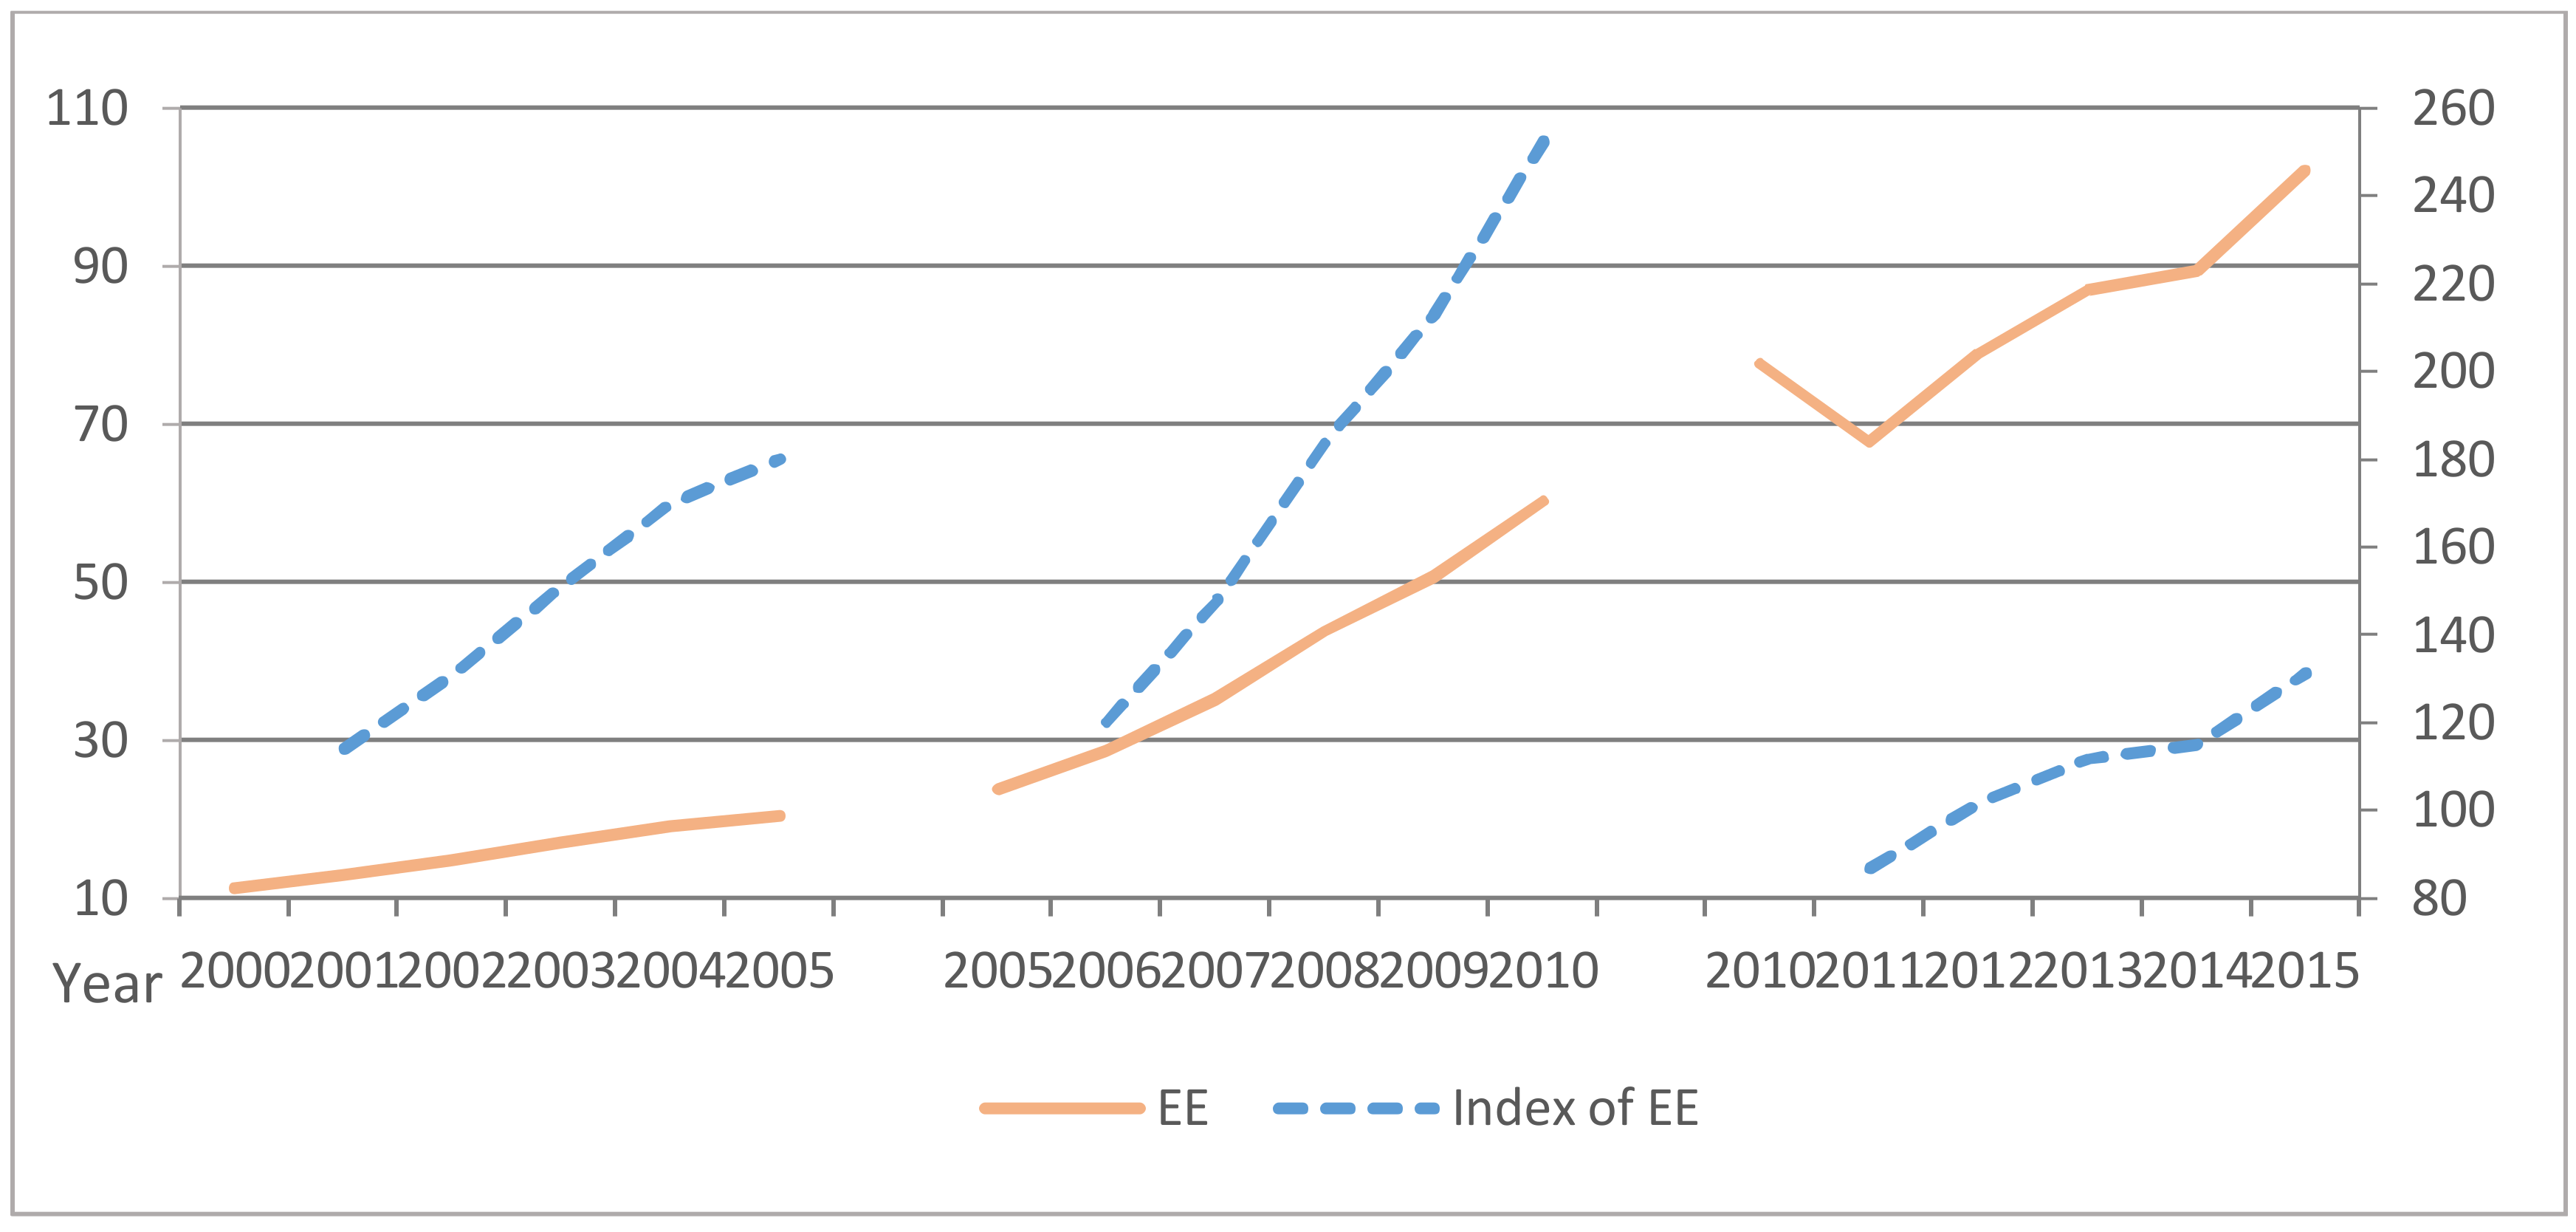
Figure 6.
Changes in resource-environmental efficiency (REE) in China from 2001 to 2015.
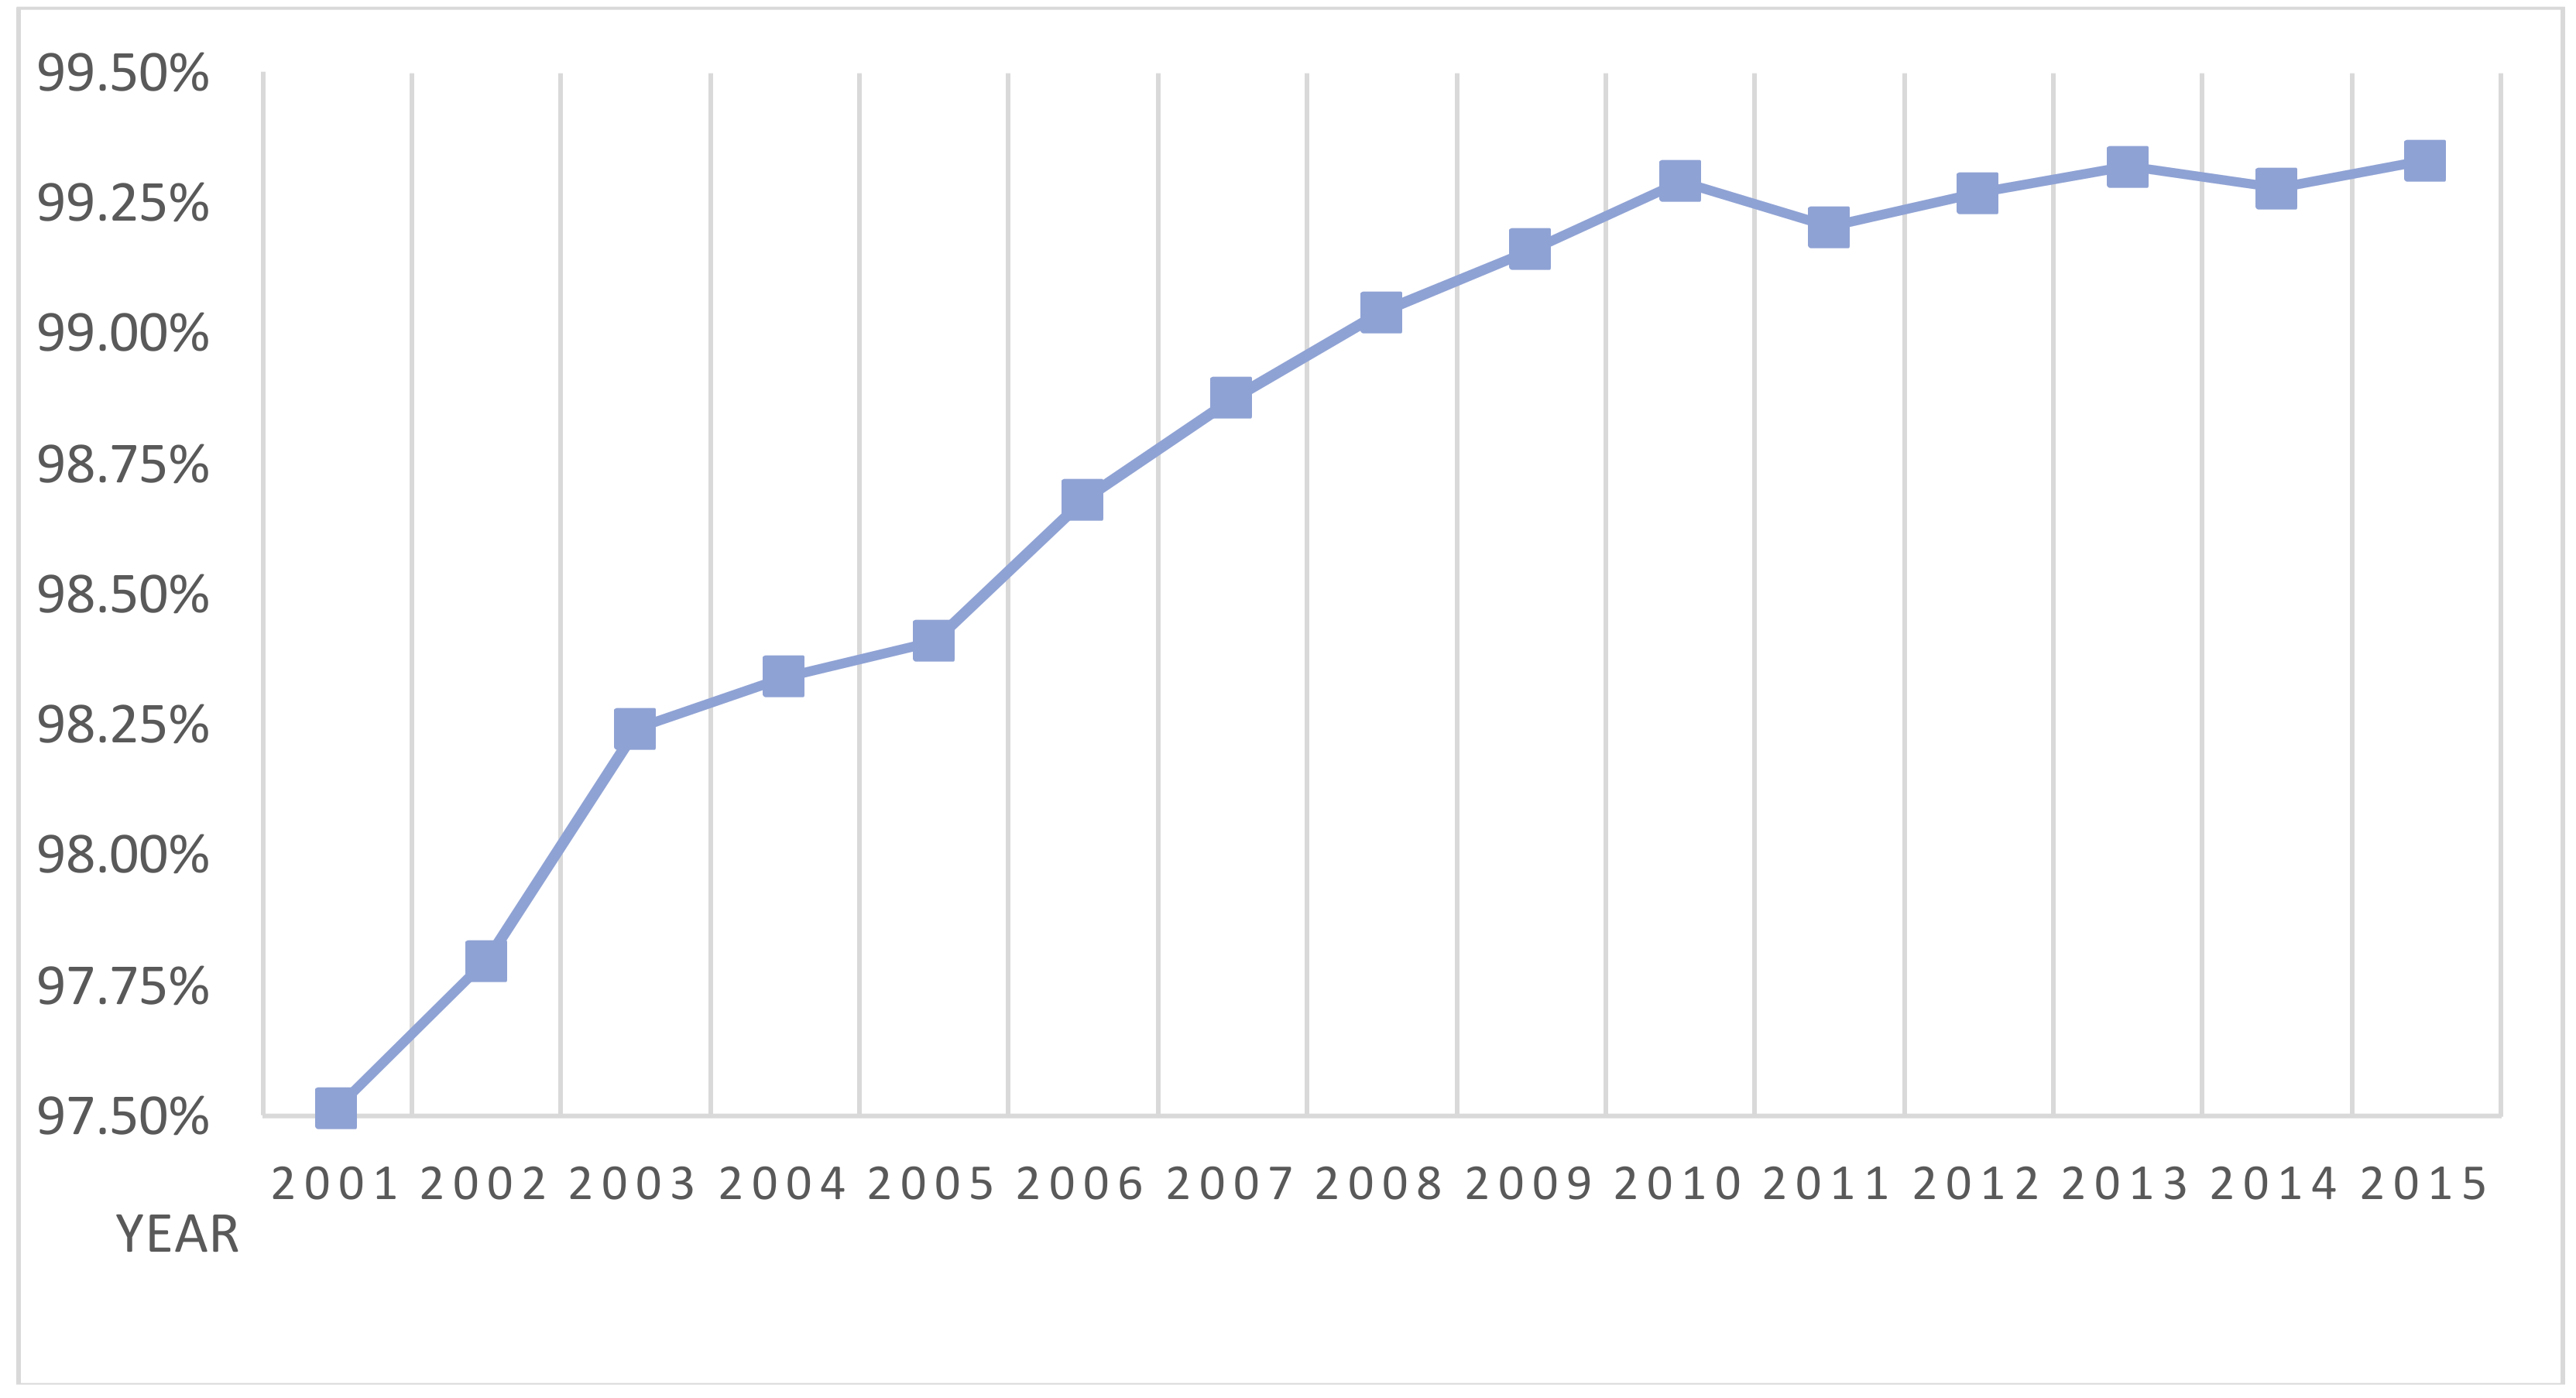
Figure 7.
Changes of comprehensive circular degree (CCD) of Chinese economy from 2001 to 2015.

Table 1.
Evaluation index system of circular economy development of China.
| Indicators | Sub-Indicators | |
|---|---|---|
| EIS 2007 (macro level) | (1) Resource productivity | Output of main mineral resource; output of energy |
| (2) Resource consumption rate | Energy consumption per unit GDP; energy consumption per added industrial value; energy consumption of per unit product in key industrial sectors; water withdrawal per unit of GDP; water withdrawal per added industrial value; water consumption of per unit product in key industrial sectors; coefficient of irrigation water utilization | |
| (3) Integrated resource utilization rate (secondary resource recycling rate) | Recycling rate of industrial solid waste; industrial water reuse ratio; recycling rate of reclaimed municipal wastewater; safe treatment rate of domestic solid wastes; recycling rate of iron scrap; recycling rate of non-ferrous metals; recycling rate of waste paper; recycling rate of plastic; recycling rate of rubber | |
| (4) Waste disposal and pollutant emission | Total amount of industrial solid waste for final disposal; total amount of industrial wastewater discharge; total amount of SO2 emission; total amount of chemical oxygen demand (COD) discharge | |
| EIS 2017 | (1) Comprehensive Indicator | Primary resource productivity; |
| Major secondary resource recycling rate | ||
| (2) Single indicator | Comprehensive utilization rate of general industrial solid waste; recovery rate of major renewable resources; comprehensive utilization rate of crop straw; city food and kitchen waste recycling rate; urban construction waste resource processing rate; energy productivity; water resources productivity; Construction land productivity; repeated water use rate of above-scale industrial enterprises; urban reclaimed water utilization rate; resource recycling industry output value | |
| (3) Reference indicator | The amount of industrial solid waste disposal; industrial waste water emissions; processing capacity of urban solid waste; major pollutants emissions |
Table 2.
Evaluation indicator system of the circular degree of the national economy in China.
| Indicator | Calculation Methods |
|---|---|
| 1. Single indicator | |
| (1) MRCUR (mineral resource comprehensive utilization rate) | MRCUR = 0.7 × total recovery rate of major mineral resource + 0.3 × comprehensive utilization rate of associated mineral resources |
| (2) PRP (primary resource productivity) | PRP = GDP (constant prices)/total consumption amount of major primary resources (petroleum, natural gas, coal, iron ore, non-ferrous metal ore, non-metallic resources and biomass resources, among which petroleum, natural gas and coal are all fossil fuels, in apparent consumption) |
| (3) SRRR (Secondary resource recycling rate) | SRRR = 0.5 × industrial solid waste comprehensive utilization rate + 0.3 × renewable resource recycling rate + 0.2 × industrial water recycling rate |
| (4) EE (environmental efficiency) | EE = GDP (constant prices)/total discharges of major pollutants (the sum of COD, ammonia nitrogen, SO2, smoke, dust and solid waste) |
| 2. Comprehensive indicator | |
| (5) CCD (comprehensive circular degree) | CCD = ∑(MRCUR + REE + SRRR)/3 |
| 3. Supplementary indicator | |
| (6) Total recovery rate of major mineral resource | The data are obtained from governmental reports and published articles |
| (7) Comprehensive utilization rate of associated mineral resources | The data are obtained from governmental reports and published articles |
| (8) Comprehensive utilization rate of industrial solid wastes | Comprehensive utilization rate of industrial solid waste = volume of comprehensive utilization of industrial solid waste/produced volume of industrial solid waste × 100% |
| (9) Recycling rate of major renewable resources | Recycling rate of major renewable resources = (domestic waste iron and steel recovery amount/crude steel production + domestic waste non-ferrous metals recovery amount/production of 10 major non-ferrous metals + domestic waste plastic recovery amount/primary plastic production + domestic waste paper recovery amount/machine-made paper production + scrap cars recovery amount/production of cars + waste electronic and electric products recovery amount/production of electronic and electric products) × 1/6 × 100% |
| (10) Industrial water recycling rate | Industrial water recycling rate = recycling amount of industrial water/(new industrial water consumption+ recycling amount of industrial water) × 100% |
| (11) Resource-environmental efficiency (REE) (This is a semi- comprehensive indicator) | Resource-environmental efficiency = (total consumption amount of major primary resources − total discharge of major industrial pollutants)/total consumption amount of major primary resources × 100% |
| (12) Index of mineral resource comprehensive utilization rate | Index of mineral resource comprehensive utilization rate = current year mineral resource comprehensive utilization rate/base year mineral resource comprehensive utilization rate × 100% |
| (13) Index of primary resource productivity | Index of primary resource productivity = current year primary resource productivity/base year primary resource productivity × 100% |
| (14) Index of the secondary resource recycling rate | Index of the secondary resource recycling rate = 0.5 × index of industrial solid waste comprehensive utilization rate + 0.3 × index of renewable resource recycling rate + 0.2 × index of industrial water recycling rate |
| (15) Index of industrial solid waste comprehensive utilization rate | Index of industrial solid waste comprehensive utilization rate = current year industrial solid waste comprehensive utilization rate/base year industrial solid waste comprehensive utilization rate × 100% |
| (16) Index of renewable resource recycling rate | Index of renewable resource recycling rate = current year renewable resource recycling rate/base year renewable resource recycling rate × 100% |
| (17) Index of industrial water recycling rate | Index of industrial water recycling rate = current year industrial water recycling rate/base year industrial water recycling rate × 100% |
| (18) Index of environmental efficiency | Index of environmental efficiency = current year environmental efficiency/base year environmental efficiency × 100% |
Table 3.
Apparent consumption amount of major primary resources in China.
| Year | Raw Coal (Standard Coal) | Crude Oil (Standard Coal) | Natural Gas (Standard Coal) | Iron Ore | Non-ferrous Metal Ores | Non-Metallic Resources | Biomass Resources | Total |
|---|---|---|---|---|---|---|---|---|
| 2001 | 105,771.96 | 32,975.96 | 3733.13 | 28,901.65 | 13,278.16 | 111,799.02 | 43,112.45 | 339,572.34 |
| 2002 | 116,160.25 | 35,611.17 | 3900.27 | 33,549.52 | 12,245.94 | 119,505.67 | 42,945.73 | 363,918.55 |
| 2003 | 138,352.27 | 39,613.68 | 4532.91 | 37,748.88 | 10,367.25 | 163,778.24 | 40,037.42 | 434,430.65 |
| 2004 | 161,657.26 | 45,825.92 | 5296.46 | 51,880.98 | 14,429.14 | 126,358.22 | 46,495.91 | 451,943.90 |
| 2005 | 189,231.16 | 46,523.68 | 6272.86 | 62,520.92 | 12,577.39 | 130,228.30 | 47,580.53 | 494,934.84 |
| 2006 | 207,402.11 | 50,131.73 | 7734.61 | 75,066.06 | 15,419.31 | 152,155.20 | 50,697.21 | 558,606.23 |
| 2007 | 225,795.45 | 52,945.14 | 9343.26 | 87,924.76 | 19,519.39 | 164,647.48 | 51,098.16 | 611,273.64 |
| 2008 | 229,236.87 | 53,542.04 | 10,900.77 | 97,863.67 | 19,436.53 | 164,188.74 | 54,301.30 | 629,469.92 |
| 2009 | 240,666.22 | 55,124.66 | 11,764.41 | 108,648.48 | 19,097.67 | 189,592.93 | 54,118.23 | 679,012.60 |
| 2010 | 249,568.42 | 62,752.75 | 14,425.92 | 129,221.48 | 25,154.27 | 213,995.65 | 56,726.81 | 751,845.29 |
| 2011 | 271,704.19 | 65,023.22 | 17,803.98 | 156,524.7 | 28,761.38 | 241,190.78 | 59,511.48 | 840,519.73 |
| 2012 | 275,464.53 | 68,363.46 | 19,302.62 | 147,252.33 | 32,717.77 | 240,043.26 | 62,122.09 | 845,266.06 |
| 2013 | 280,999.36 | 71,292.12 | 22,096.39 | 154,494.18 | 37,931.81 | 259,585.45 | 64,030.46 | 890,429.77 |
| 2014 | 279,328.74 | 74,090.24 | 24,270.94 | 161,844.37 | 32,955.99 | 236,173.88 | 65,266.31 | 873,930.47 |
| 2015 | 273,849.49 | 78,672.62 | 25,364.40 | 147,721.60 | 32,783.60 | 259,055.75 | 66,754.97 | 884,202.43 |
Unit: 10 Thousand ton; Data sources: China Statistical Yearbook, 2002–2016 (National Bureau of Statistics); China Mining Yearbook, 2002–2016 (Editorial Office of China Mining Yearbook).
Table 4.
Primary resource productivity (PRP) in China from 2005 to 2015.
| Year | Amount of Resource Consumption (0.1 Billion Ton) | GDP (0.1 Billion Yuan RMB) | PRP (Yuan/Ton) | Index of PRP (%) |
|---|---|---|---|---|
| 2005 Constant price | ||||
| 2005 | 49.49 | 187,318.9 | 3784.72 | |
| 2006 | 55.86 | 211,147.7 | 3779.90 | 99.87 |
| 2007 | 61.13 | 241,195.8 | 3945.79 | 104.26 |
| 2008 | 62.95 | 264,472.8 | 4201.52 | 111.01 |
| 2009 | 67.90 | 289,329.9 | 4261.04 | 112.59 |
| 2010 | 75.18 | 320,102.6 | 4257.56 | 112.49 |
| Average for the 11th Five-year Plan period | 4089.16 | |||
| 2010 Constant price | ||||
| 2010 | 75.18 | 413,030.3 | 5493.55 | |
| 2011 | 84.05 | 452,429.9 | 5382.74 | 97.98 |
| 2012 | 84.53 | 487,976.2 | 5773.05 | 105.09 |
| 2013 | 89.04 | 525,835.4 | 5905.41 | 107.50 |
| 2014 | 87.39 | 564,194.4 | 6455.83 | 117.52 |
| 2015 | 88.42 | 603,212.1 | 6822.10 | 124.18 |
| Average for the 12th Five-year Plan period | 6067.83 | |||
Data sources: Resource consumption data comes from Table 3, and the GDP comes from the China Statistical Yearbook (2016) (National Bureau of Statistics).
Table 5.
Comprehensive utilization of industrial solid waste from 2000 to 2015.
| Year | Produced Volume of Industrial Solid Waste (10 Thousand Ton) | Volume of Comprehensive Utilization of Industrial Solid Waste (10 Thousand Ton) | Comprehensive Utilization Rate of Industrial Solid Waste (%) | Industrial Solid Waste Comprehensive Utilization Index |
|---|---|---|---|---|
| 2000 | 81,608 | 37,451 | 45.9 | |
| 2001 | 88,840 | 47,290 | 52.1 | 113.51 |
| 2002 | 94,509 | 50,061 | 51.9 | 113.07 |
| 2003 | 100,428 | 56,040 | 54.8 | 119.39 |
| 2004 | 120,030 | 67,796 | 55.7 | 121.35 |
| 2005 | 134,449 | 76,993 | 56.1 | 122.22 |
| 2006 | 151,541 | 92,601 | 60.2 | 107.31 |
| 2007 | 175,632 | 110,311 | 62.1 | 110.70 |
| 2008 | 190,127 | 123,482 | 64.3 | 114.62 |
| 2009 | 203,943 | 138,186 | 67 | 119.43 |
| 2010 | 240,944 | 161,772 | 66.7 | 118.89 |
| 2011 | 326,204 | 196,988 | 59.8 | 89.66 |
| 2012 | 332,509 | 204,467 | 60.9 | 91.30 |
| 2013 | 330,859 | 207,616 | 62.2 | 93.25 |
| 2014 | 329,254 | 206,392 | 62.1 | 93.10 |
| 2015 | 331,055 | 200,857 | 60.2 | 90.25 |
Data sources: China Environmental Statistical Yearbook (2001–2016) (National Bureau of Statistics and Ministry of Environmental Protection).
Table 6.
Recycling of major renewable resources from 2008 to 2015.
| Year | Recycling Rate of Waste Iron and Steel | Recycling Rate of Waste Non-Ferrous Metals (%) | Recycling Rate of Waste Plastic (%) | Recycling Rate of Waste Paper (%) | Recycling Rate of Scrap Cars (%) | Recycling Rate of Waste Electronic and Electrical Products (%) | Recycling Rate of Major Renewable Resources (%) | Index of Recycling Rate of Major Renewable Resources |
|---|---|---|---|---|---|---|---|---|
| 2008 | 14.03 | 7.78 | 24.45 | 37.22 | 9.55 | 22.79 | 19.30 | |
| 2009 | 13.32 | 13.63 | 27.55 | 38.18 | 5.13 | 25.75 | 20.59 | |
| 2010 | 13.04 | 12.98 | 27.07 | 37.58 | 8.10 | 20.24 | 19.83 | |
| 2011 | 13.28 | 13.24 | 27.04 | 39.48 | 6.44 | 21.82 | 20.22 | 101.93 |
| 2012 | 11.60 | 14.34 | 30.01 | 40.82 | 5.71 | 11.44 | 18.99 | 93.91 |
| 2013 | 18.55 | 15.09 | 21.71 | 38.66 | 6.10 | 14.71 | 19.14 | 100.79 |
| 2014 | 18.52 | 16.53 | 28.21 | 37.49 | 5.39 | 17.07 | 20.54 | 107.32 |
| 2015 | 17.89 | 16.99 | 23.05 | 41.15 | 6.94 | 20.27 | 21.05 | 102.49 |
Data sources: the Renewable Resource Collection Sector Development Report (Ministry of Commerce, 2013–2015); Mid-term and Long-term Plan for the Construction of the Renewable Resource Collection System (2015–2020) (Ministry of Commerce, 2015); China Circular Economy Yearbook (2008–2016) (Xie and Zhang et al., 2008–2016).
Table 7.
Industrial water recycling rate from 2004 to 2015.
| Year | New Industrial Water Consumption (10 Thousand m3) | Recycling Amount (10 Thousand m3) | Industrial Water Recycling Rate (%) | Index of Industrial Water Recycling Rate |
|---|---|---|---|---|
| 2004 | 1,028,202 | 4,183,937 | 80.27 | |
| 2005 | 1,112,285 | 5,670,096 | 83.60 | |
| 2006 | 1,200,287 | 5,535,492 | 82.18 | 98.30 |
| 2007 | 1,177,176 | 6,026,048 | 83.66 | 100.07 |
| 2008 | 1,064,104 | 6,547,258 | 86.02 | 102.89 |
| 2009 | 1,028,179 | 6,130,645 | 85.64 | 102.44 |
| 2010 | 1,094,686 | 6,872,928 | 86.26 | 103.18 |
| 2011 | 702,724 | 6,334,101 | 90.01 | 104.35 |
| 2012 | 858,143 | 6,913,391 | 88.96 | 103.13 |
| 2013 | 888,536 | 6,526,517 | 88.02 | 102.04 |
| 2014 | 874,086 | 6,930,588 | 88.80 | 102.94 |
| 2015 | 827,433 | 7,160,130 | 89.64 | 103.92 |
Data sources: China Environmental Statistical Yearbook (2005–2016) (National Bureau of Statistics and Ministry of Environmental Protection).
Table 8.
Secondary resource recycling rate (SRRR) from 2010 to 2015.
| Year | Industrial Solid Waste Comprehensive Utilization Rate | Renewable Resource Recycling Rate | Industrial Water Recycling Rate | Secondary Resource Recycling Rate |
|---|---|---|---|---|
| 2010 | 66.70 | 19.83 | 86.26 | 56.55 |
| 2011 | 59.80 | 20.22 | 90.01 | 53.97 |
| 2012 | 60.90 | 18.99 | 88.96 | 53.94 |
| 2013 | 62.20 | 19.14 | 88.02 | 54.44 |
| 2014 | 62.10 | 20.54 | 88.80 | 54.97 |
| 2015 | 60.20 | 21.05 | 89.64 | 54.34 |
Table 9.
Major industrial pollutant discharges and environmental efficiencies (EE) from 2000 to 2015.
Table 9.
Major industrial pollutant discharges and environmental efficiencies (EE) from 2000 to 2015.
| Year | GDP (0.1 Billion RMB) | Total Discharges of Major Pollutants (10 Thousand Ton) | Environmental Efficiency (10 Thousand Yuan RMB/Ton) | Index of EE |
|---|---|---|---|---|
| 2000 constant price | ||||
| 2000 | 100,280.1 | 8883.7 | 11.29 | |
| 2001 | 108,639.2 | 8431.4 | 12.89 | 114.15 |
| 2002 | 118,561.9 | 8011.2 | 14.80 | 131.11 |
| 2003 | 130,463.2 | 7632.7 | 17.09 | 151.42 |
| 2004 | 143,657.8 | 7488.89 | 19.18 | 169.94 |
| 2005 | 160,027 | 7861.78 | 20.36 | 180.32 |
| Average for the 10th Five-year Plan period | 16.86 | |||
| 2005 constant price | ||||
| 2005 | 187,318.9 | 7861.78 | 23.83 | |
| 2006 | 211,147.7 | 7357.63 | 28.70 | 120.44 |
| 2007 | 241,195.8 | 6864.14 | 35.14 | 147.48 |
| 2008 | 264,472.8 | 6036.97 | 43.81 | 183.87 |
| 2009 | 289,329.9 | 5695.91 | 50.80 | 213.19 |
| 2010 | 320,102.6 | 5319.39 | 60.18 | 252.56 |
| Average for the 11th Five-year Plan period | 43.72 | |||
| 2010 constant price | ||||
| 2010 | 413,030.3 | 5319.39 | 77.65 | |
| 2011 | 452,429.9 | 6690.33 | 67.62 | 87.09 |
| 2012 | 487,976.2 | 6175.56 | 79.02 | 101.77 |
| 2013 | 525,835.4 | 6049.70 | 86.92 | 111.94 |
| 2014 | 564,194.4 | 6307.68 | 89.45 | 115.20 |
| 2015 | 603,212.1 | 5906.32 | 102.13 | 131.53 |
| Average for the 12th Five-year Plan period | 85.03 | |||
Data sources: China Statistical Yearbook (2001–2016) (National Bureau of Statistics); China Environmental Statistical Yearbook (2001–2016) (National Bureau of Statistics and Ministry of Environmental Protection).
Table 10.
Resource-environmental efficiency (REE) in China from 2001 to 2015.
| Year | Total Consumed Resource (10 Thousand Ton) | Total Discharged Pollutants (10 Thousand Ton) | REE (%) |
|---|---|---|---|
| 2001 | 339,572.34 | 8431.40 | 97.52 |
| 2002 | 363,918.55 | 8011.20 | 97.80 |
| 2003 | 434,430.65 | 7632.70 | 98.24 |
| 2004 | 451,943.90 | 7488.89 | 98.34 |
| 2005 | 494,934.84 | 7861.78 | 98.41 |
| 2006 | 558,606.23 | 7357.63 | 98.68 |
| 2007 | 611,273.64 | 6864.14 | 98.88 |
| 2008 | 629,469.92 | 6036.97 | 99.04 |
| 2009 | 679,012.60 | 5695.91 | 99.16 |
| 2010 | 751,845.29 | 5319.39 | 99.29 |
| 2011 | 840,519.73 | 6690.33 | 99.20 |
| 2012 | 845,266.06 | 6175.56 | 99.27 |
| 2013 | 890,429.77 | 6049.70 | 99.32 |
| 2014 | 873,930.47 | 6307.68 | 99.28 |
| 2015 | 884,202.43 | 5906.32 | 99.33 |
Table 11.
Comprehensive circular degree (CCD) of Chinese economy from 2001 to 2015.
| Year | MRCUR (%) | REE (%) | SRRR (%) | CCD (%) |
|---|---|---|---|---|
| 2001 | 27.85 | 97.52 | 52.10 | 59.15 |
| 2002 | 28.72 | 97.80 | 51.90 | 59.47 |
| 2003 | 29.62 | 98.24 | 54.80 | 60.89 |
| 2004 | 30.54 | 98.34 | 58.16 | 62.35 |
| 2005 | 31.50 | 98.41 | 58.85 | 62.92 |
| 2006 | 32.44 | 98.68 | 62.40 | 64.51 |
| 2007 | 33.41 | 98.88 | 64.26 | 65.51 |
| 2008 | 34.41 | 99.04 | 55.14 | 62.87 |
| 2009 | 35.44 | 99.16 | 56.81 | 63.80 |
| 2010 | 36.50 | 99.29 | 56.55 | 64.12 |
| 2011 | 37.45 | 99.20 | 53.97 | 63.54 |
| 2012 | 38.42 | 99.27 | 53.94 | 63.88 |
| 2013 | 39.42 | 99.32 | 54.44 | 64.40 |
| 2014 | 40.45 | 99.28 | 54.97 | 64.90 |
| 2015 | 41.50 | 99.33 | 54.34 | 65.06 |
© 2018 by the authors. Licensee MDPI, Basel, Switzerland. This article is an open access article distributed under the terms and conditions of the Creative Commons Attribution (CC BY) license (http://creativecommons.org/licenses/by/4.0/).
Share and Cite
MDPI and ACS Style
Hu, Y.; He, X.; Poustie, M. Can Legislation Promote a Circular Economy? A Material Flow-Based Evaluation of the Circular Degree of the Chinese Economy. Sustainability 2018, 10, 990. https://doi.org/10.3390/su10040990
AMA Style
Hu Y, He X, Poustie M. Can Legislation Promote a Circular Economy? A Material Flow-Based Evaluation of the Circular Degree of the Chinese Economy. Sustainability. 2018; 10(4):990. https://doi.org/10.3390/su10040990
Chicago/Turabian StyleHu, Yuan, Xuan He, and Mark Poustie. 2018. "Can Legislation Promote a Circular Economy? A Material Flow-Based Evaluation of the Circular Degree of the Chinese Economy" Sustainability 10, no. 4: 990. https://doi.org/10.3390/su10040990
Note that from the first issue of 2016, this journal uses article numbers instead of page numbers. See further details here.