Landfill Site Selection by Weighted Overlay Technique: Case Study of Al-Kufa, Iraq


1
Collage of Engineering, University of Babylon, Hila 51001, Iraq
2
Department of Civil, Environmental and Natural Resources Engineering, Lulea University of Technology, 971 87 Lulea, Sweden
*
Author to whom correspondence should be addressed.
Sustainability 2018, 10(4), 999; https://doi.org/10.3390/su10040999
Submission received: 3 January 2018
/
Revised: 14 March 2018
/
Accepted: 27 March 2018
/
Published: 28 March 2018
Abstract
:Landfill siting is a hard and complex process. For this reason, it is considered as one of the major problems in waste management. This is due to the fact that a number of factors are involved within the process such as such as inhabitants’ growth, rapid economic growth, living standards improvements, etc. In Iraq, landfill siting does not follow environmental regulations. Al-Kufa city located is located south-western part of Iraq (area of 550 km2 and inhabitants 372,760). Existing landfills are not selected according to the environmental standards. Landfill site that is required was achieved using a multi-criteria decision analysis (MCDA) and spatial overlay analysis using a geographic information system (GIS). Many factors were considered in the siting process; including geology, water supplies resources, urban centers, sensitive sites, and wells. AHP (analytic hierarchy process) method was used in weighting the criteria used. The result showed that there are six sites most suitable covering an area about (113) km2.
1. Introduction
Human activities (industrial, domestic, commercial, and construction) and animals generate solid waste in different forms. Some of the waste fall out of the commercial use i.e., cannot be utilized. Parts of this waste are considered hazardous for the environment and natural resources. With continuous inhabitants’ growth and increase of standard of living, solid waste is increasing in tremendous amounts. This fact enforced a major problem facing the world. This problem is more serious in third world countries where 80% of the inhabitants live [1,2,3,4].
In developing countries, the ever increasing human inhabitants and the associated anthropogenic activities have accelerated the phenomenon of urbanization. The process of a site selection for landfill is considered to be one of the most difficult tasks related to solid waste management systems because it is subject to government regulation, government and municipal funding, increasing inhabitants’ densities, growing environmental awareness, public health concerns, reduced land availability, and opposition to the establishment of landfill sites [5,6,7].
A landfill is a large area of land or an excavated site that is specifically designed and built to receive wastes. Landfills and related municipal solid waste (MSW) facilities are becoming difficult to locate in urban areas because of the shortage of large tracts of land and community opposition [8,9].
The “not in my backyard” (NIMBY), “build absolutely nothing anywhere near anyone”, and “not on planet Earth” syndromes have become popular, creating tremendous pressure on decision makers in selecting sites for MSW facilities. All these make site selection of landfill very challenging, especially in urban areas like the Kufa city [10,11,12].
Iraq, an Arab country of a population exceeding 32 million inhabitants, is experiencing rapid economic growth. Solid waste management issues are worsening in Iraq due to various factors. These are: growing inhabitants, increasing the standard of living and the instability generated by sectarian conflicts. Recurrent wars in Iraq have, also, created a lasting instability, and as a result the country has become, isolated and failed to keep pace with the continuous scientific progress of more developed countries [13].
In this paper, 11 inputs digital map layers (including urban centers, nature reserves, electrical power plants, well sites, power lines, railways, roads, slope, main rivers, historical sites, religious sites) were prepared and multi criteria analyses were implemented with a geographical information system to find the best suitable landfill site.
2. Materials and Methods
2.1. Study Area
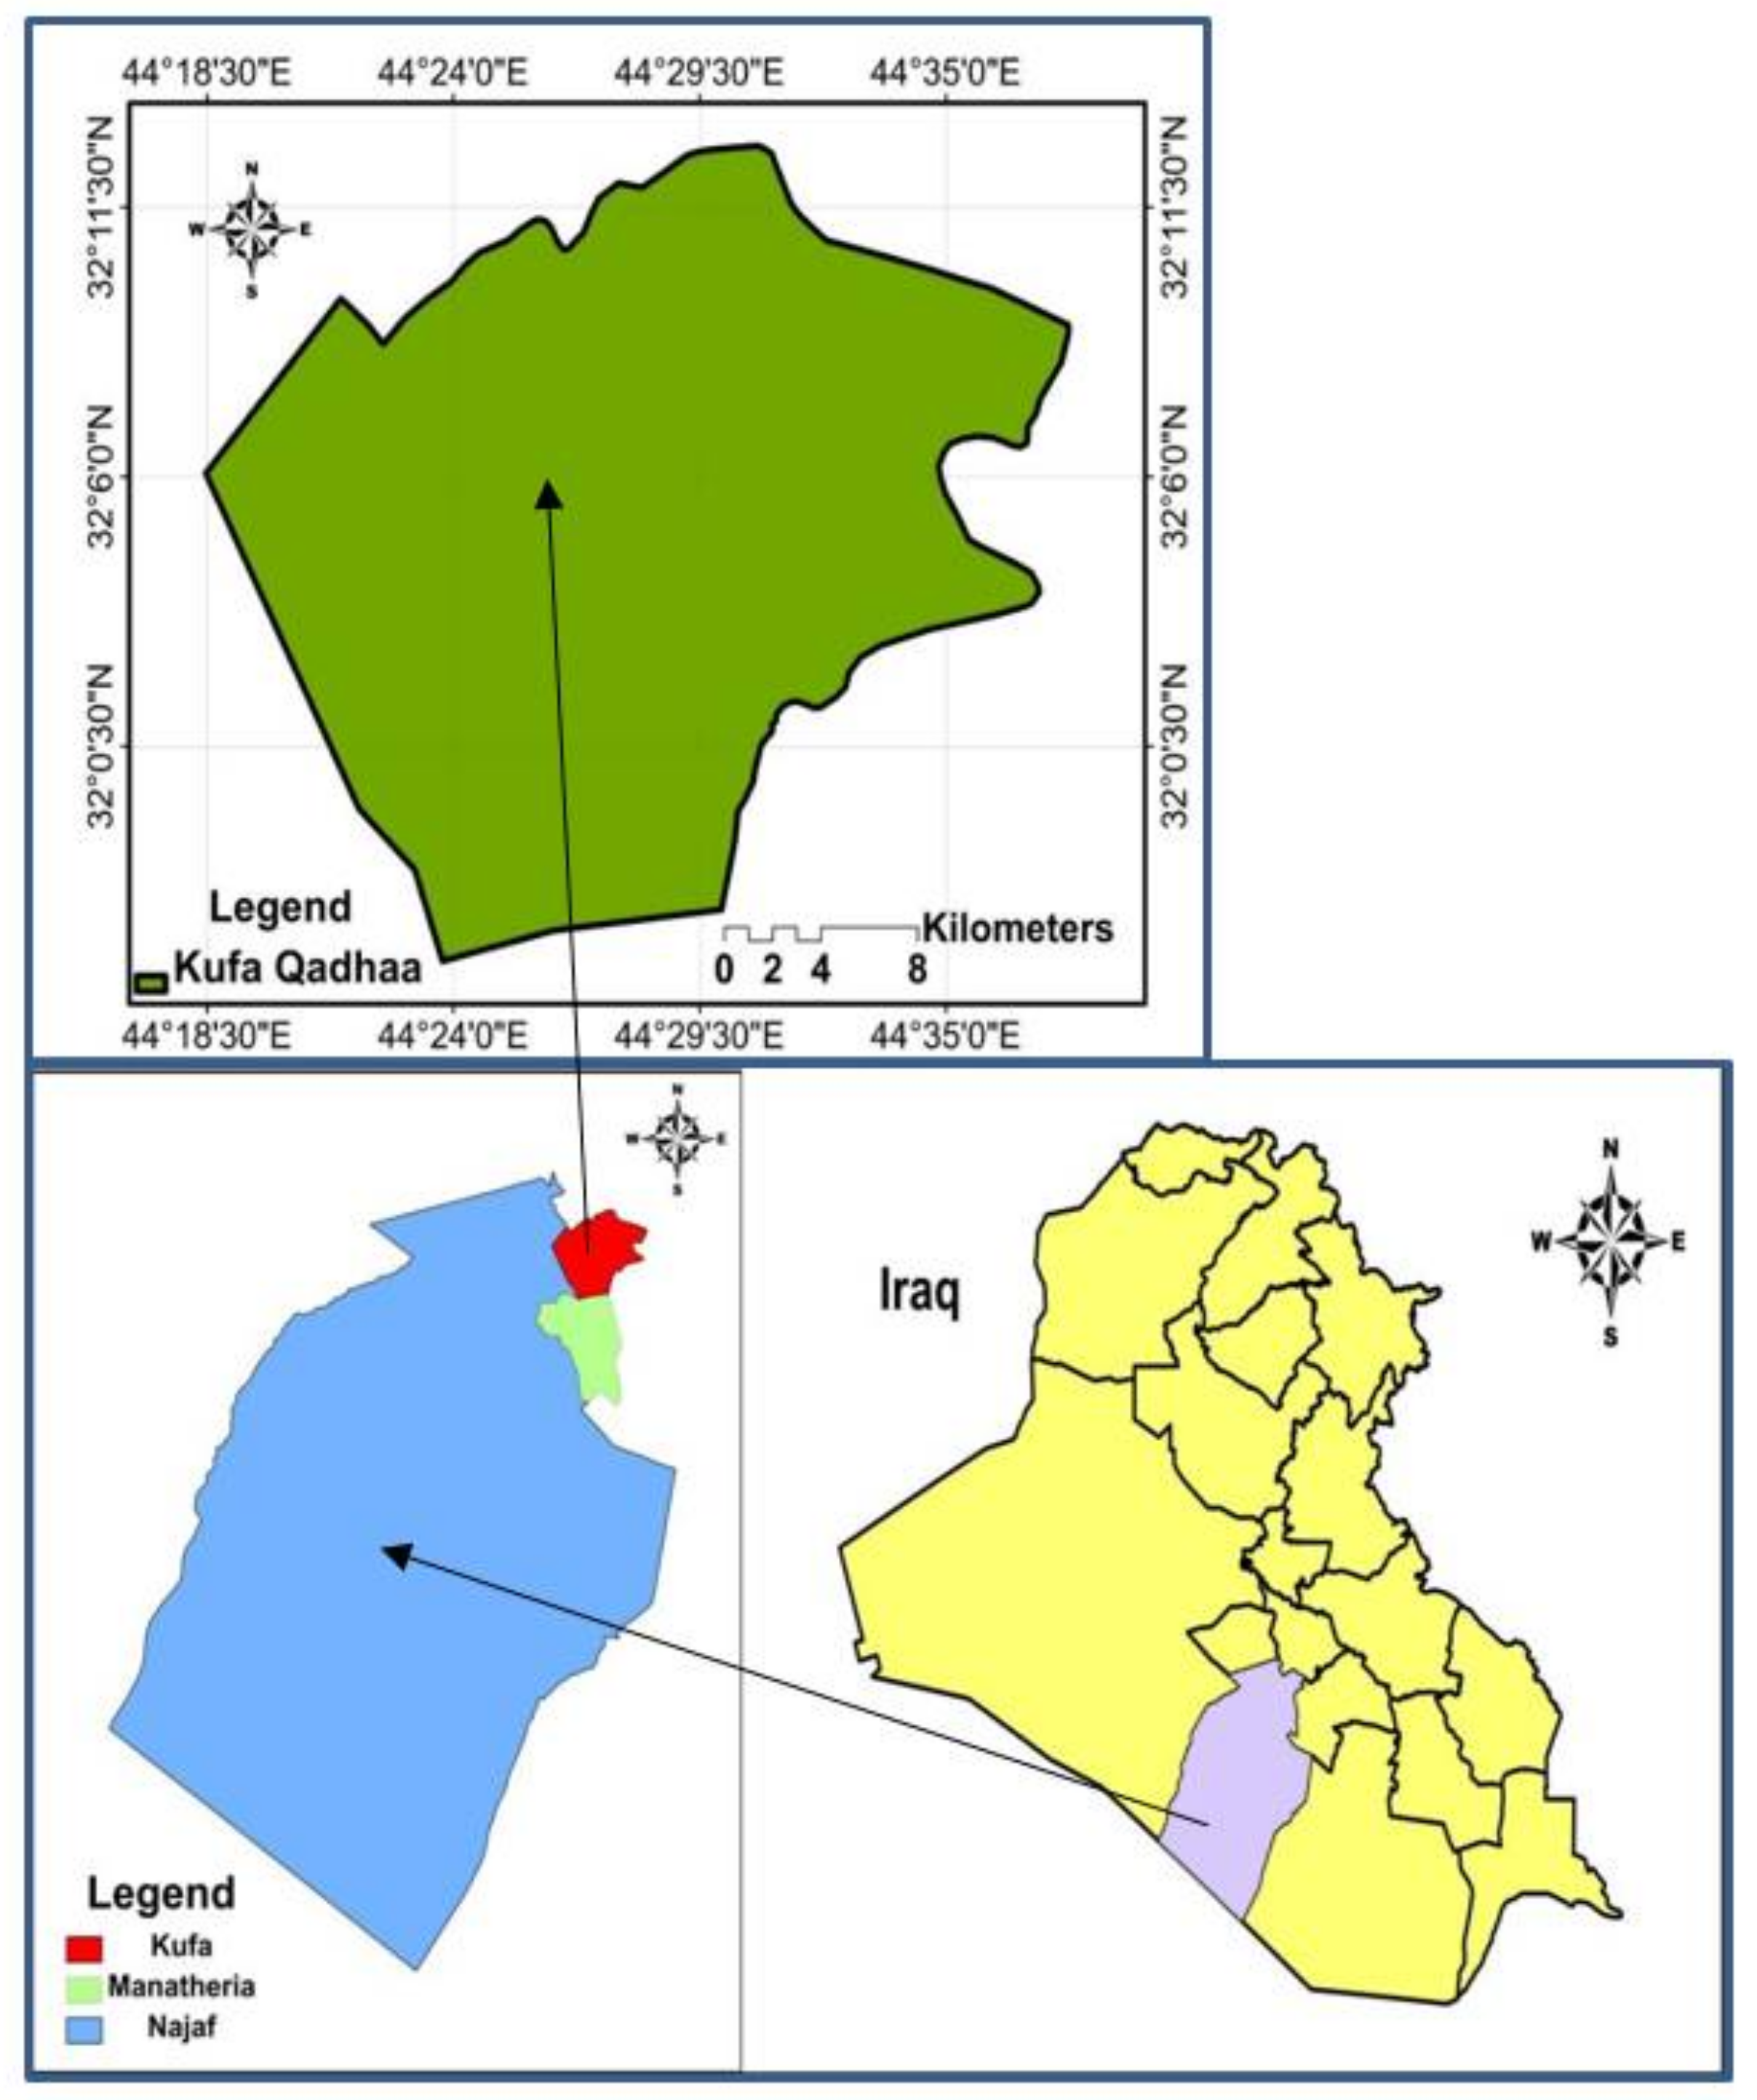
Al-Kufa city in Iraq is located to the north east of Najaf Governorate, about 170 km south of Baghdad (capital of Iraq) (Figure 1). Al-Kufa is one of the most important religious and historical cities in Arab and Islamic history. Study area include three districts; Al-kufa city, Al-Abbasia city, and Al-Huriya city. It is located along the banks of the Euphrates River with a total area of 550 km2 and a inhabitants of about 372,760 (2017). The inhabitants’ growth rate is 2.5% [14].
2.2. Methodology
The method starts with defining and identifying the structure to the problem with related parts as environmental agency and municipality office, then estimating the amount of municipal solid wastes generated during the period (2017–2032). Criteria selection process is one of the most important steps that depend on the availability of data and nature of the study area from political, geological, and environmental perspectives. All the data required in this research were taken from the governmental offices concerned such as Environmental Agency, Municipality office, Kufa University, Geological office, and Inhabitants prediction office [14,15,16]. At this stage, several criteria were considered. However, due to unavailability of data; some were rejected; thus the criteria were selected solely based upon the availability of data. Database was developed for each of the criteria used which are urban centers, nature reserves, electrical power plants, well sites, power lines, railways, roads, slope, main rivers, historical sites, and religious sites and was followed by standardization of each criterion with regards to the suitability for locating a landfill site. After selecting the criteria, all were weighted using AHP process (analytic hierarchy process).
In the study prepared by [13], for Najaf city which about 100 km from study area, same approached used (GIS-MCDA) and our study used same framework. In this study 11 criteria was used and 15 criteria adopted by [13]. On other hand, in this paper there is more description for waste generated amount and volume and inhabitants estimated for period study. In the AHP, the selection criteria can be identified and weighted, and the collected data can also be analyzed, accelerating the process of decision making. The hierarchy was deconstructed into a pair of a comparison matrix. This pairwise comparison was used to determine the relative importance of each alternative in terms of each criterion to be identified according to its importance in the site selection process. Finally, weighted overlay technique by GIS was used to generate the suitability map and show the potential sites for landfilling.
2.3. Integration of Multi-Criteria Decision Analysis (MCDA) with GIS
In this paper, GIS9.3 software and AHP method (it is one of the most famous MCDA method) were used to perform the process of landfill site selection. There were many process steps that were used in GIS in order to get on the final required suitability index map in this study. Decision rules for analysis on the landfill site selection data in AHP were established using GIS. ArcGIS 9.3 software was used for imaging and analysis of the spatial data. Additionally, several GIS analyses such as buffer zoning, distances, reclassifying, and overlay analysis were used. In order to evaluate the site selection criterion, AHP was used to measure the relative importance weights for the evaluation criteria. MCDA divides the decision problems into smaller understandable parts, analyzed each part separately, and then integrated the parts in a logical manner [17].
2.4. Inhabitants Estimation and Municipal Solid Waste Volume for Study Area during Period (2017–2032)
Inhabitants was calculated based on estimates of inhabitants size of the Najaf Governorate, for the period (2017–2035) that was obtained from the department of Statistics, Najaf [14].
P2032 = P2017 (1 + r)n
n = number of years, P = inhabitants, r = inhabitants increasing factor.
By using the above growth rate equation Al-Kufa in Najaf Governorate, population was calculated for each of the years from 2017 to 2032. For estimating the volume of municipal solid waste, we used the equation
where MSWV is mass of generated municipal solid waste (kg). Qr is the average generation rate of solid waste (kg/capita. day). Inha is the average population of Kufa qhadaa.
MSWV = (Qr (kg/capita. day) × Inha (capita) × 365 (day/year))/1000(kg/tonne))
The inhabitants and the amount of municipal solid waste for period (2017–2032) are shown in Table 1.
2.5. Criteria Analysis
2.5.1. Criteria Weights
A weight can be defined as a value assigned to an evaluation criterion which indicates its importance relative to other criteria under consideration. There are four different techniques when assigning the weights: ranking, rating, pairwise comparison, and trade of analysis method [18]. Calculating the weight for the criteria using the method of pairwise comparison method, the weights of criteria were computed using comparison matrix. The comparison matrix indicates the relative importance to the criterion in the columns compared with the criterion in the rows. For each comparison, it was decided which of the two criteria is most important, and then a score was assigned to show how much more it is.
There are different ways for factor weighing. The method that is used in this work is the pair-wise comparison which was proposed by [19] as analytic hierarchy process in the decision making process concept. Landfill site selection problem is composed of a hierarchical structure with constraint and factor criteria.
Constraint criteria are consisted of fault, sensitive habitats, and airport. Factor criteria are consisted of slope, soil permeability, surface water, groundwater, land use, road network, and residential areas. In addition, surface water, groundwater, and residential areas criteria were also considered as constraint.
Criteria (factors) are compared reciprocally in each level in pair-wise comparison and the numerical priority is allocated according to a Saaty standardized table.
After extracting matrix relative importance and criteria weights, pair-wise comparison consistency should be identified [19]. The process by consistency index known as consistency ratio (CR). Consistency ratio shows the probability of matrix ratio random producing. The consistency ratio should be lower than 0.1. Otherwise, there is a need to reevaluate the relative importance. In the case that the consistency ratio is lower than threshold limit, accounted weights are affected on the criteria (factors) map layers. Final weights, consistency ratio, and consistency index shown in Table 2.
2.5.2. Digital Environmental Maps
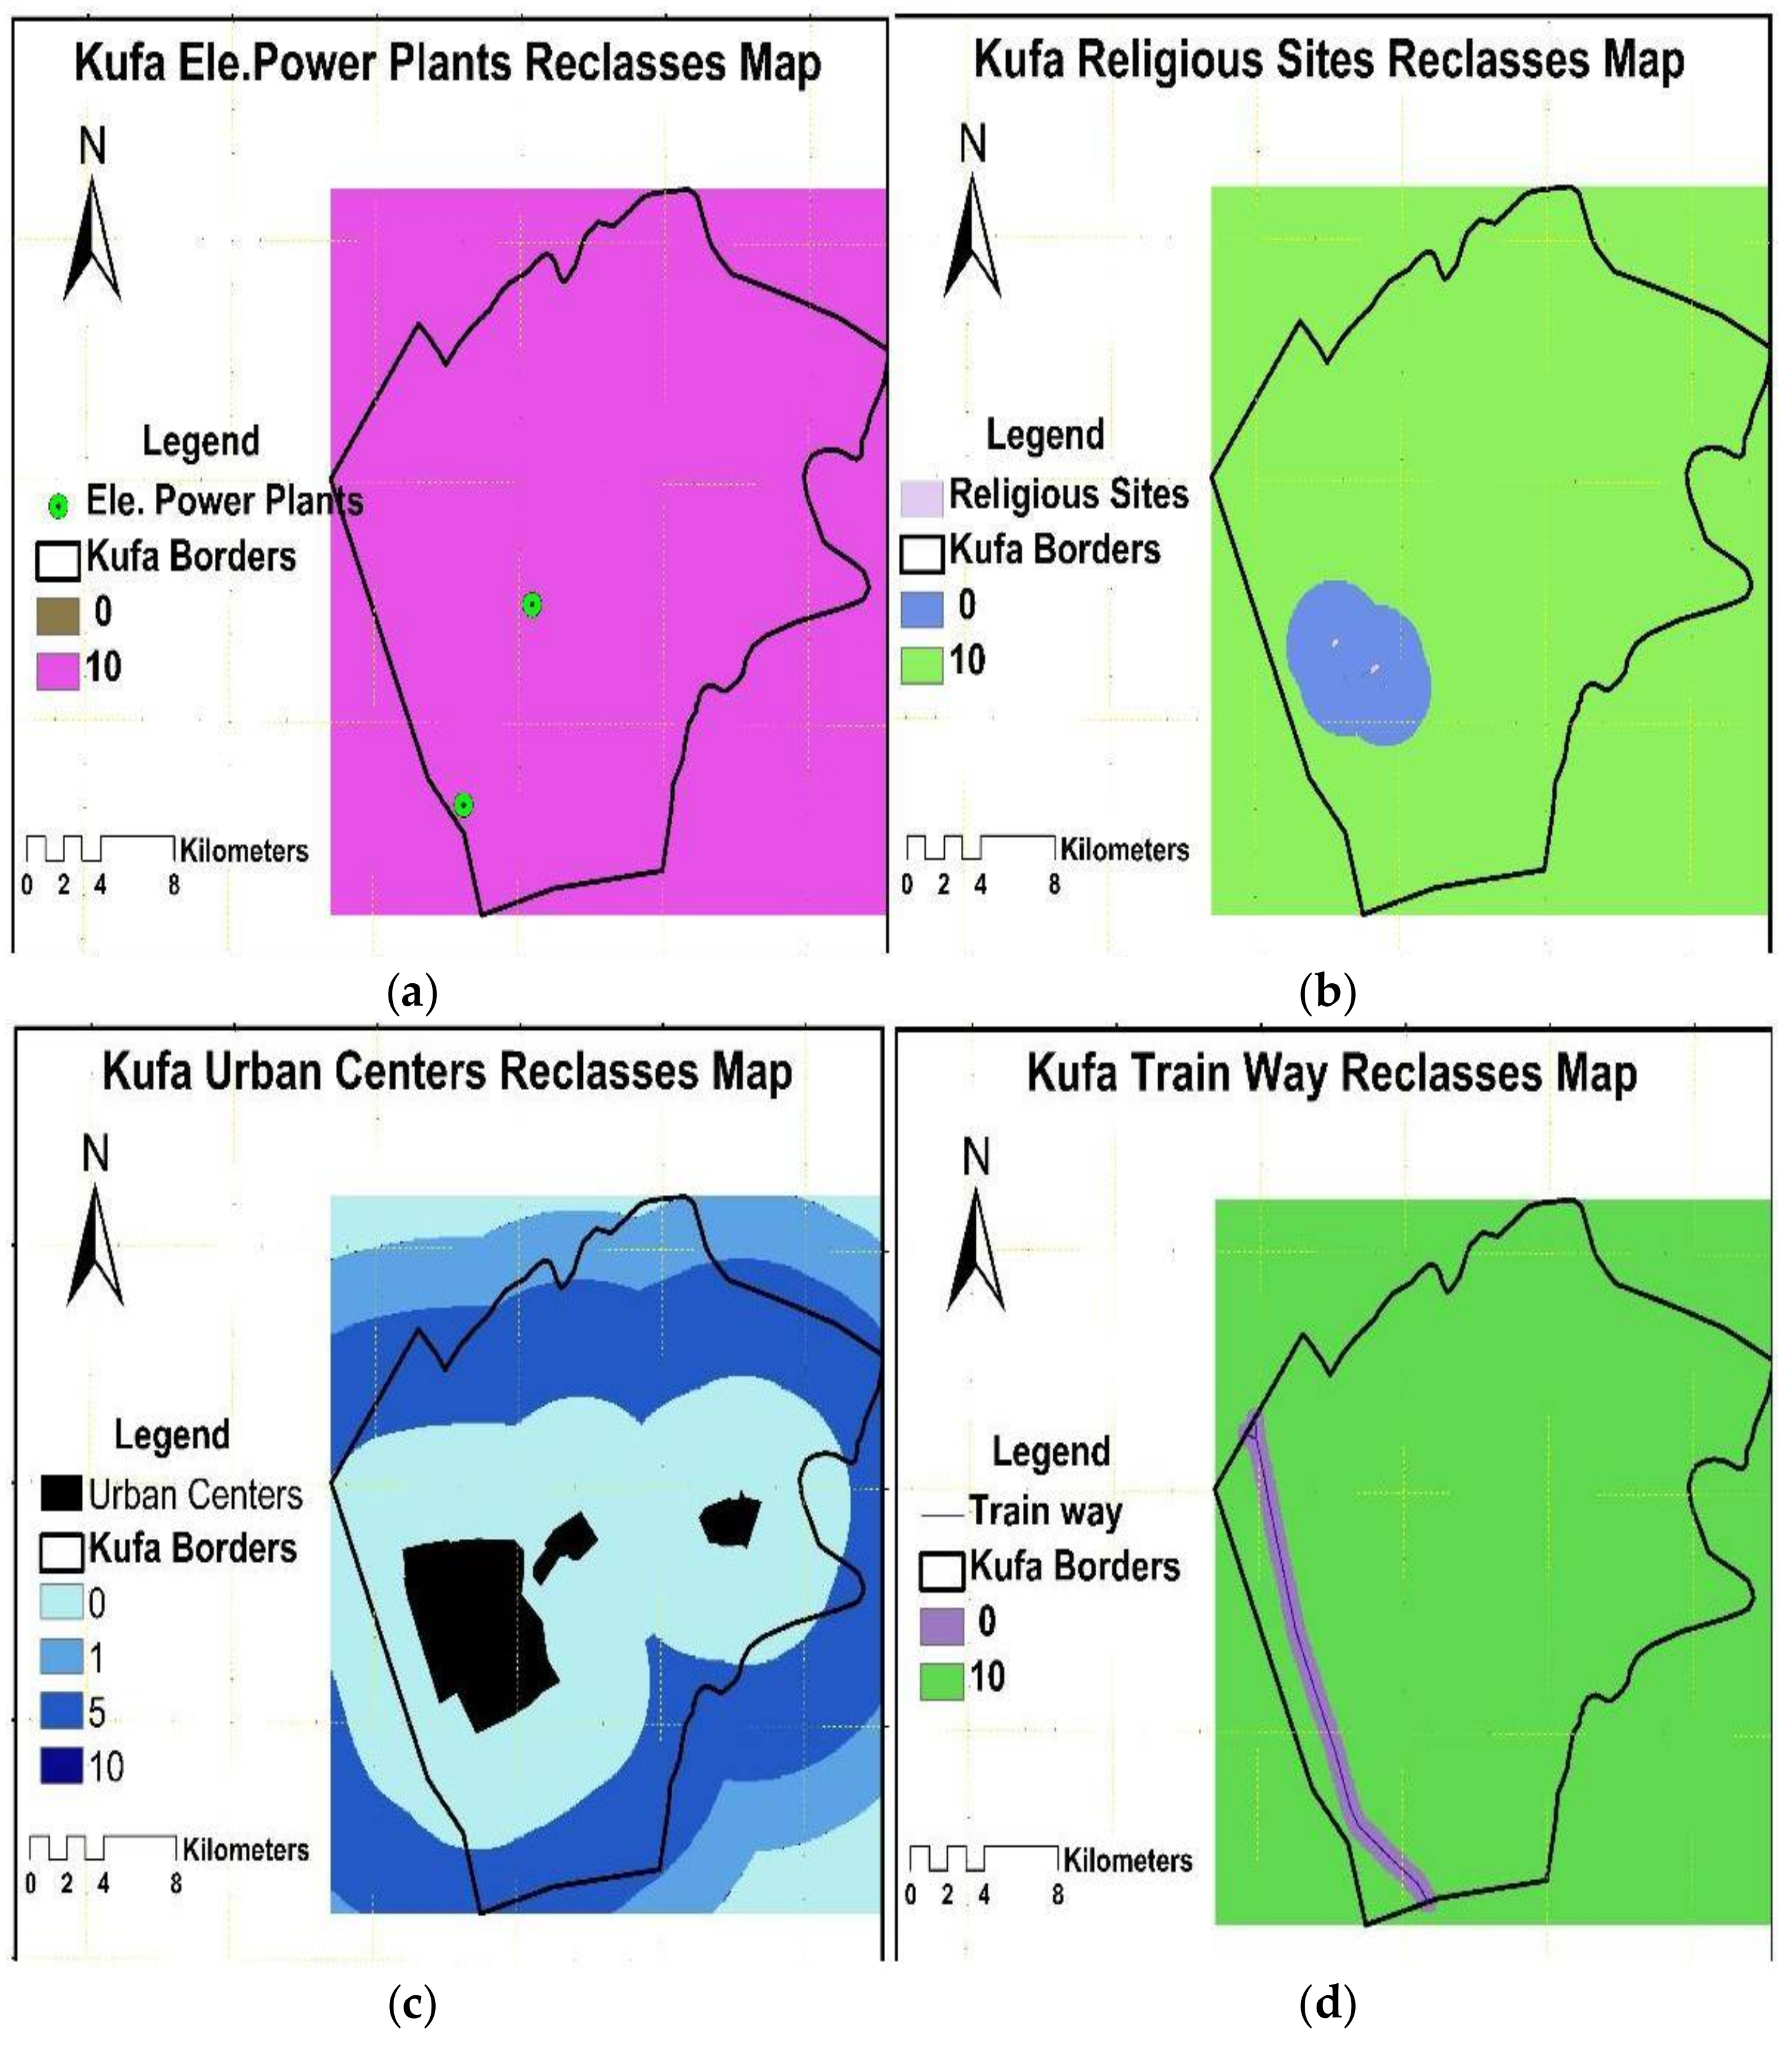
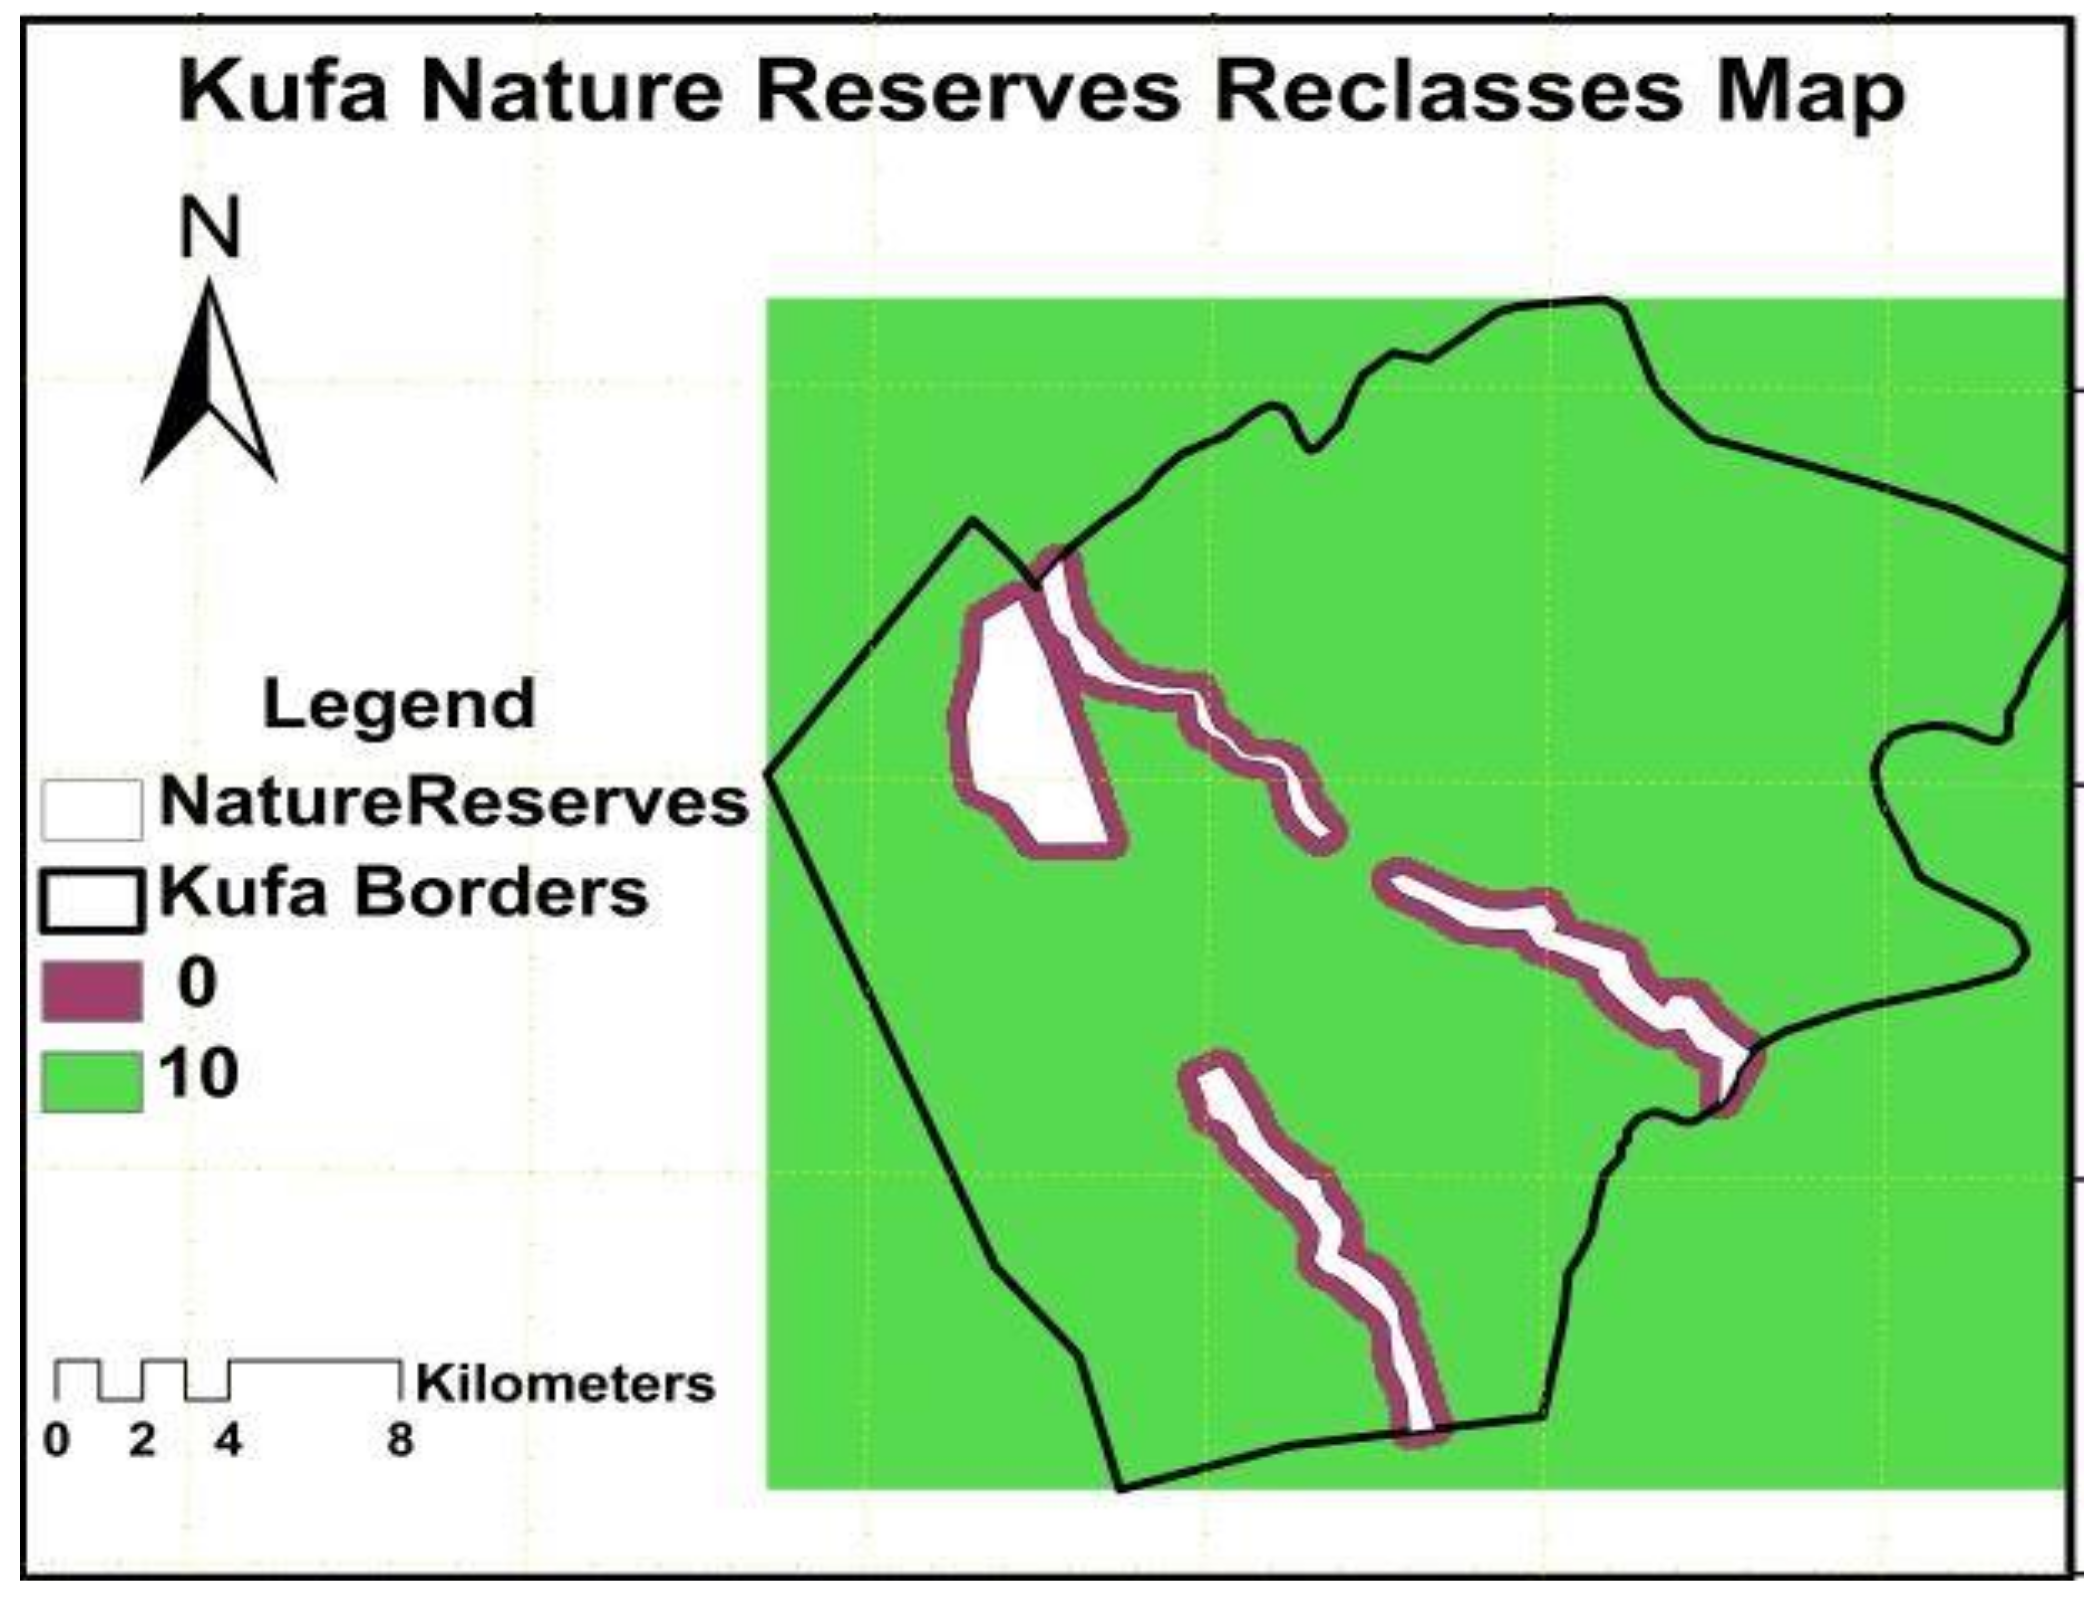
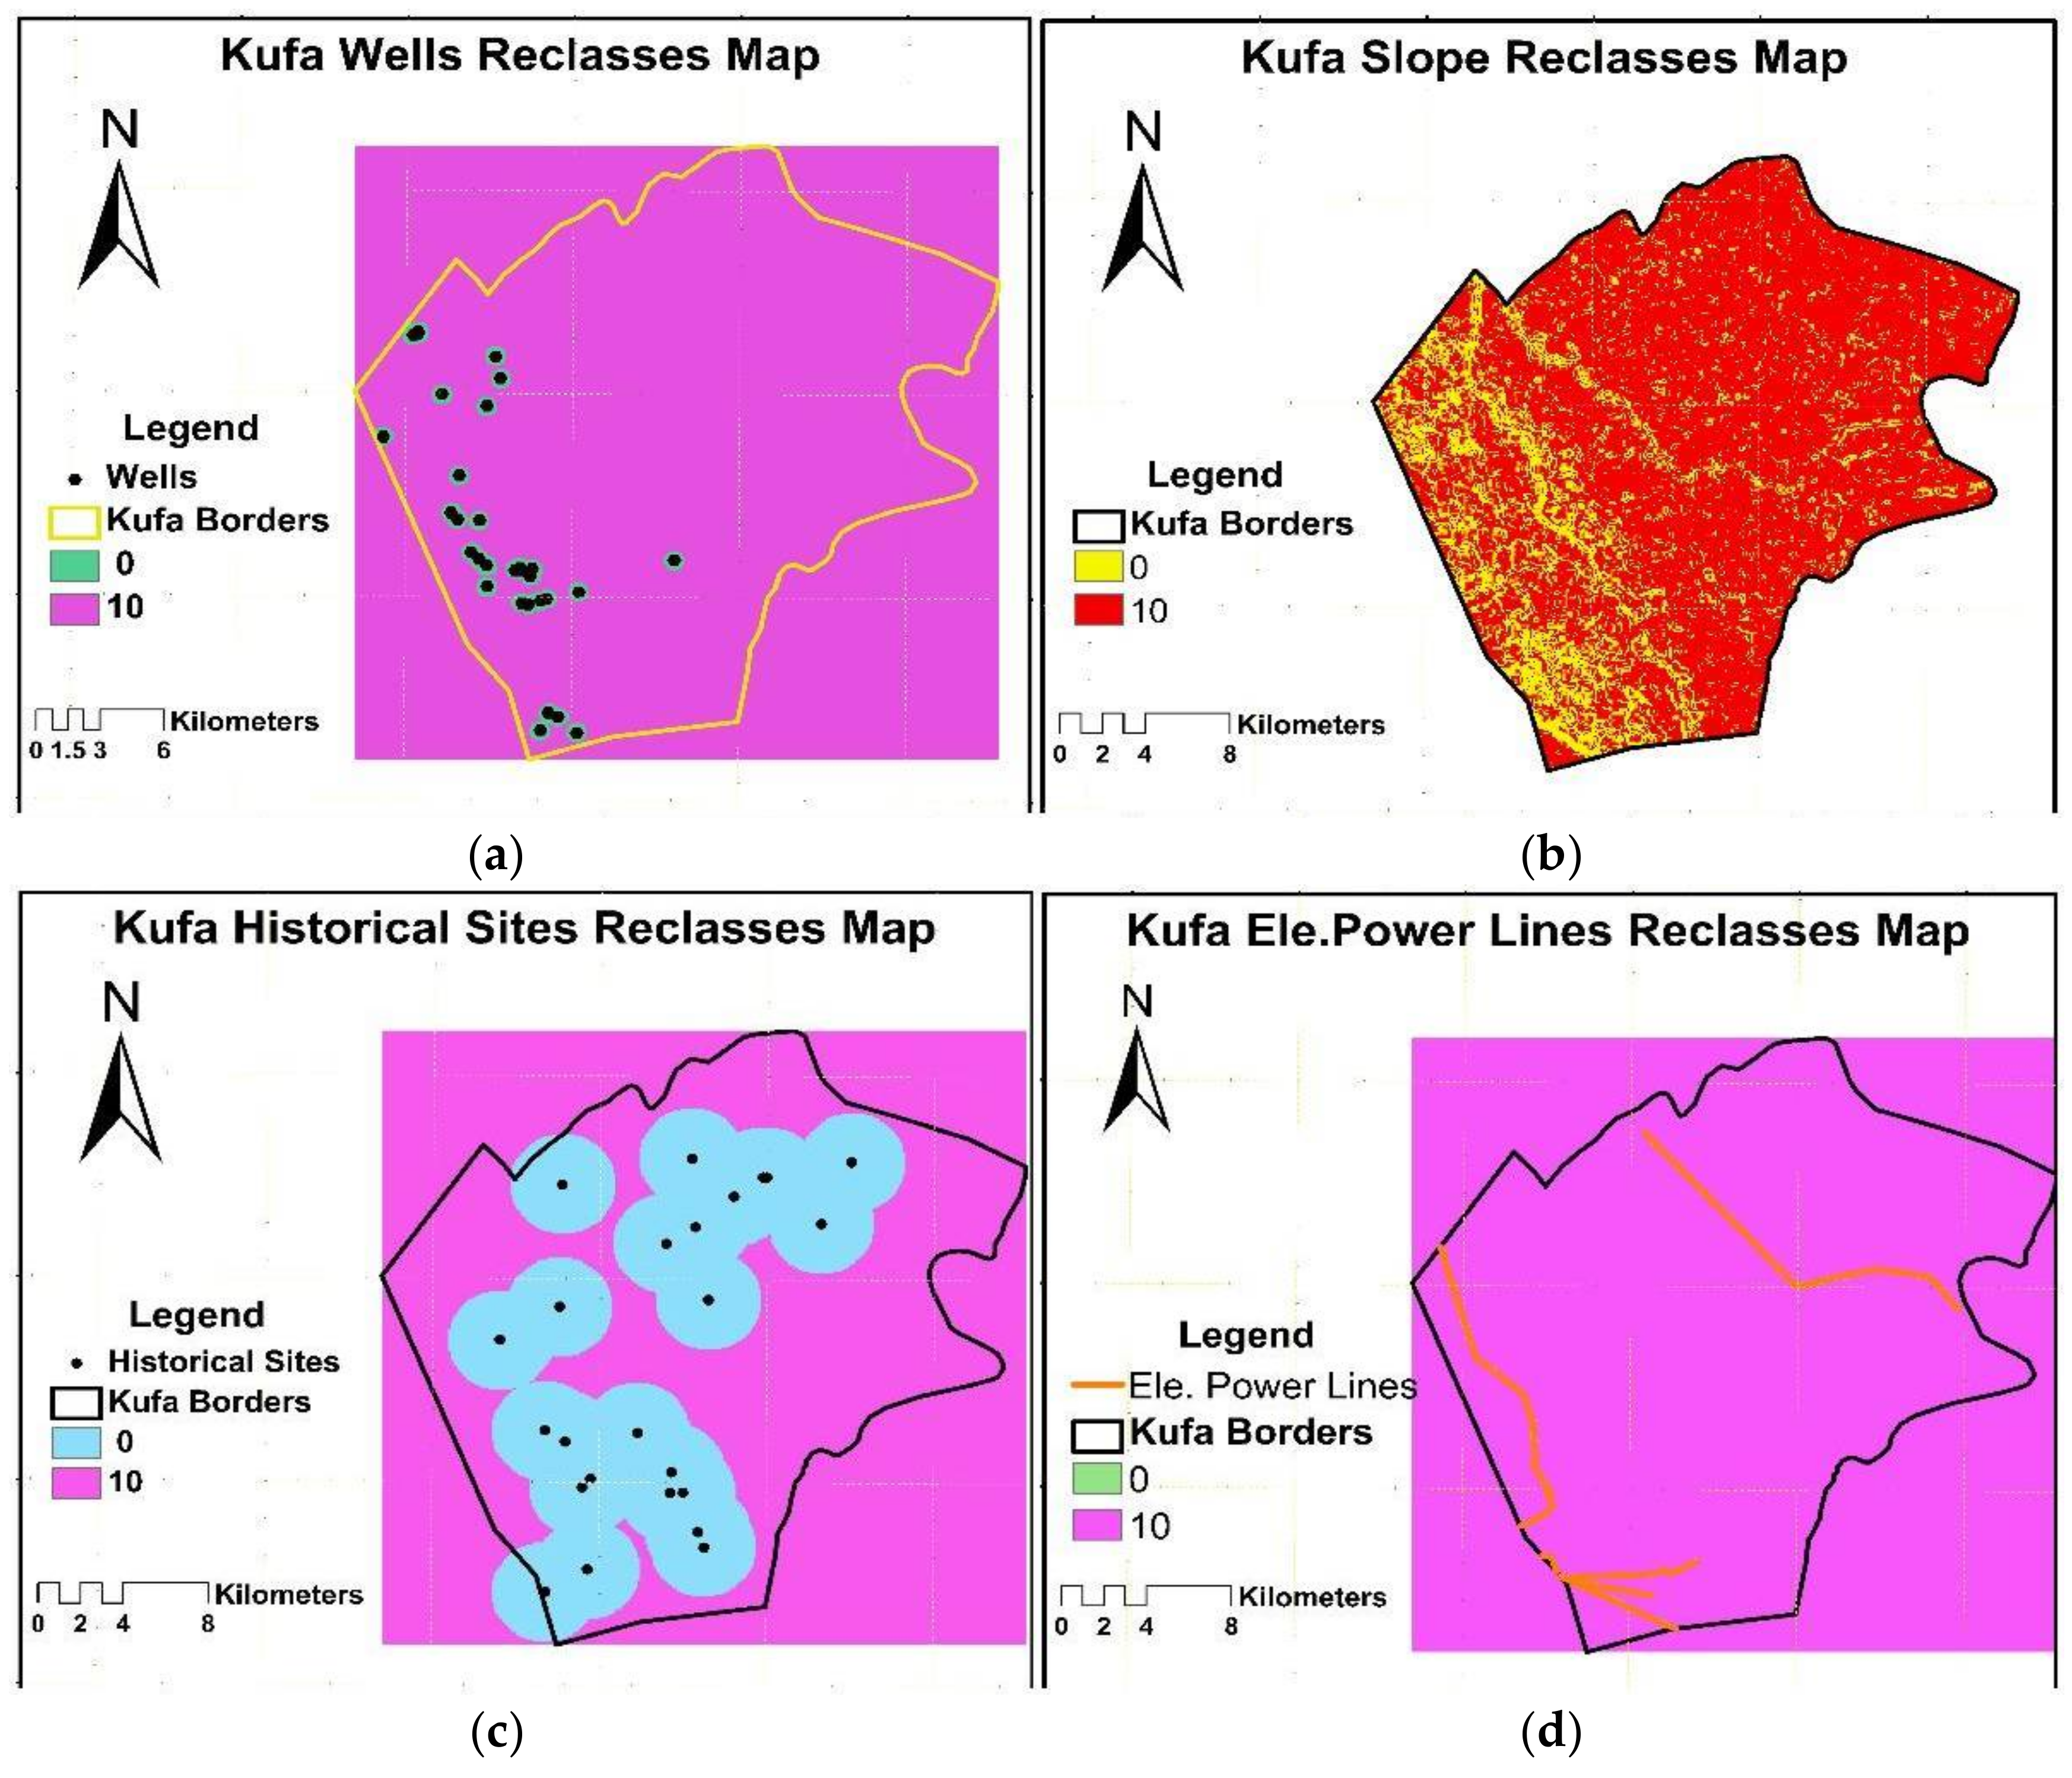
Restricted sites mean areas which do not allow for a landfill site to be situated within them due to potential risk to the environment, human health or excessive cost and it took 0 rank in this study. Buffer zones, or spatial constraints, were used around important sites or specific geographic features in each criterion in the GIS and environment using the special extension tool ‘buffer’. In this study, based on the opinion of experts and literature reviews in this field, each criterion was classified into classes (variables), and each class was given a rank value according to importance of criteria and study area. This classes may be change from study to anther according to nature of area and it relationship with criteria as shown in Table 3 and Figure 2, Figure 3, Figure 4 and Figure 5.
2.5.3. Identification of Optimum Site for Landfill Localization
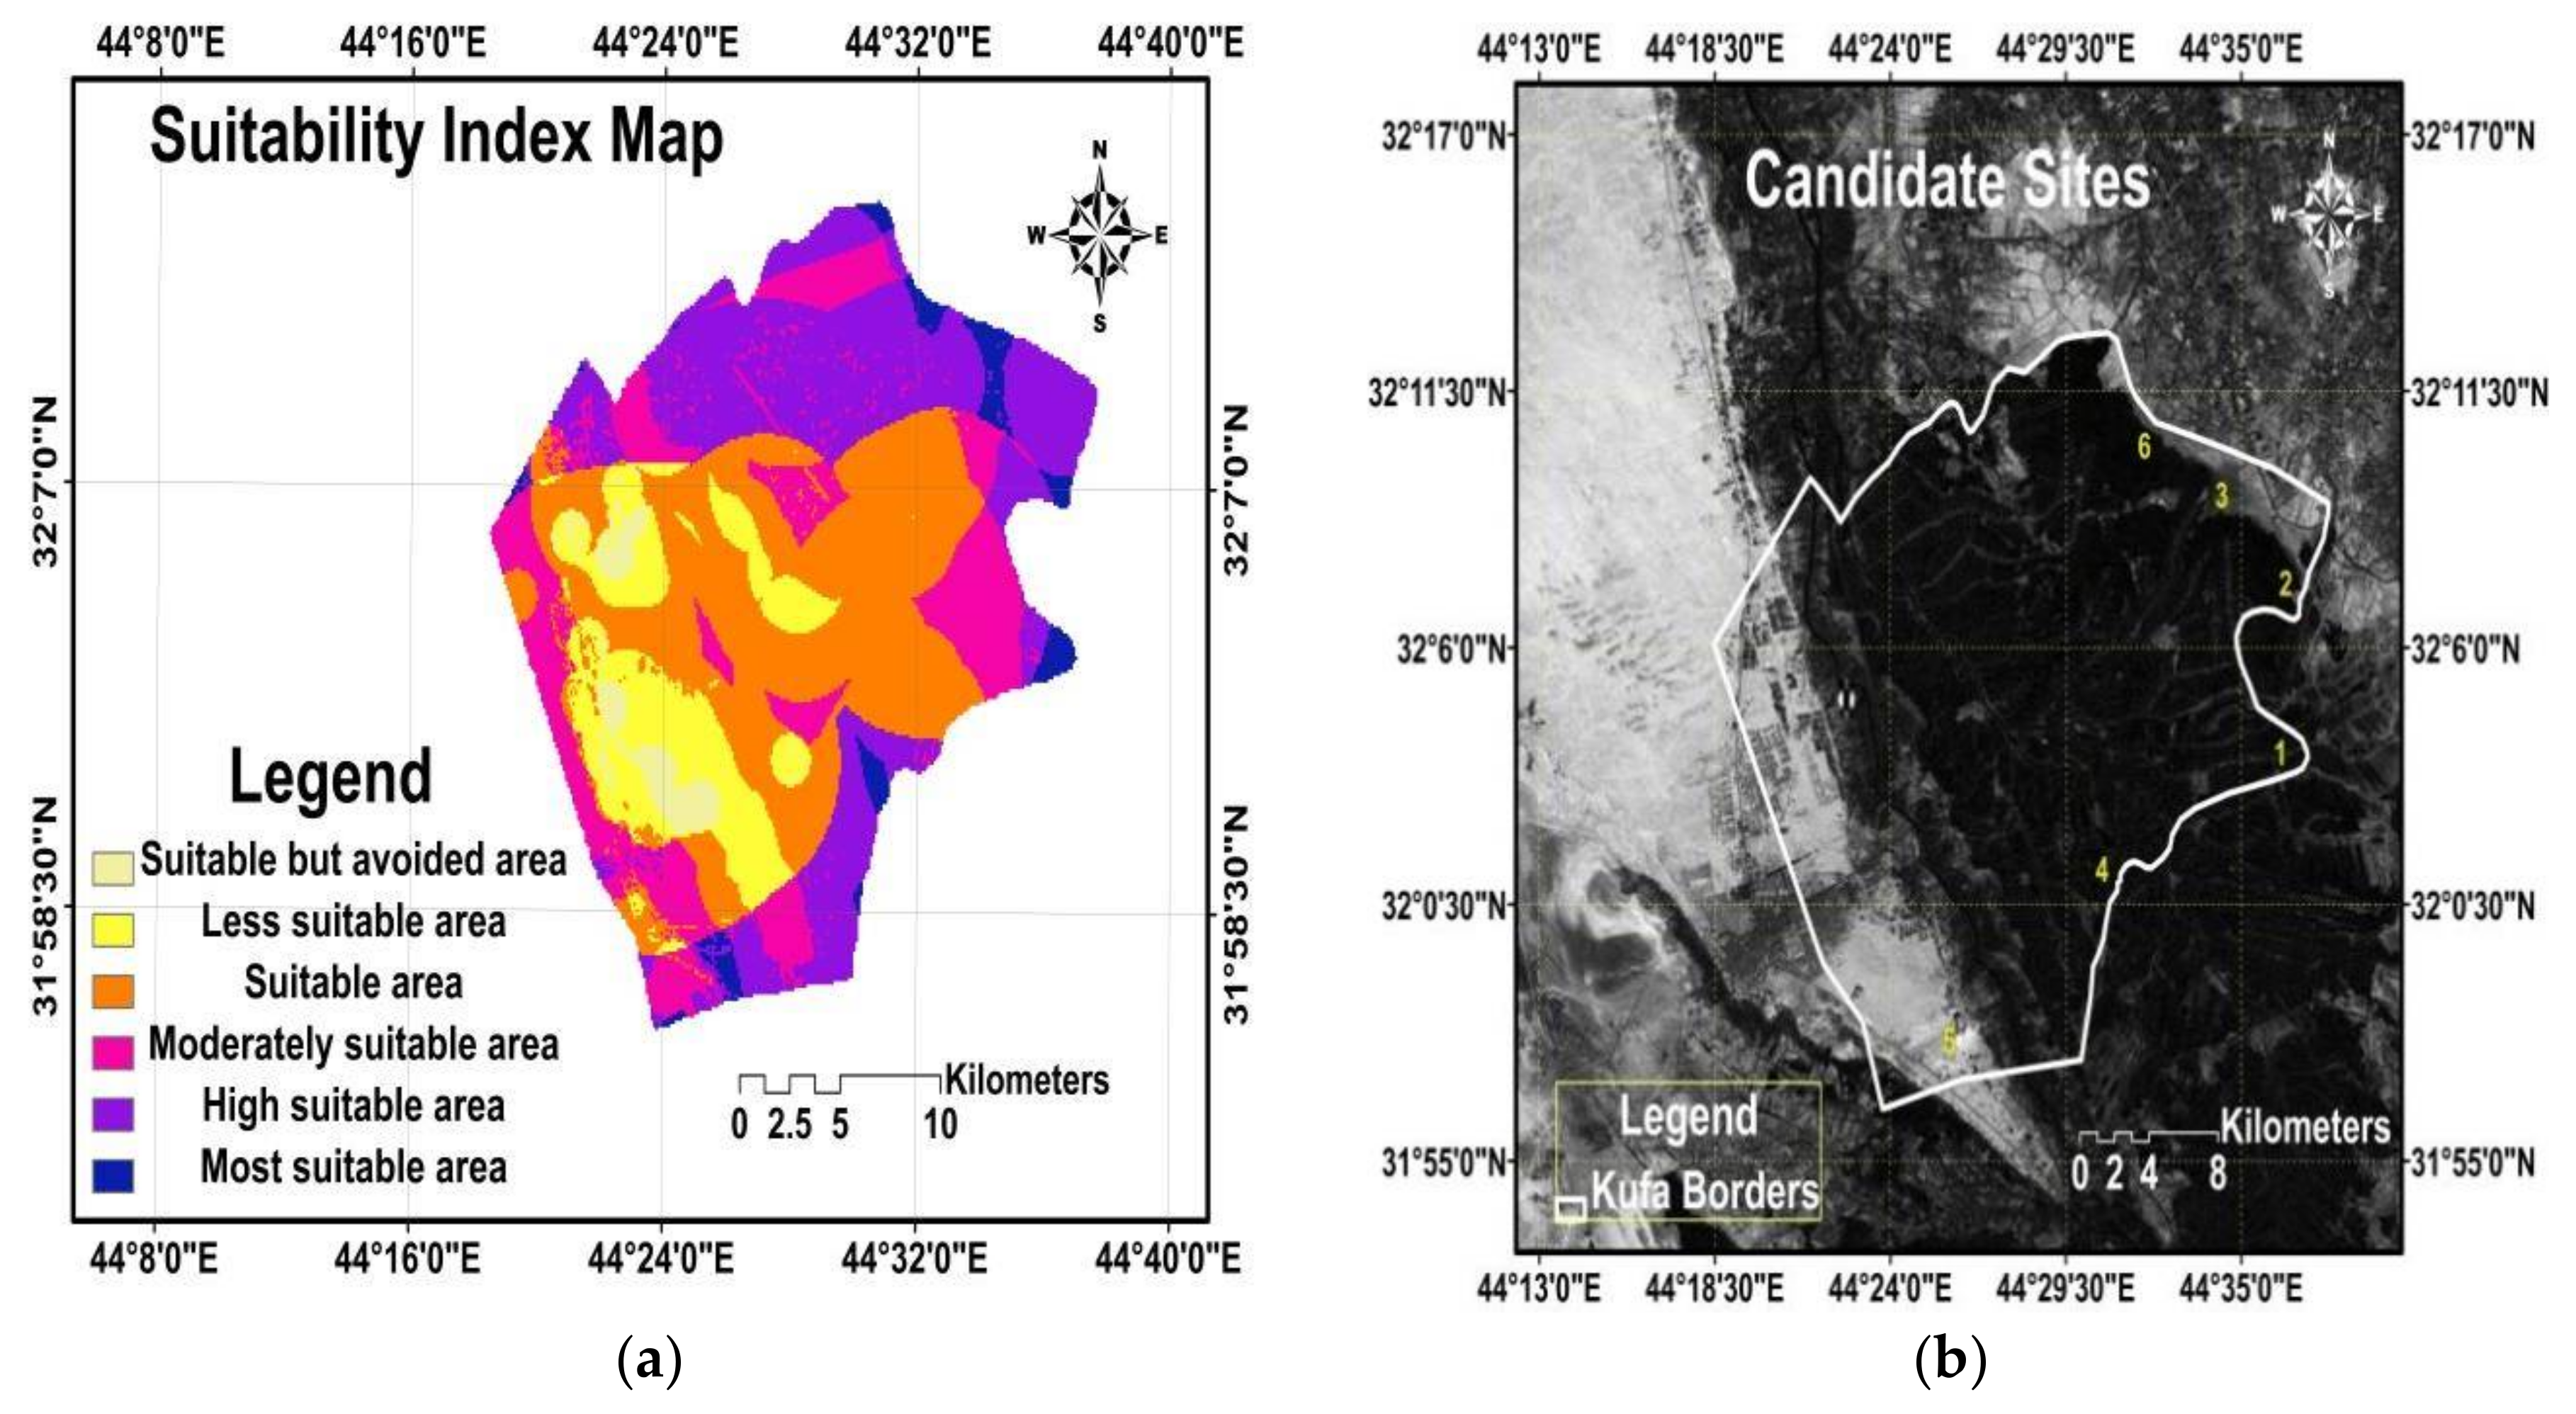
The various maps’ layers obtained by GIS and weighted by AHP then combined to generate a single map, showing areas of different suitability levels for siting a landfill within the study area. In this research, the weighted linear combination (WLC) method was used to combine the criteria and compute the suitability index [25]. The WLC method was chosen over the Boolean intersection (BI) and the ordered weighting average (OWA) because it is simpler and the most widely applied method [16,26]. Using the WLC method, the suitability index was calculated by summing the product of each of the weight to each criterion with its standard score according to Equation (3). The potential landfill site for study area shown in Figure 6
where wi is the weight of each criterion, and xi is the standardized score (0–10) of each criterion.
Suitability Index = ΣWi * Xi
The SAW method is quite widely used in real world due to its easiness. It can be implemented both in raster and vector GIS environment and operationalized using any GIS system having overlay capabilities or implemented in a spreadsheet environment [27]. However, the ignorance of the definition of the units of measurement and little theoretical foundation are the disadvantages of this method.
3. Results and Discussion
The approach used here is easy to understand, and it can illustrate which areas are better or less suitable for landfill site selection or any site selection processes facility. Factor weights are given in Table 4 after standardizing all factors. The sum of all factors is 1. Corresponding maps with all factors were reclassified from grade 0 to 10 by spatial information technologies. The score was assigned based on the grade of each area. Then, the final suitability map (Figure 6) was produced by aggregation procedure based on weight. The average daily solid waste production per capita in Kufa for the year 2005 was reported about 0.42 kg/capita/day [28] and the average density in a landfill after compaction is 560 kg/m3 [8]. For the study area, the estimated solid waste quantity is 1093 tonnes for a 16-year operation period as shown in Table 1, assuming a 2.5% population increase per year and a constant average waste production per capita per year. The required area for landfill solid wastes generated during the period (2017–2032) are shown in Table 4 and Table 5. In Table 4 the accumulated waste weights for study area was calculated based on Equations (1) and (2), then the accumulated weight was converted to volume based in [29]. Table 5 showed the required area, cover material required, and volume for land the waste calculated in Table 4.
The final suitability results were divided into six discrete categories: most suitable landfill areas, high suitable landfill areas, moderately suitable, suitable landfill areas, less suitable landfill area, and suitable but avoided landfill area as shown in Figure 6. In study [13], the final suitability map divided the study area to five classes and two candidates sites were selected with total area about 18 km2.
It should be mentioned, however, that the 11 criteria were identified in Table 3 used for this research that are not fixed factors since it can vary from area to area depending upon the climate, geology, demography, land use, and other factors. Therefore, these criteria can be changed or canceled accordingly in the analysis process. Using the 11 information layers of the studied area, the most suitable areas were recognized. The area with class of the ‘most suitable area’ covers about 113 km2 (20% from total study area) distributed in six sites in south and north east for Al-Kufa city. Urban center was the most important criteria in landfill site selection for this study. The total amount of solid waste generated during (2017–2032) is expected to be about 1000 tonnes about (2000 m3) so, the potential sites’ volumes are suitable for this period.
4. Conclusions
The landfill site selection process in most Iraqi cities is achieved by using the traditional method which is not-specific and mostly random, depending on some initial criteria in a static form and without attention to dynamic analysis, and by focusing on the aspect of solid waste as one of the most important aspects [30]. The presented approach is easy to understand, it can illustrate which areas are better or less suitable for landfill site selection, and it can be used to select landfill sites in the shortest possible time and least costs.
The following conclusions are drawn on the basis of the results obtained from the present study:
- Al-Kufa municipality office should apply the ISWM tool, to look at solid wastes as an economic resource. Such practices may add economic benefits to landfill construction, as well as keeping the site to work for a longer period of time.
- The total amount of solid waste generated during (2017–2032) is about (1000) tonne (2000 m3).
- The area with class of most suitable area is about 28 km2 (5% from total study area) distributed in six sites in south and north east for Al-Kufa city.
- The most important criteria is urban center; it took about 32% from all criteria weights.
For future studies we recommend:
- Including a construction material availability layer into the proposed model.
- Adopting an agricultural areas layer to be excluded because of the importance of this criteria.
- Implementing sanitary landfill sites (architectural, structural, mechanical, etc.) to be used in the selected sites.
Acknowledgments
The authors would like to thank Al-Mustansiriyah University, Baghdad, Iraq (www.uomustansiriyah.edu.iq) Baghdad-Iraq where the experiments were carried out at the labs of the university and Lulea University of Technology for its support in the present work.
Author Contributions
M. Al-Anbari suggested the research topic, methods to be used and supervised the whole research work. M. Thameer carried out the field and lab work and wrote major parts of the paper. N. Al-Ansari shared the authors in setting the methodology, explaining the results and writing the paper.
Conflicts of Interest
The authors declare no conflict of interest.
References
- Alanbari, M.A.; Al-Ansari, N.; Jasim, H.K.; Knutsson, S. Al-Mseiab Qadaa Landfill Site Selection Using GIS and Multicriteria Decision Analysis. Engineering 2014, 6, 526–549. [Google Scholar] [CrossRef]
- Goulart Coelho, L.M.; Lange, L.C. Applying life cycle assessment to support environmentally sustainable waste management strategies in Brazil. Resour. Conserv. Recycl. 2018, 128, 438–450. [Google Scholar] [CrossRef]
- Ferronato, N.; Torretta, V.; Ragazzi, M.; Rada, E.C. Waste mismanagement in developing countries: A case study of environmental contamination. UPB Sci. Bull. Ser. D 2017, 79, 185–196. [Google Scholar]
- Kolekar, K.A.; Hazra, T.; Chakrabarty, S.N. Prediction of municipal solid waste generation for developing countries in temporal scale: A fuzzy inference system approach. Glob. Nest J. 2017, 19, 511–520. [Google Scholar]
- Lin, H.; Kao, J. Enhanced Spatial Model for Landfill Siting Analysis. J. Environ. Eng. 1999, 125, 845–851. [Google Scholar] [CrossRef]
- Jamshidi-Zanjani, A.; Rezaei, M. Landfill site selection using combination of fuzzy logic and multi-attribute decision-making approach. Environ. Earth Sci. 2017, 76, 448. [Google Scholar] [CrossRef]
- Majumdar, A.; Hazra, T.; Dutta, A. Landfill Site Selection by AHP Based Multi-criteria Decision Making Tool: A Case Study in Kolkata, India. J. Inst. Eng. (India) Ser. A 2017, 98, 277–283. [Google Scholar] [CrossRef]
- Rafiee, R.; Nematolah, K.; Abdolrassoul, S.M.; Ali, A.D.; Afshin, D.; Syed, E.H. Siting Transfer Station for Municipal Solid Waste Using a Spatial Multi-Criteria Analysis. Environ. Eng. Geosci. 2011, 17, 143–154. [Google Scholar] [CrossRef]
- Oppio, A.; Corsi, S. Territorial vulnerability and local conflicts perspectives for waste disposals siting. A case study in Lombardy region (Italy). J. Clean. Prod. 2017, 141, 1528–1538. [Google Scholar] [CrossRef]
- Rafiee, R. Site Selection for Waste Transfer Station with Regard to Urban Growth Trend (Mashhad Case Study); University of Tehran: Tehran, Iran, 2007; p. 105. [Google Scholar]
- Phillips, J.A. Managing Americas Solid Waste; National Renewable Energy Laboratory Report NREL/SR-570-25035; A National Laboratory of the U.S. Department of Energy: Boulder, CO, USA, 1998.
- Richárd, S. Waste Management Facility Siting and Social Conflicts—The Case of Hungary. In Integrated Waste Management—Volume I; InTech: London, UK, 2011. [Google Scholar] [CrossRef]
- Chabuk, A.; Al-Ansari, N.; Hussain, H.M.; Knutsson, S.; Pusch, R. Landfill Site Selection Using Geographic Information System (GIS) and AHP: A Case Study Al-Hillah Qadhaa, Babylon, Iraq. Waste Manag. Res. 2016, 34, 427–437. [Google Scholar] [CrossRef] [PubMed]
- Directorate of Statistics Najaf Governorate. Indicators Base Al-Najaf Governorate; Directorate of Statistics Najaf Governorate: Najaf, Iraq, 2015.
- Water Resources of Najaf Governorate; Najaf Water Resources Directorate: Najaf, Iraq, 2015.
- Archeological Sites in Najaf; Najaf Archetecheral Planning Directorate, Najaf Governorate: Najaf, Iraq, 2015.
- Al-Ansari, N.A.; Pusch, R.; Knutsson, S. Suggested Landfill Sites for Hazardous Waste in Iraq. Nat. Sci. 2013, 5, 463–477. [Google Scholar] [CrossRef]
- Şener, B.; Süzen, M.L.; Doyuran, V. Landfill Site Selection by Using Geographic Information Systems. Environ. Geol. 2006, 49, 376–388. [Google Scholar] [CrossRef]
- Saaty, T.L. Decision making with the analytic hierarchy process. Int. J. Serv. Sci. 2008, 1, 83–98. [Google Scholar] [CrossRef]
- Allen, A.R. Attenuation: A Cost Effective Landfill Strategy for Developing Countries. In Proceedings of the 9th Congress of the International Association for Engineering Geology and the Environment, Durban, South Africa, 16–20 September 2002; pp. 136–147. [Google Scholar]
- Al-Anbari, M.A.; Thameer, M.Y. Landfill Site Selection by Using Pairwise Comparison, Rating, Ranking and Trade-off Methods for Criteria Weighting. Int. J. Civ. Eng. Technol. 2015, 6, 111–123. [Google Scholar]
- Sener, B. Landfill Site Selection by Using Geography Information System. MSc Dissertation, Middle East Technical University, Ankara, Turkey, 2004. [Google Scholar]
- Alanbari, M.A.; Thameer, M.Y.; Al-Ansari, N.; Knutsson, S. Landfill Site Selection in Al-Najaf Governorate, Iraq. J. Civ. Eng. Arch. 2016, 10, 651–660. [Google Scholar] [CrossRef]
- Demesouka, O.; Vavatsikos, A.; Anagnostopoulos, K. Suitability analysis for siting MSW landfills and its multicriteria spatial decision support system Method, implementation and case study. Waste Manag. 2013, 33, 1190–1206. [Google Scholar] [CrossRef] [PubMed]
- Yager, R.R. On ordered weighted averaging aggregation operators in multicriteria decision making. IEEE Trans. Syst. Man Cybern. 1988, 18, 183–190. [Google Scholar] [CrossRef]
- Malczewski, J. Propogation of errors in multicriteria location analysis: A case study. In Multiple Criteria Decision Making; Fandel, G., Gal, T., Eds.; Springer: Berlin, Germany, 1997; pp. 154–155. [Google Scholar]
- Kirkwood, C.W. Strategic Decision Making: Multi Objective Decision Analysis with Spreadsheets; Duxbury Press: Belmont, Australia, 1997. [Google Scholar]
- Al-Anbari, M.A.; Thameer, M.Y.; Al-Ansari, N.; Knutsson, S. Estimation of Domestic Solid Waste Amount and Its Required Landfill Volume in Najaf Governorate-Iraq for the Period 2015–2035. Engineering 2016, 8, 339–346. [Google Scholar] [CrossRef]
- Thomas, H.C. Solid Waste Technology & Management; John Wiley and Sons Publishing Ltd.: Chichester, UK, 2010; p. 1052. [Google Scholar]
- Alanbari, M.A.; Al-Ansari, N.; Jasim, H.K.; Knutsson, S. Modeling Landfill Suitability Based on GIS and Multicriteria Decision Analysis: Case Study in Al-Mahaweelqadaa. Nat. Sci. 2014, 6, 828–851. [Google Scholar] [CrossRef]
Figure 1.
Study area.

Figure 2.
(a) Electrical power plant reclasses layer; (b) religious sites reclasses layer; (c) urban center reclasses layer; (d) train reclasses layer.
Figure 2.
(a) Electrical power plant reclasses layer; (b) religious sites reclasses layer; (c) urban center reclasses layer; (d) train reclasses layer.

Figure 3.
Nature reserves reclasses layer.

Figure 4.
(a) Wells reclasses layer; (b) slope reclasses layer; (c) historical sites reclasses layer; (d) electrical power line reclasses layer.
Figure 4.
(a) Wells reclasses layer; (b) slope reclasses layer; (c) historical sites reclasses layer; (d) electrical power line reclasses layer.

Figure 5.
(a) Main roads reclasses layer; (b) main rivers reclasses layer.
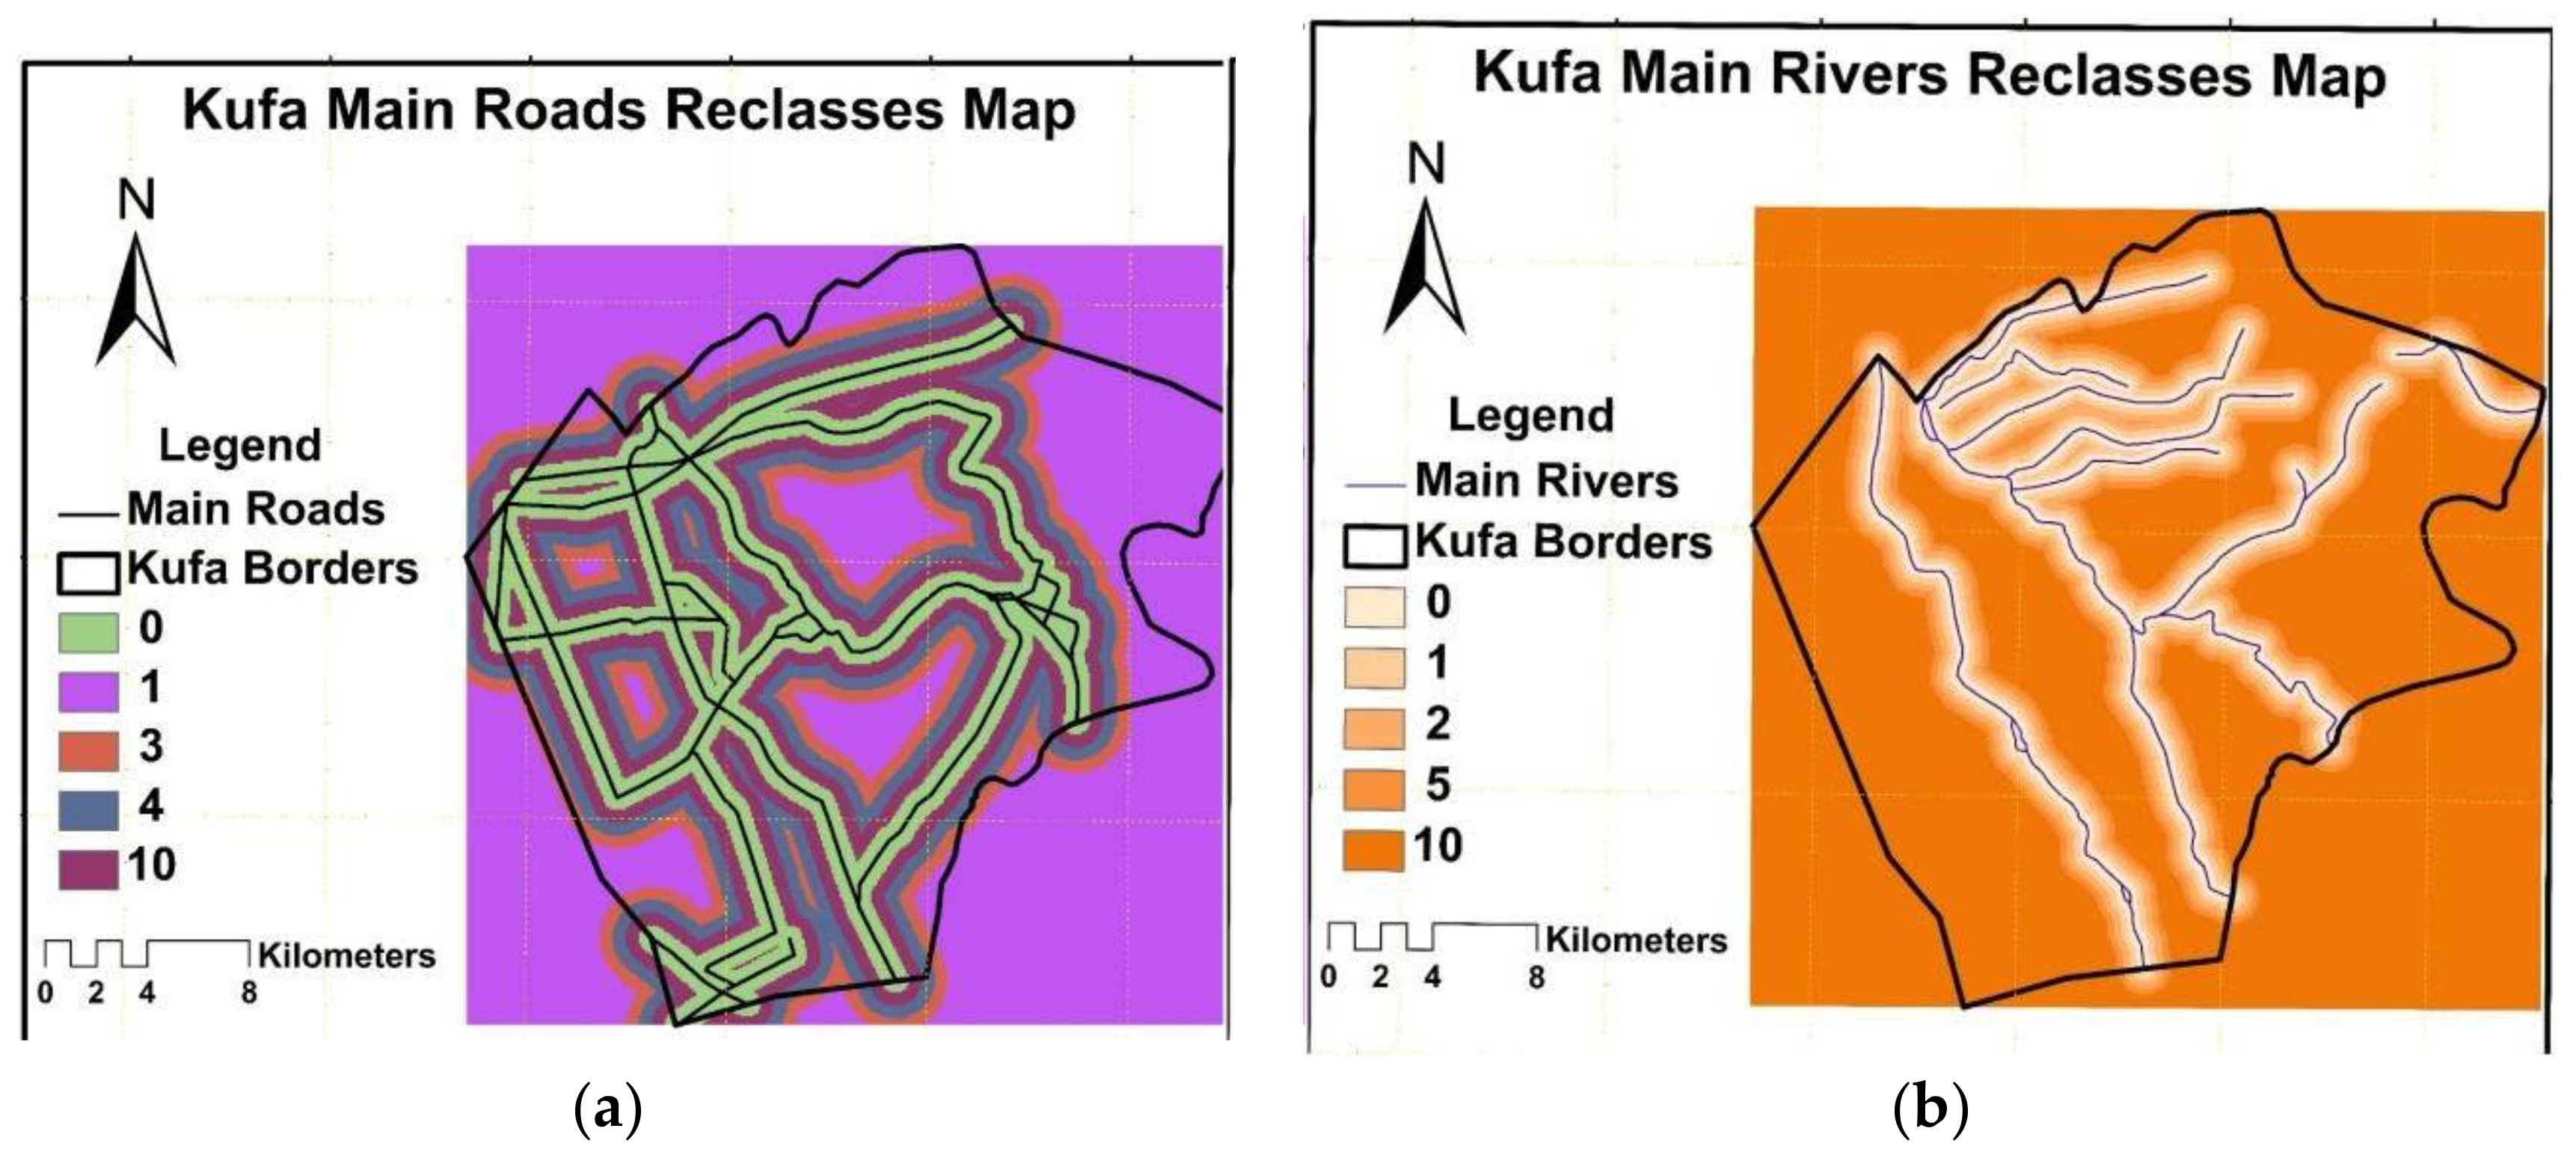
Figure 6.
(a) Suitability index map; (b) candidate sites for landfill.


Table 1.
Inhabitants and the amount of municipal solid waste for period (2017–2032) calculated by researchers.
Table 1.
Inhabitants and the amount of municipal solid waste for period (2017–2032) calculated by researchers.
| Year | Inhabitants | Solid Waste Amount (kg) |
|---|---|---|
| 2017 | 372,760 | 56,361 |
| 2018 | 382,079 | 57,770 |
| 2019 | 391,631 | 59,215 |
| 2020 | 401,422 | 60,695 |
| 2021 | 411,458 | 62,212 |
| 2022 | 421,744 | 63,768 |
| 2023 | 432,288 | 65,362 |
| 2024 | 443,095 | 66,996 |
| 2025 | 454,172 | 68,671 |
| 2026 | 465,527 | 70,388 |
| 2027 | 477,165 | 72,147 |
| 2028 | 489,094 | 73,951 |
| 2029 | 501,321 | 75,800 |
| 2030 | 513,854 | 77,695 |
| 2031 | 526,701 | 79,637 |
| 2032 | 539,868 | 81,628 |
Table 2.
Criteria weights by using pairwise comparison method.
| Criteria | Weight | Criteria | Weight | λmax | CI | RI | CR |
|---|---|---|---|---|---|---|---|
| UC | 0.32 | SL | 0.07 | 12.3508 | 0.13508 | 1.51 | 0.0894 < 0.1 O.K |
| MR | 0.21 | EL | 0.04 | ||||
| HS | 0.07 | RO | 0.09 | ||||
| NR | 0.04 | RW | 0.03 | ||||
| WE | 0.02 | RS | 0.04 | ||||
| EP | 0.07 | ||||||
λmax = maximum value of the consistency vector, CI = consistency index; RI = random index; CR = consistency ratio; UC = urban centers, MR = main rivers, HS = historical site, NR = nature reserves, WE = wells, EP = electrical plant, SL = slope, EL = electrical line, RO = roads, RW = railway, RS = religious site.
Table 3.
Criteria, variables, and the ranking used in the site selection process proposed by researchers.
Table 3.
Criteria, variables, and the ranking used in the site selection process proposed by researchers.
| Criteria | Variable Used (m) | Ranking (0–10) | Description Ranking Scale | Researchers’ Suggested Buffers |
|---|---|---|---|---|
| Urban center | 0–5000 | 0 | Not suitable | 5000 m [1], 5000 m [20], 5000 m [21] |
| 5000–10,000 | 10 | Most suitable | ||
| 10,000–15,000 | 5 | High Suitable | ||
| >15,000 | 1 | Less suitable | ||
| Main river | 0–250 | 0 | Not suitable | 250 m [1], 1000 m [13] |
| 250–500 | 1 | Less suitable | ||
| 750–1000 | 3 | Moderately suitable | ||
| >1000 | 10 | Most suitable | ||
| Railways | 0–500 | 0 | Not suitable | 500 m [13], 500m [1] |
| >500 | 10 | Most suitable | ||
| Power lines | 0–300 | 0 | Not suitable | 30 m [22], 30 m [23] 50 m [24] |
| >300 | 10 | Most suitable | ||
| Power plant | 0–500 | 0 | Not suitable | 250 m [21], 250 m [23] |
| >500 | 10 | Most suitable | ||
| Slope | 0–15% | 10 | Most suitable | 5% [22], 15% [1] |
| >15% | 0 | Not suitable | ||
| Historical sites | 0–2500 | 0 | Not suitable | 1500 m [21] |
| >2500 | 10 | Most suitable | ||
| Religious sites | 0–2500 | 0 | Not suitable | 1500 m [21] |
| >2500 | 10 | Most suitable | ||
| Well | 0–500 | 0 | Not suitable | 400 m [23], 400 m [21] |
| >500 | 10 | Most suitable | ||
| Roads | 0–500 | 0 | Not suitable | 500 m [21], 500 m [23] |
| 500–1000 | 10 | Most suitable | ||
| 1000–1500 | 4 | suitable | ||
| 1500–2000 | 3 | Moderately suitable | ||
| >2000 | 1 | Less suitable | ||
| Nature reserves | 0–500 | 0 | Not suitable | 400 m [21], 400 m [23] |
| >500 | 10 | Most suitable |
Table 4.
Accumulated weight and volume of waste for each district.
| Accumulated Waste from 2017 to 2032 Weight (tonne) * | Volume in Landfill (m3) * | |
|---|---|---|
| Al-Kufa | 1093 | 1951 |
* Density for Compacting waste at landfill = 0.56 t/m3 [29].
Table 5.
Cumulative and compacted waste volume for the landfill and its required area.
| Al-Kufa Landfill | |
|---|---|
| Accumulated Volume (m3) | 1951 |
| +12% Cover | 234.12 |
| Total volume(m3) | 2185.12 |
| Area m2 for 3 m depth | 728.3 |
© 2018 by the authors. Licensee MDPI, Basel, Switzerland. This article is an open access article distributed under the terms and conditions of the Creative Commons Attribution (CC BY) license (http://creativecommons.org/licenses/by/4.0/).
Share and Cite
MDPI and ACS Style
Al-Anbari, M.A.; Thameer, M.Y.; Al-Ansari, N. Landfill Site Selection by Weighted Overlay Technique: Case Study of Al-Kufa, Iraq. Sustainability 2018, 10, 999. https://doi.org/10.3390/su10040999
AMA Style
Al-Anbari MA, Thameer MY, Al-Ansari N. Landfill Site Selection by Weighted Overlay Technique: Case Study of Al-Kufa, Iraq. Sustainability. 2018; 10(4):999. https://doi.org/10.3390/su10040999
Chicago/Turabian StyleAl-Anbari, Mohammad A., Mohanad Y. Thameer, and Nadhir Al-Ansari. 2018. "Landfill Site Selection by Weighted Overlay Technique: Case Study of Al-Kufa, Iraq" Sustainability 10, no. 4: 999. https://doi.org/10.3390/su10040999
Note that from the first issue of 2016, this journal uses article numbers instead of page numbers. See further details here.