1. Introduction
Most of the 94 naturally-occurring elements are metals or metalloids, only half of which are industrially used in significant quantities. The raw materials used and consumed in the world are mostly fossil fuels and non-metallics, such as building materials, clays, salts or phosphate. Many metals or metalloids in the periodic system of elements are of significant economic importance mostly in their non-metallic compounds, rather than as pure metals or metalloids. Examples are the elements potassium, sodium, and calcium which are of great importance as salt (NaCl), potash (KCl or KCl·MgCl2·6H2O), and limestone (CaCO3). Silicon (Si) is used as a metalloid in relatively small quantities in the electronic industry, but its dominant use is as the non-metallic oxide compound quartz (SiO2) in gravel and stone in the building industry.
Here we will only consider the classical non-agrarian, non-renewable mineral and energy resources, and exclude water and soils which, although the most important non-agrarian natural resources, fall in a separate category.
Using 2003 statistics obtained before the recent extreme price fluctuations in the commodity markets, it had been estimated that the population of the world annually consumed about 35 billion tonnes of mineral resources having a value of about € 800 billion [
1].
By far the dominant quantities are construction materials like gravel, stone, etc., followed by the fossil energy commodities natural oil, hard coal, natural gas and lignite. The majority of the next most-used commodities are non-metallic raw materials, like rock salt, potash, phosphate, various clays, etc. Only nine metals are consumed in annual amounts of more than one million tonnes: iron (the most important metal by far), aluminium, copper, manganese, zinc, chromium, lead, titanium, and, since 1999, nickel.
Our raw material consumption can be illustrated by two analogies:
a. In industrialized countries like Germany, the per capita daily use of raw materials is about 40 kg, corresponding to the baggage allowance for two persons on a commercial flight. As stated above, the lion’s share of this consumption is made up of construction materials and energy raw materials. Next in magnitude come non-metallic raw materials and metals; but there are also minute quantities—grams or milligrams—of high-tech-materials in the suitcases, like tantalum, platinum group metals, indium or germanium, without which high-tech-industries and high-tech products like electronic parts are unthinkable.
b. To visualize the energy consumption we have to choose a unit that measures the combined use of all energy raw materials. The international standard unit (SI-unit) for energy is the joule, but there are other energy units directly derived from standardized fuels, like tonnes of coal equivalent or tonnes of oil equivalent (toe). As a unit of energy, the toe includes other energy commodities, such as hard coal, lignite and natural gas, which are converted into oil tonnes. Based on this energy unit, humankind consumes about 10 billion tonnes of oil equivalent per year. To make this big number more comprehensible, if the 10 billion tonnes of oil equivalent per year were put end-to-end into the railway tank cars used by the European railway systems (with each railway tank car having a length of 15 m and holding 60 tonnes), a train with a length of about 7,200 km which is approximately the distance as the crow flies between Berlin, Germany, and Chicago, USA (including the distance across the Atlantic Ocean) would be laden every single day of the year.
The question then arises, how long can this consumption be sustained? Is there a chance to fulfil the requirement of inter-generational fairness, a “development that meets the needs of the present without compromising the ability of future generations to meet their own needs”, the internationally most widely accepted definition of sustainable development as defined in the United Nations (UN) Report “Our Common Future” (the “Brundtland Report”, p. 8) [
2]? Or, as defined by Solow [
3]: “a sustainable path is one that allows every future generation the option of being as well off as its predecessors”? Although not explicitly stated, embodied in the concept of sustainability is that it be achieved over a duration of time measured in centuries or millennia, not just decades. True sustainability means “practically forever,” or at least as long as humans exist [
4].
As a first step to investigating how to achieve sustainable use of non-renewable mineral and energy natural resources, we have to clarify two key issues:
2. Why Do We Need Natural Resources?
Humankind has always depended on the use of energy and mineral resources for its technological and cultural evolution. As far back as the Bronze Age metal was used for tool-making, but the large-scale exploitation of non-renewable energy resources only emerged much later with the invention of the steam engine at the beginning of the 18th century. At that time, the dominant energy and raw material for heating, smelting and ship-building was wood, a renewable biomass. Due to the technological development and increased demand of energy it was replaced first by coal and subsequently by other fossil fuels. Maintaining today’s standard of living in both industrialized and developing nations depends entirely on the use of non-renewable energy and mineral resources [
5].
If we analyze in detail why we need a specific natural resource, we have to conclude that with a few notable exceptions (such as nitrogen, potassium, and phosphate, all used as fertilizers in agriculture and to be discussed below), it is not the metal or raw material as such that is important, but a function that is intrinsic to the material properties of the commodity [
6]. Thus, taking copper as an example, the electrical conductivity of copper is the function intrinsic to its material properties. However, other commodities can perform these functions just as well, often in conjunction with fundamentally different technologies. To continue the example, copper telephone wires were until recently extensively used for transmitting information but have now been largely replaced by glass fibre cables made of silica, which is virtually inexhaustible. Another method of information transfer that does not depend on copper wire is wireless transmission using directional antennae or satellites. Each solution requires different materials. In the field of photography, not so long ago silver was needed for the capture of pictures, but today digital cameras with a completely different raw material requirement have largely replaced the use of film. In the printing industry, lead was formerly used as type metal but it has been replaced today by offset or computer printing.
However, as stated above, the concept of finding different solutions does not work for the essential agricultural fertilizers nitrogen, potassium, and phosphate since plants need these elements as such for their metabolism. Therefore, they are as indispensable as clean air or water, and there is no replacement for them. For nitrogen and potassium this is not a problem because the atmosphere is an inexhaustible source of nitrogen and oceans are full of potassium. However, phosphate is different because there is no unlimited reservoir. A solution will be discussed later.
3. Consumption versus Usage
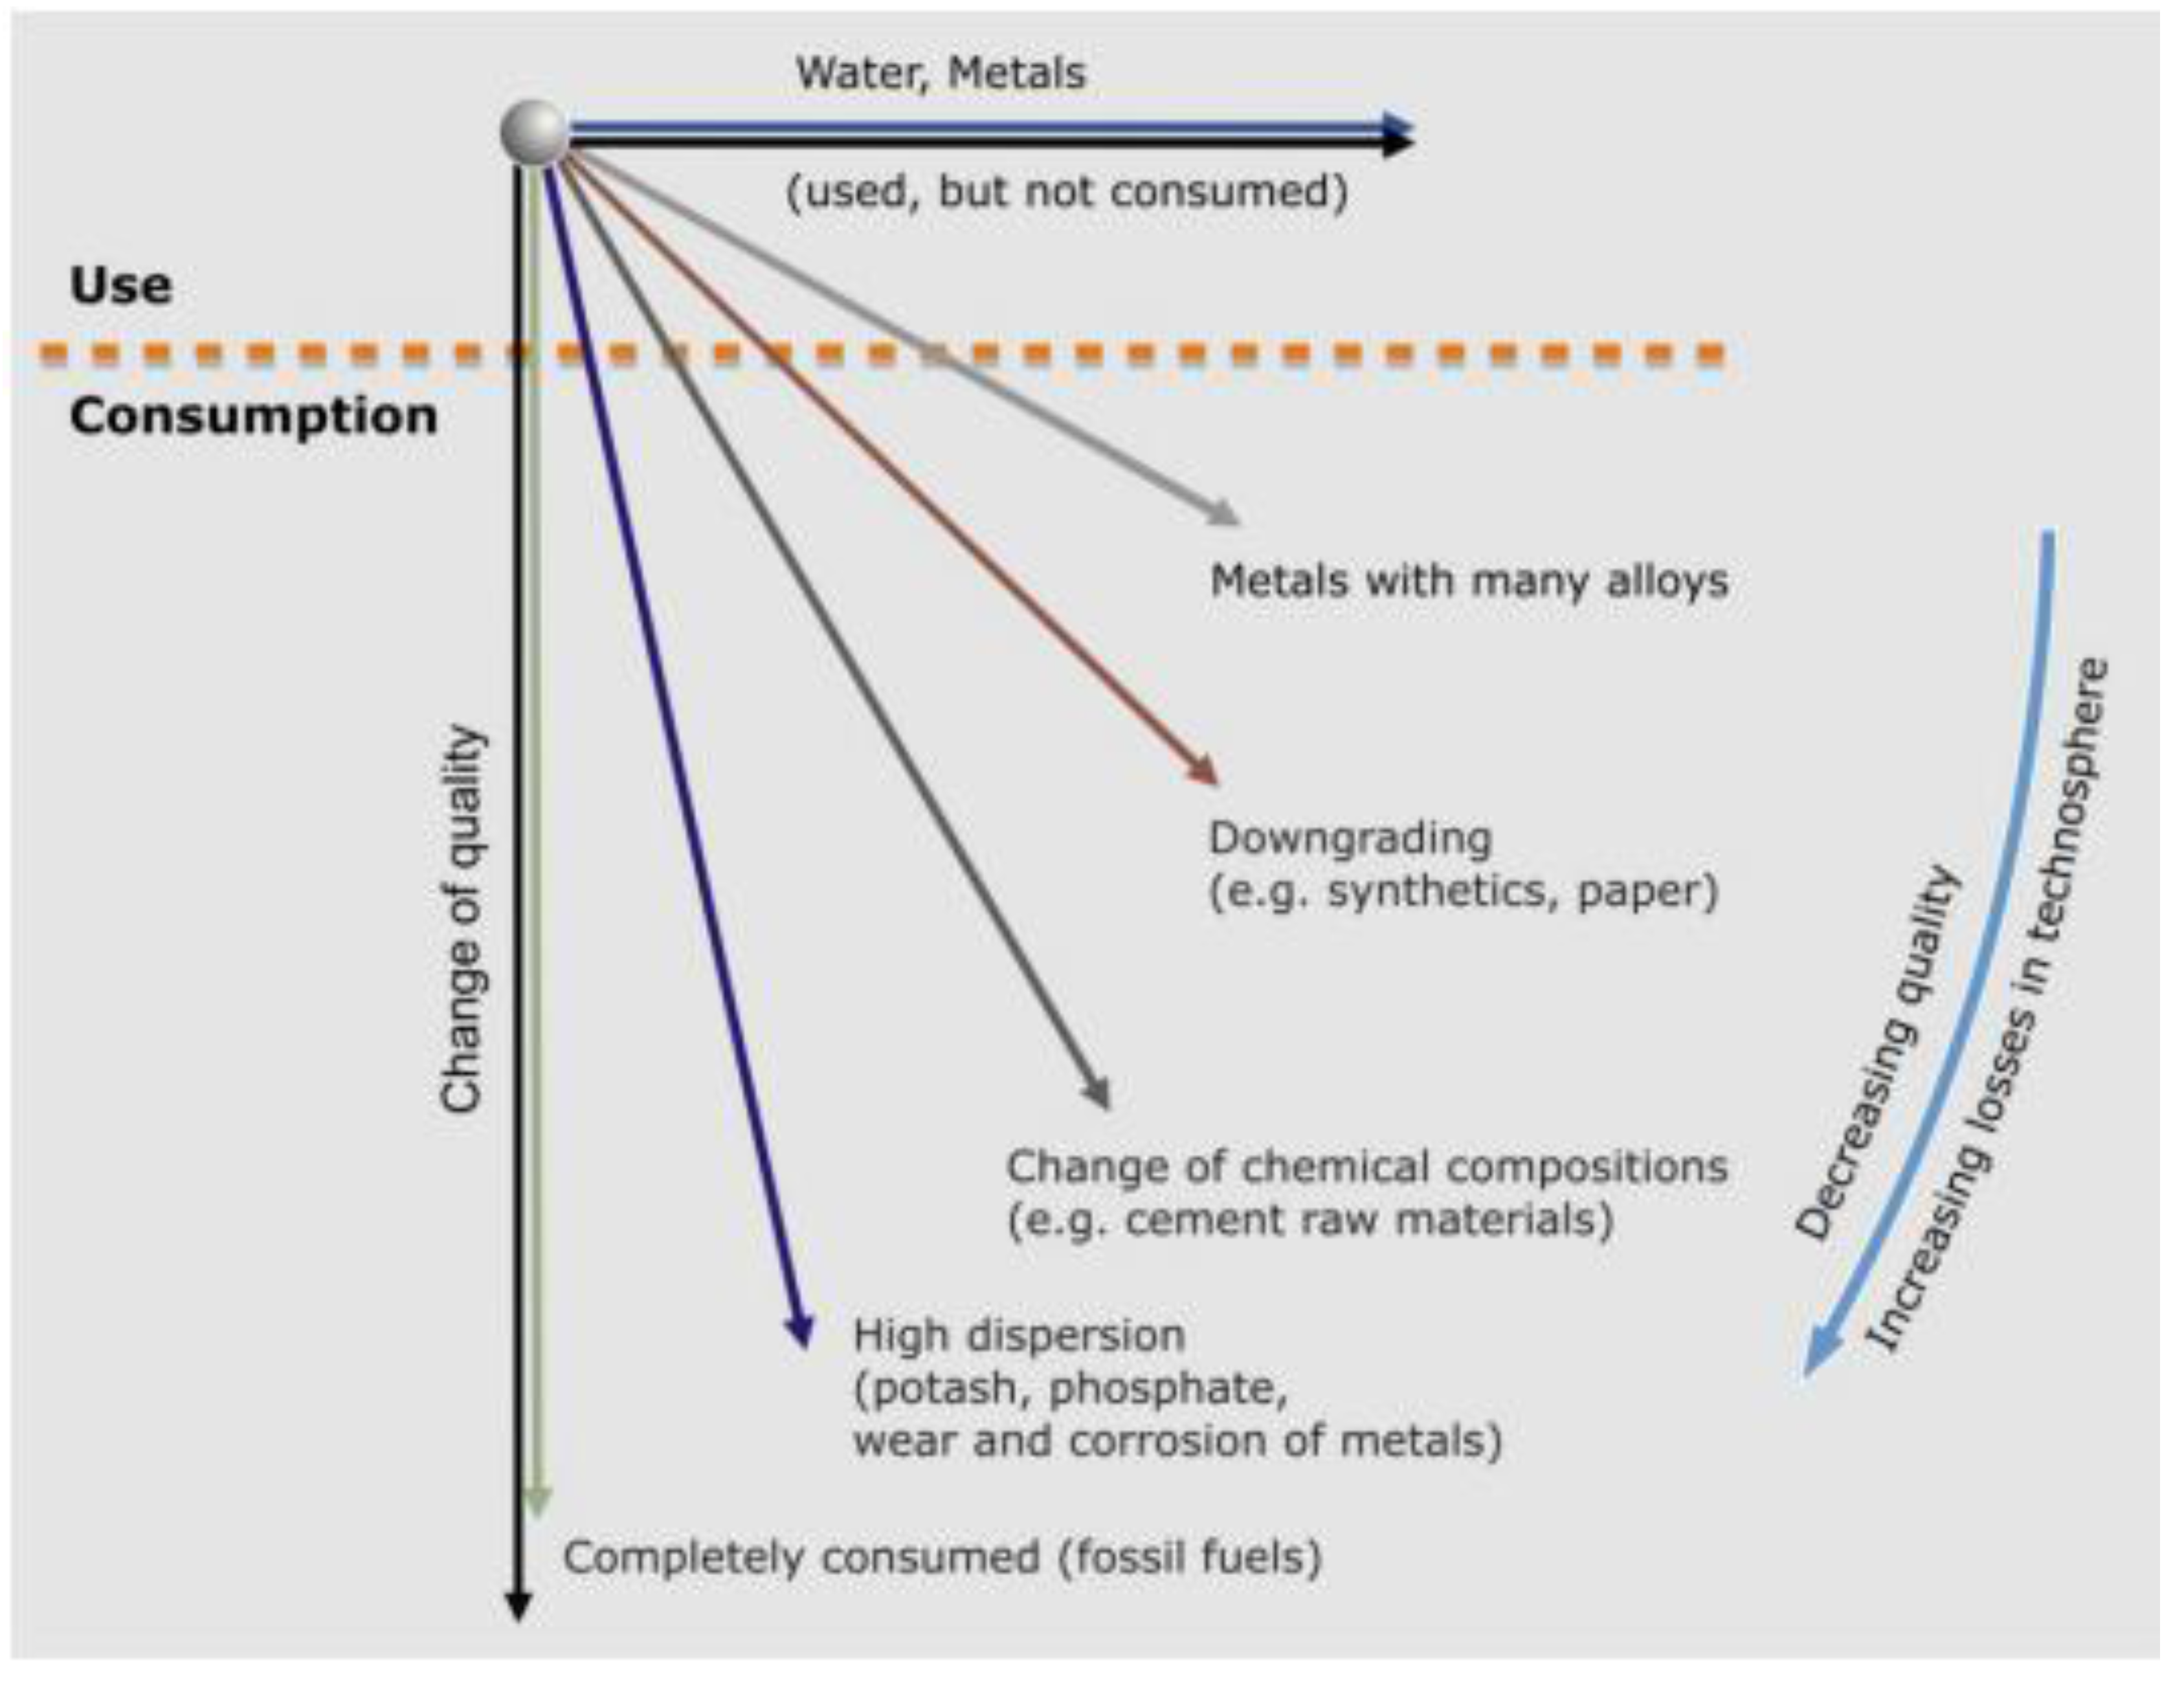
Consumption and usage represent opposite ends of resource utilization (
Figure 1): (1) at one extreme are natural resources which are totally consumed and cannot be recycled; (2) at the other, natural resources which can be recycled and used again. The non-recyclable resources include fossil fuels as energy raw materials which are irretrievably consumed in the process of power, light, and heat generation. The entropy is increased and the fossil fuels can never be recycled. Although according to the first law of thermodynamics energy cannot be lost, the usable portion used for human requirements, the so-called exergy, is irrevocably consumed and thus irretrievable. At the other extreme, usage without consumption is illustrated by water which can always be recycled if enough energy is available, and by metals in general. Metals survive use. All resources that are not irrevocably consumed are only transferred from one resource sphere to the other in one form or the other: from the geosphere with its primary resources to the technosphere with its secondary resources. Hereby, technosphere is defined as the man-made world, such as surface and subsurface engineering constructions, machines, or waste dumps. Theoretically, all these secondary resources can be recycled completely. In practice, however, there are practical limitations to what can be salvaged. Moreover various intermediate stages exist between usage without consumption and total consumption, as shown in
Figure 1.
There are raw materials which during usage are converted to another chemical compound and therefore cannot be recycled to their original state. The best examples are clay used for making bricks or limestone, marl or clay for making cement and then concrete. Bricks and concrete can be recycled only as lower value products, for example as bulk fill in road works.
The substances that are to all intents and purposes lost to the environment without any chance of recovery are those which find their application in a highly dispersed state. This is typically the case with fertilizers containing potassium, nitrogen and phosphate, as well as with metals added as supplements to fertilizers, like zinc as an essential trace element for plant growth or magnesium as a supplement. Other metals that are similarly used in a highly dispersed form in various chemicals, e.g., zinc in skin creams or titanium in paint, also belong to this category. One could therefore state, they also are consumed.
We want to take a closer look at metals because they have the best chance to become a “renewable resource” [
7]. We can make a material balance for a time interval ΔT: the amount of any metal extracted from the geosphere, M
geosphere, and transferred to and absorbed in the technosphere, must equal M
technosphere:
There are, however, certain losses to be taken into account. We will call the quantity of metal which is available for reuse after recycling, M
scrap, and the mass of the metal loss, M
loss, so that:
Figure 1.
Recycling of materials from the geosphere and technosphere (modified from [
5]).
Figure 1.
Recycling of materials from the geosphere and technosphere (modified from [
5]).
These losses can be divided into four categories:
Mloss-1: It is thermodynamically impossible to have a 100 percent perfectly closed cycle. Every technical process is subject to losses. There will always be a certain amount of material lost in flue gases, for example zinc in the recycling process of steel scrap, or lost in slag or other residues. These metal losses reach the environment and normally cannot be or are not recovered. Certainly, always new and better processes are being developed. In old mining districts for instance it can be observed that old mine tailings are reprocessed over and over again. Also some flue dust recycling plants for zinc exist. A recovery of 100% is nevertheless unachievable.
M
loss-2: There are losses, which are due to the different redox potential of the metals (noble and less noble metals). For example, if precious metals end up in the iron or aluminium smelting circuits, they are lost [
8]. This also applies to copper or tin in the iron smelting circuit. Such losses are not necessarily unavoidable, but they can be prevented by proper material flow management.
M
loss-3: These losses occur because the scrap value is too low and/or the technology is not developed far enough to enable the recovery of the metals. In market economies recycling has to pay for itself. This applies for example to platinum group metals in galvanic processes [
9] or, so far, indium in flat television screens [
10]. This frontier issue will be discussed later.
Mloss-4: These are losses already referred to above under dispersal effects and incorporated here for completeness’ sake to account for metals in a highly dispersed form that reach the environment. They include metals in chemicals like zinc as essential trace element in fertilizers or zinc in skin ointment. Also the losses due to corrosion and wear fall into this category.
There are other incidental losses due to lack of efficient recycling or any kind of recycling at all, and other losses in the technosphere, as elaborated by Hagelüken and Meskers [
11]. One example is the export of cars to developing countries with bad roads where the chances are high that catalytic converters are destroyed and the platinum contained in them is lost forever and cannot be recovered. Another more general example is the export of cars or consumer goods to developing nations with very limited recycling systems. In these countries, recycling rates are normally high for simple, but low for complex products. For example, the highest recycling rates for simple aluminium cans are achieved in Brazil [
12]. However, such losses for complex products can be overcome in future or at least reduced, by improving material flow management.
Besides the loss of material substance quality loss needs to be considered too. Precious metals and copper can be recycled unlimited times with no loss of quality and only minor losses to the environment, defined above as Mloss-1 (so precious metals or copper in the technosphere can be described as truly renewable resources). There are other metals which being less noble have certain practical limits to their recycling. This is mainly due to the higher rate of oxidation during remelting and the thermodynamically limited metal refining. Aluminium and nickel, for instance, are less recyclable, because they are frequently used in the form of various alloys rather than as pure metals. The secondary metals will therefore either have to be blended with primary material to maintain quality or nearly closed loop recycling systems have to be applied. Even the latter will only have limited success since material development happens faster than long life applications are in use. Subsequently, an accumulation of alloying-elements and so-called trace elements in very low concentration takes place in every life cycle of the material. This kind of quality decrease, called downgrading, is generally also the fate for recycled carbon-based synthetic materials or for paper.
We want to have a closer look at other limitations for reusing the fraction Mscrap in the technosphere.
4. Metals in the Technosphere
Before we look at the metals in the technosphere in more detail, we briefly have to consider the geosphere. In nature we can distinguish two types of mineral resources, those of practically unlimited size and those which occur in deposits created by enrichment processes.
To the first type belong deposits of gravel, limestones, and other non-metallics. Limits to their exploitation are mostly man-made, for example by regional planning, or by infrastructure connecting deposits to markets. Although enrichment deposits also include some non-metallic raw materials, like barite, fluorspar or phosphate, the typical enrichment deposits are metals and fossil fuel deposits. Frequently, the average content of useful metals in the Earth’s crust is in the order of ppm (parts per million) and has to be enriched by orders of magnitude into the range measured by percent of content in order to become an economically exploitable deposit. To create a zinc deposit, the enrichment factor needed is close to 600 and for lead it is even at about 4,000 [
13]
. Consequently, as far as future supply goes, metals are the principal concern to the world economy besides energy, which we will deal with later.
As said above, humankind has always depended on the use of energy and mineral resources for its technological and cultural advance. This technological progress went hand in hand with combining more and more metals and metalloids in innovative ways to produce better and better properties of products. The first innovation of the Bronze Age that followed the Copper Age was combining first copper with arsenic, then with tin to produce bronze; an alloy which was harder than its two components individually and could be used for tool making. In the Bronze Age and the following Iron Age, alloys were invented mostly by trial and error. In the famous tomb near the city of Xi’an of the Chinese emperor Ch’in, who founded the first dynasty to rule a unified China in 221 BC, bronze weapons were found containing up to 15 different metals. The surface of swords and arrow heads was coated with an chromium alloy to provide extra hardness and durability [
14,
15]. When in the Harz Mountains in Germany, an old silver mining district, the wire rope was invented in 1834, later analyses showed that the iron used came from a local manganese-rich iron ore deposit in limestone, resulting in a bendable and drawable wire product [
16]. A car 100 years ago consisted of only a few metals like mainly iron/steel, copper for cables, tin for soldering, and lead for batteries. Today a car contains in addition a greater variety of steel alloy metals to produce steel plates of high strength but lower weight, aluminium parts, zinc as corrosion protection and many electronic components with a wide variety of technology metals [
11] and precious metals. A computer in 1998 consisted of 31 different metals and metalloids [
17], a mobile phone today incorporates nearly half of all the naturally occurring elements [
18]. This does not only apply to whole systems like cars or electronic equipment but also to component parts.
The consequence of technological advance is that humans are creating “deposits” in the technosphere that are far more complex than nature-created deposits in the geosphere and they combine elements which do not normally occur together in nature. Typical examples are lithium, tantalum, or rare earth elements that occur in nature in pegmatites or in the case of lithium in brines in combination with other high technology metals like indium, germanium or gallium that occur in nature jointly in base metal deposits. Lithium-ion-batteries contain cobalt. In nature cobalt is not associated with lithium deposits but with nickel deposits. Thin film solar panels contain the component CIGS/CIS (copper-indium/gallium selenide = Cu(In,Ga)Se2 ) on a thin film of molybdenum. Molybdenum occurs together with copper in porphyry copper deposits. After mining it is metallurgically separated from copper during beneficiation and goes mainly into steel making. Indium occurs with zinc in volcanogenic massive sulphide deposits, whereas gallium occurs in bauxite deposits, the raw material for the production of aluminium. Thus, trying to reuse the products of our modern world by “urban mining” is technologically far more challenging than mining the geosphere.
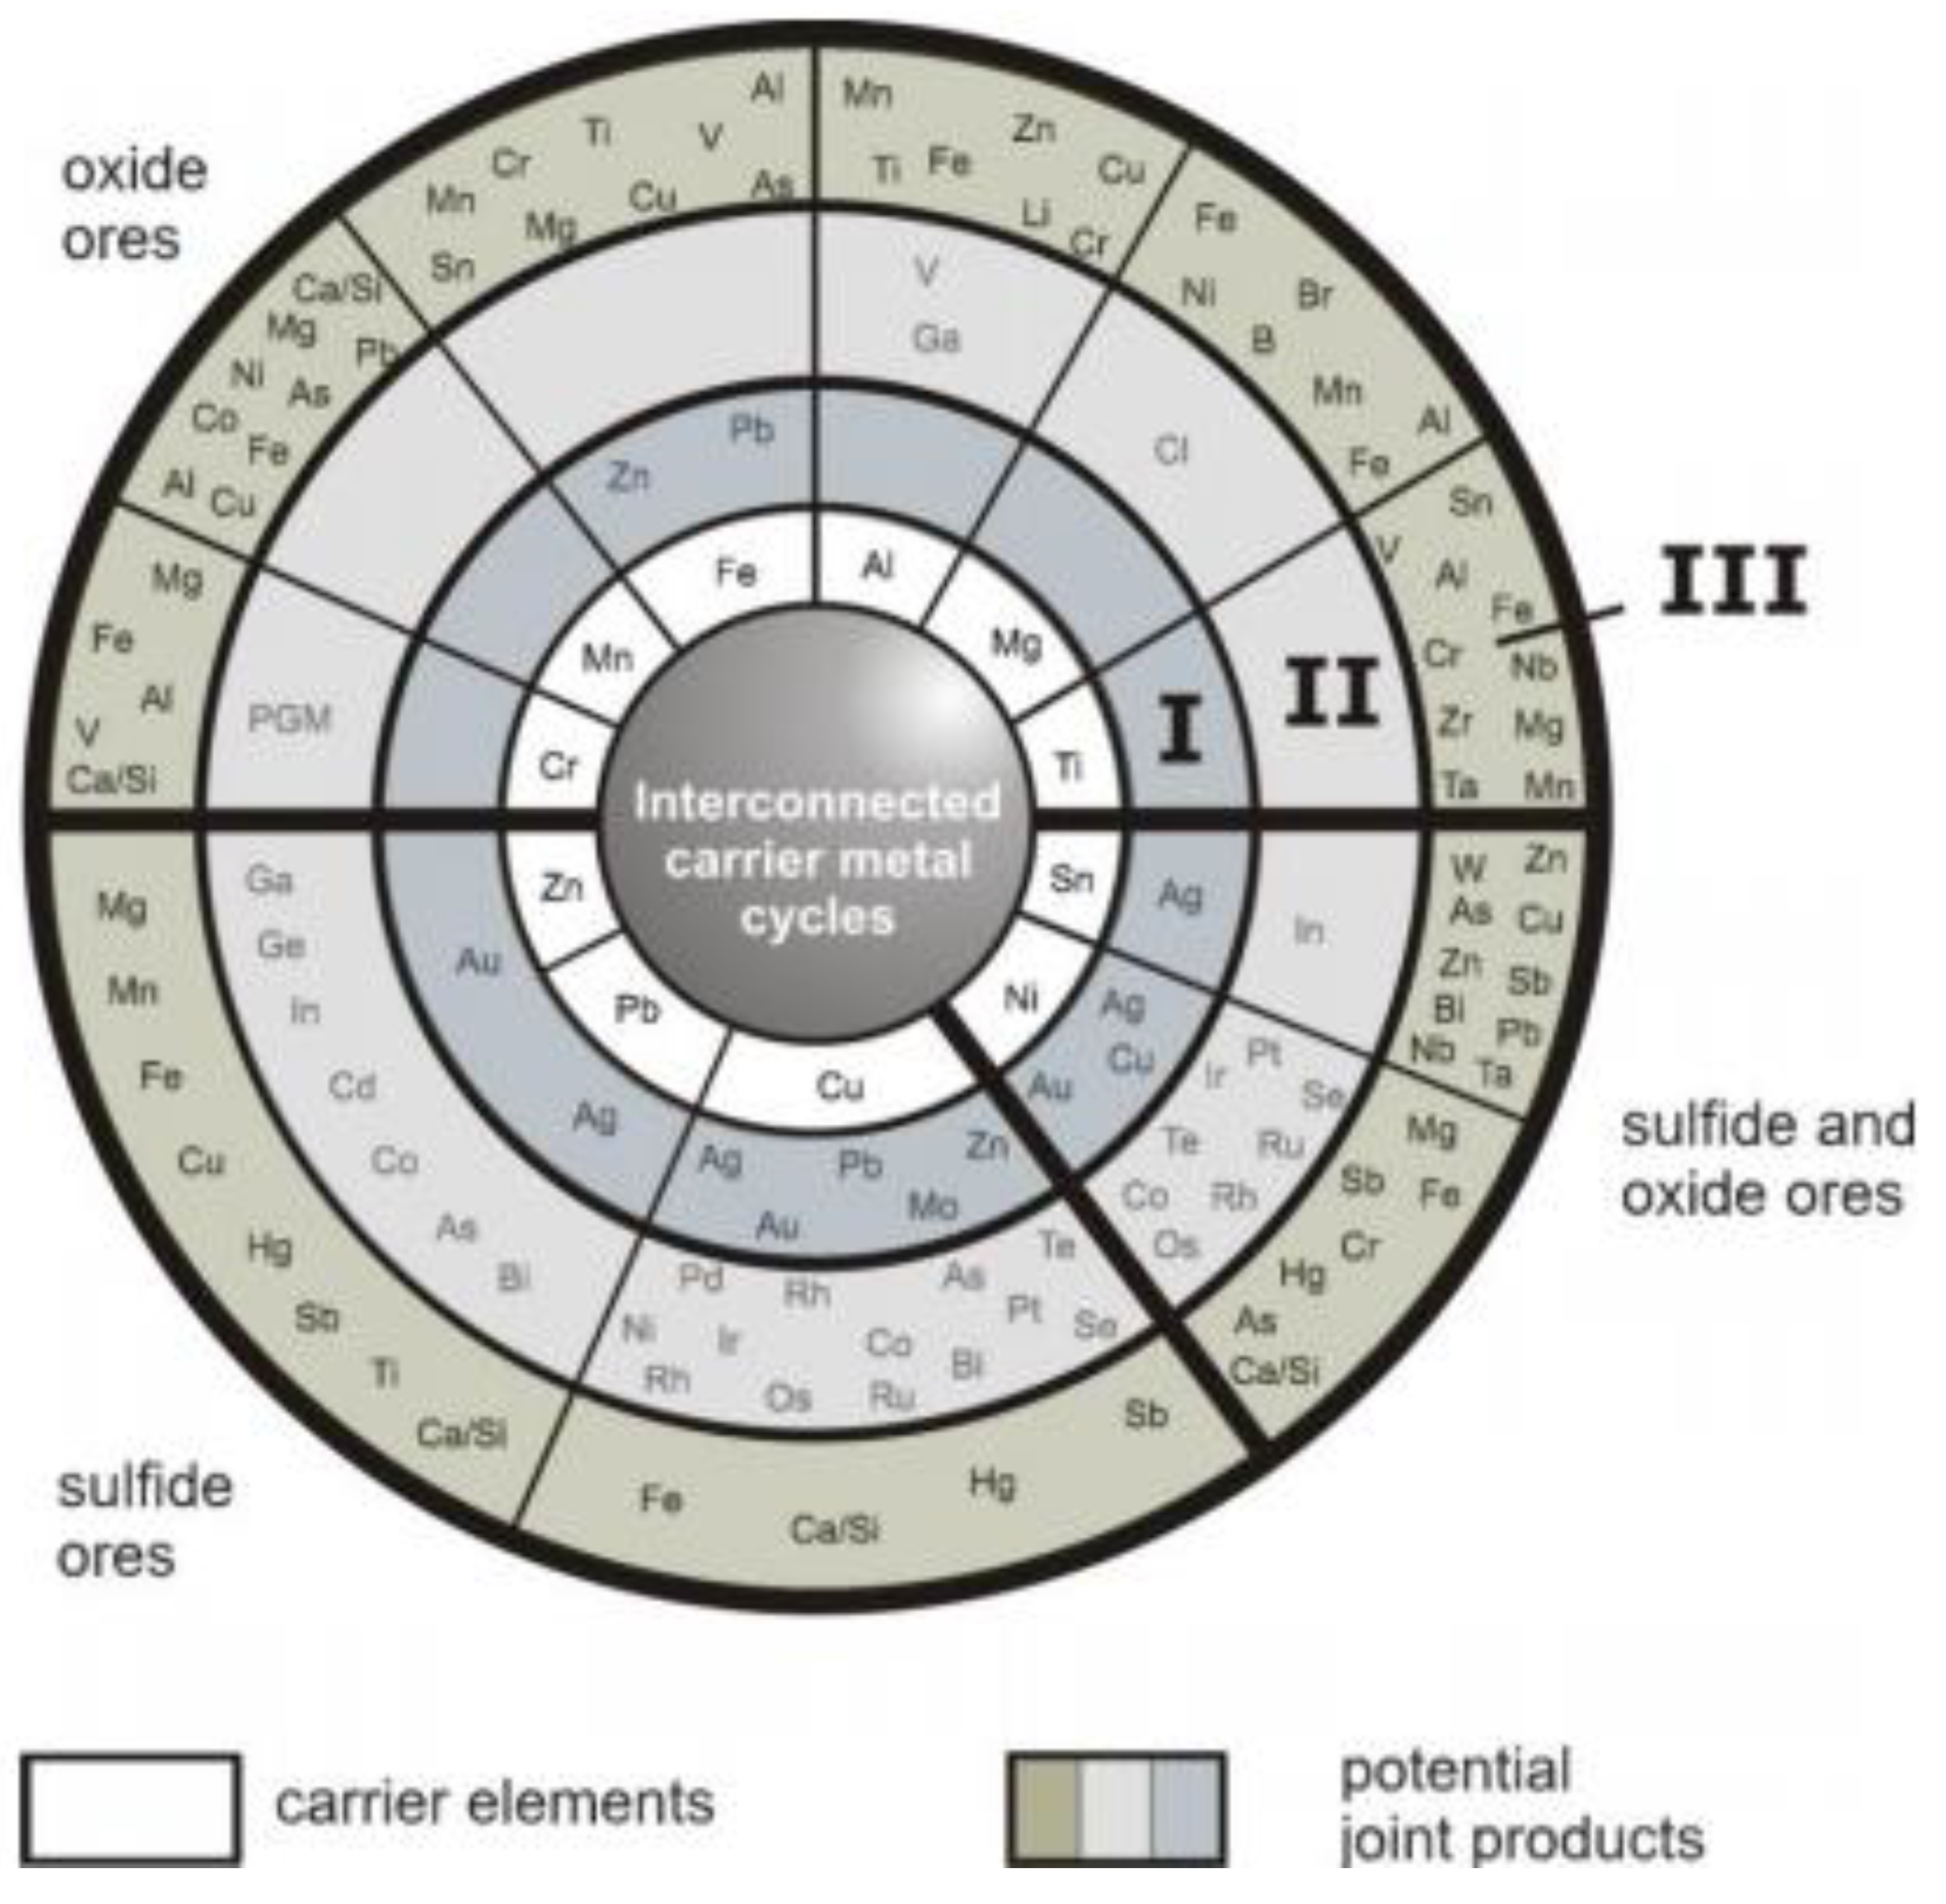
The standard technologies for metallurgical treatment of metal associations from the geosphere have been summarized by Reuter
et al. [
19] and Verhoef
et al. [
20]. They introduced the “metal wheel” (
Figure 2) for the main metallurgical processes for iron, manganese, chromium, aluminium, magnesium, titanium, tin, nickel, copper, lead and zinc. The concentric rings show the interconnectivity between the main metals as carrier metals and the co- and by-product metals: the inner ring shows the carrier metals, which are the bulk metals in present-day use, the three outer rings show the impurities and minor metals present in the ores of the bulk metals with which they are associated. The two middle rings show those elements which are or can be recovered to maximize economic benefits and minimize environmental impact. The outermost ring contains the elements lost to process residues and emissions. As
Figure 2 shows, in the outer ring III for example the pegmatite metals lithium or tantalum are lost in residues in these standard processes.
As said above we want to recover as much as possible of the metal substance transferred into the technosphere for additional life cycles of use. In terms of the equation
we want to maximize M
scrap and to minimize M
loss.The absolute amount of resources in the technosphere increases continuously with consumption,
i.e., with the amount of spent primary resources [
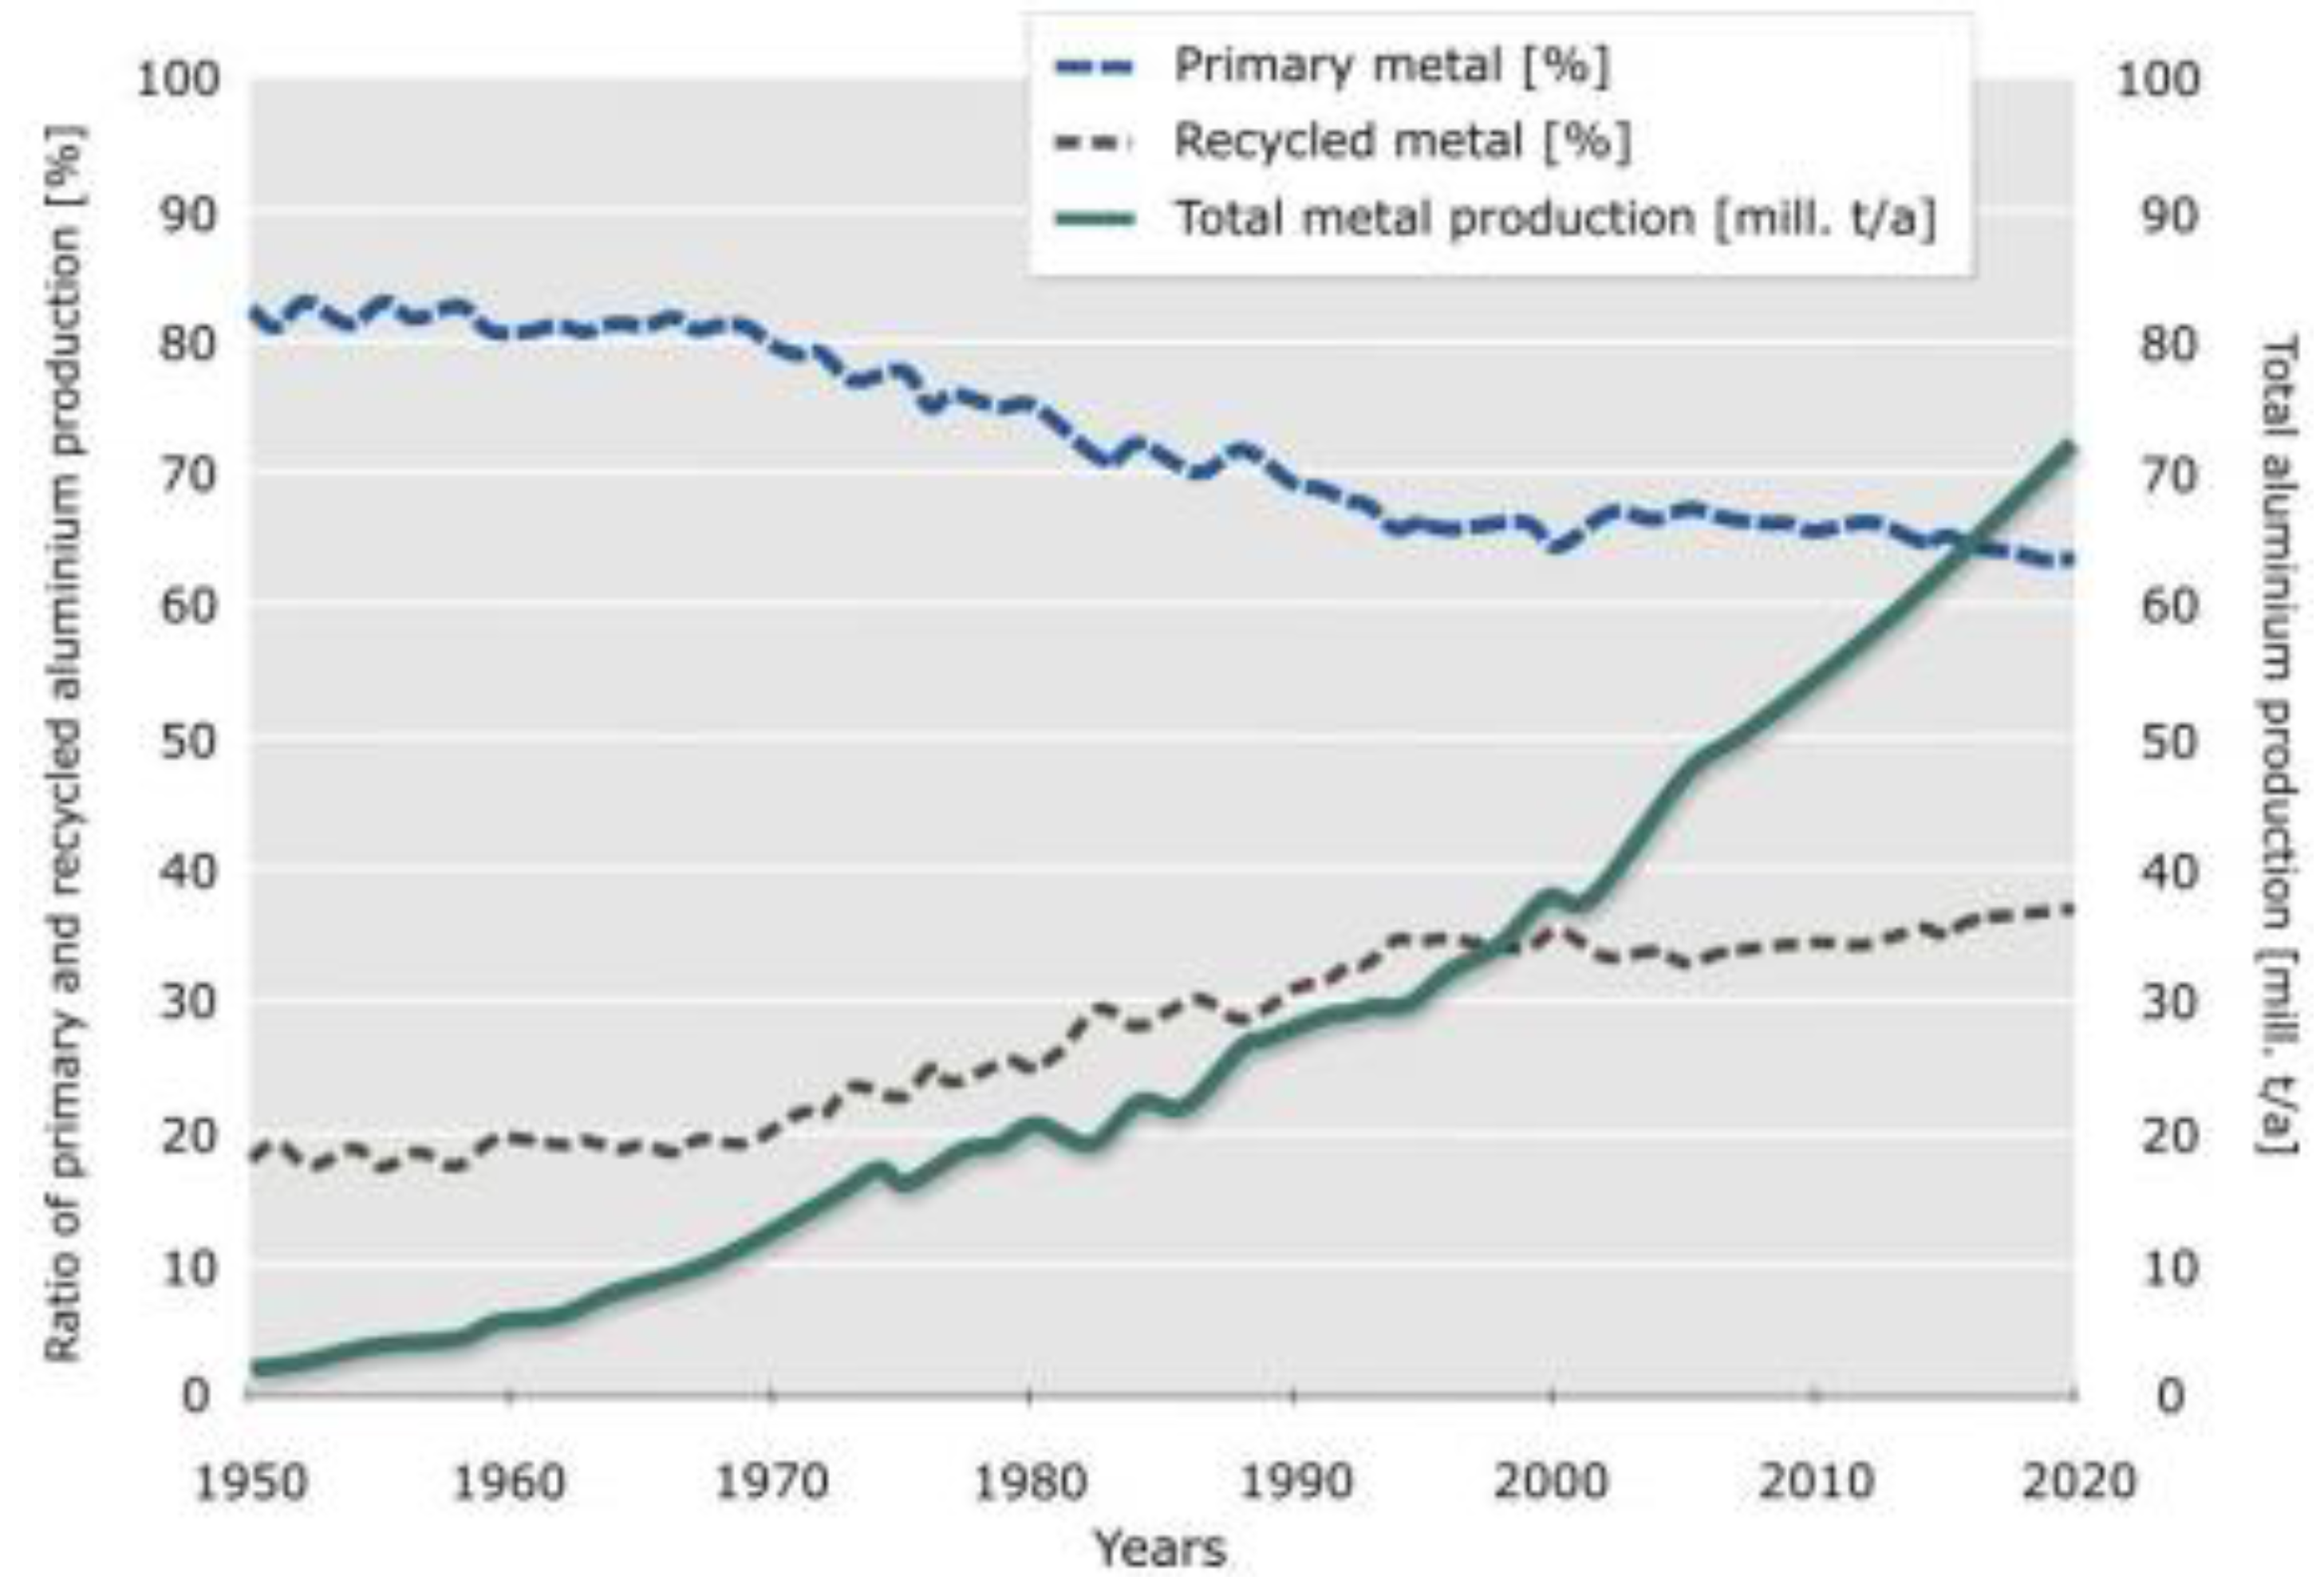
21]. This offers the possibility for increased replacement of primary resources from the geosphere through recycling from the technosphere. Aluminium is a good example of this process.
Figure 3 shows how the increased use of secondary, recycled aluminium replaces primary material. Using resources from the technosphere by recycling not only makes sense because it saves finite resources from the geosphere, but also because it offers the possibility of energy savings.
Figure 2.
The metal wheel. Ring I: Co-elements with considerable own production infrastructure. Valuable to high economic value; some used in high tech applications. Ring II: Co-elements that have no, or limited, own production infrastructure. Mostly highly valuable, high-tech metals, e.g., essential in electronics. Ring III: Co-elements that end up in residues or as emissions. Costly because of waste management or end-of-pipe measures. (From [
19] and [
20] with permission of A.M. Reuter).
Figure 3.
Total production, and primary and secondary production of aluminium [
22].
Figure 3.
Total production, and primary and secondary production of aluminium [
22].
Pure metal scrap is the ideal raw material because for producing new metal by recycling, the process is the least energy intensive (
Table 1). This source, however, is limited and cannot supply the new metal demanded by the market. Some countries try, therefore, to attract to their own internal markets, good quality scrap from the international markets by offering very favorable treatment charges. Such beggar-your-neighbor activities are, however, frequently opposed as unfair trading practices [
23].
Energy requirements for recycling increase with lower and lower grade scrap and rise exponentially to prohibitive levels for highly dispersed metals in chemicals, or, as in the example mentioned above, of platinum group metals in galvanic processes [
9].
The question is what is the optimum strategy? One could take a purely strategic view concerning security of supply: for example, local recycling with many recycling plants instead of dependency on few international suppliers of primary material. One could consider a production cost minimum as the optimum taking into account all internal and external costs. The authors decided not to use an approach that uses costs as a common denominator for all input elements but chose an energy concept: the optimum is a mixture of primary and secondary material which minimizes energy consumption and at the same time minimizes CO
2-emissions. The reason is the following: As will be elaborated on later in Chapter 6, one of the critical elements for achieving sustainability with regard to non-renewable resources is the availability of enough energy at affordable prices. If enough affordable energy is available most problems pertaining to natural resources can be solved: any sewage can be treated and reused; saline water desalinated; or soil erosion by deforestation reduced if cutting down forests for biofuel is stopped; air pollution can be drastically reduced, so can the CO
2-input into air by carbon capture and storage. Depending on energy prices lower grade deposits can be brought into production [
5].
Table 1.
Energy savings by recycling pure secondary material [
22,
24].
Table 1.
Energy savings by recycling pure secondary material [22,24].
| Metal | Energy savings |
|---|
| Steel | 74% |
| Aluminium | 95% |
| Copper | 85% |
| Lead | 65% |
To find this energy optimum we want to do a thought experiment:
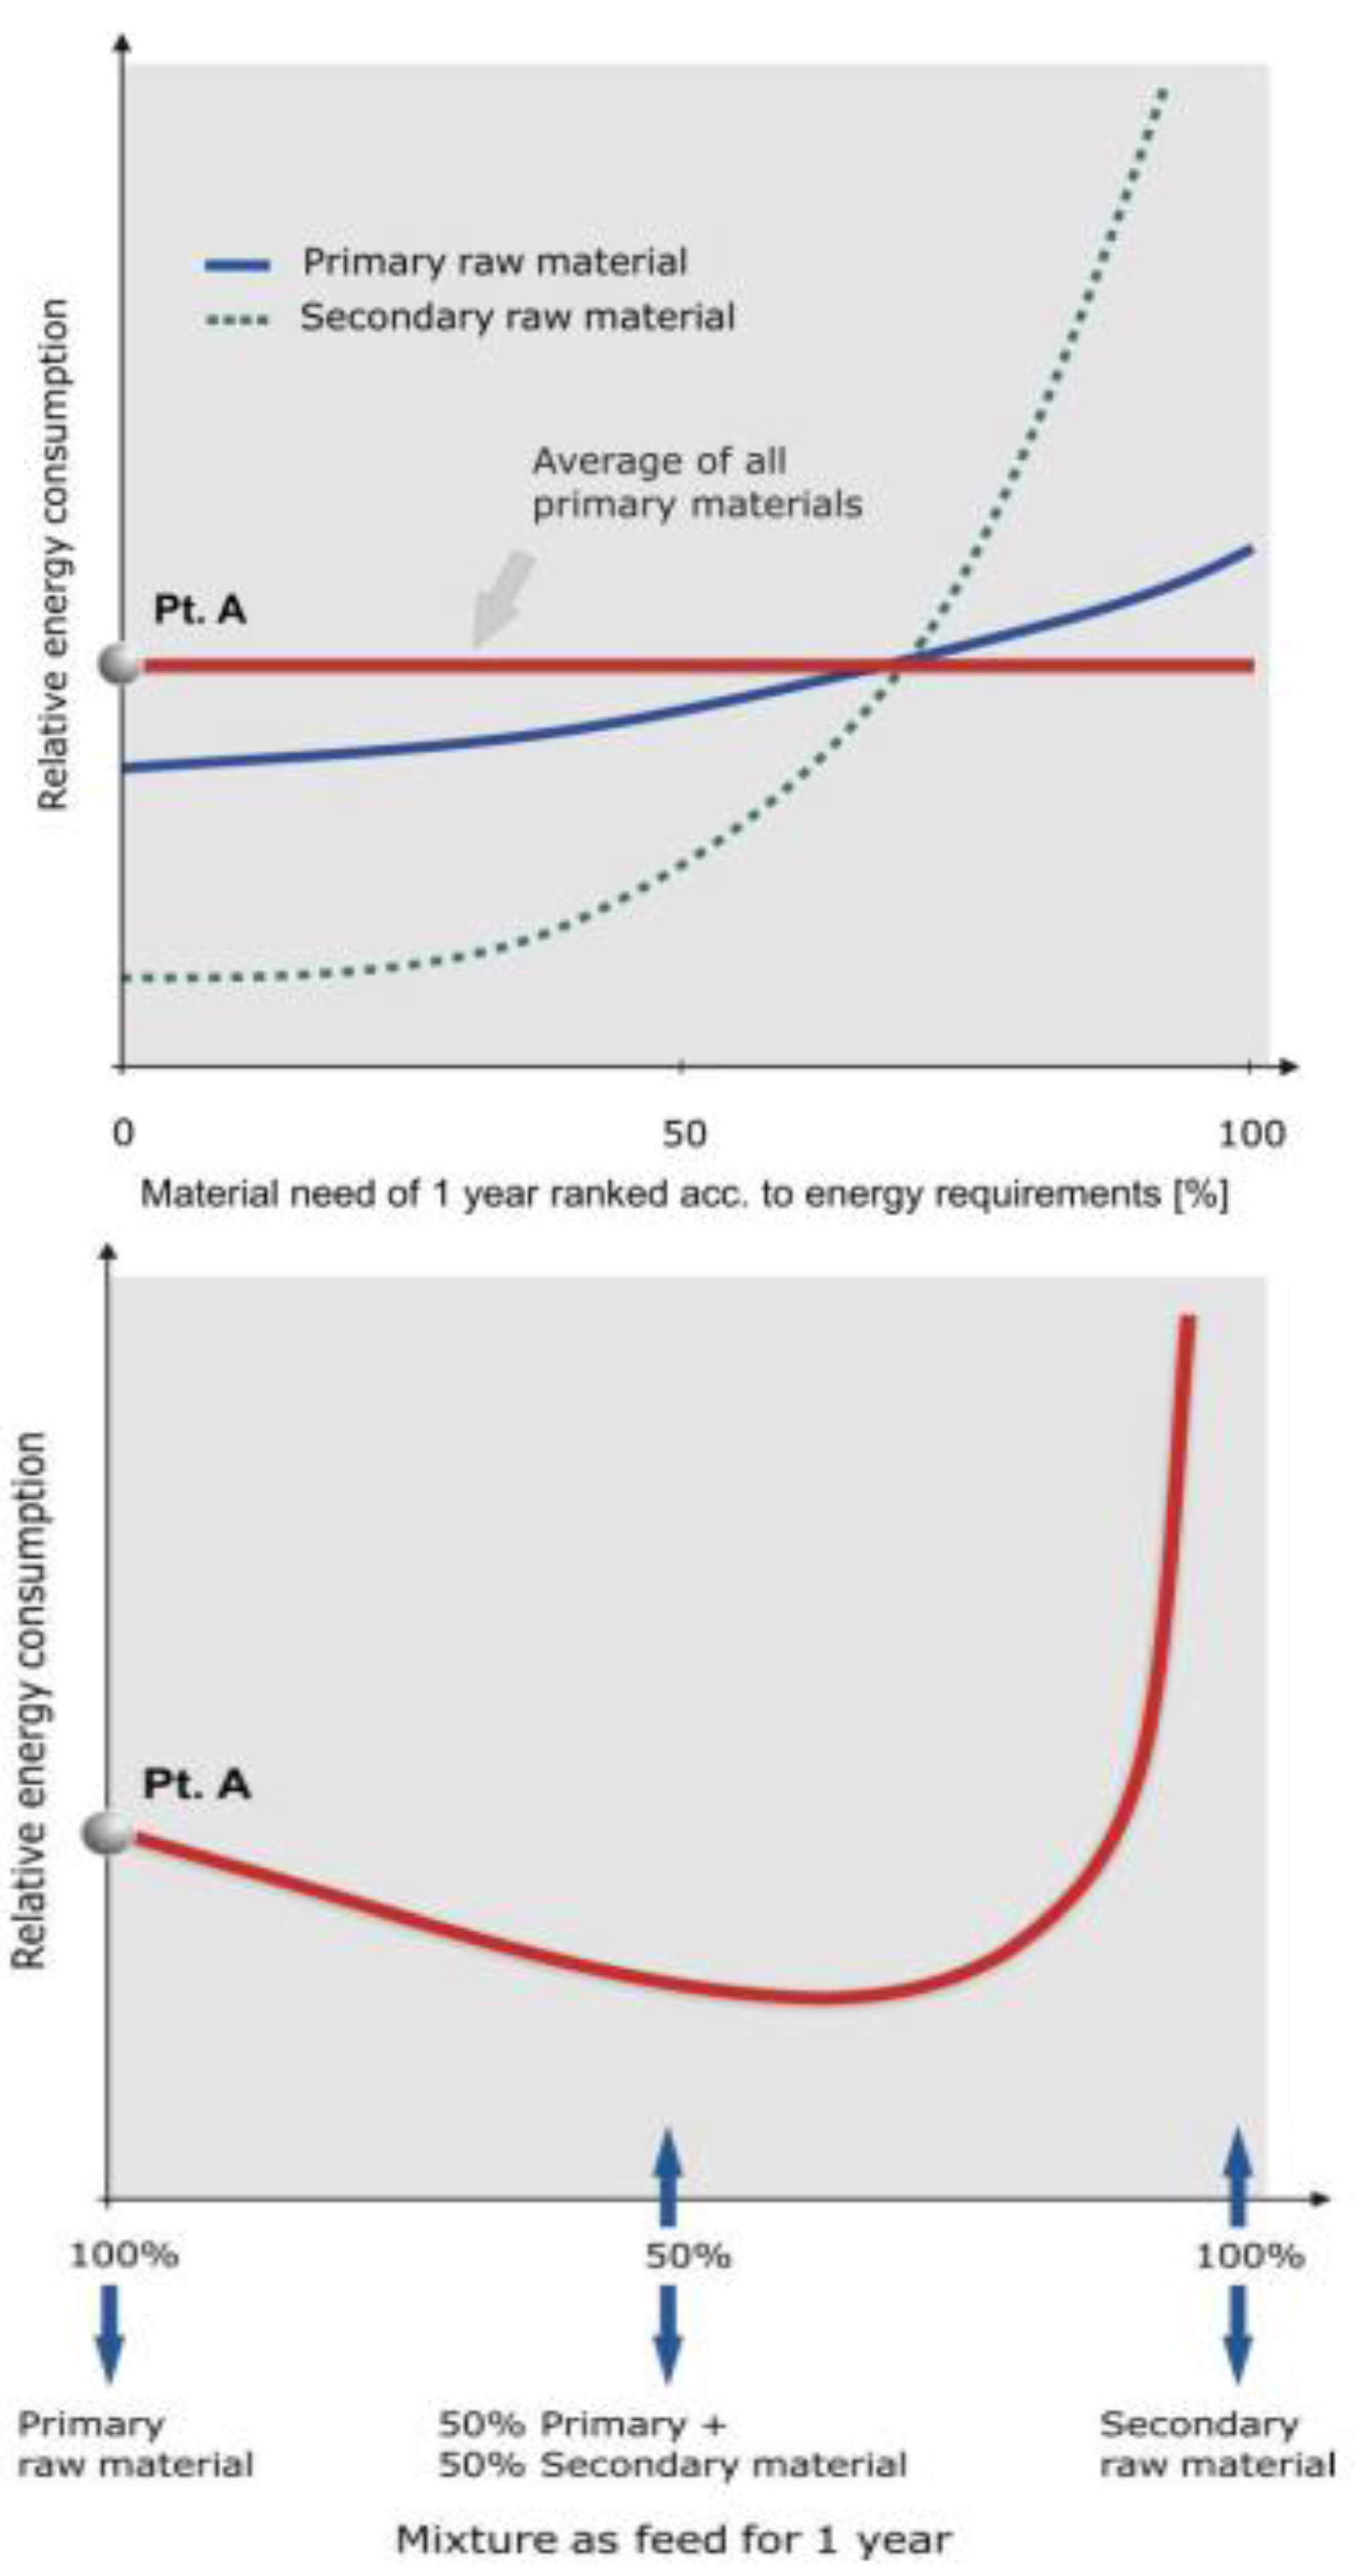
We group the available secondary material into numerous small increments. Each increment has a different energy requirement for recycling and remelting. We then rank the increments according to their energy requirements (the dashed line in
Figure 4a). On the left side we have pure scrap requiring the minimum amount of energy for resmelting, to the right we add the increments with increasing energy requirements, meaning scrap with lower and lower quality. Finally we include the material with dispersed metals or the example of platinum group metals in galvanic processes that together comprise the M
loss-3, and finally the highly dispersed M
loss-4 metals that end up in the environment, for which the energy requirements rise exponentially (
Figure 4a). The sum of all increments represents 100% of the metal pool in the technosphere which is not irrevocably lost due to laws of nature outlined above (impossibility of 100% recovery, losses due to differences in redox potential,
i.e., M
loss-1 and M
loss-2).
We now carry out a similar compilation with the available primary resources and create a pool which is as large as the M
scrap-pool in the technosphere (solid line in
Figure 4a). The highest grade deposits have the lowest energy requirements for producing marketable metal, but contributions from lower grade deposits will still be needed. This means more ore has to be mined,
i.e., a larger amount of energy input is necessary, in order to produce the same amount of metal. Again we group the available primary material into numerous small increments, each with different energy requirements and rank them accordingly. As a consequence, the energy requirement line for primary use rises slowly to the right in inverse proportion to the metal grade of the primary source (and other ore properties requiring higher energy input like more fine-grained ores, more intricate intergrowth of ore with waste minerals or ore from greater depth requiring more hoisting energy for underground deposits and more waste stripping for opencut deposits) (
Figure 4a).
If we overlay both lines, we find that they intersect. We can, therefore, conclude that it is possible to minimize energy requirements and CO
2-emissions by optimizing the mix of primary and secondary resources. The line for the energy requirement of the mix of primary and secondary sources is shown in
Figure 4b and starts at the right (100% primary material, 0% secondary material) at point A which is the average energy requirement of all primary materials in
Figure 4a. Moving to the right,
i.e., adding secondary material with lower energy requirements, the curve for the energy requirements of the mix in
Figure 4b decreases and reaches a minimum. In the theoretical case of
Figure 4a and b, the optimum mix is about 35% primary and 65% secondary material. In reality this comes close to the situation in Germany where the recycling rate for copper and lead is between 50 and 60%. A very detailed study about the recycling rate of aluminium in light-weight packaging material, one simple product, showed that the optimum recycling rate was 90%, not 100% [
25].
Figure 4.
Energy requirements for producing metals from a mixture of primary raw materials and of secondary raw materials [
26]. (4a) The energy requirements for producing metals either from primary or secondary raw materials. (4b) The energy requirements for producing metal from a mixture of primary and secondary materials.
A final comment concerning
Figure 4a: It can be expected that the intersection of the energy requirement lines for primary and secondary material will move to the right in future,
i.e., in future years the optimum will be obtained with more secondary and less primary materials. It can be envisioned that the energy requirement line for secondary material is unlikely to change very much in future, but the line for primary material will move up, because deeper and more difficult to beneficiate deposits will have be mined and one day lower grade deposits as well; although at the moment the tendency is the opposite for many commodities, very pronounced among others for iron [
27].
Besides energy minimization, there is another aspect of mixing primary material and secondary metals that plays a role in recycling: Industry needs metals with minimum quality standards which for base metals in international trade are specified by the metal exchanges, for example the London Metal Exchange LME [
28]. The tendency in our modern society to combine more and more elements to produce ever more sophisticated products, referred to above, produces far more complex “
deposits” in the technosphere than those found in the geosphere. These combinations become even more complex at the successive recycling stages. As Verhoef
et al. [
20] pointed out, the physical combinations and chemical compositions introduced in products and materials cause carry-over of impurities during recycling which results in off-specification in some secondary metals and alloys. Therefore, it is current practice to mix low-quality secondary metals with primary metals to prevent considerable losses and achieve optimized recycling rates. An example would be the recycling of many aluminium alloys which usually contain various amounts of silicon, zinc and copper. To bring such mixtures of alloys back to required specifications, they are either blended or diluted with wrought aluminium alloys with a lower and different alloying element level. Metallurgists use the term “solution by dilution” for this procedure [
29].
To better understand the contribution the technosphere can make towards satisfying market demand, we want to take a closer look at the relationship between market demand and the possibilities of supply from the technosphere.
5. Market Demand and Supply from the Technosphere
The market demands raw materials with minimum tight specifications and in the past it normally did not care whether the original material came directly from the geosphere or from the technosphere. Today more and more customers demand so-called “green materials” with a high recycled content to reduce the carbon footprint of the final product. But in the process of smelting and refining, material flows from the geosphere and from the technosphere frequently mix. Therefore, in a free market system recycled materials always compete with primary materials, which is why governments endeavor to set framework legislation to encourage recycling. All industrialized nations have programs trying to optimize the waste streams. The Japanese “3R”initiative (reduction, re-use, recycling) is an example [
30]. In Germany there is the “Waste Avoidance, Recovery, and Disposal Act” [
31]. This waste management act maximizes the rate of recycling within a framework of high energy prices and strict control of dangerous residues. Residues for disposal are penalized, thus creating an incentive either to find alternatives or to avoid or to re-use the residues.
Basically there is competition between secondary and primary materials. If there were enough scrap with lower energy requirements than primary ore, pure scrap would always be the preferred source. This availability of scrap is, however, limited and
Figure 5 shows one major reason why. We are living in a world with ever increasing raw material use, even in highly industrialized countries. Let us take as an example use of copper in Germany. The used scrap—not fabrication scrap such as metal shavings produced in machine shops that has not seen a life cycle and goes back directly into the process chain—has gone through a life cycle. The life cycle for copper products lasts normally between 30 and 50 years. Let us assume a life cycle of 40 years. Today, copper use in Germany is 1.4 million tonnes, double of what it used to be 40 years ago at almost 700 thousand tonnes. If we assume an optimistic collection rate of 80% and also optimistically assume nothing is lost in chemicals
etc. there would be only 560 thousand tonnes available as scrap today,
i.e., the technosphere could only cover 40% of demand.
The consequence is that as long as we have growing consumption rates, we will always be short of secondary material.
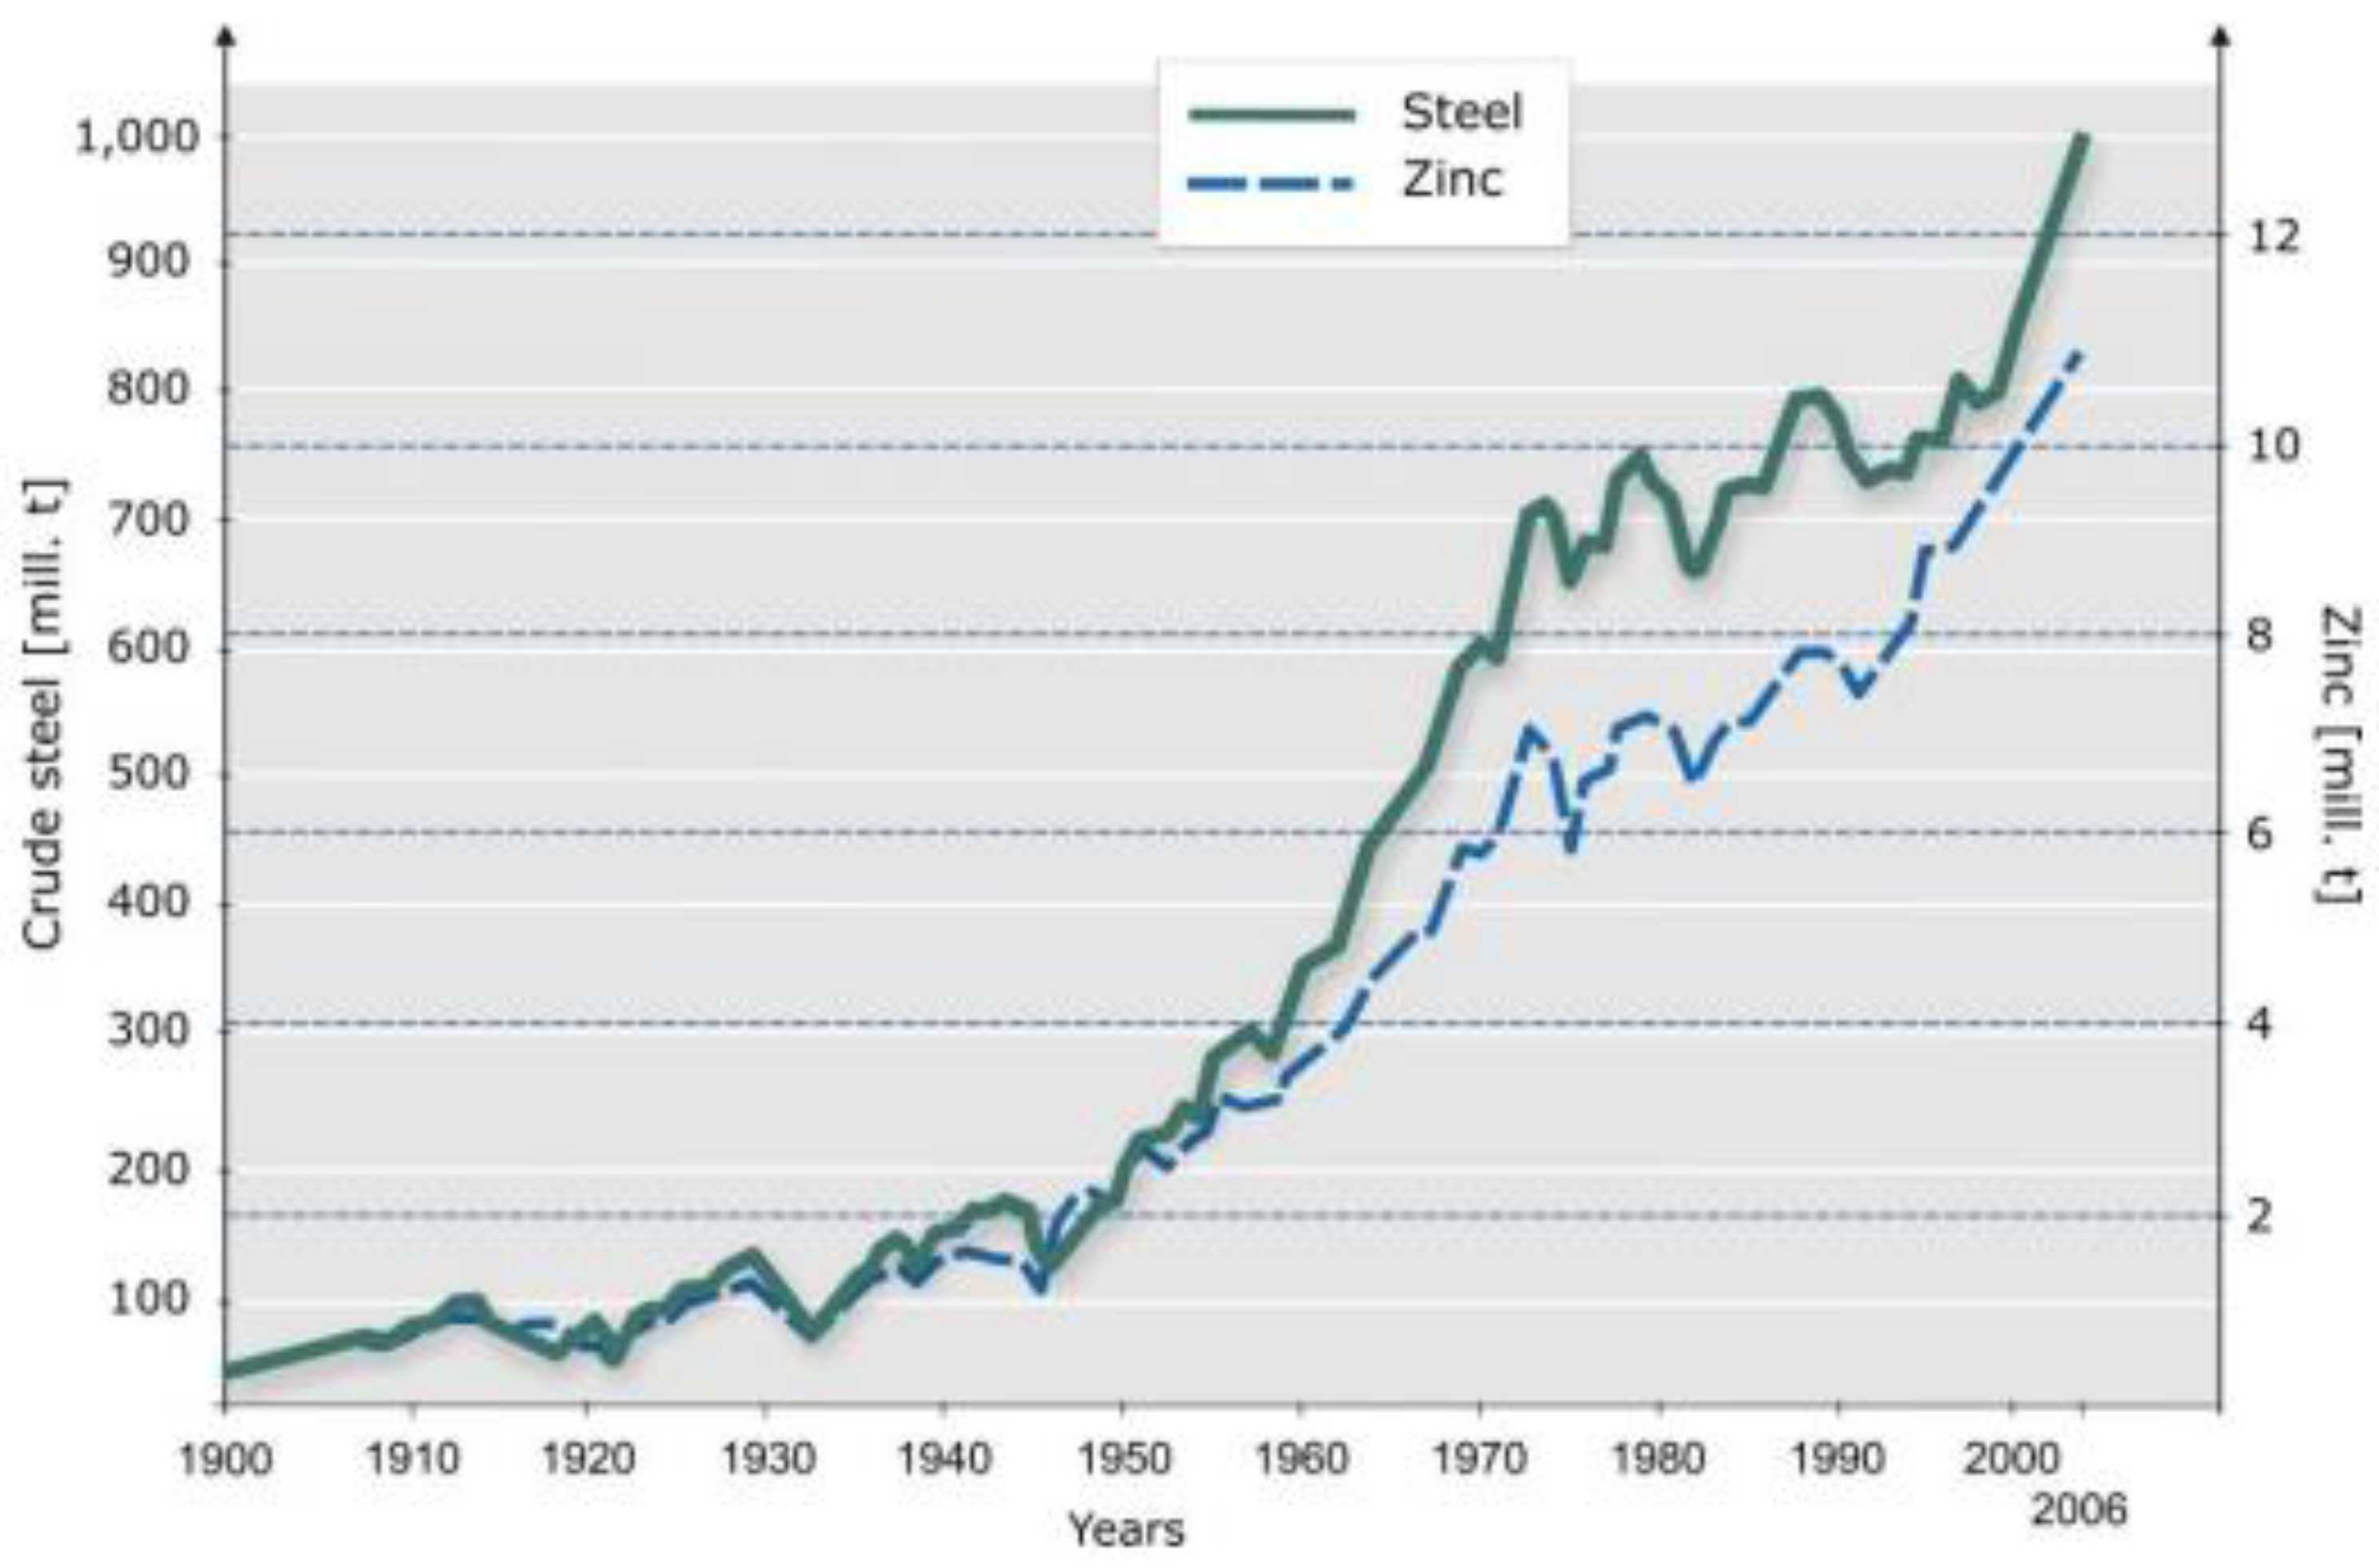
But one can envisage a different future. Consumption patterns for all raw materials follow a learning, or experience, curve respectively [
5]: A slow start, a period of high growth and then a levelling off. This can very well be seen with zinc and is even more pronounced with steel (see
Figure 5). The flattening of steel and zinc consumption in the nineties of the last century has now been overtaken by a new surge in growth rates due to high growth rates, mainly in China, followed by India and Brazil. One can envisage a future world in which about 80% of the world would have caught up with the level of development of the industrialized nations as at the turn of the millennia. It is conceivable that in such a future, the world economy may reach a stage at which total demand and secondary material supply from historical consumption are in balance as a result of levelling-off of growth rates of consumption (see
Figure 6).
Figure 5.
Worldwide production of steel and consumption of zinc 1900 to 2005 [
5].
Figure 5.
Worldwide production of steel and consumption of zinc 1900 to 2005 [
5].
Here, the lead market can be a model [
32]. Most lead is used for lead-acid batteries in which the lead is not diluted or dispersed but concentrated as elemental lead in the electrode plates and is easily recyclable. By far the biggest source of lead scrap is the battery market. In industrialized countries the lead market is more or less stagnant and fluctuates with the demand of the car industry. The life time of lead batteries normally lies between five and seven years. The recycling rates in industrialized countries approach 100%. A recent study for the USA, for example, showed a recycling rate of 99.2% for the period 1999 to 2003 and 96% for the period 2004 to 2008 [
33]. So we have a model for the flat part of the idealized growth curve in
Figure 6: No growth, short life cycle.
Table 2 compares the total German consumption of lead in batteries with the amount of lead available from recycling. It becomes obvious that during the period from 1998 to 2003, for which satisfactory recycling figures are available, practically the total demand for lead in batteries could be supplied by recycled lead. Over the seven years from 1998 to 2003, the balance between demand for lead in batteries and supply from recycled lead practically evens out.
Figure 6.
Idealized growth curve of commodities illustrating constraints of possible quantities for recycling. Case 1: Times of growing consumption mean a deficit of theoretically available secondary material at a later date. Case 2: Times of constant consumption mean that at a later date there is theoretically the same amount of secondary material available as at the beginning of the life time of the products.
Table 2.
German consumption of lead in batteries and supply of recycled lead [
34,
35].
Table 2.
German consumption of lead in batteries and supply of recycled lead [34,35].
| Year | Supply Lead in batteries (in 1000 t) | Demand Recycled lead (in 1000 t) | Difference in percent (relative to need for batteries) |
|---|
| 1998 | 182 | 200 | +9.0% |
| 1999 | 198 | 201 | +1.5% |
| 2000 | 214 | 227 | +6.1% |
| 2001 | 244 | 226 | –7.4% |
| 2002 | 232 | 247 | +6.5% |
| 2003 | 247 | 230 | –6.9% |
| Balance over 6 years | 1,317 | 1,331 | +1.1% |
6. Outlook—What Is Critical for Achieving Sustainability with Regard to Non-Renewable Resources?
By using metal resources from the geosphere, humans create an ever increasing pool of metals in the technosphere as a source of “renewable resources”. When the consumption rate stagnates (see
Figure 6), equilibrium is possible. In such an equilibrium the majority of metals can be sourced in the technosphere. However, production from the geosphere will always be necessary in order to compensate for losses, to deliver high grade quality for applications which cannot be supplied by secondary downgraded material or as a base load supply with minimum impurities e.g., in the case of aluminium or magnesium to blend with diluted secondary material in order to maximize recovery rates in the technosphere.
When the world reaches this stage of dynamic adjustment between geosphere and technosphere and we further take into account that humans have a choice because they do not need a raw material as such, but rather an intrinsic property of that material to fulfil a function, a scenario can be envisaged that metals as so-called non-renewable resources can satisfy the condition of sustainability and intergenerational fairness of Brundtland [
2], Solow [
3] and Ernst [
4] as defined above. However, there are two essential conditions:
Enough energy must be available at affordable prices;
Ingenuity is required to find innovative solutions for functions, to optimize processes, to minimize losses in the technosphere and to avoid dissipation.
As explained above, energy from fossil fuels is irrevocably consumed and thus irretrievable. Wagner and Wellmer [
5], therefore, proposed a hierarchy of natural resources with respect to sustainable development as a basis for a natural resources efficiency indicator (
Figure 7). According to this concept, sustainable development implies substituting materials at a higher level of the hierarchy, either by material from a lower level, or by resources from the technosphere that replace resources from the same level in the geosphere. Energy resources occupy the highest level of the four-level hierarchy. The next hierarchy level is represented by non-energy raw materials that are derived from occurrences that developed over geological time and were formed by natural enrichment (e.g., all metal deposits and some non-metallic deposits such as phosphate). This level also includes those deposits of the technosphere which can be recycled. The third level comprises materials available in almost unlimited amounts on Earth, such as granite, sandstone and clay, but also those raw materials which can be produced from air (e.g., nitrogen fertilizer), or from sea water (e.g., boron, potassium or magnesium). Wood used for construction purposes is included in this third level because it is a renewable resource. It has to be pointed out, however, that wood can become a limited resource as well if demand rises. The lowest level represents waste and residue materials from the technosphere that are potential raw materials for secondary use.
Included under energy resources at the top of the hierarchy are all fossil fuels of enrichment deposits: Oil, natural gas, and coal, as well as uranium as fuel for nuclear power stations. All sources of energy can produce directly or indirectly light, heat, and power by generating electricity and are therefore in principle interchangeable. They, therefore, have the highest potential of “substitutionability” Of course, for attaining sustainability we have to work towards the ultimate goal of exclusive use of renewable energies as fossil fuels and nuclear power can only be bridging technologies. The potential exists everywhere in the world to progress on the path towards a world of renewable energy. The potential is huge, exceeding by far our needs. Even in Germany, with its low-enthalpy geological environment lacking active volcanism and concomitant natural steam generation, the renewable energy potential of geothermal energy alone is 500-times greater than the actual demand of heat and electricity [
36]. For the USA, a recent study concluded that in crystalline basement rock formations at depths between 3 and 10 km, the energy potential that can theoretically be exploited by “Enhanced Geothermal Systems” is 13,000-times greater than the annual energy consumption of primary energy for the entire country was in 2005 [
37]. Even if we have to accept that according to the second law of thermodynamics only a fraction of the
in situ energy can be won by deep drilling and hydrofracturing of large volumes of rock, a vast energy potential remains. In addition, solar power is available in every corner of the world. Solar insulation is three-to-four orders of magnitude larger than terrestrial heat flow.
Figure 7.
Four-level hierarchy of natural resources with respect to sustainable development.
Figure 7.
Four-level hierarchy of natural resources with respect to sustainable development.
Human ingenuity and creativity is the second prerequisite to reach sustainability for natural resources. In general, we have to rely predominantly on the geosphere for our raw material supply until a recycling equilibrium is reached at a level at which “renewable resources” of the technosphere can supply the bulk of the market requirements (see
Figure 6). As outlined above, the mineral resources—with the exception of the agricultural fertilizer mineral resources—are not needed as such, but for the fulfilment of functions. So the task is to find solutions to functions. The stimulus to find new solutions comes from two main sources. On the one hand, human curiosity about the unknown and ingenuity urges man to develop new methods, instruments, technologies, and processes. Such creativity for finding solutions can also be prompted by changes in government regulations, for example in the environmental field new regulations for reducing emissions or requiring higher efficiencies. On the other hand, the profit incentive motivates innovation. When there is a shortage of a commodity in a market economy, prices will rise, triggering the feed-back control system of raw materials supply [
38]. The expectation of high returns will encourage inventiveness and creativity to find new solutions. On the supply side this will include the discovery of and production from new deposits, and improvement of recycling rates, leading to a reduction of losses of M
loss-3. M
loss-3 was defined above as covering losses which occur because the scrap value is too low and/or the technology is not available or not efficient enough to recover the metals under market economy conditions. Innovation can also mitigate downgrading and thereby optimize gains from the technosphere. On the demand side this is supported by the initiation of new and more efficient manufacturing processes, development of substitution technologies, material savings, and the invention of entirely new technologies that provide the same functions without the need of using scarce materials, thereby improving the natural resources efficiency. The effectiveness of the price feed-back control cycle has been illustrated by Wellmer and Becker-Platen [
39] and Wellmer [
6], using as examples the molybdenum and cobalt price peaks of 1978, and by ETH-NSSI [
40] using the tantalum peak of 1980. In many cases the price mechanism works so well that prices may even fall back below the former level, after the control mechanism is triggered by a price peak. This happened with molybdenum after its price peaked at the end of the 1970’s [
5]. This corresponds to the opportunity cost concept taking into account the inherent dynamics of market forces and technological developments towards changing and continuous demand [
41,
42]. The interplay of prices and costs has recently been investigated for lithium [
43] which is considered a high technology element used in lithium-ion-batteries, and a candidate for possible future mass applications in electric cars [
44].
The above examples demonstrate that finding new deposits is one—but not the only—way to alleviate scarcities. The price mechanism driving the feed-back control system of raw material supply also drives the exploration process. This is the reason why the reserve/consumption (R/C) ratio, the so-called lifetime of reserves so often quoted, is a misleading figure. These R/C-numbers are only a snapshot of a dynamic development in the ongoing process of exploration [
6,
45]. Reserves, which is the share of total resources that can be economically extracted with current technology, and resources, known but not economically extractable at present, are dynamic quantities. Through active exploration and improved technology geo-potentials and resources are transferred into reserves. Reserves are known to grow in step with increasing consumption. Therefore, the reserve/consumption (R/C)-ratio is not the “lifetime of reserves”, but an equilibrium value, typical for each commodity. For crude oil, for example, the R/C-ratio has a value of about 40, for zinc and lead of between 20 and 25. Both are ratios which have either improved in favor of reserves within the last 50 years or stayed constant without leading to shortages despite a significant growth in consumption. As an example, this is shown for oil in
Table 3.
Table 3.
Growth of reserves—the example of crude oil.
Table 3.
Growth of reserves—the example of crude oil.
| | Production | Reserves | R/C-ratio |
|---|
| 1950 | 543 Mio t | 11,277 Mio t | 20 |
| 2008 | 3,900 Mio t | 159,870 Mio t | 41 |
The feed-back control system of raw material supply driven by price incentives is also the mechanism that in the end leads to state of equilibrium when the bulk of metals will be obtained out of the technosphere rather than from the geosphere. In a market economy those raw materials will be taken as sources for new metals which minimize costs. In times of high energy prices and under normal circumstances this will mean minimizing energy input. As shown above metals from the technosphere offer such opportunity.
Human creativity is also the solution for the future availability of the agricultural fertilizer phosphate. As mentioned above, the concept of finding different solutions does not work for the essential agricultural fertilizers nitrogen, potassium, and phosphate. The plants need these elements as such for their metabolism and substitution is not an option. For nitrogen and potassium this is not a problem because the atmosphere is an inexhaustible source of nitrogen and oceans are full of potassium. Phosphate is different since there is no unlimited reservoir. However, phosphate has one major advantage that can be exploited to achieve more efficient use. Unlike potassium, the solubility and therefore mobility of phosphates is very low. Therefore, with improved fertilizing technology sustainability can be attained for phosphates also: by adding just the right amount the plants need through computerized precision farming, by improving the phosphate uptake of animals (for example via the enzyme phytase), and by improved recycling of waste and manure. The utilization of phosphate could theoretically develop into a complete and nearly closed cycle as far as thermodynamics allow [
46].
It has been argued that the price feed-back control cycle does not work for many electronic and technology by-product metals, such as indium, germanium, selenium, gallium, iridium or ruthenium which frequently are very important raw materials for harnessing renewable energies like for solar energy the above mentioned component CIGS/CIS (copper-indium/gallium selenide = Cu(In,Ga)Se
2 ). If substitution is possible, the substitute mostly is also a by-product element. Because of their by-product character the supply of these metals is price-inelastic to a large degree [
11]. The supply is controlled by the production of the main carrier elements. This could be zinc in the case of indium and germanium or platinum and palladium, or even nickel in the case of the platinum-group metals iridium and ruthenium. This is certainly true in the short run. In the long run, however, if prices will rise high enough, markets will reorient to obtain the maximum return. This can well be seen, for example, in the market development of rare earth elements (REE). REE are a group of 15 elements that occur together in ratios specific for each deposit. They are “coupled” elements with their typical balance problems [
6]. Due to deposit-specific fixed ratios the quantities produced are not in agreement with market demand. In consequence, there is one element which is the “driver” for the production. Today it is neodymium, but it used to be europium, then later samarium or cerium;
i.e., market requirements can cause reorientation of production of technology metals also. [
47]. In the case of the platinum group metal (PGM) ruthenium, Wellmer [
6] pointed out that PGM deposits exist which are ruthenium dominated and could be brought into production if prices are satisfactory for an investment decision.
In applying human ingenuity and creativity to finding new solutions for functions and to satisfying raw materials requirements we have to allow time for the learning process. The authors are not of the opinion that an ingenuity gap (in the sense of Homer-Dixon [
48]) exists. However, on the way to discovering new solutions, time may be the scarcest commodity to climb these learning curves. Frequently, a period of 20 years is needed for finding new industrially feasible solutions. An example from renewable energies may illustrate the gradient of learning curves in this regard:
In 1983 the German Federal Ministry of Research and Technology hoped to make a quantum jump in renewable energy generation and developed a large 3-megawatt wind turbine, the Growian-project, constructed by a consortium of large German aerospace companies. It never worked satisfactorily for any period of time and the project had to be abandoned. This unsuccessful attempt was followed by new small- to medium-sized enterprises which initially developed smaller wind turbines that worked well. It took 20 years to learn from the mistakes and climbing up the learning curve before 3-megawatt-sized units became a success [
46]. Today, 5-megawatt wind turbines are operating and about 7% of electricity consumption was generated by wind power in 2007 in Germany.
It should be pointed out, that a recent study listed other elements that are expected to become critical for the metal supply in the future: not only energy, but also water and land requirements [
49]. The two latter factors apply mostly to primary resources, especially when in competition with a growing population which is discussed in the following chapter. The authors of this paper, however, are of the opinion that as far as water for mining and beneficiation is concerned a combination of energy (e.g., desalination) and innovation can find new and better solutions. In arid and semiarid regions there are examples of saline or brackish water that is mostly available in these places being used for beneficiation or of pipelines bringing water over long distances from surplus areas to mining areas. Water from the Perth area in Western Australia, for instance, is piped to the Eastern Goldfields around Kalgoorlie.


