Performance Evaluation of Industrial Land Policy in China


Abstract
:1. Introduction
2. Method

2.1. Industrial Land Equivalent
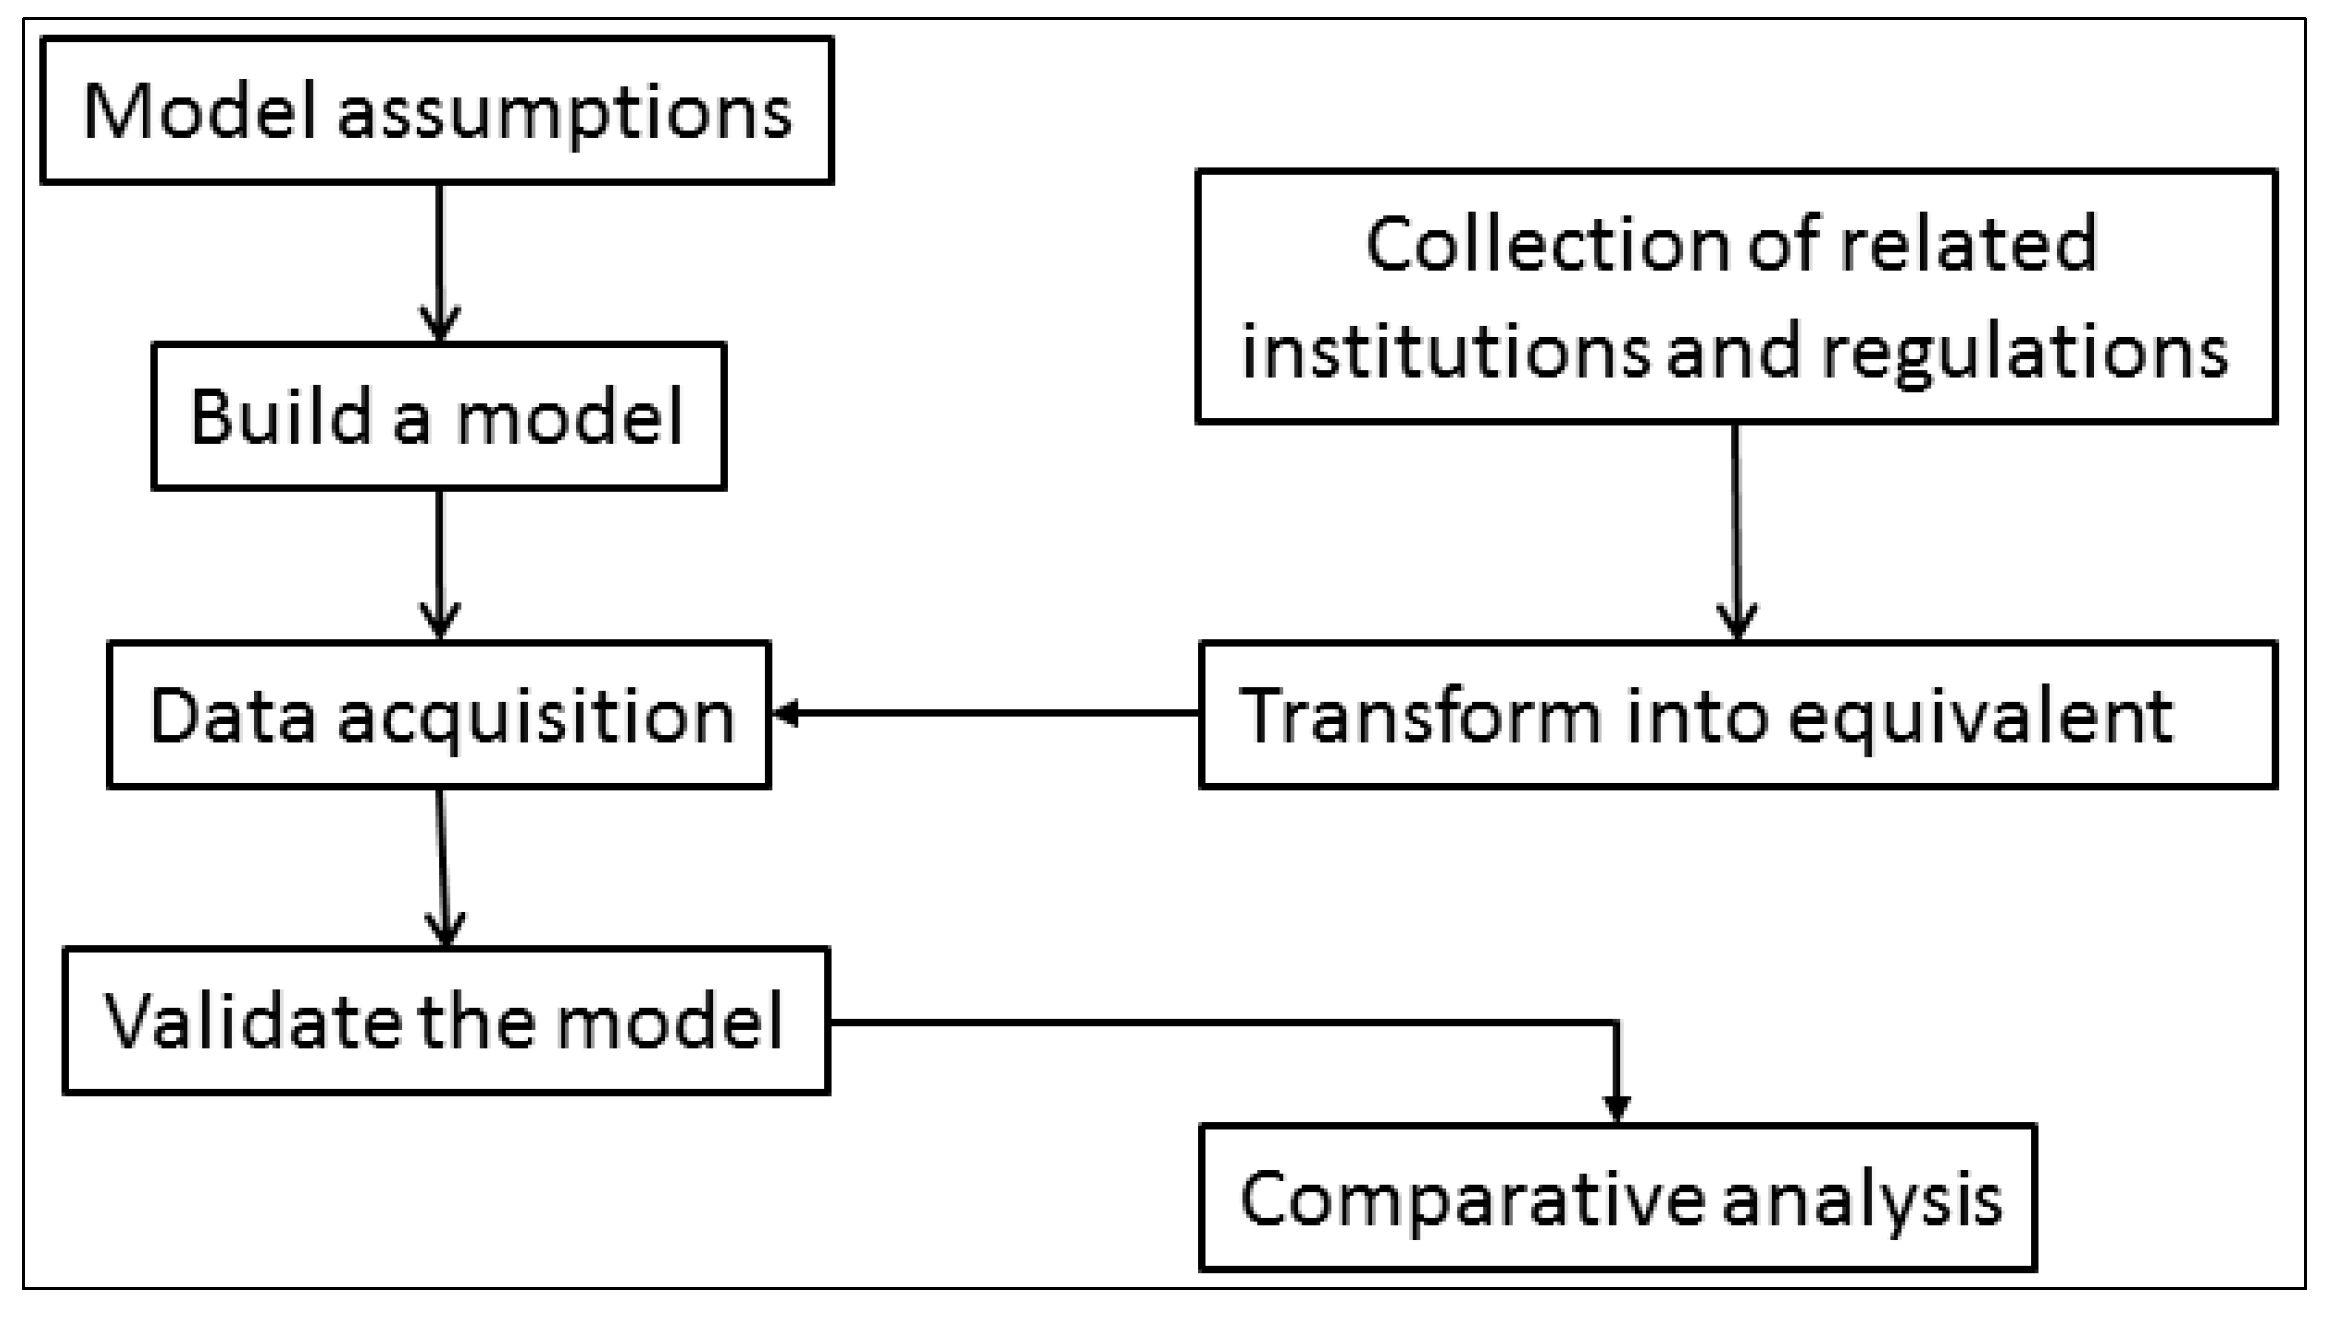
2.2. Methods of Industrial Land Policy Evaluation

2.3. Industrial Land Policy Evaluation Model Building
3. Results and Discussion
3.1. The Results Testing
3.1.1. Acquisition and Processing of Data

| Year | Name | ILE Value | Accumulative Value |
|---|---|---|---|
| 2001 | Notice of the State Council on Strengthening the Management of the Assets of State-owned Land | 0.5 | 0.5 |
| 2002 | Regulation of Granting the Stated-owned Land Use Rights by Tender, Auction or Listing | 1.0 | 1.5 |
| Notification of Implementation of Commercial Land Use Right by Tender, Auction or Listing Strictly | |||
| 2003 | Provisions on the Agreement-based Assignment of the Right to Use State-Owned Land | 0.5 | 2.0 |
| 2004 | A Decision About Deepening Reform and Strict Land Management | 1.0 | 3.0 |
| 2005 | - | 0.0 | 3.0 |
| 2006 | Circular of the State Council on Intensifying the Land Control | 1.0 | 4.0 |
| 2007 | Notice of the Ministry of Land and Resources and the Ministry of Supervision on the Relevant Issues Concerning the Implementation of the Assignment System of Industrial Lands by Means of Public Bidding, Auction and Quotation | 1.0 | 5.0 |
| 2008 | - | 0.0 | 5.0 |
| 2009 | A Notice Issued From the Ministry of Land and Resources and Ministry of Supervision About Further Implementing the Industrial Land Granted Regulation | 0.5 | 5.5 |
| 2010 | - | 0.0 | 5.5 |
| Year | Name | ILEValue | Accumulative Value |
|---|---|---|---|
| 2001 | Notice Issued From Ministry of Land and Resources About Rectifying and Standardizing the Land Market | 1.0 | 1.0 |
| Measures of the Ministry of Land and Resources on the Administration of Preliminary Examination of the Land Used for Construction Projects | |||
| 2002 | - | 0.0 | 1.0 |
| 2003 | The Urgent Notice About Checking All Kinds of Land Use to Strengthen the Regulation of the Supply of Land | 2.5 | 3.5 |
| A Work Program for Further Rectification of the Order of Land Market | |||
| An Urgent Notice About Suspension of Various Development Zones | |||
| A Notice of Straighten Out the Types of Development Zones to Strengthen the Management of Construction Land | |||
| An Urgent Notice About Improving the Work and Further Rectifying the Land Market Order | |||
| 2004 | Circular of the Ministry of Land and Resources on Promulgating and Implementing Controlling Index for Industrial Projects Construction Land Utilization (for Trial Implementation) | 0.5 | 4.0 |
| 2005 | Several Suggestions For Promoting the Developmental Level of National Economic and Technological Development Zone | 0.5 | 5.0 |
| 2006 | A Notice About Accelerating the Restructuring of the Aluminum Industry | 4.5 | 9.5 |
| A Notice About Accelerating the Restructuring of the Flat Glass Industry | |||
| A Notice About Accelerating the Restructuring of the Cement Industry | |||
| A Notice About Printing and Distributing the “11th Five-Year Plan about Economic and Social Development of National Economic and Technological Development Zone” by the Ministry of Commerce and the Ministry of Land and Resources | |||
| Notice on the Issuance and Implementation of the National Standards for the Minimum Transfer Prices of Land for Industrial Purposes | |||
| An Urgent Notice About Further Strict Land Management | |||
| An Urgent Notice About Preventing the Illegal Use of Land | |||
| 2007 | Circular of the Ministry of Science and Technology, National Development and Reform Commission, the Ministry of Land Resources, the Ministry of Construction on Printing and Transferring Several Opinions on Promoting Development Zone for New and High Technology Industries to Further Develop and to Increase Independent Innovation Capacity | 0.5 | 10.0 |
| 2008 | Administrative Measures for the Pre-examination on the Use of Land for Construction Projects (2008 Amendment) | 1.0 | 11.0 |
| Notice of the State Council on Promoting the Land Saving and Intensive Use | |||
| 2009 | Notice of Ministry of Land and Resources about adjusting the lowest price standard of industrial land | 2.0 | 13.0 |
| Notice about Implementing the Suppression Part of Industry Overcapacity and Redundant Construction, guiding to Healthy Industry Development | |||
| Notice of the Ministry of Land and Resources about Strict Construction Land Management, Promoting the Use of Approved Land | |||
| 2010 | - | 0.0 | 13.0 |
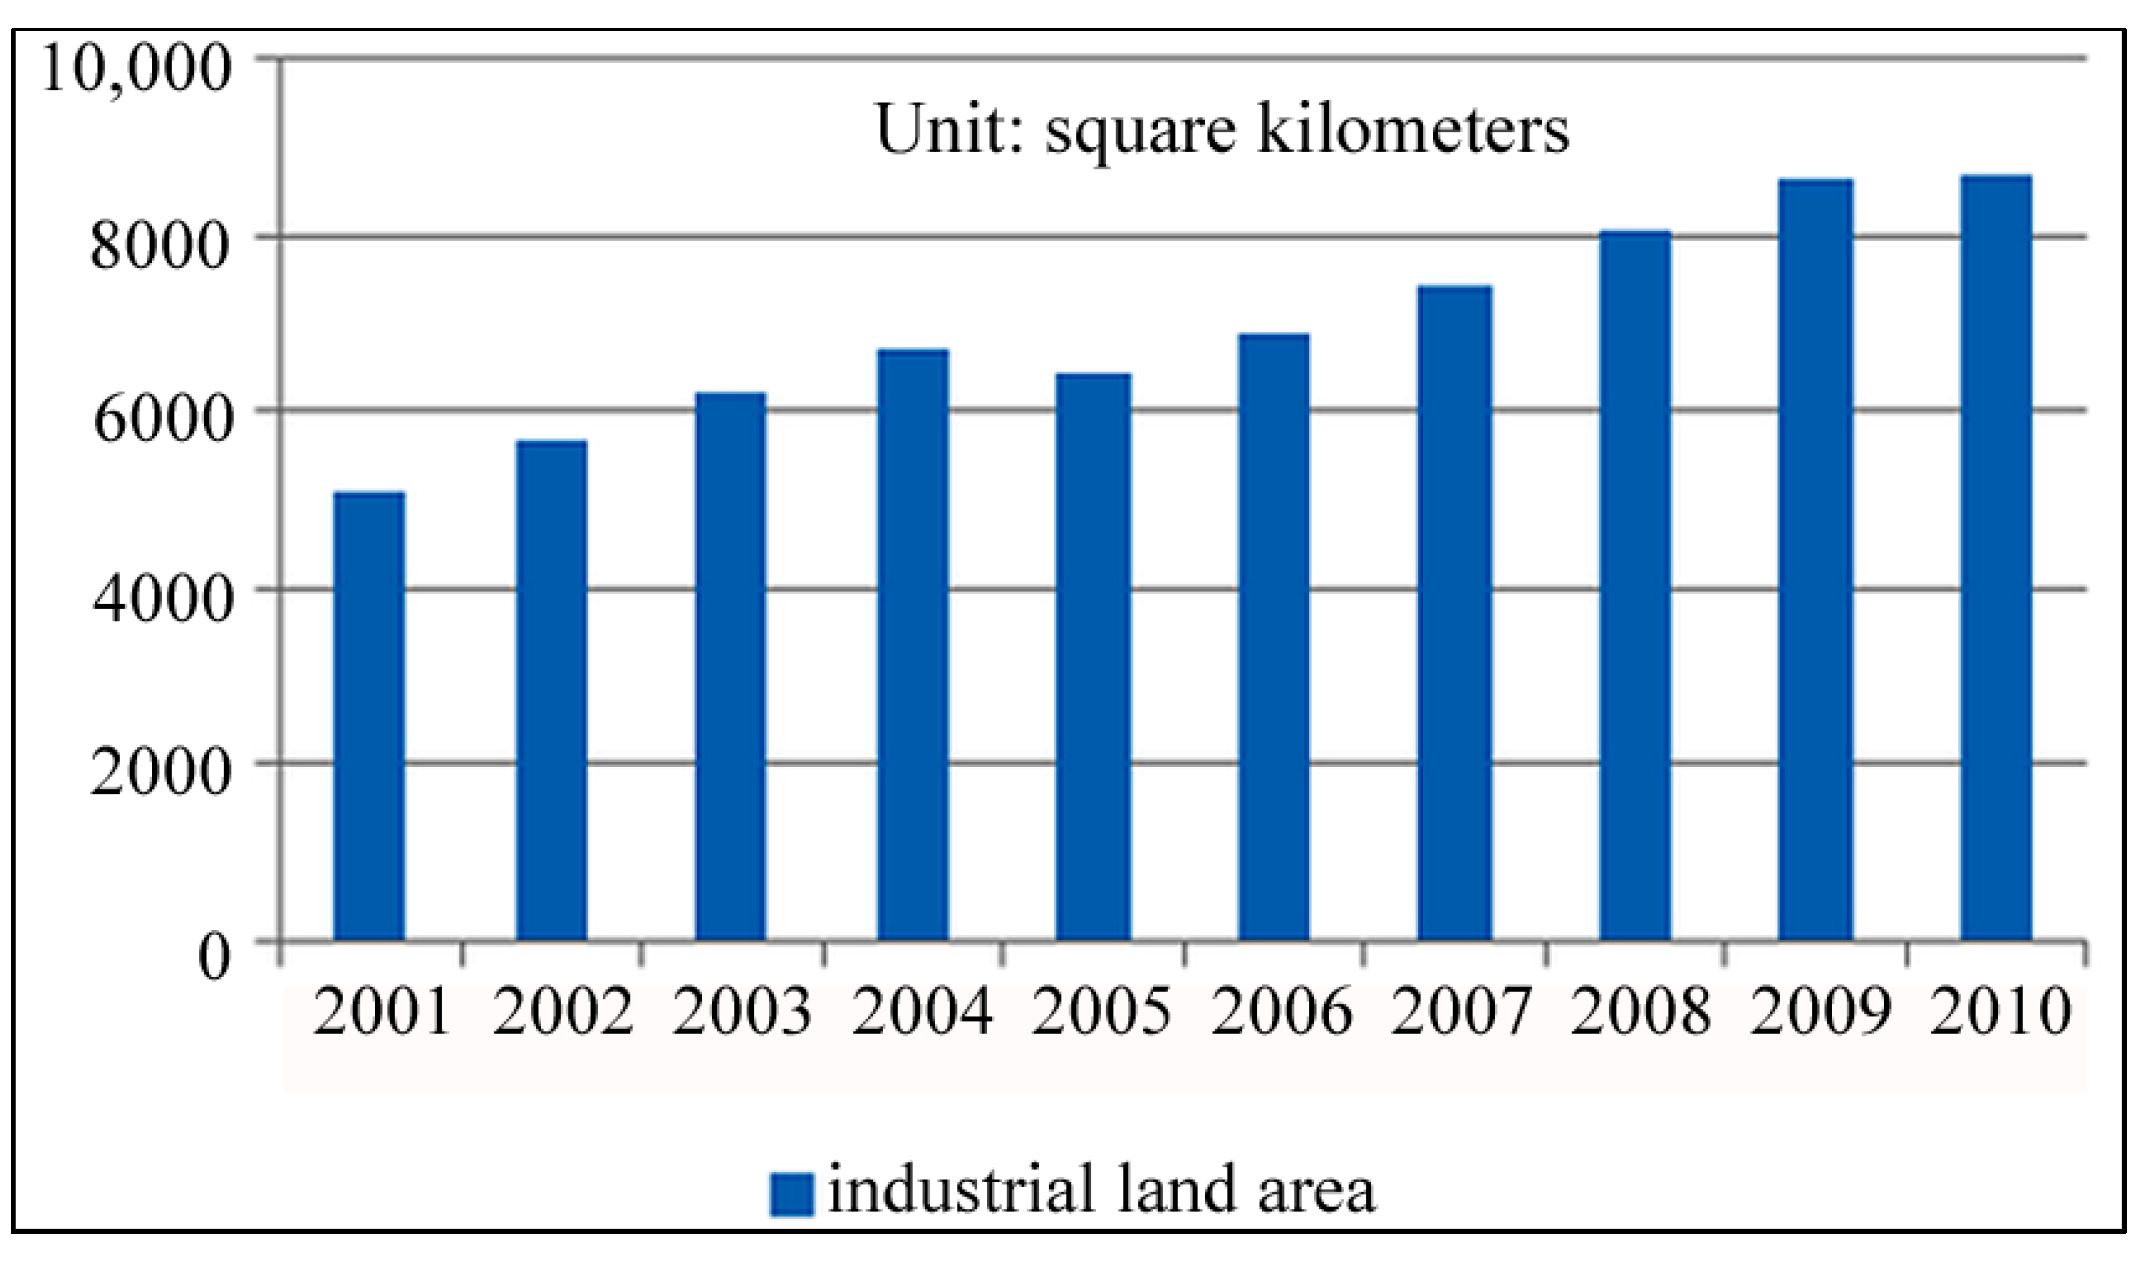
| Year | Industrial GDP (One Hundred Million Yuan) | Industrial Fixed Investment (One Hundred Million Yuan) | The Number of Industrial Employees (Ten Thousand) | Industrial Land Area (Square Kilometers) | Industrial Land Institution | Industrial Land Regulation |
|---|---|---|---|---|---|---|
| 2001 | 43,580.6 | 4244.3 | 5559.4 | 5104.7 | 0.5 | 1.0 |
| 2002 | 47,431.3 | 4349.9 | 5441.4 | 5664.6 | 1.5 | 1.0 |
| 2003 | 54,945.5 | 20,427.1 | 5520.7 | 6224.6 | 2.0 | 3.5 |
| 2004 | 65,210.0 | 27,776.5 | 5748.6 | 6708.6 | 3.0 | 4.0 |
| 2005 | 77,230.8 | 37,717.8 | 6622.1 | 6418.4 | 3.0 | 5.0 |
| 2006 | 91,310.9 | 47,353.2 | 6895.9 | 6867.1 | 4.0 | 9.5 |
| 2007 | 110,534.9 | 59,851.5 | 7358.4 | 7446.0 | 5.0 | 10.0 |
| 2008 | 130,260.2 | 75,405.4 | 7875.2 | 8035.2 | 5.0 | 11.0 |
| 2009 | 135,239.9 | 94,258.3 | 8831.2 | 8626.7 | 5.5 | 13.0 |
| 2010 | 160,867.0 | 104,298.9 | 9544.7 | 8689.5 | 5.5 | 13.0 |
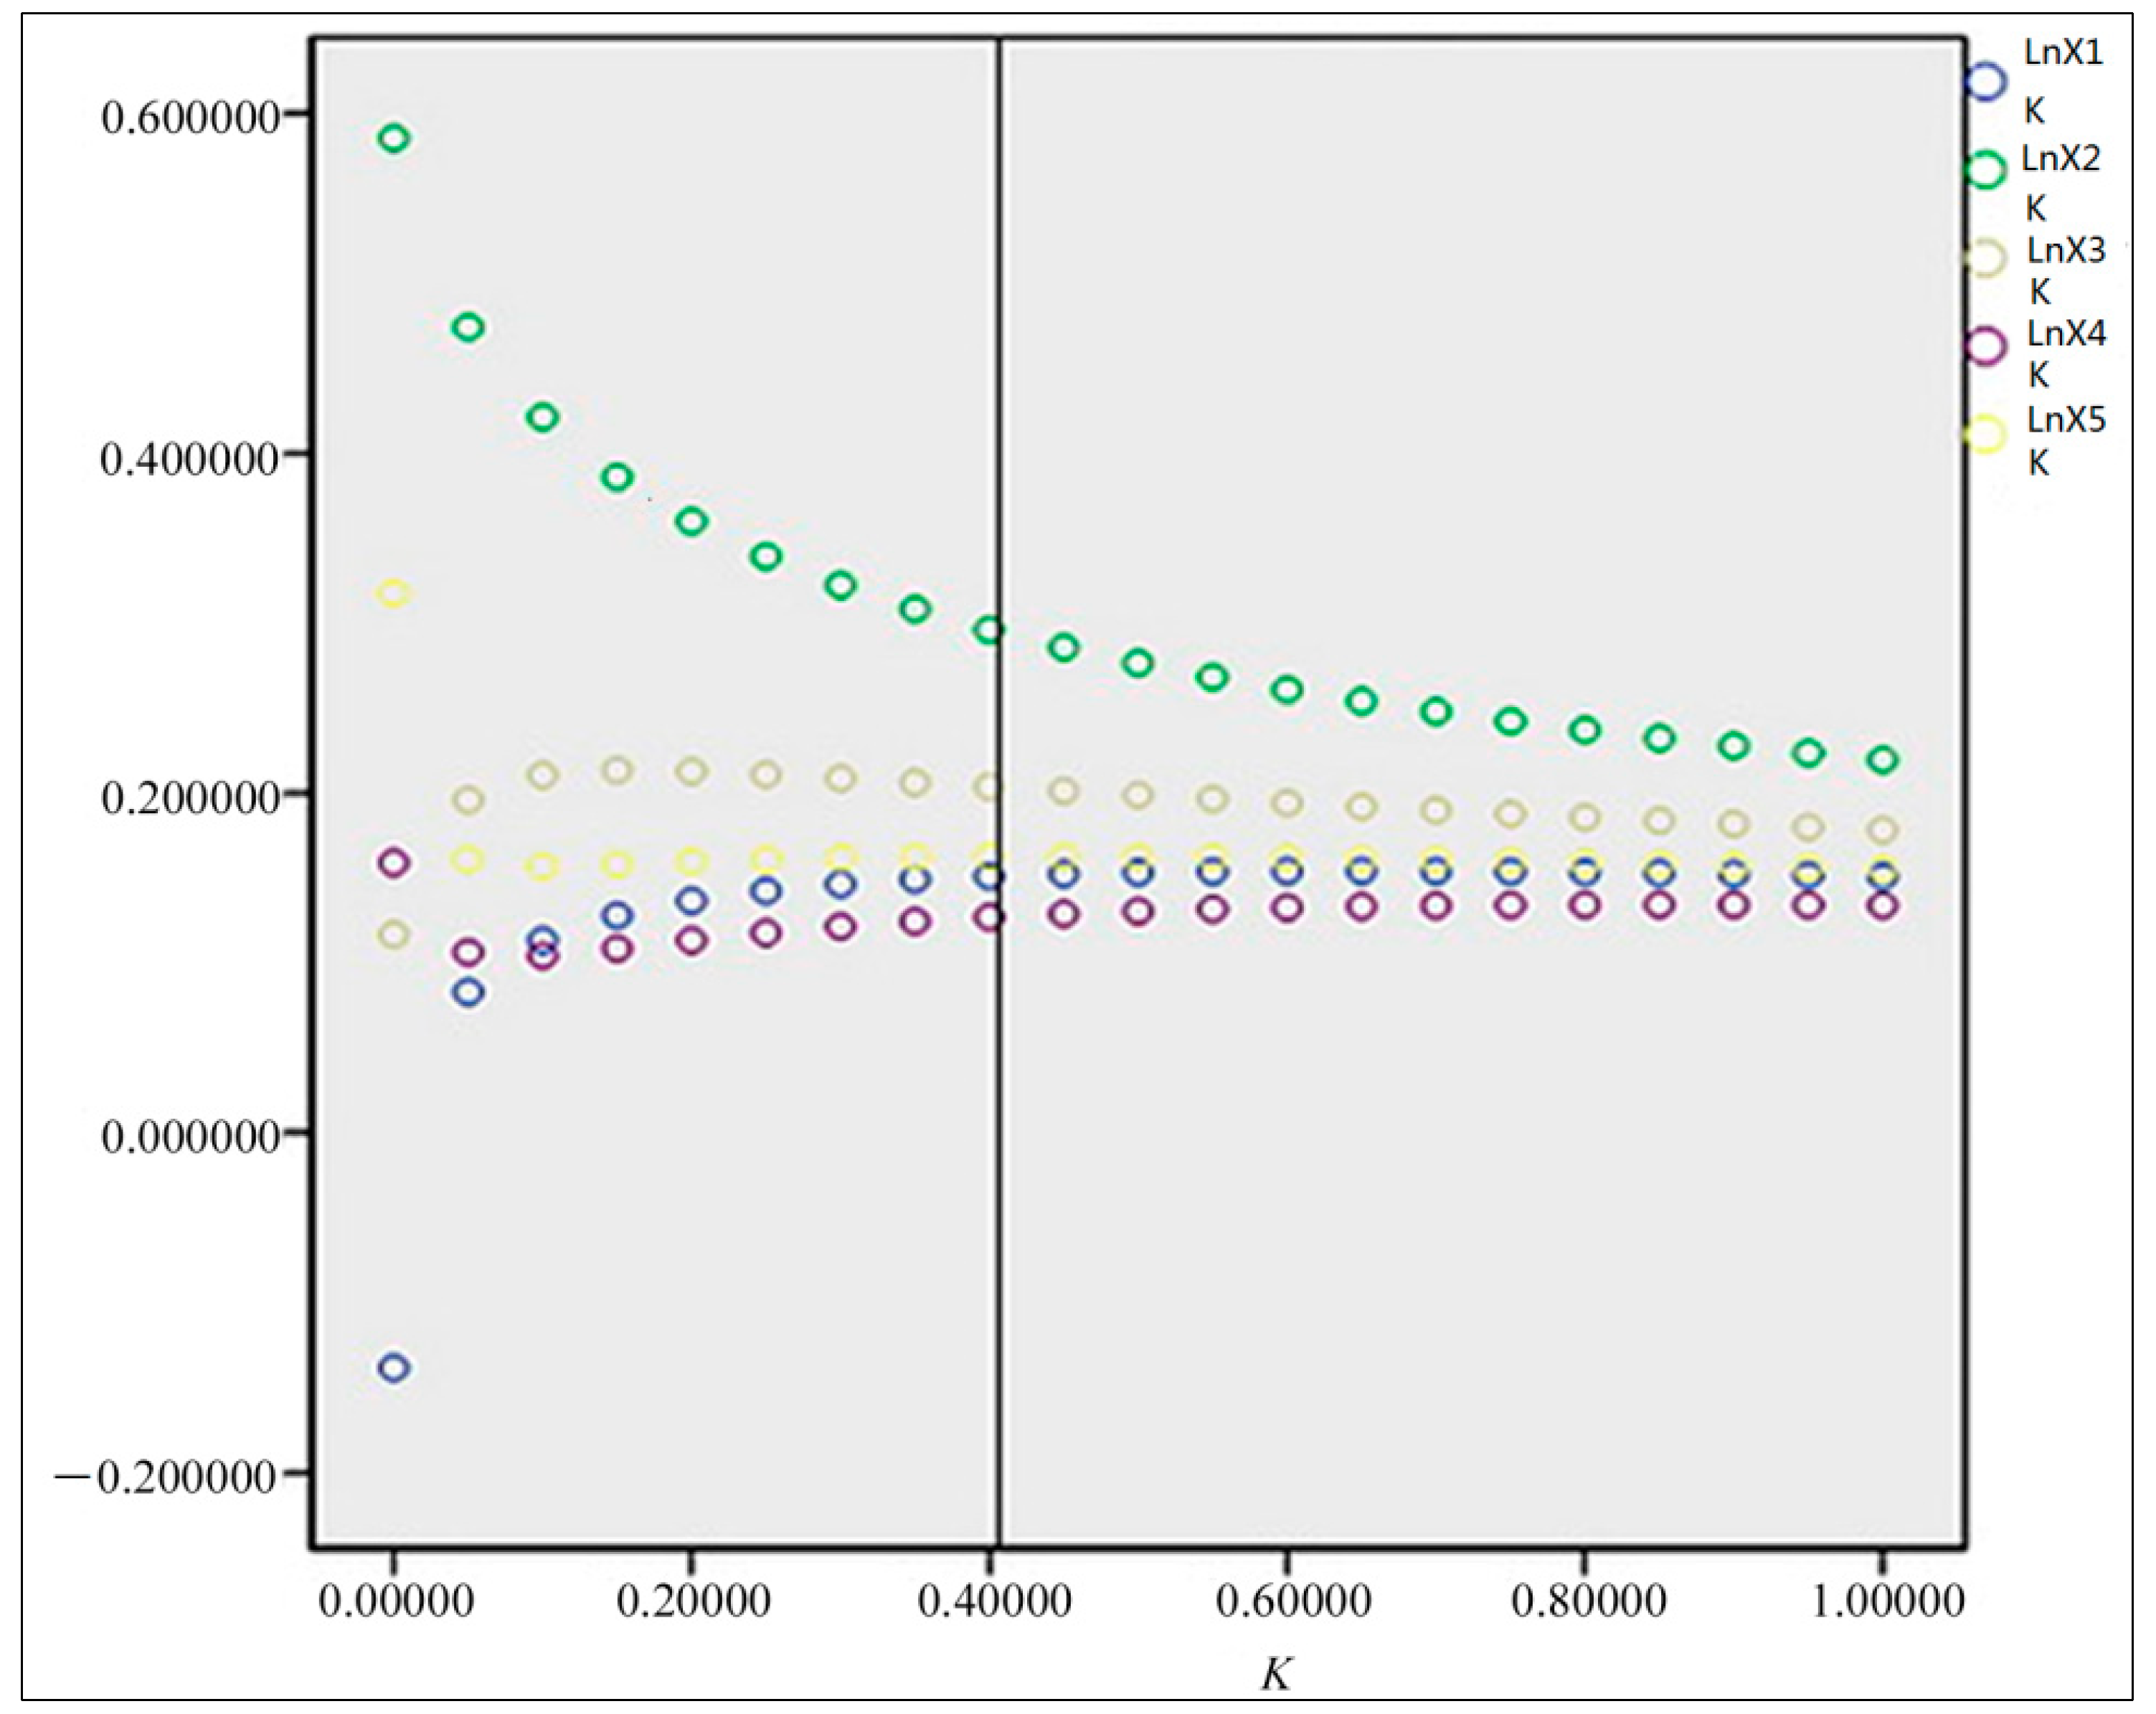
3.1.2. Examining the Results of the Industrial Land Policy Evaluation Model
| Model | T-test | Significance | Collinearity Statistics | |
|---|---|---|---|---|
| Tolerance | Variance Inflation Factor | |||
| (constant) | −0.857 | 0.440 | ||
| LnX1 | −0.360 | 0.737 | 0.015 | 67.715 |
| LnX2 | 3.948 | 0.017 | 0.099 | 10.113 |
| LnX3 | 0.493 | 0.648 | 0.039 | 25.840 |
| LnX4 | 0.932 | 0.404 | 0.075 | 13.393 |
| LnX5 | 0.860 | 0.438 | 0.016 | 62.742 |
| Dimension | Eigen Value | Condition Index | Proportion of variance | |||||
|---|---|---|---|---|---|---|---|---|
| (Constant) | LnX1 | LnX2 | LnX3 | LnX4 | LnX5 | |||
| 1 | 5.63 | 1.00 | 0.00 | 0.00 | 0.00 | 0.00 | 0.00 | 0.00 |
| 2 | 0.35 | 4.02 | 0.00 | 0.00 | 0.00 | 0.00 | 0.03 | 0.00 |
| 3 | 0.02 | 17.28 | 0.00 | 0.00 | 0.00 | 0.00 | 0.54 | 0.11 |
| 4 | 0.00 | 194.75 | 0.00 | 0.84 | 0.06 | 0.00 | 0.03 | 0.57 |
| 5 | 6.04×10⁻⁵ | 305.32 | 0.31 | 0.10 | 0.34 | 0.00 | 0.00 | 0.27 |
| 6 | 9.62×10⁻⁶ | 765.09 | 0.68 | 0.06 | 0.60 | 1.00 | 0.40 | 0.04 |


3.2. Results Analysis
3.2.1. Analysis of Policy Variables in Industrial Land Policy Evaluation Model


- (1)
- The coefficient of the industrial land institution variables in the model is 0.078, which means that the institutions have certain effects on the industrial economy and present a positive correlation. The change of the industrial land institution is mainly reflected in the way that land is allocated. Historically in China, industrial land has been transferred by subdivision. Local governments keep the sale price of industrial land low in order to attract more investment and to drive rapid economic growth. As a result, in 2006, the State Council enacted a policy called Circular of the State Council on Intensifying the Land Control. This was to make mandatory the regulation of the way industrial land is allocated, according to which “industrial land must be allocated by way of bidding, auction or listing, and the allocated land price should not be below the standard floor price”. This policy is a historic transformation of industrial land policy, which has a far-reaching impact on industrial land and the economy. However, the adjustment of the industrial land policy system is a slow process, the impact of which is only realized gradually. Therefore, its effects on industry also need to be observed over the long term.
- (2)
- The coefficient of industrial land regulation variables in the model is 0.076, which means that the regulations have certain effects on the industrial economy and present a positive correlation, but the effects are a little lower than the policy. We know that the ILE of industrial land regulations has increased quickly since 2002 and far more than that of the policies. This means that industrial land use institutions have a greater influence than regulations, although the efforts of regulations are much stronger than institutions. Regulations usually have a strong short-term effect, because they are often introduced to tackle current or imminent issues. Therefore, regulations have a disadvantage for long-term industrial development and create an unstable industrial market when they are imposed frequently.
- (3)
- From the interaction between industrial land institutions and regulations, the policy is a foundation of other regulations and determines their essential characteristics. Regulation, as an important means of intervention for government, has a direct impact on the social performance of industrial land. The industrial land use institution system has been built up steadily from 2001 to 2010. The new system has transformed the subdivision method into a bidding, auction and listing process to allocate industrial land, which improves the efficiency of land use and creates a good development platform for the development of industry. Meanwhile, industrial land regulation has also been changed, especially during 2003 to 2006. The regulations include a land granting price, land layout, development plans and other aspects of industrial land use, which lead the way to industrial development. However, there are some conflicts between the old policies and the new at the time of the handover, which leads to unsatisfactory results in the regulation and its implementation, and this is not conducive to long-term and stable development.
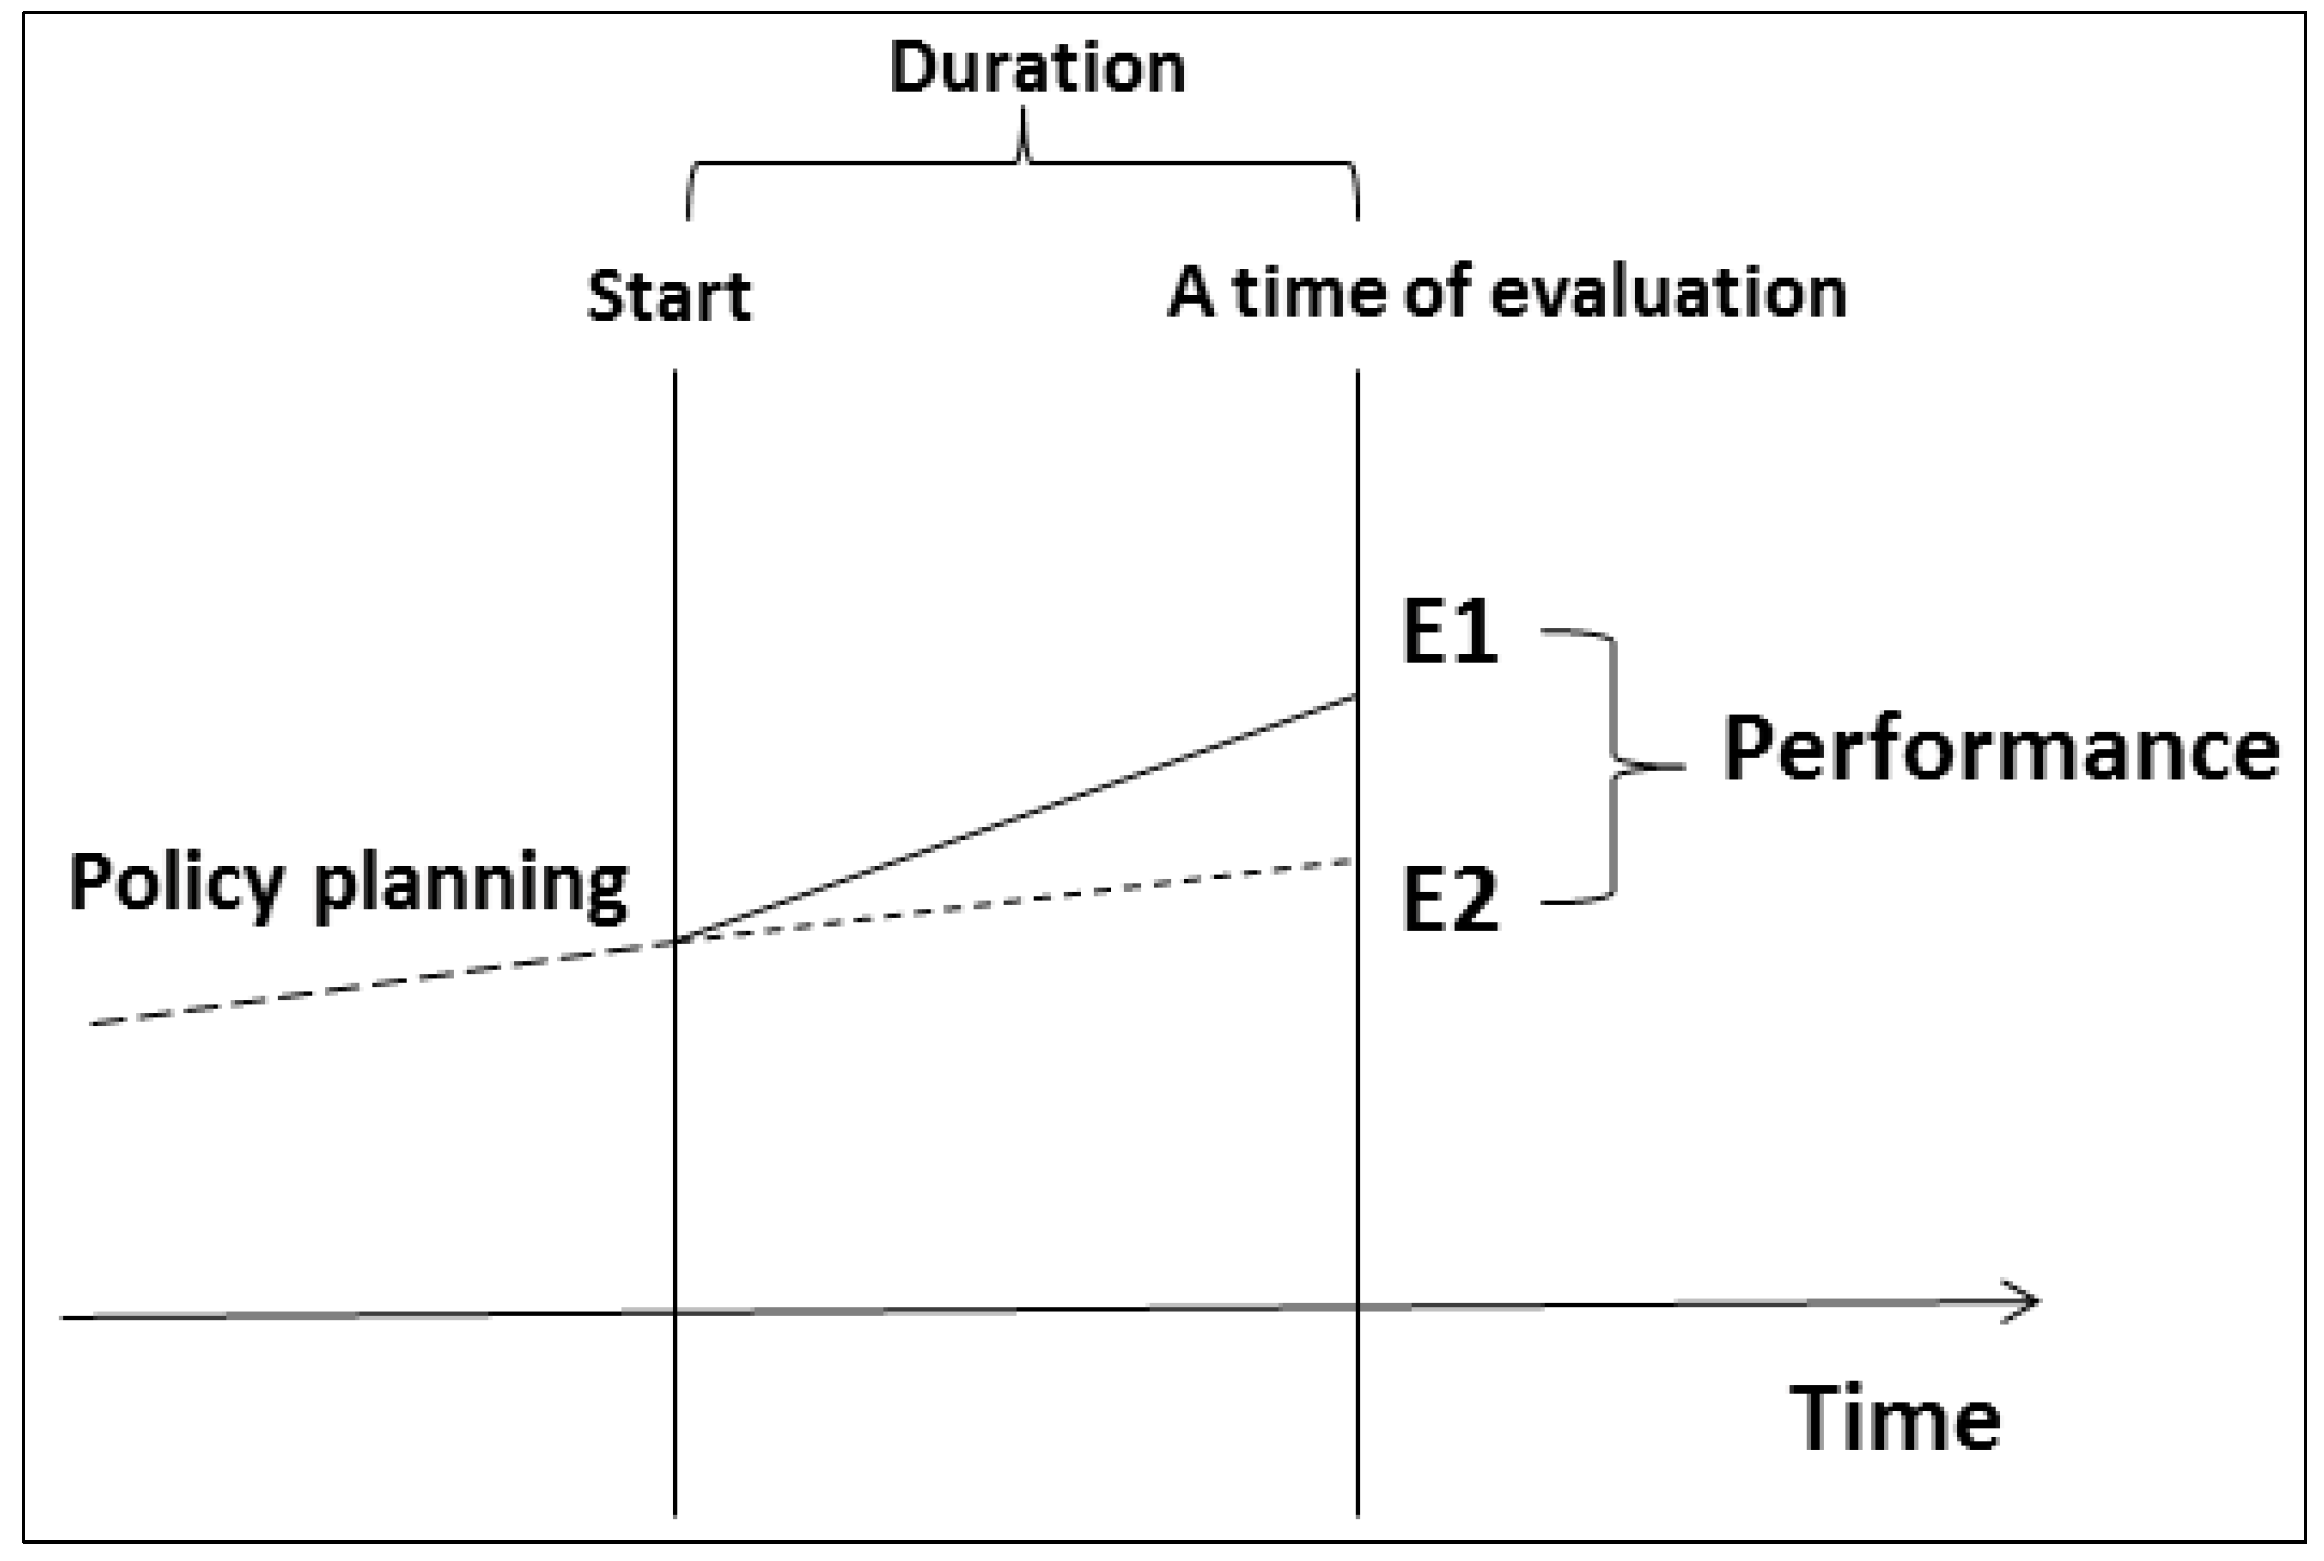
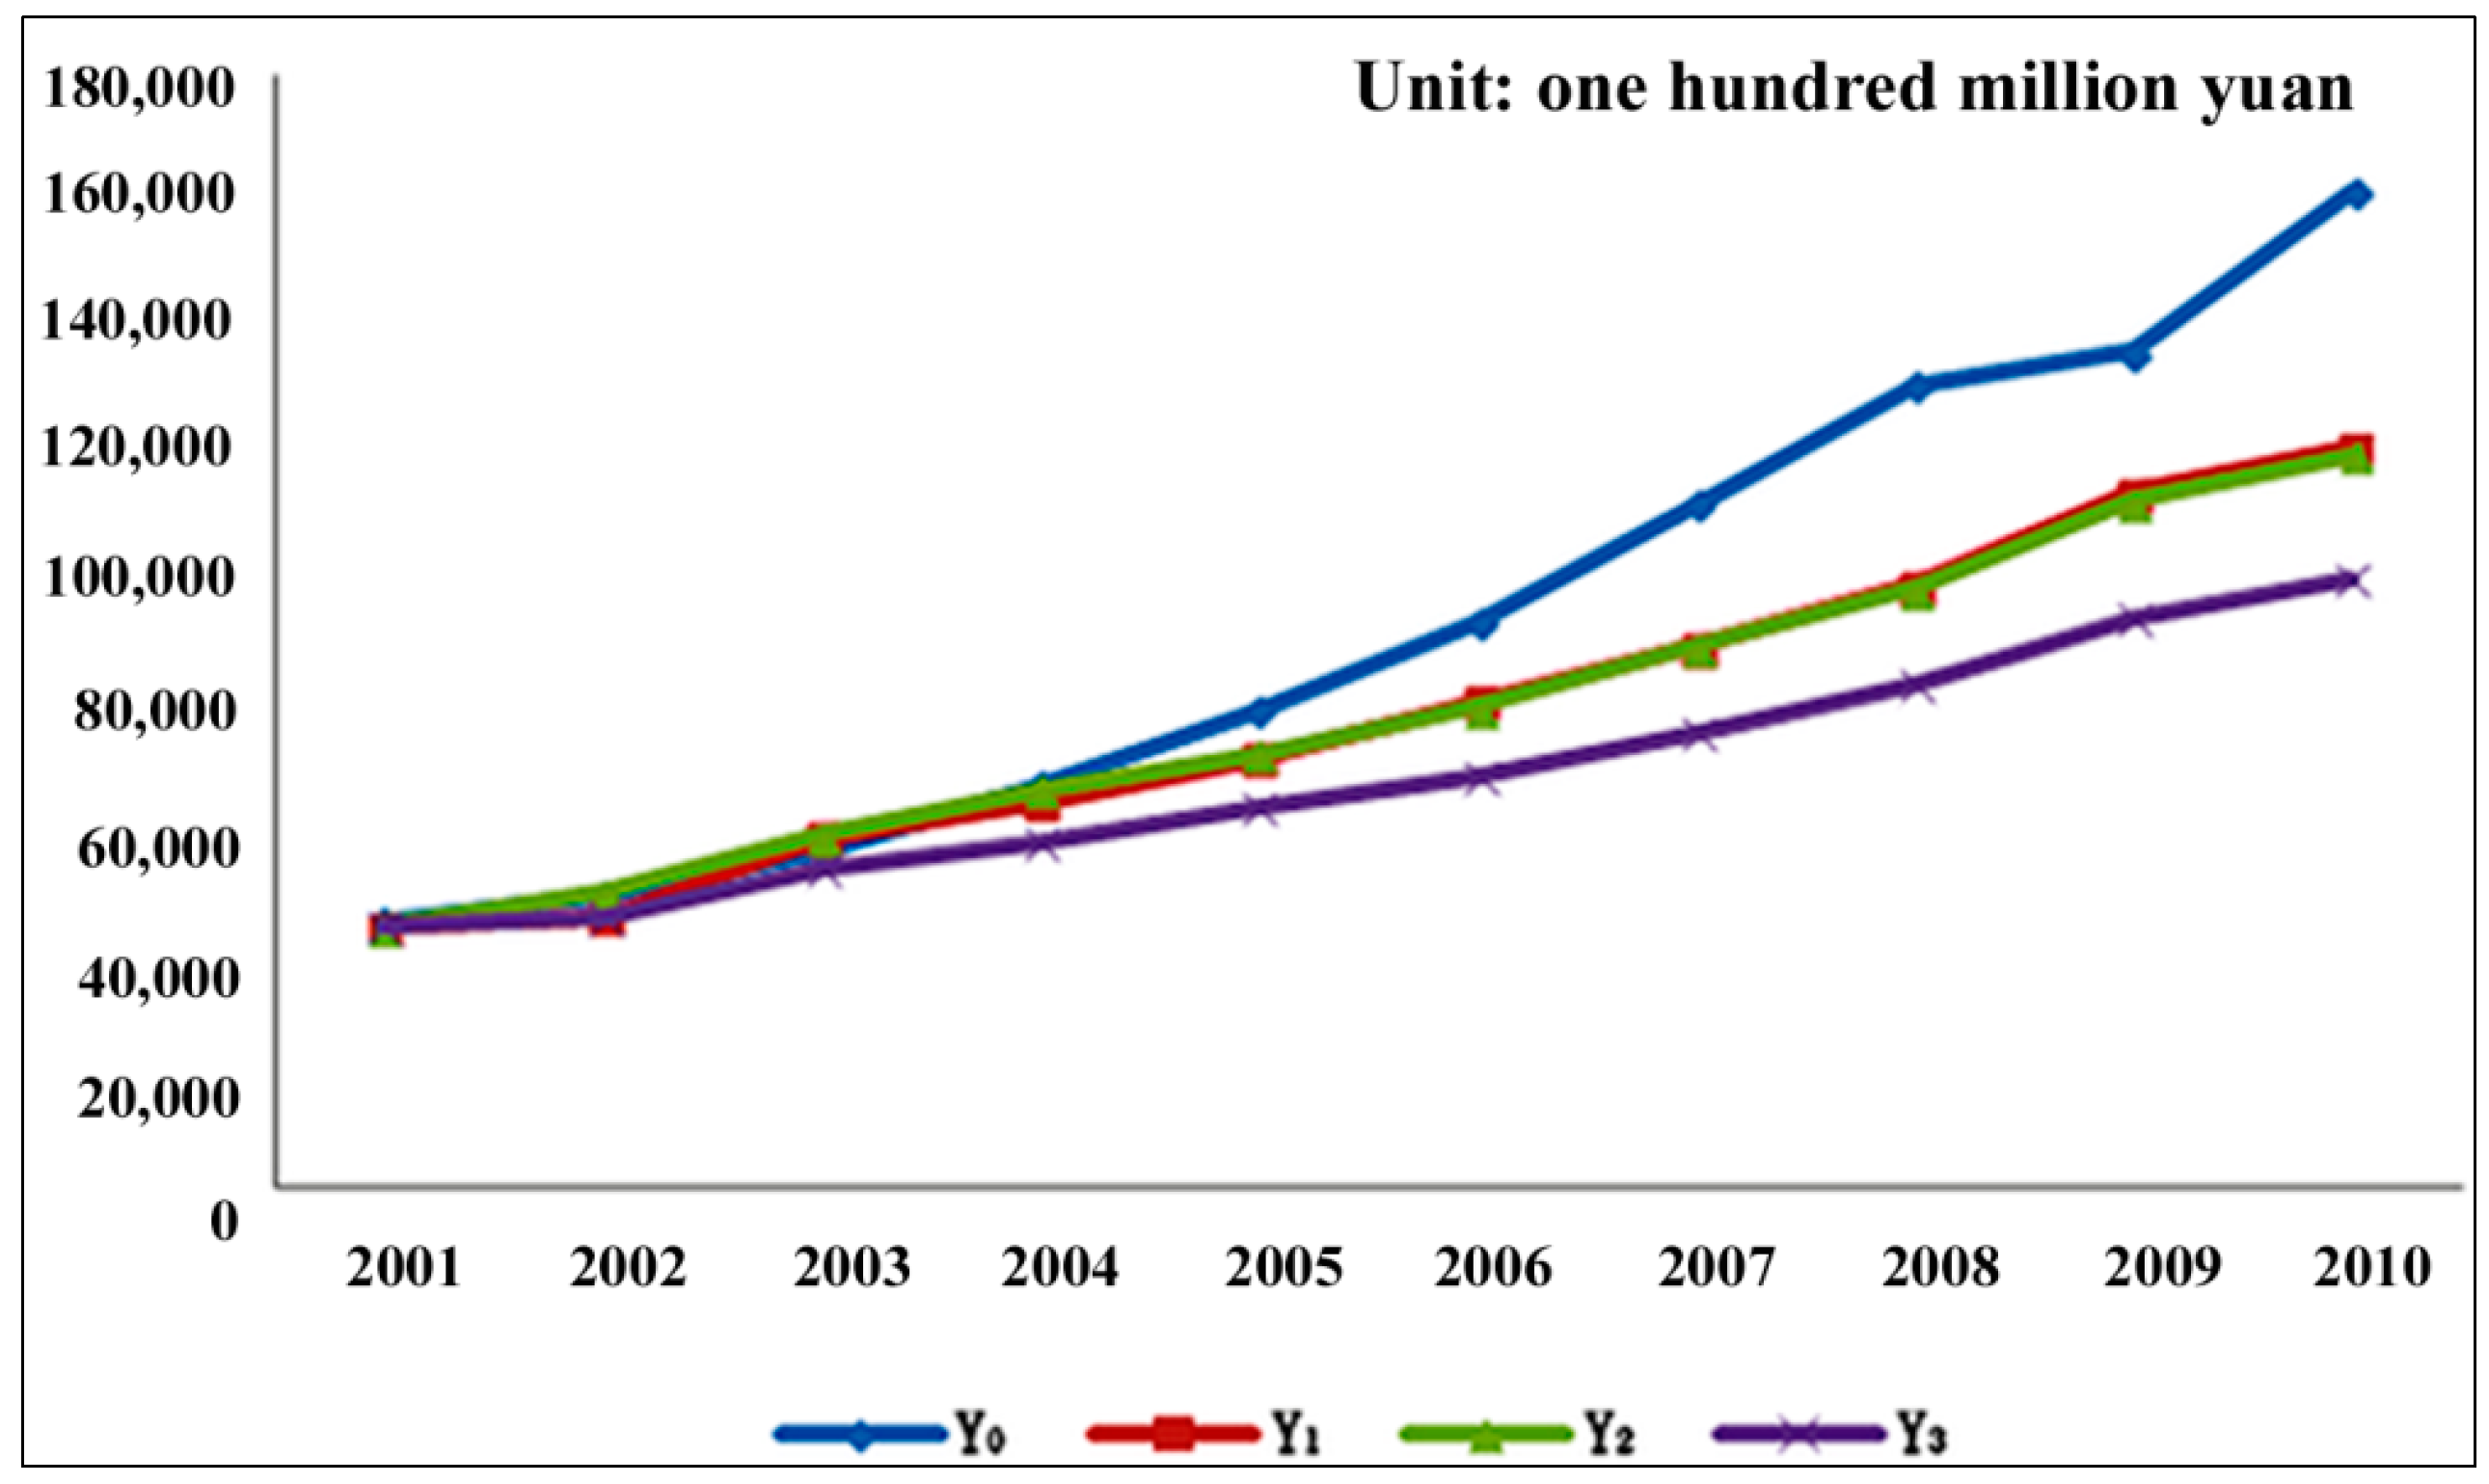
- (4)
- We use the before and after comparison method to analyze the results. Y1 represents the industrial GDP from 2001 to 2010 under the assumption that the industrial land use institution system is maintained at the 2001 level. Y2 represents the industrial GDP from 2001 to 2010 under the assumption that the industrial regulation system is maintained at the level of 2001. Y3 represents the industrial GDP under the assumption that both the regulation and institution systems are maintained at the level of 2001. Y0 is the real GDP from 2001 to 2010. To observe the change of GDP we present the following picture.

3.2.2. Analysis of Non-Policy Variables in Industrial Land Policy Evaluation Model
3.3. Discussion
| Year | Industrial GDP (One Hundred Million Yuan) | Industrial Fixed Investment (One Hundred Million Yuan) | The Number of Industrial Employees (Ten Thousand) | Industrial Land Area (Square Kilometers) | Industrial Land Institution | Industrial Land Regulation |
|---|---|---|---|---|---|---|
| 2001 | 695.44 | 1072.83 | 84.19 | 75.05 | 0.5 | 1.0 |
| 2002 | 787.94 | 1228.37 | 82.01 | 86.24 | 1.5 | 1.0 |
| 2003 | 933.75 | 1588.99 | 84.33 | 107.20 | 2.0 | 3.5 |
| 2004 | 1132.70 | 2142.72 | 90.05 | 105.35 | 3.0 | 4.0 |
| 2005 | 1293.81 | 2525.86 | 92.42 | 138.95 | 3.0 | 5.0 |
| 2006 | 1566.83 | 3214.23 | 96.84 | 141.73 | 4.0 | 9.5 |
| 2007 | 2004.51 | 4363.24 | 108.26 | 158.14 | 5.0 | 10.0 |
| 2008 | 2607.15 | 5755.89 | 132.13 | 164.85 | 5.0 | 11.0 |
| 2009 | 2917.40 | 6772.90 | 137.27 | 209.14 | 5.5 | 13.0 |
| 2010 | 3697.83 | 9143.55 | 146.55 | 240.03 | 5.5 | 13.0 |
| Year | Industrial GDP (One Hundred Million Yuan) | Industrial Fixed Investment (One Hundred Million Yuan) | The Number of Industrial Employees (Ten Thousand) | Industrial Land Area (Square Kilometers) | Industrial Land Institution | Industrial Land Regulation |
|---|---|---|---|---|---|---|
| 2001 | 869.15 | 1916.13 | 122.15 | 95.86 | 0.5 | 1.0 |
| 2002 | 968.44 | 1935.51 | 120.95 | 106.48 | 1.5 | 1.0 |
| 2003 | 1217.88 | 1953.25 | 115.28 | 116.87 | 2.0 | 3.5 |
| 2004 | 1549.70 | 2275.69 | 122.85 | 114.90 | 3.0 | 4.0 |
| 2005 | 1957.95 | 2476.97 | 122.21 | 119.63 | 3.0 | 5.0 |
| 2006 | 2261.52 | 2807.39 | 116.33 | 119.05 | 4.0 | 9.5 |
| 2007 | 2661.87 | 3205.59 | 118.62 | 123.89 | 5.0 | 10.0 |
| 2008 | 3418.87 | 3939.05 | 133.12 | 144.64 | 5.0 | 11.0 |
| 2009 | 3622.11 | 4969.79 | 135.74 | 149.14 | 5.5 | 13.0 |
| 2010 | 4410.85 | 5732.66 | 148.91 | 155.66 | 5.5 | 13.0 |
4. Conclusions
Acknowledgments
Author Contributions
Conflicts of Interest
References
- Dye, T.R. Understanding Public Policy; Prentice Hall PTR: New Jersy, NJ, USA, 2007. [Google Scholar]
- Willis, M.R.; Keller, A.A. A framework for assessing the impact of land use policy on community exposure to air toxics. J. Environ. Manag. 2007, 83, 213–227. [Google Scholar] [CrossRef]
- Paracchini, M.L.; Pacini, C.; Jones, M.L.M.; Pérez-Soba, M. An aggregation framework to link indicators associated with multifunctional land use to the stakeholder evaluation of policy options. Ecol. Indic. 2011, 11, 71–80. [Google Scholar] [CrossRef]
- Carver, A.D.; Thurau, R.G.; White, E.M.; Lazdinis, M. Applying spatial analysis to forest policy evaluation: Case study of the Illinois Forestry Development Act. Environ. Sci. Policy 2006, 9, 253–260. [Google Scholar] [CrossRef]
- Lichtenberg, E.; Ding, C. Assessing farmland protection policy in China. Land Use Policy 2008, 25, 59–68. [Google Scholar] [CrossRef]
- Feng, T.; Zhang, J.; Fujiwara, A.; Timmermans, H.J.P. An integrated model system and policy evaluation tool for maximizing mobility under environmental capacity constraints: A case study in Dalian City, China. Transp. Res. D Transp. Environ. 2010, 15, 263–274. [Google Scholar]
- Galarza, M.E.; Gonzalez, I.A.; Enjuto, M.C.T. Industrial Land Policies in Alava. Boletín de la Asociación de Geógrafos Españoles 2012, 58, 459–462. [Google Scholar]
- Prato, T. Stochastic multiple attribute evaluation of land use policies. Ecol. Model. 2008, 219, 115–124. [Google Scholar] [CrossRef]
- Van Meijl, H.; van Rheenen, T.; Tabeau, A.; Eickhout, B. The impact of different policy environments on agricultural land use in Europe. Agric. Ecosyst. Environ. 2006, 114, 21–38. [Google Scholar] [CrossRef]
- Zhu, J.M. The impact of industrial land use policy on industrial change. Land Use Policy 2000, 17, 21–28. [Google Scholar] [CrossRef]
- Reidsma, P.; Koenig, H.; Feng, S.; Bezlepkina, I.; Nesheim, I.; Bonin, M.; Sghaier, M.; Purushothaman, S.; Sieber, S.; van Ittersum, M.K.; et al. Methods and tools for integrated assessment of land use policies on sustainable development in developing countries. Land Use Policy 2011, 28, 604–617. [Google Scholar] [CrossRef]
- Hill, E.; Dorfman, J.H.; Kramer, E. Evaluating the impact of government land use policies on tree canopy coverage. Land Use Policy 2010, 27, 407–414. [Google Scholar] [CrossRef]
- Hermans, L.; Cunningham, S.; Slinger, J. The usefulness of game theory as a method for policy evaluation. Evaluation 2014, 20, 10–25. [Google Scholar] [CrossRef]
- Chen, C.C. An analytical framework for energy policy evaluation. Renew. Energy 2011, 36, 2694–2702. [Google Scholar] [CrossRef]
- Athanassopoulos, A.D.; Triantis, K.P. Assessing aggregate cost efficiency and the related policy implications for Greek local municipalities. Inf. Syst. Oper. Res. 1998, 36, 66–83. [Google Scholar]
- Brouwer, R.; van Ek, R. Integrated ecological, economic and social impact assessment of alternative flood control policies in the Netherlands. Ecol. Econ. 2004, 50, 1–21. [Google Scholar] [CrossRef]
- Brannstrom, C.; Jepson, W.; Filippi, A.M.; Redo, D.; Xu, Z.; Ganesh, S. Land change in the Brazilian Savanna (Cerrado), 1986–2002: Comparative analysis and implications for land-use policy. Land Use Policy 2008, 25, 579–595. [Google Scholar] [CrossRef]
- Le, Q.B.; Park, S.J.; Vlek, P.L.G. Land Use Dynamic Simulator (LUDAS): A multi-agent system model for simulating spatio-temporal dynamics of coupled human-landscape system: 2. Scenario-based application for impact assessment of land-use policies. Ecol. Inform. 2010, 5, 203–221. [Google Scholar]
- Li, Y.; Zhang, J.; He, D. Research on the rational population carrying capacity and relevant policy of a Region-Take Beilun Area of Ningbo as an example. In Proceedings of the 1st International Conference on Sustainable Construction & Risk Management, Chongqing Jiaotong University, Chongqing, China, 12–14 June 2010; Volumes I and II, pp. 798–802.
- Soltanmohammadi, H.; Osanloo, M.; Bazzazi, A.A. An analytical approach with a reliable logic and a ranking policy for post-mining land-use determination. Land Use Policy 2010, 27, 364–372. [Google Scholar] [CrossRef]
- Xie, Y. Policy evaluation method and selecting method. J. Jiangxi Adm. Coll. 2000, 2, 19–21. (In Chinese) [Google Scholar]
- Yuan, X. Policy evaluation method and choice. J. Jiangxi Adm. Inst. 2000, 4, 19–21. (In Chinese) [Google Scholar]
© 2014 by the authors; licensee MDPI, Basel, Switzerland. This article is an open access article distributed under the terms and conditions of the Creative Commons Attribution license (http://creativecommons.org/licenses/by/3.0/).
Share and Cite
Zheng, X.; Geng, B.; Wu, X.; Lv, L.; Hu, Y. Performance Evaluation of Industrial Land Policy in China. Sustainability 2014, 6, 4823-4838. https://doi.org/10.3390/su6084823
Zheng X, Geng B, Wu X, Lv L, Hu Y. Performance Evaluation of Industrial Land Policy in China. Sustainability. 2014; 6(8):4823-4838. https://doi.org/10.3390/su6084823
Chicago/Turabian StyleZheng, Xinqi, Bing Geng, Xiang Wu, Lina Lv, and Yecui Hu. 2014. "Performance Evaluation of Industrial Land Policy in China" Sustainability 6, no. 8: 4823-4838. https://doi.org/10.3390/su6084823