Article

Estimating Energy Consumption of Transport Modes in China Using DEA

1
School of Economics and Resource Management, Beijing Normal University, Beijing 100875, China
2
School of Environment, Beijing Normal University, Beijing 100875, China
3
China Energy Research Society, Beijing 100045, China
*
Author to whom correspondence should be addressed.
Sustainability 2015, 7(4), 4225-4239; https://doi.org/10.3390/su7044225
Submission received: 26 February 2015 / Revised: 2 April 2015 / Accepted: 3 April 2015 / Published: 10 April 2015
(This article belongs to the Special Issue Transportation and Sustainability)

Abstract

:
The rapid growth of transport requirements in China will incur increasing transport energy demands and associated environmental pressures. In this paper, we employ a generalized data envelopment analysis (DEA) to evaluate the relative energy efficiency of rail, road, aviation and water transport from 1971 to 2011 by considering the energy input and passenger-kilometers (PKM) and freight ton-kilometers (TKM) outputs. The results show that the optimal energy efficiencies observed in 2011 are for rail and water transport, with the opposite observed for the energy efficiencies of aviation and road transport. In addition, we extend the DEA model to estimate future transport energy consumption in China. If each transport mode in 2020 is optimized throughout the observed period, the national transport energy consumption in 2020 will reach 497,701 kilotons coal equivalent (ktce), whereas the annual growth rate from 2011 to 2020 will be 5.7%. Assuming that efficiency improvements occur in this period, the estimated national transport energy consumption in 2020 will be 443,126 ktce, whereas the annual growth rate from 2011 to 2020 will be 4.4%, which is still higher than that of the national total energy consumption (3.8%).

1. Introduction

Transportation energy consumption is an important growth factor in the growth of China’s total energy consumption because of rapidly increasing transport requirements. According to a report by the International Energy Agency (IEA), 340,120,000 kilotons coal equivalent (ktce) energy were consumed by transport modes in China in 2012, accounting for 14.0% of the country’s total final energy consumption (TFC) [1]. However, only the energy consumed by the transport sector (commercial) is considered in these calculations. Thus, the transport sector consumed 293,429 ktce of energy in 2012 according to data from the National Bureau of Statistics (NBS) of China; thus, this sector accounted for 11.5% of the TFC [2], which is lower than that of the IEA. The data from the IEA and NBS are calculated according to the calorific value calculation. In addition, transport energy consumption accounted for 8.2% and 8.7% of the total primary energy consumption in 2012 according to the IEA [1]and NBS [2], respectively. This paper utilizes the transport energy consumption data from the IEA and considers the data’s availability and comparability. Taiwan, Hong Kong and Macau are not included because of a lack of data. Compared with the world average and that of other developed countries, the ratio of China’s transportation energy consumption to TFC is still much lower. In 2012, the world average rations and ratios in the OECD (Organization for Economic Cooperation and Development) countries, the USA, Germany, the U.K. and Japan were 27.9%, 33.1%, 41.7%, 24.1%, 30.5% and 24.1%, respectively. Even among the BRICS (Brazil, Russia, India, China and South Africa) countries, the ratios of Brazil (35.3%), Russia (20.3%), India (14.4%) and South Africa (23.5%) were higher than that of China (14.0%) in 2012 [1]. It is probable that economic development along with industrialization and urbanization in China will lead to faster growth of the transportation sector, as well as higher energy consumption.
The rapid growth of transportation energy demands may also exert great pressure on the environment. Fuel combustion from transportation accounted for 22.6% of the global CO2 emissions in 2012 and is the second-largest source of such emissions [3,4]. In China, the transport sector produced 702.9 million tons of CO2, which contributed 8.6% of the total national CO2 emissions in 2012. Although below the world average, China accounted for 9.8% of global total transport emissions [4]. Therefore, reducing transport emissions and developing sustainable transport systems remains a challenge for China. Reducing transport demands or incorporating additional renewable energy into the energy structure may be feasible options for mitigating environmental emissions from transportation.
There are five primary transport modes in China: road, rail, aviation, water and pipeline. The energy efficiency of each transport mode is defined here by comparing its inputs and outputs. All of the vehicles considered in these transport modes (pipeline excluded) can be used for carrying passengers and materials with energy input. The two outputs of transport can be measured as passenger-kilometers (PKM) and freight ton-kilometers (TKM). Without including proper assumptions, it is generally difficult to exclusively apportion energy consumption to passenger or freight transport [5], and this affects the accuracy of efficiency assessments. Therefore, a data envelopment analysis (DEA), which is a non-parametric linear programming approach, is employed here to assess the relative energy efficiencies of different transport modes, including an overall consideration of the energy consumption in passenger and freight transport. The future energy consumption of transportation in China is predicted with an extended DEA model.
The first DEA was proposed by Charnes et al. [6] in 1978 as an efficiency measurement approach. It is an effective method of assessing the relative efficiency of a set of decision-making units (DMUs), with multiple inputs and outputs, and has been widely applied in many research fields. At the macro level, DEAs have been used to evaluate the energy efficiencies of various countries and regions, such as the USA [7], Japan [8,9,10], Taiwan [11,12], Sweden [13], Spain [14], France [15], India [5,16,17,18] and Iran [19]. In addition, a set of countries was chosen for cross-country comparisons, e.g., OECD countries [20], developing countries [21], BRICS countries [22], EU countries [23] and APEC (Asia Pacific Economic Cooperation) countries [24], and the agriculture, manufacturing, power generation, transport and service sectors were considered.
Hu and Wang [25] used the data envelopment analysis (DEA) approach to evaluate the total-factor energy efficiency of 29 administrative regions in China from 1995 to 2002. Under a similar total-factor framework based on a DEA model, Wei and Shen [26] evaluated the provincial-level energy efficiency in China from 1995 to 2004; Shu et al. [27] calculated the total factor productivity (TFP) electricity consumption efficiency with panel data from four districts in China from 2001 to 2007. Wang et al. [28] evaluated the energy efficiency in the industrial sectors in 30 provinces of China from 2005 to 2009, and Wang et al. [29] also employed both static and dynamic DEA models to assess energy efficiencies in China from 2001 to 2010 at the provincial level. Furthermore, studies have considered the undesirable outputs in the efficiency evaluation process via the DEA approach. Ye et al. [30] regarded CO2 and SO2 emissions as two undesirable outputs and then evaluated the energy utilization efficiency between mainland China and Taiwan from 2002 to 2007. Shi et al. [31] evaluated the provincial-level industrial energy efficiency in China from 2000 to 2006, with waste gas considered an undesirable output. Lin et al. [32] used DEA and DEA-Malmquist models to measure the environmental and energy performance of 30 provinces, cities and autonomous regions of China during the economic development process, with solid waste, SO2, soot, dust, COD and ammonia nitrogen emissions considered as outputs. Yang et al. [33] and Bian et al. [34] considered CO2 emissions an undesirable output in their studies. Bi et al. [35] adopted a slacks-based DEA model to evaluate the energy efficiency of China’s thermal power generation, with SO2, NOX and soot considered undesirable outputs. In addition, the super DEA model [36], range-adjusted measure (RAM)-DEA model [37], non-radial DEA model [34,38] and DEA-Malmquist model [29,32] have also been also employed to explore energy efficiency issues in China.
However, only limited studies have focused on the energy efficiency of the transport sector. Ramanathan [5,18] used the DEA approach to estimate the relative energy efficiencies of transport modes in India and further extended the DEA model to predict future Indian energy consumption related to rail and road transport. Their results showed that the performance of rail transport from 1993 to 1994 was the most energy efficient mode during the observed period, whereas the performance of road transport was much poorer. Based on these findings, they concluded that the modal split in favor of rail transport will provide energy savings and CO2 emission reductions. Chang et al. [38] presented a SBM-DEA model to assess environmental efficiency in the transport sector in China, and they stated that the application of a slacks-based measure (SBM) may help reveal the real energy consumption process. Zhou et al. [39] applied the DEA approach to measure the energy efficiency performance of the transport sector in China at the provincial level, and they considered non-energy and energy inputs as well as desirable and undesirable outputs to maximize the energy-saving potential of the transport sector. Cui et al. [40] used a three-stage virtual frontier DEA model to evaluate transport energy efficiency in 30 Chinese provincial administrative regions, and the differences among efficient DMUs were differentiated by maintaining an unchanged reference DMU set during the evaluating process.
This paper aims to use the DEA approach to evaluate energy efficiencies in the road, rail, aviation and water transport modes by considering the input (energy consumption) and outputs (TKM, PKM). Pipeline is only used for freight transport; therefore, it is excluded from the energy efficiency assessment. In addition, future transport energy consumption is estimated with an extended DEA model based on the efficiency assessment. This paper is organized as follows: Section 2 describes the methodology and data adopted in this paper; Section 3 includes the empirical results and a discussion; and Section 4 provides an analysis of fuel consumption by the transportation sector and summarizes the main findings.

2. Methodology and Data

2.1. Data Envelopment Analysis

The CCR (Charnes, Cooper and Rhodes) model is a traditional DEA model [41,42,43,44], and it can be described as follows:
Assume that there are k DMUs that convert m inputs into n outputs. For the j-th DMU, xij (i = 1, 2,…, m, j = 1, 2,…, k) inputs produce yjr (r = 1, 2,…, n) outputs. The matrix is therefore written as follows:
x j = ( x 1 j , x 2 j , , x m j ) T , j = 1 , 2 , , k y j = ( y 1 j , y 2 j , , y n j ) T , j = 1 , 2 , , k v = ( v 1 , v 2 , , v m ) T u = ( u 1 , u 2 , , u n ) T
where v and u refer to the vectors of input weights and output weights, respectively.
According to the CCR model, the efficiency of the j0-th (1 ≤ j0n) DMU is represented by the maximum ratio of weighted outputs to weighted inputs subject to the condition that similar ratios for each DMU are less than or equal to one. Therefore, the CCR model can be described in a more precise form as follows:
{ max u T y j 0 v T x j 0 s.t. u T y j v T x j 1 , j = 1 , 2 , , k     v 0 , u 0
Equation (2) is a fractional programming problem with an infinite number of solutions, and it can be transformed into a linear programming problem through a Charnes–Cooper transformation. The linear programming model can be written as follows:
{ max μ T y j 0 s.t. ω T x j μ T y j 0 , j = 1 , 2 , , k     ω T x j 0 = 1     ω 0 , μ 0
where w = tv, µ = tu denote new vectors of input weights and output weights, respectively.
The DEA efficiency score of each DMU can be obtained by solving the linear programming problem k times, once for each DMU.

2.2. Extended DEA Model

This paper adopts an extended DEA model with reference to Ramanathan [18] to estimate the transport energy consumption in 2020. The model consists of the following steps (see Figure 1):
(1)
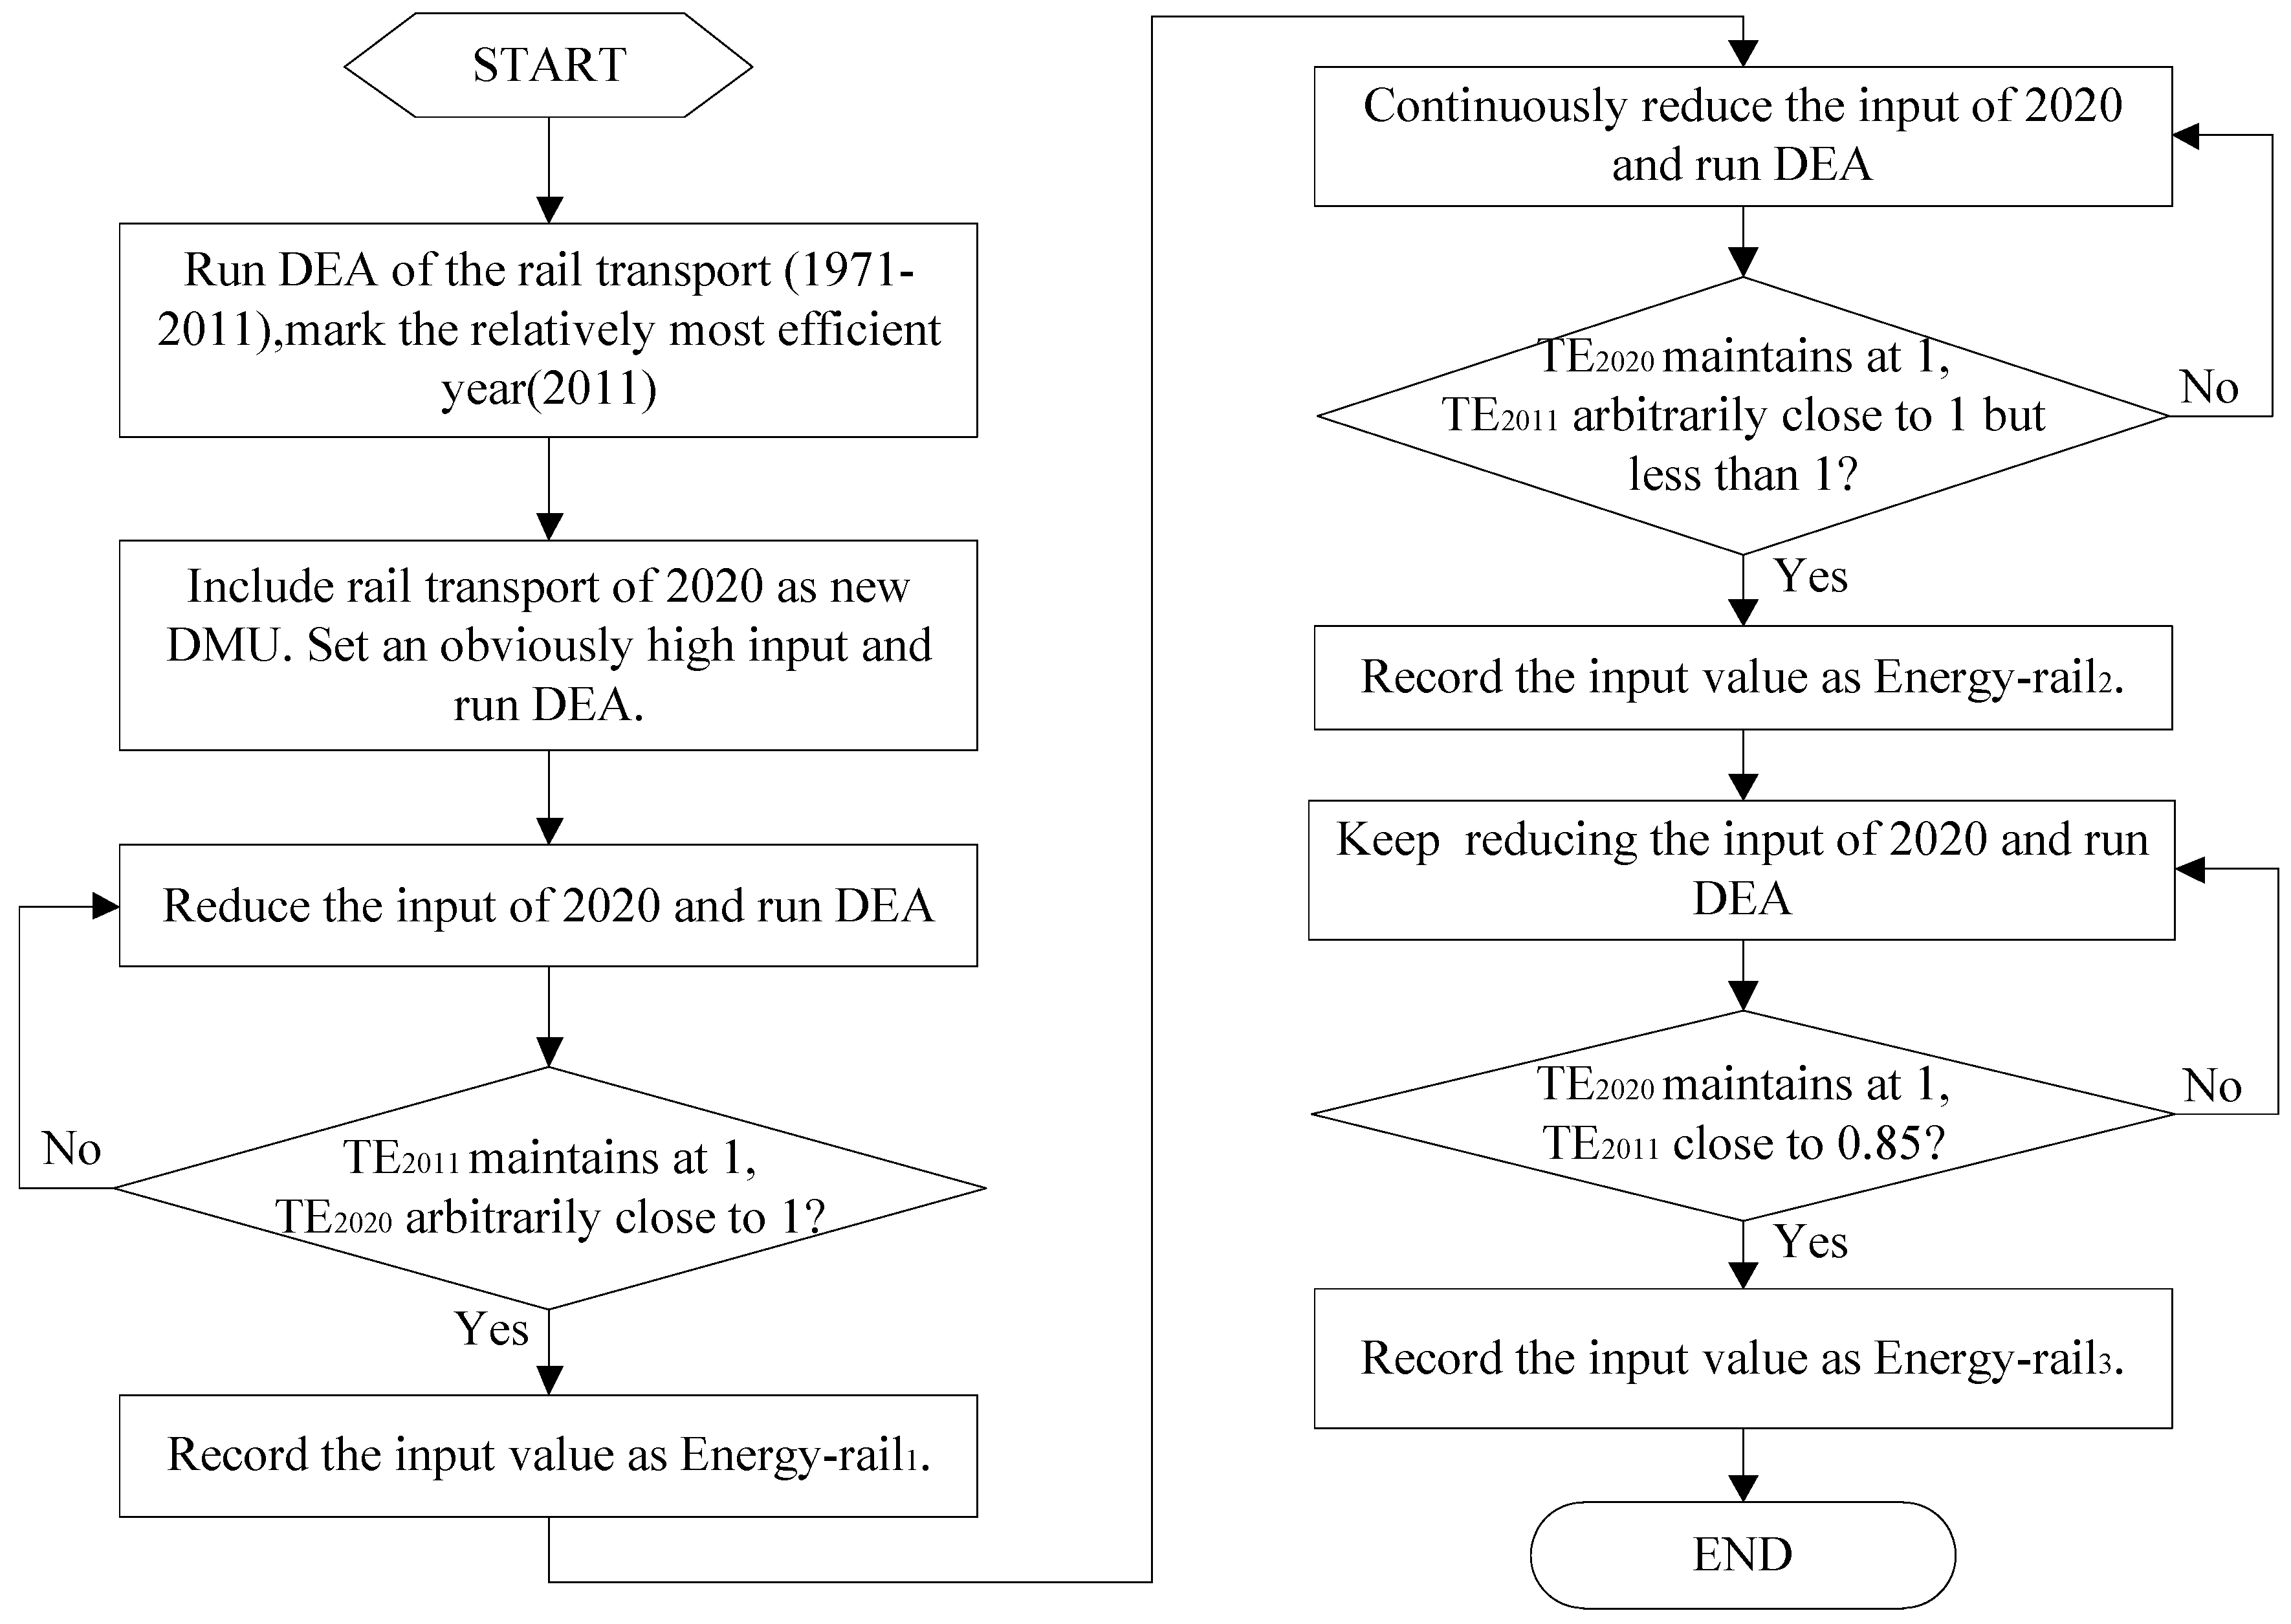
Run DEA for rail transport (1971 to 2011) and record the efficiency score of each year. Record the most efficient year (efficiency score equal to 1), e.g., 2011.
(2)
Include rail transport in 2020 as a new DMU. The outputs (TKM and PKM) of the new DMU can be obtained in the data sector of this paper. Set an obviously high rail energy consumption amount in 2020 as the input and run the DEA model. The new DMU is absolutely DEA-inefficient.
(3)
Reduce the rail energy consumption amount in 2020 until the efficiency score for 2011 (TE2011) is maintained at 1 and the efficiency score for 2020 (TE2020) increases arbitrarily close to 1. Record this value of energy consumption as Energy-rail1.
(4)
Reduce the rail energy consumption amount in 2020 continuously until TE2020 is maintained at 1 and TE2011 is arbitrarily close to 1, but less than 1. Record this energy consumption value as Energy-rail2.
(5)
Consider efficiency improvements over time and assign a proper proportion of efficiency increases. For example, assign a 15% higher energy efficiency for 2020 relative to 2011. Then, continue reducing the rail energy consumption amount for 2020 until TE2020 remains at 1 and TE2011 is close to 0.85. Record this energy consumption value as Energy-rail3.
Three different rail transport energy consumption values are recorded for 2020 in the estimation process. Energy-rail1 is recorded when TE2020 is close to (or slightly less than) TE2011; Energy-rail2 is recorded when the energy consumption of 2020 is reduced until it is the only relatively efficient score. Energy-rail2 is less than Energy-rail1. However, these two values are obtained based on the assumption that rail transport in 2020 will be as efficient as in 2011, and they do not consider potential improvements in energy efficiency over time. Thus, this paper included a fifth step and obtained Energy-rail3, which considers increases in efficiency from 2011 to 2020. Energy-rail3 will be less than Energy-rail1 and Energy-rail2, and it represents the energy consumption considered here. Similar processes can be employed for estimating energy consumption by road, aviation and water transportation modes 2020.
Figure 1. Flowchart of the extended DEA model for estimating future energy consumption in 2020.
Sustainability 07 04225 g001

2.3. Data

This paper first evaluates the relative energy efficiencies of the rail, road, aviation and water transport modes in China by using a DEA approach that considers the energy consumption of each transport mode as inputs and the TKM and PKM of each transport mode as outputs. Because the separate energy consumptions of different transport modes were not accessible, data from the IEA are used here [45]. Several differences can be observed between the data of the NBS and IEA, and they were stated in the Introduction section. The observed time periods for rail, road, aviation and water transportation are 1971 to 2011, 1971 to 2011, 1982 to 2011 and 1992 to 2011 [45]. The TKM and PKM of each transport mode are obtained through the online data service provided by the NBS of China [46].
Future transportation energy consumption in China was estimated through the extended DEA model, which requires the future capacity (TKM and PKM) of each transport mode outputs. This paper uses data from China’s Low Carbon Development Pathways by 2050, a report published by the Energy Research Institute (ERI) and National Development and Reform Commission [47], an authority on energy demand forecasting and transport demand forecasting in China. According to the ERI’s prediction, the annual PKM growth rates (2011 to 2020) for rail, road, aviation and water transportation are 3.6%, 5.3%, 9.0% and 0.0%, respectively, and the annual TKM growth rates of rail, road, aviation and water transportation are 4.0%, 6.8%, 9.2% and 4.5%, respectively. The TKM and PKM in 2020 of each transport mode can be calculated using the annual growth rate, and the predictions for rail, road, aviation and water transport in 2020 are shown in Table 1.
Table 1. The predictions of passenger-kilometers (PKM) and freight ton-kilometers (TKM) (2020) of rail, road, aviation and water transport in China.
YearPKM (billion passengers-km)TKM (billion tons-km)
RailRoadAviationWaterRailRoadAviationWater
2011961.21676.0453.77.52946.65137.517.47542.4
(31.0%)(54.1%)(14.6%)(0.2%)(18.5%)(32.2%)(0.1%)(47.3%)
20201322.52677.9985.47.54211.19251.038.511,169.0
(26.5%)(53.6%)(19.7%)(0.1%)(16.5%)(36.3%)(0.2%) (43.8%)
Notes: numbers in brackets indicate the percentage that each transport accounts for of the total PKM or TKM.

3. Results and Discussion

3.1. Energy Efficiency Assessments for Different Transport Modes

The different transport modes, including rail (1971 to 2011), road (1971 to 2011), aviation (1982 to 2011) and water (1992 to 2011), were considered a set of DMUs. The energy efficiency scores of these transport modes were calculated by the program DEAP Version 2.1 developed by Tim Coelli (see Table 2).
Table 2. Energy efficiency scores of rail, road, aviation and water transport in China.
YearEnergy EfficiencyYearEnergy Efficiency
RailRoadAviationRailRoadAviationWater
19710.198 0.072 -19920.464 0.154 0.397 0.921
19720.200 0.069 -19930.514 0.150 0.473 0.801
19730.207 0.065 -19940.629 0.183 0.485 0.882
19740.202 0.057 -19950.702 0.184 0.454 0.787
19750.184 0.056 -19960.582 0.161 0.393 0.346
19760.171 0.060 -19970.651 0.194 0.305 0.626
19770.171 0.062 -19980.610 0.205 0.335 0.766
19780.181 0.065 -19990.689 0.209 0.261 0.515
19790.190 0.070 -20000.636 0.146 0.292 0.455
19800.216 0.087 -20010.666 0.153 0.338 0.489
19810.205 0.106 -20020.682 0.156 0.293 0.510
19820.211 0.116 0.727 20030.615 0.139 0.279 0.466
19830.230 0.119 0.540 20040.668 0.134 0.337 0.694
19840.246 0.131 0.606 20050.680 0.128 0.404 0.761
19850.285 0.164 0.702 20060.736 0.125 0.468 0.747
19860.308 0.175 0.759 20070.787 0.132 0.467 0.746
19870.342 0.177 0.847 20080.834 0.130 0.437 0.802
19880.371 0.185 0.877 20090.877 0.134 0.464 0.844
19890.361 0.185 0.679 20100.943 0.125 0.456 0.947
19900.364 0.167 0.512 20111.000 0.126 0.520 1.000
19910.406 0.157 0.375 -----
The results showed that the performances of rail transport in 2011 and water transport in 2011 were the best in terms of energy efficiency. The energy efficiencies of rail transport in 1971, 1981, 1991 and 2001 were 24.0%, 22.8%, 45.0% and 66.7% of that in 2011, respectively, and they increased steadily after the 1980s. The energy efficiency of road transport was much lower, with the results indicating that this value in 2011 was only 12.6% of the optimal efficiency figure. Therefore, to increase the efficiency of road transportation to optimal levels while maintaining the same PKM and TKM levels, the energy consumption of road transport in 2011 would have to be reduced by 87.4% to maintain the same output level. The energy efficiency of aviation transportation was lower than that of rail (and water), but higher than that of road transportation. The energy efficiency of aviation in 2011 was 52.0% of the optimal efficiency score, which indicates that to increase its efficiency to optimal levels while maintaining the same PKM and TKM levels, the energy consumption of aviation transportation in 2011 would have to be reduced by 48.0%.
The DEA results illustrated the differences in energy efficiency among different transport modes. In 2011, the latest year considered in the analysis, rail and water transport were the most energy efficient, whereas road and aviation were much less efficient. Rail, road, aviation and water transport accounted for 18.5%, 32.2%, 0.1% and 47.3% of the total TKM and 31.0%, 54.1%, 14.6% and 0.2% of the total PKM, respectively (see Table 1). Road transportation accounted for a relatively high proportion of the total performance of transport activities, whereas its efficiency was the lowest. These results may provide useful references for saving energy in transportation. If the transport system changes in favor of a mode with higher efficiency, such as rail transport, the total energy efficiency of transport will be improved, thus improving transport energy savings and reducing emissions.

3.2. Estimation of Future Energy Consumption of Transport in China

Based on the extended DEA model, the first step to estimating future energy consumption is to determine the most energy-efficient year of each transport mode. Each transport mode is considered a set of DMUs, and the DEA results are listed in Table 3.
Table 3. DEA results of each transport mode in China.
YearEnergy EfficiencyYearEnergy Efficiency
RailRoadAviationRailRoadAviationWater
19710.2400.343-19920.5030.7950.4531.000 *
19720.2370.332-19930.5440.7560.5560.867
19730.2430.312-19940.6650.9130.5540.941
19740.2290.275-19950.7610.9100.5180.830
19750.2150.269-19960.6470.7960.4470.363
19760.1930.287-19970.7080.9360.3880.654
19770.2000.295-19980.6330.9830.4740.791
19780.2190.311-19990.6951.000 *0.4350.528
19790.2250.336-20000.6360.7010.5110.464
19800.2460.417-20010.6670.7320.4570.496
19810.2280.507-20020.6900.7500.4030.516
19820.2340.5550.82820030.6600.6660.4320.470
19830.2510.5700.71120040.6980.6410.4590.696
19840.2620.6260.76320050.7140.6160.5270.763
19850.2980.8280.86220060.7630.6040.6300.749
19860.3220.8780.86520070.8140.6440.6580.747
19870.3550.9271.000 *20080.8540.9460.6130.803
19880.3710.9831.000 *20090.8951.000 *0.5870.845
19890.3790.9830.84820100.9550.9590.6820.947
19900.4110.8870.61520111.000 *1.000 *0.6741.000 *
19910.4500.8150.428-----
Notes: the most energy efficient years of each transport mode are marked by *.
The most efficient recent years of rail, road, aviation and water transportation are 2011, 2011, 1988 and 2011, respectively. Following the steps of the extended DEA model, the first two rounds of energy consumption for rail, road, aviation and water transport in 2020 in China can be estimated. The estimated results are shown in Table 4.
Table 4. The first two rounds of the estimated energy consumption (ktce).
YearRailRoadAviationWater
201117,497242,01715,87824,009
2020-Round 125,047 (4.1%)436,025 (6.8%)23,703 (4.6%)35,574 (4.5%)
2020-Round 224,043 (3.6%)413,832 (6.1%)20,432 (2.8%)35,412 (4.4%)
Notes: numbers in brackets indicate the annual growth rate of each transport during 2011–2020.
If the energy efficiency of rail, road, aviation and water transport in 2020 is to be the sole relative efficiency scores among the considered DMUs, the 2020-Round 2 values shown in Table 4 are representative of the estimated energy consumption of those four transport modes. In 2020, the energy consumptions of these four transport modes will be 24,043, 413,832, 20,432 and 35,412 ktce, respectively, and the annual growth rates of rail, road, aviation and water transport from 2011 to 2020 are 3.6%, 6.1%, 2.8% and 4.4%, respectively. Compared with the annual growth rate of the transportation sectors (listed in Table 5), the total transport energy consumption (pipeline and non-specified excluded) annual growth rate is higher because of road transport, which is inefficient and accounts for a relatively higher share of the transport structure (53.6% of PKM and 36.3% of TKM in 2020). This growth rate also indicates a modal split in favor of transport modes with high energy efficiency, which will benefit energy savings in the transportation sector.
Table 5. The annual growth rate (2011–2020) of the performance and energy consumption of each transport mode (%).
Annual growth rateRailRoadAviationWaterTotal (pipeline and non-specified excluded)
PKM3.65.39.00.05.4
TKM4.06.89.24.55.0
Energy Consumption3.66.12.84.45.7
Assuming that expected energy efficiency improvements occur over time, the actual energy consumption in 2020 should be lower than the value estimated in the second round of the model. Therefore, with reference to the efficiency improvements in the past, this analysis proposes the following assumptions for the third-round estimation: (1) energy efficiency of rail transport in 2020 increases 15% from that of 2011; (2) energy efficiency of road transport in 2020 increases 10% from that of 2011; (3) efficiency improvements are not considered in the aviation transport until 2020; and (4) energy efficiency of water transportation in 2020 increases 15% from that of 2011. The third-round estimation results are listed in Table 6.
Table 6. The third round of the estimated energy consumption in ktce.
YearRailRoadAviationWater
201117,497242,01715,87824,009
2020-Round 320,460 (1.8%)368,706 (4.8%)20,432 (2.8%)29,983 (2.5%)
Notes: numbers in brackets indicate the annual growth rate of each transport during 2011–2020.
The results of our analysis show that the annual growth rates of rail, road, aviation and water transportation from 2011 to 2020 were 1.8%, 4.8%, 2.8% and 2.5%, respectively, when efficiency improvements were considered. The total transport energy consumption (pipeline and non-specified are excluded) in 2020 is calculated at 439,581 ktce, whereas the annual growth rate from 2011 to 2020 is 4.4%. With reference to prior trends, wherein pipeline and non-specified modes accounted for approximately 0.8% of total transport energy consumption, the total transport energy consumption in 2020 is estimated at 443,126 ktce.
Comparisons between the results of this study and previous studies are listed in Table 7. In the World Energy Outlook 2007 [48], the IEA forecasts the future transport energy demand based on some key assumptions in the gross domestic product (GDP) growth rates, industrial structure, population and urbanization. The energy demand in the transport sector was expected to grow by 4.4% from 2015 to 2030, which is equal to the growth rate obtained in this paper using a DEA approach for the period 2011 to 2020. As summarized by Wang et al. [49], ERI [50] and Zhang et al. [51], they employed a partial least squares regression and presented similar results with two scenarios. The estimation results obtained using DEA are higher than those of the IEA and between the results of the two scenarios produced by the partial least squares regression. Liu et al. [52] also used the TransportPLAN as a bottom-up modeling tool to investigate the future transport energy demand, showing that the transport energy demand of the reference case and the combined case in 2020 was 601 mtce and 522 mtce, respectively. Their estimations are higher than those of DEA, because energy consumption of private vehicles and non-commercial vehicles was incorporated into the TransportPLAN model.
Table 7. The future transport energy consumption in the previous research.
Ref.ModelFuture transport energy consumption (mtce)
International Energy Agency, 2007 [48]Reference scenario analysis425.22
Energy Research Institute, 2006 [50]Partial least square regressionBaseline scenario460
Policy scenario416
Zhang et al., 2009 [51]Partial least square regressionScenario 1468.26
Scenario 2433.13
Liu et al., 2013 [52]TransportPLANReference case601
(17,605 PJ)
Combined case522
(15,306 PJ)
This studyExtended DEA model443.13
According to the Energy Strategy Action Plan 2014 to 2020 report published by the National Energy Administration of China [53], the national total energy consumption should be controlled under 4.8 billion tce, and the annual growth rate in the total energy consumption for the period 2014 to 2020 should be approximately 3.8%. Therefore, the estimated transport energy consumption is expected to increase faster than the total energy consumption because of the rapid growth of transportation needs in the coming years.

4. Conclusions

The DEA approach is regarded as an effective method of assessing the relative efficiency of a set of DMUs with multiple inputs and outputs, and it does not require that the relationships between inputs and outputs be identified through subjective assumptions. In this paper, the energy consumption of each transport mode is considered as the input, and the PKM and TKM of each transport mode are considered the outputs of the DEA in the assessment of the relative energy efficiencies of rail, road, aviation and water transport modes in China from 1971 to 2011. Empirical results showed that rail and water transport in 2011 were the most efficient among all of the DMUs. The energy efficiency of rail transport increased steadily after the 1980s, and water transport increased steadily after the 2000s. The energy efficiency of aviation was lower than that of rail and water transportation, with the energy efficiency of road transport the lowest. In 2011, the efficiencies of aviation and road transport accounted for 52.0% and 12.6% of the highest efficiency figures.
This paper employed an extended DEA model to estimate future transport energy consumption. The results showed that if the energy efficiency of each transport mode in 2020 remains as high as in the observed period, the energy consumption of rail, road, aviation and water in 2020 will be 24,043, 413,832, 20,432 and 35,412 ktce, respectively. Assuming efficiency improvements over time, the energy consumption of rail, road, aviation and water in 2020 will be 20,460, 368,706, 20,432 and 29,983 ktce, respectively. If pipeline and non-specified transport energy consumption are considered, the total transport energy consumption in 2020 will be 443,126 ktce, which is close to the results provided by the ERI [50] and Zhang et al. [51]. The annual growth rate of transport energy consumption from 2011 to 2020 is expected to be 4.4%, which is higher than the national total energy consumption (3.8%).
These empirical study results may help researchers determine differences in energy efficiencies among rail, road, aviation and water transportation. In 2011, the energy efficiency of road transport was the lowest, although it accounted for the greatest share of total performance among national transport modes. A modal split in favor of modes with higher energy efficiency, such as rail transport, will promote improvements in the total energy efficiency of transportation, increase transportation energy savings and reduce emissions. Without efficiency improvements, the annual growth rate of total transport energy consumption will be higher than the performance of transport, which is directly related to the inefficiency of road transport, which still accounts for a relatively high share in the transport structure in 2020.

Acknowledgments

This work was supported by the Major Research Plan of the National Natural Science Foundation of China (No. 91325302), the Fund for Creative Research Groups of the National Natural Science Foundation of China (No. 51121003), the National Natural Science Foundation of China (No. 41271543), the Fundamental Research Funds for the Central Universities (No. 2012WYB20) and the Specialized Research Fund for the Doctoral Program of Higher Education of China (No. 20130003110027).

Author Contributions

Weibin Lin contributed to the concept and design of the article. Bin Chen and Haoran Pan provided some useful advice and modified the draft. Lina Xie collected and analyzed the data.

Conflicts of Interest

The authors declare no conflict of interest.

References

  1. International Enegy Agency. Statistic, Statistic Search. Available online: http://www.iea.org/statistics/statisticssearch/ (accessed on 4 January 2015).
  2. Department of Energy Statistics, National Bureau Statistics, People’s Republic of China. China Energy Statistical Yearbook 2013; China Statistics Press: Beijing, China, 2014. (In Chinese)
  3. Intergovernmental Panel on Climate Change. Summary for Policy Makers. Available online: http://www.climatechange2013.org/images/report/WG1AR5_SPM_FINAL.pdf (accesses on 4 January 2015).
  4. International Enegy Agency. CO2 Emissions From Fuel Combustion Highlights. Available online: http://www.iea.org/publications/freepublications/publication/CO2EmissionsFromFuelCombustionHighlights2014.pdf (accessed on 4 January 2015).
  5. Ramanathan, R. A holistic approach to compare energy efficiencies of different transport modes. Energy Policy. 2000, 28, 743–747. [Google Scholar] [CrossRef]
  6. Charnes, A.; Cooper, W.W.; Rhodes, E. Measuring the efficiency of decision making units. Eur. J. Oper. Res. 1978, 2, 429–444. [Google Scholar] [CrossRef]
  7. Mukherjee, K. Energy use efficiency in U.S. manufacturing: A nonparametric analysis. Energy Econ. 2008, 30, 76–96. [Google Scholar] [CrossRef]
  8. Honma, S; Hu, J. Total-factor energy efficiency of regions in Japan. Energy Policy 2008, 36, 821–833. [Google Scholar]
  9. Sueyoshi, T.; Goto, M. DEA approach for unified efficiency measurement: Assessment of Japanese fossil fuel power generation. Energy Econ. 2011, 33, 292–303. [Google Scholar] [CrossRef]
  10. Goto, M.; Otsuka, A.; Sueyoshi, T. DEA (Data Envelopment Analysis) assessment of operational and environmental efficiencies on Japanese regional industries. Energy 2014, 66, 535–549. [Google Scholar] [CrossRef]
  11. Hu, J.; Lio, M.; Yeh, F.; Lin, C. Environment-adjusted regional energy efficiency in Taiwan. Appl. Energy. 2011, 88, 2893–2899. [Google Scholar] [CrossRef]
  12. Fang, C.; Hu, J.; Lou, T. Environment-adjusted total-factor energy efficiency of Taiwan’s service sectors. Energy Policy 2013, 63, 1160–1168. [Google Scholar] [CrossRef]
  13. Blomberg, J.; Henriksson, E.; Lundmark, R. Energy efficiency and policy in Swedish pulp and paper mills: A data envelopment analysis approach. Energy Policy 2012, 42, 569–579. [Google Scholar] [CrossRef]
  14. Voltes-Dorta, A.; Perdiguero, J.; Jiménez, J.L. Are car manufacturers on the way to reduce CO2 emissions? A DEA approach. Energy Econ. 2013, 38, 77–86. [Google Scholar] [CrossRef]
  15. Blancard, S.; Martin, E. Energy efficiency measurement in agriculture with imprecise energy content information. Energy Policy 2014, 66, 198–208. [Google Scholar] [CrossRef]
  16. Mukherjee, K. Measuring energy efficiency in the context of an emerging economy: The case of indian manufacturing. Eur. J. Oper. Res. 2010, 201, 933–941. [Google Scholar] [CrossRef]
  17. Mandal, S.K. Do undesirable output and environmental regulation matter in energy efficiency analysis? Evidence from Indian Cement Industry. Energy Policy 2010, 38, 6076–6083. [Google Scholar] [CrossRef]
  18. Ramanathan, R. Estimating Energy Consumption of Transport Modes in India Using DEA and Application to Energy and Environmental Policy. J. Op. Res. Soc. 2005, 56, 732–737. [Google Scholar] [CrossRef]
  19. Khoshnevisan, B.; Rafiee, S.; Omid, M.; Mousazadeh, H. Reduction of CO2 emission by improving energy use efficiency of greenhouse cucumber production using DEA approach. Energy 2013, 55, 676–682. [Google Scholar] [CrossRef]
  20. Zhou, P.; Ang, B.W. Linear programming models for measuring economy-wide energy efficiency performance. Energy Policy 2008, 36, 2911–2916. [Google Scholar] [CrossRef]
  21. Zhang, X.; Cheng, X.; Yuan, J.; Gao, X. Total-factor energy efficiency in developing countries. Energy Policy 2011, 39, 644–650. [Google Scholar] [CrossRef]
  22. Song, M.; Zhang, L.; Liu, W.; Fisher, R. Bootstrap-DEA analysis of BRICS’ energy efficiency based on small sample data. Appl. Energy. 2013, 112, 1049–1055. [Google Scholar] [CrossRef]
  23. Vlontzos, G.; Niavis, S.; Manos, B. A DEA approach for estimating the agricultural energy and environmental efficiency of EU countries. Renew. Sustain. Energy Rev. 2014, 40, 91–96. [Google Scholar] [CrossRef]
  24. Meng, F.Y.; Zhou, P.; Zhou, D.Q.; Bai, Y. Inefficiency and Congestion Assessment of Mix Energy Consumption in 16 APEC Countries by using DEA Window Analysis. Energy Procedia 2014, 61, 2518–2523. [Google Scholar] [CrossRef]
  25. Hu, J.; Wang, S. Total-factor energy efficiency of regions in China. Energy Policy. 2006, 34, 3206–3217. [Google Scholar] [CrossRef]
  26. Wei, C.; Shen, M.H. Energy efficiency and its influencing factors: An empirical analysis based on DEA. Manag. World 2007, 8, 66–76. (In Chinese) [Google Scholar]
  27. Shu, T.; Zhong, X.; Zhang, S. TFP Electricity Consumption Efficiency and Influencing Factor Analysis Based on DEA Method. Energy Procedia 2011, 12, 91–97. [Google Scholar]
  28. Wang, Z.; Zeng, H.; Wei, Y.; Zhang, Y. Regional total factor energy efficiency: An empirical analysis of industrial sector in China. Appl. Energy 2012, 97, 115–123. [Google Scholar] [CrossRef]
  29. Wang, Z.; Feng, C.; Zhang, B. An empirical analysis of China’s energy efficiency from both static and dynamic perspectives. Energy 2014, 74, 322–330. [Google Scholar] [CrossRef]
  30. Yeh, T.; Chen, T.; Lai, P. A comparative study of energy utilization efficiency between Taiwan and China. Energy Policy 2010, 38, 2386–2394. [Google Scholar] [CrossRef]
  31. Shi, G.; Bi, J.; Wang, J. Chinese regional industrial energy efficiency evaluation based on a DEA model of fixing non-energy inputs. Energy Policy 2010, 38, 6172–6179. [Google Scholar] [CrossRef]
  32. Lin, W.; Yang, J.; Chen, B. Temporal and spatial analysis of intergrated energy and environment efficiency in China based on a green GDP index. Energies 2011, 4, 1367–1390. [Google Scholar] [CrossRef]
  33. Yang, L.; Wang, K. Regional differences of environmental efficiency of China’s energy utilization and environmental regulation cost based on provincial panel data and DEA method. Math. Computer Model. 2013, 58, 1074–1083. [Google Scholar] [CrossRef]
  34. Bian, Y.; He, P.; Xu, H. Estimation of potential energy saving and carbon dioxide emission reduction in China based on an extended non-radial DEA approach. Energy Policy 2013, 63, 962–971. [Google Scholar] [CrossRef]
  35. Bi, G.; Song, W.; Zhou, P.; Liang, L. Does environmental regulation affect energy efficiency in China’s thermal power generation? Empirical evidence from a slacks-based DEA model. Energy Policy 2014, 66, 537–546. [Google Scholar] [CrossRef]
  36. Song, M.; Yang, L.; Wu, J.; Lv, W. Energy saving in China: Analysis on the energy efficiency via bootstrap-DEA approach. Energy Policy 2013, 57, 1–6. [Google Scholar] [CrossRef]
  37. Wang, K.; Lu, B.; Wei, Y. China’s regional energy and environmental efficiency: A Range-Adjusted Measure based analysis. Appl. Energy 2013, 112, 1403–1415. [Google Scholar] [CrossRef]
  38. Chang, Y.; Zhang, N.; Danao, D.; Zhang, N. Environmental efficiency analysis of transportation system in China: A non-radial DEA approach. Energy Policy 2013, 58, 277–283. [Google Scholar] [CrossRef]
  39. Zhou, G.; Chung, W.; Zhang, Y. Measuring energy efficiency performance of China’s transport sector: A data envelopment analysis approach. Expert Syst. Appl. 2014, 41, 709–722. [Google Scholar] [CrossRef]
  40. Cui, Q.; Li, Y. The evaluation of transportation energy efficiency: An application of three-stage virtual frontier DEA. Transp. Res. Part D 2014, 29, 1–11. [Google Scholar] [CrossRef]
  41. Burley, H. Productive efficiency in U.S. manufacturing: A linear programming approach. Rev. Econ. Stat. 1980, 62, 619–622. [Google Scholar] [CrossRef]
  42. Banker, R.D.; Charnes, A.; Cooper, W.W. Some models for estimating technical and scale inefficiencies in data envelopment analysis. Manag. Sci. 1984, 30, 1078–1092. [Google Scholar] [CrossRef]
  43. Fare, R.; Grosskopf, S.; Norris, M.; Zhang, Z. Productivity growth, technical progress, and efficiency changes in industrialized countries. Am. Econ. Rev. 1994, 84, 66–83. [Google Scholar]
  44. Lovell, C.A.K.; Grosskopf, S.; Ley, E. Linear programming approaches to the measurement and analysis of productive efficiency. Top 1994, 2, 175–248. [Google Scholar] [CrossRef]
  45. International Energy Agency. World Energy Statistics and Balances (2013 edition). Available online: http://data.iea.org/ieastore/product.asp?dept_id=101&pf_id=205 (accessed on 7 December 2013).
  46. National Bureau of Statistics of China. Available online: http://data.stats.gov.cn/workspace/index?m=hgnd (accesses on 4 January 2015). (In Chinese)
  47. Energy Research Institute (ERI), National Development and Reform Commission, People’s Republic of China. China’s Low Carbon Development Pathways by 2050; ERI: Beijing, China, 2009. (In Chinese)
  48. International Energy Agency. World Energy Outlook 2007—Special Report—Focus on China and India. Available online: http://www.iea.org/publications/freepublications/publication/weo-2007---special-report---focus-on-china-and-india.html (accessed on 19 March 2015).
  49. Wang, Y.; Li, K.; Xu, X.; Zhang, Y. Transport energy consumption and saving in China. Renew. Sustain. Energy Rev. 2014, 29, 641–655. [Google Scholar] [CrossRef]
  50. Energy Research Institute, National Devlopment and Reform Commission. Scenarios Analysis of China’s Energy Demand for 2050, Technical Report; ERI: Beijing, China, 2006. (In Chinese) [Google Scholar]
  51. Zhang, M.; Mu, H.; Li, G.; Ning, Y. Forecasting the transport energy demand based on PLSR method in China. Energy 2009, 34, 1396–1400. [Google Scholar] [CrossRef]
  52. Liu, W.; Lund, H.; Mathiesen, B. Modelling the transport system in China and evaluating the current strategies towards the sustainable transport development. Energy Policy 2013, 58, 347–357. [Google Scholar] [CrossRef]
  53. The General Office of State Council. Energy Strategy Action Plan 2014 to 2020. Available online: http://www.gov.cn/zhengce/content/2014-11/19/content_9222.htm (accessed on 19 March 2015). (In Chinese)

