Evaluation of Fatigue Crack Propagation of Gears Considering Uncertainties in Loading and Material Properties


1
Department of Mechanical Engineering, University of Massachusetts Lowell, Lowell, MA 01854, USA
2
Department of Mechanical Engineering, Texas Tech University, Lubbock, TX 79409, USA
3
School of Engineering, Computer Science and Mathematics, West Texas A&M University, Canyon, TX 79016, USA
*
Author to whom correspondence should be addressed.
Sustainability 2017, 9(12), 2200; https://doi.org/10.3390/su9122200
Submission received: 1 November 2017
/
Revised: 26 November 2017
/
Accepted: 26 November 2017
/
Published: 29 November 2017
(This article belongs to the Special Issue The Impact and Innovation of Wind Turbine Technologies)
Abstract
:Failure prediction of wind turbine gearboxes (WTGs) is especially important since the maintenance of these components is not only costly but also causes the longest downtime. One of the most common causes of the premature fault of WTGs is attributed to the fatigue fracture of gear teeth due to fluctuating and cyclic torque, resulting from stochastic wind loading, transmitted to the gearbox. Moreover, the fluctuation of the torque, as well as the inherent uncertainties of the material properties, results in uncertain life prediction for WTGs. It is therefore essential to quantify these uncertainties in the life estimation of gears. In this paper, a framework, constituted by a dynamic model of a one-stage gearbox, a finite element method, and a degradation model for the estimation of fatigue crack propagation in gear, is presented. Torque time history data of a wind turbine rotor was scaled and used to simulate the stochastic characteristic of the loading and uncertainties in the material constants of the degradation model were also quantified. It was demonstrated that uncertainty quantification of load and material constants provides a reasonable estimation of the distribution of the crack length in the gear tooth at any time step.
1. Introduction
Wind energy has been considered one of the most promising renewable energy sources due to its low environmental impact and high potential for cost reduction [1,2]. Optimistic estimations point out that by 2020 wind energy will be responsible for up to 12% of the global energy matrix, rising to 22% by 2030 [3]. In order to allow for this substantial growth, a reduction in operation and maintenance costs of wind turbines is needed to increase the reliability of turbines during their designed lifetime. For this reason, the adoption of advanced prognostics and health management strategies is crucial to ensure the turbine reliability and the profitable operation of wind farms [4]. Among all components, wind turbine gearboxes (WTGs) represent a critical problem in terms of durability and reliability [5]. Since the scale of wind turbines dimensions has increased considerably in the past years, gearboxes have been reported as one of the components that is most prone to premature failure [6,7]. Moreover, the combination of long downtimes and the high cost of the maintenance procedures contributes to the high cost of wind energy [8,9] compared to other non-renewable energy sources. Therefore, in order to bring the cost of wind energy down to competitive levels, substantial improvements in the durability and reliability of gearboxes need to be achieved [5]. One of the most common causes of the premature fault of WTGs is attributed to the fracture of gear teeth due to fatigue [10]. Due to the cyclic and irregular loadings experienced by gears resulting from the power transmission, as well as improper gear design and assembly misalignments, cracks can nucleate and propagate through the gear teeth [11,12]. This leads to progressive damage of the teeth and ultimately to the complete failure of the gear [13,14]. However, crack nucleation and propagation in gear teeth of WTGs running under real-life conditions are complex phenomena, which involve the interaction of several stochastic parameters. Despite the advances brought by recent crack propagation models on gear teeth [15,16], further enhancements are needed to accurately assess fatigue life of gears in WTGs considering the variability of system parameters. The loads transmitted through the tooth contact forces in WTGs are functions of the rotor speed, which in turn depends on the incoming wind speed. However, these loads are subjected to significant stochastic fluctuations due to turbulence effects on the wind flow, which directly impacts on the reliability of WTGs [6,7,17]. Therefore, the suitable modeling of the wind speed uncertainties and their accurate propagation through the rotor shaft to the tooth contact forces should bring considerable advances in the reliability analysis of WTGs [18]. Indeed, the majority of design practices on WTGs have been considering deterministic approaches on the reliability analysis of such systems. However, it is imperative to take into consideration the uncertainties involved in the design, manufacturing, assembly, and operation parameters to determine the reliability or the probability of failure of gearbox systems. Reliability analysis of typical wind turbine gear systems was proposed by Alemayehu and Ekwaro-Osire [6,7,9] in a probabilistic multibody dynamic model taking into account the uncertainties of design and loading parameters. These authors pointed out that probabilistic analysis can bring improvements in the reliability of gearboxes in wind turbines and help designers to identify the most critical parameters.
Based on the background outlined above the motivations for the present paper are:
- It has been reported that WTGs represent a critical problem in terms of reliability due to the high incidence of premature failure [5,6,7], which contributes considerably to the increase of wind energy cost [8,9]. For this reason, enhanced reliability analysis on WTGs can contribute to reducing the costs of wind energy;
- Gear teeth fracture resulting from fatigue crack propagation is amongst the main causes of WTG failure due to the irregular and cyclic nature of loads on the gears [10,11,12]. Fatigue crack nucleation and propagation in gear teeth is a complex phenomenon and needs to be considered in reliability analysis to accurately determine the life of WTGs;
- Due to the turbulence effects in the wind flow, the loads experienced by WTGs are subjected to significant random fluctuations, which have been shown to considerably impact the reliability of the gearboxes [6,7,17]. Furthermore, most of the design practices for WTGs do not consider the uncertainties of design and loading parameters in reliability analysis [6,7,9]. For this reason, probabilistic analysis can improve the reliability of WTGs and help designers to identify the most critical parameters.
This present paper aims to contribute to the improvement of the reliability analysis of wind turbine gearboxes by quantifying uncertainties of design and loading parameters. In order to do it, the objectives are:
- To perform the dynamic modeling of a gear tooth subjected to fatigue loading;
- To build a finite element (FE) model for the crack propagation in the gear tooth to determine the stress intensity factor (SIF) at the crack tip;
- To quantify the uncertainties of the loads on the gear tooth and material properties; and
- To evaluate the fatigue crack propagation of gears considering uncertainties in loading and material properties.
The remaining sections of the paper are organized as follows: Section 2 presents the dynamic modeling of the gear, FE model for the crack propagation in the gear tooth, uncertainty quantification of the loadings, and the probabilistic prediction of the fatigue crack propagation of the gear; Section 3 presents results and their discussion; and Section 4 outlines the main conclusions of the paper.
2. Methodology
The prediction of the fatigue crack propagation of a one-stage gearbox with an existing crack in the root of one of the teeth was investigated by combining dynamic modeling, SIF calculation, and the gear degradation estimation.
2.1. Dynamic Modeling
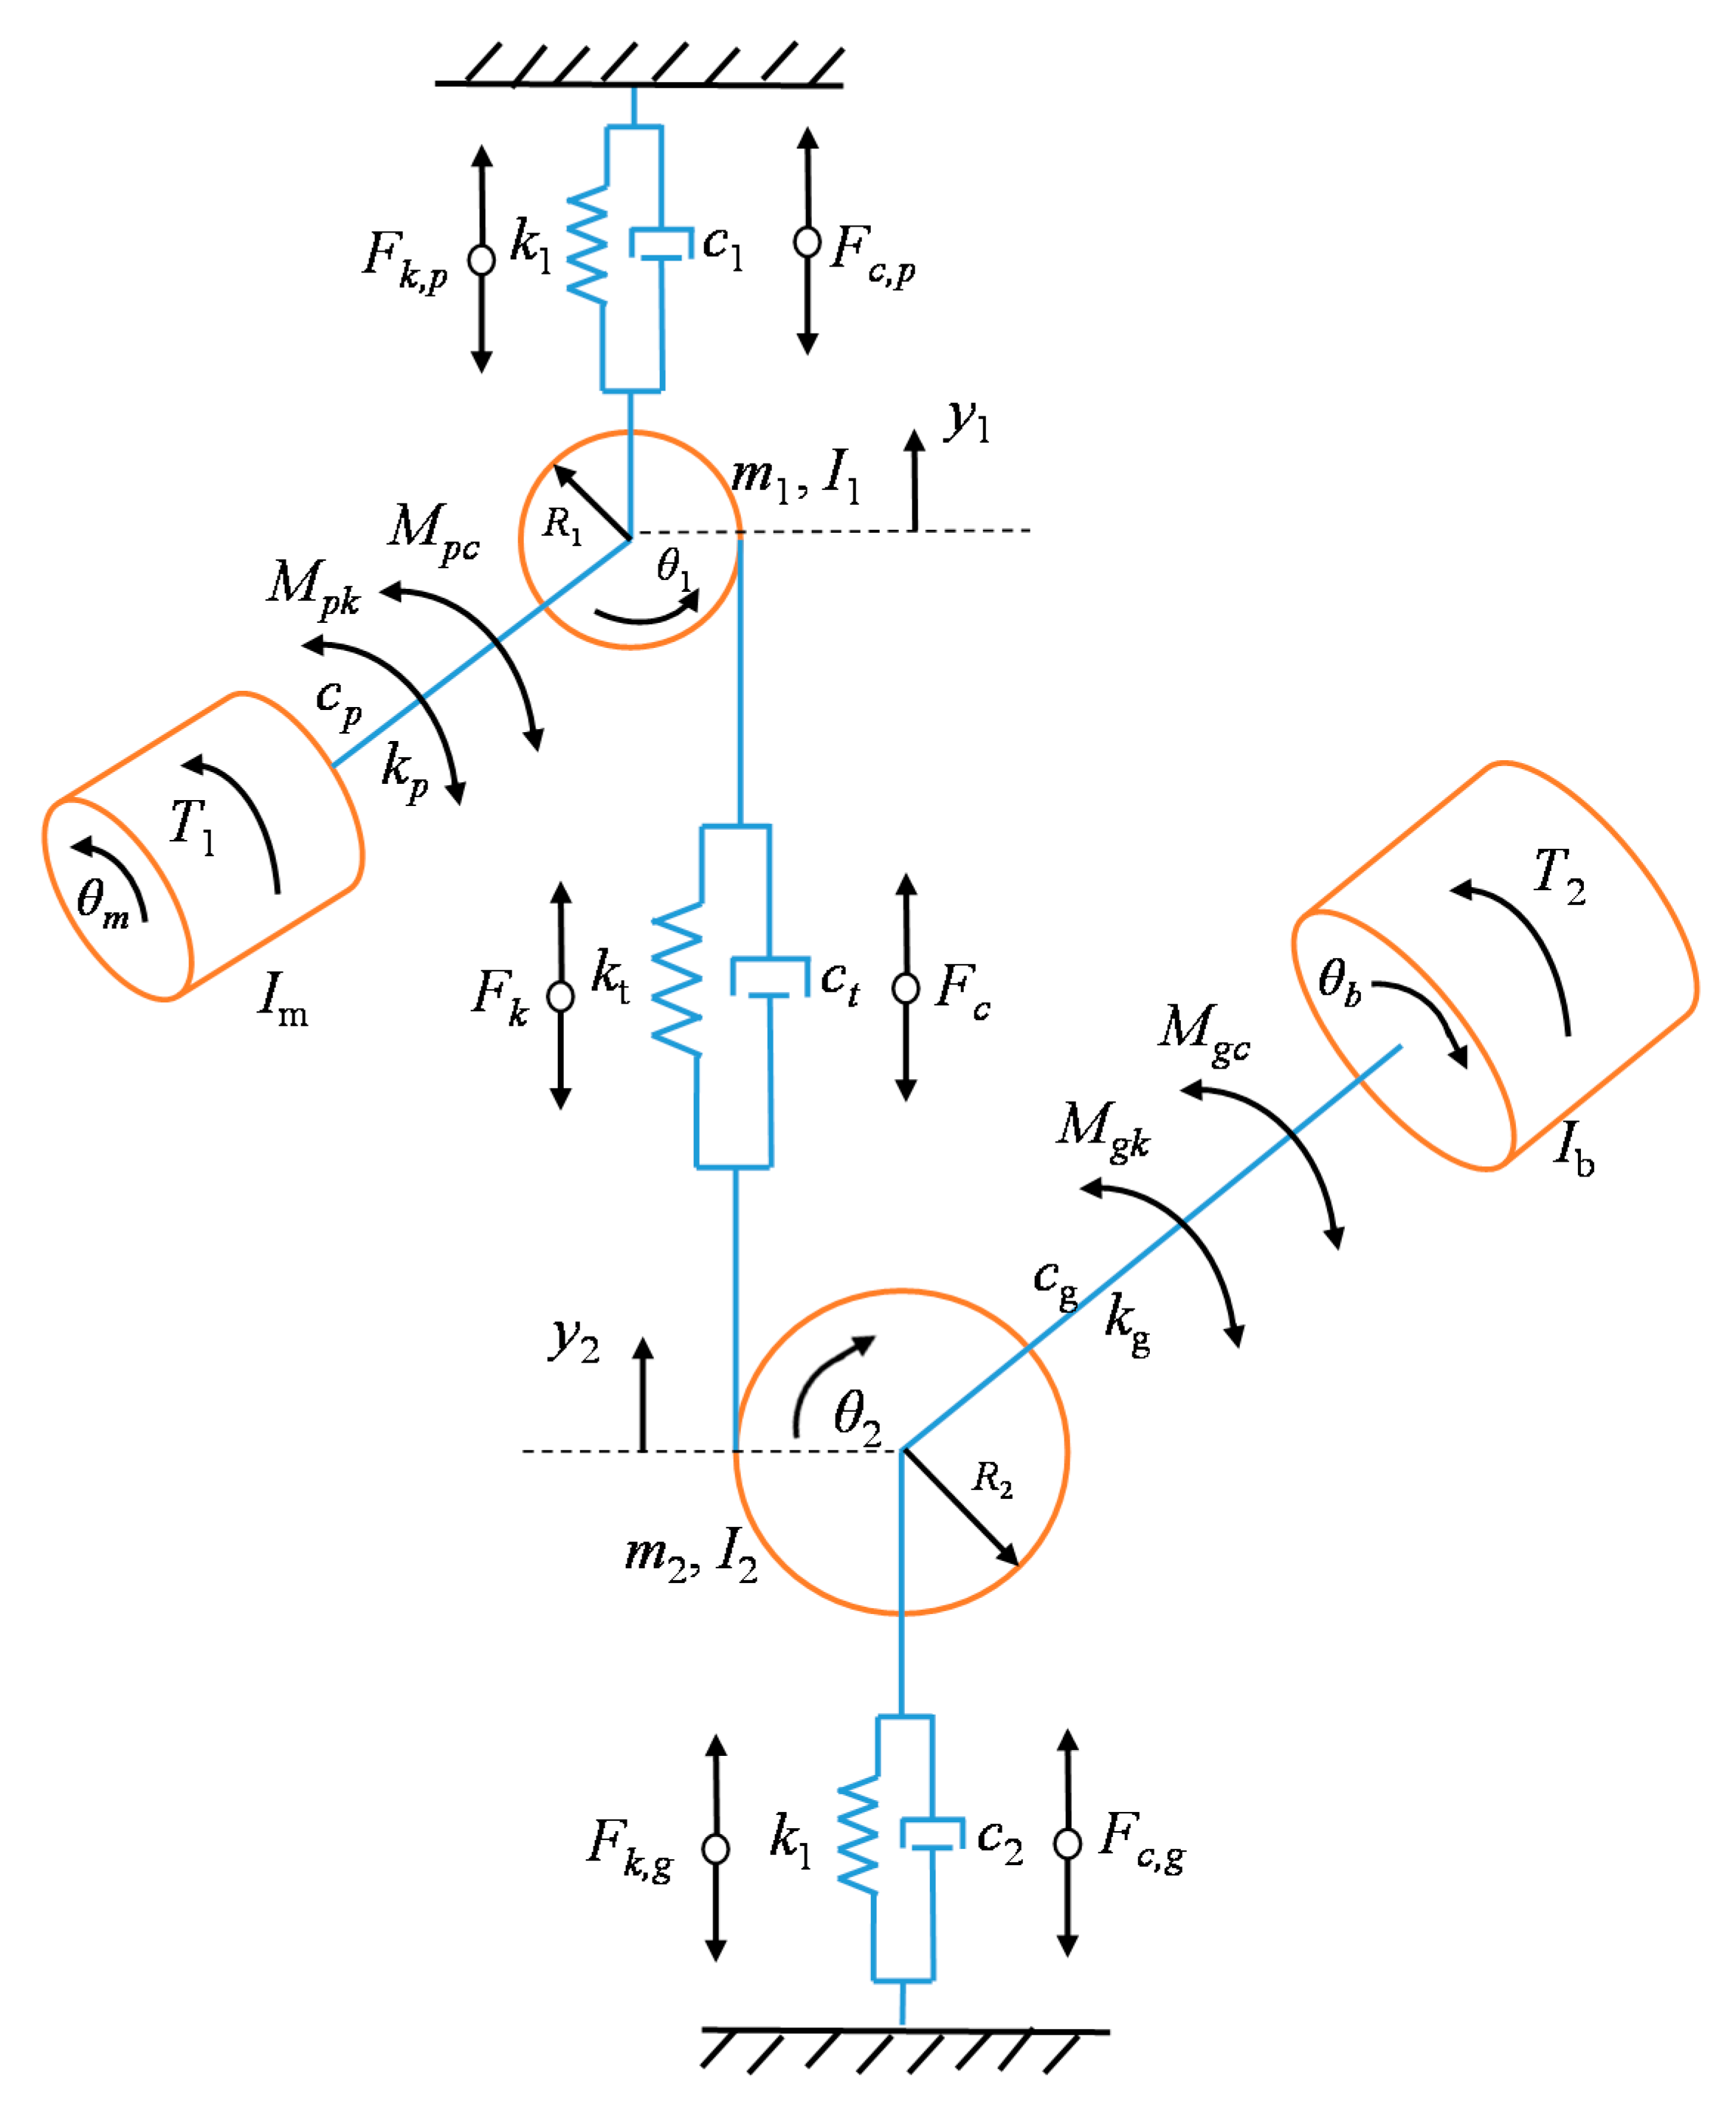
The dynamic modeling of the six degrees-of-freedom (DOF) one-stage gearbox was performed in MATLAB. The free-body diagram of the one-stage gearbox modeled is shown in Figure A1 in Appendix A, in which the description of each model parameter is presented in the Nomenclature section. The parameters of the gear used were similar to those used in [15]. The model provided a dynamic response for perfect gears and for gears with different crack lengths on their teeth. The mesh stiffness calculation was performed by using the potential energy method described in [15,19]. The input and output torques used in the dynamic analysis were obtained from WTG torque time history data [6] and were scaled down. However, the fatigue loading on the gear teeth is different from the fatigue torque loading on the input shaft. Since the purpose of this paper is to analyze fatigue crack propagation of the gear teeth, the fatigue loads on the gear teeth are estimated. These fatigue loads on the gear teeth range from zero to a maximum torque. Hence, the maximum torque values are used in the dynamic modeling to calculate the forces on the gear teeth. The equations of motion for a six-DOF one-stage gearbox system are given by [15]:
All variables in Equations (1)–(8) are defined in the Nomenclature section. The rotational frequency of the input shaft is assumed to be 30 Hz.
2.2. Calculation of Stress Intensity Factor
The model of the cracked gear was constructed in SOLIDWORKS and imported into ANSYS. The mesh generation and implementation of boundary conditions were performed in ANSYS and the model was solved for nodal displacements. The type of element used to mesh the model was PLANE183. PLANE183 is a 2-D element with eight or six nodes and has two DOF (x and y translations) at each of its nodes. PLANE183 can be used to represent deformations of several material types such as fully incompressible hyperelastic and nearly incompressible elastoplastic materials. It also can represent irregular meshes with plane stress, plane strain, or axisymmetric models with large deflections [20].
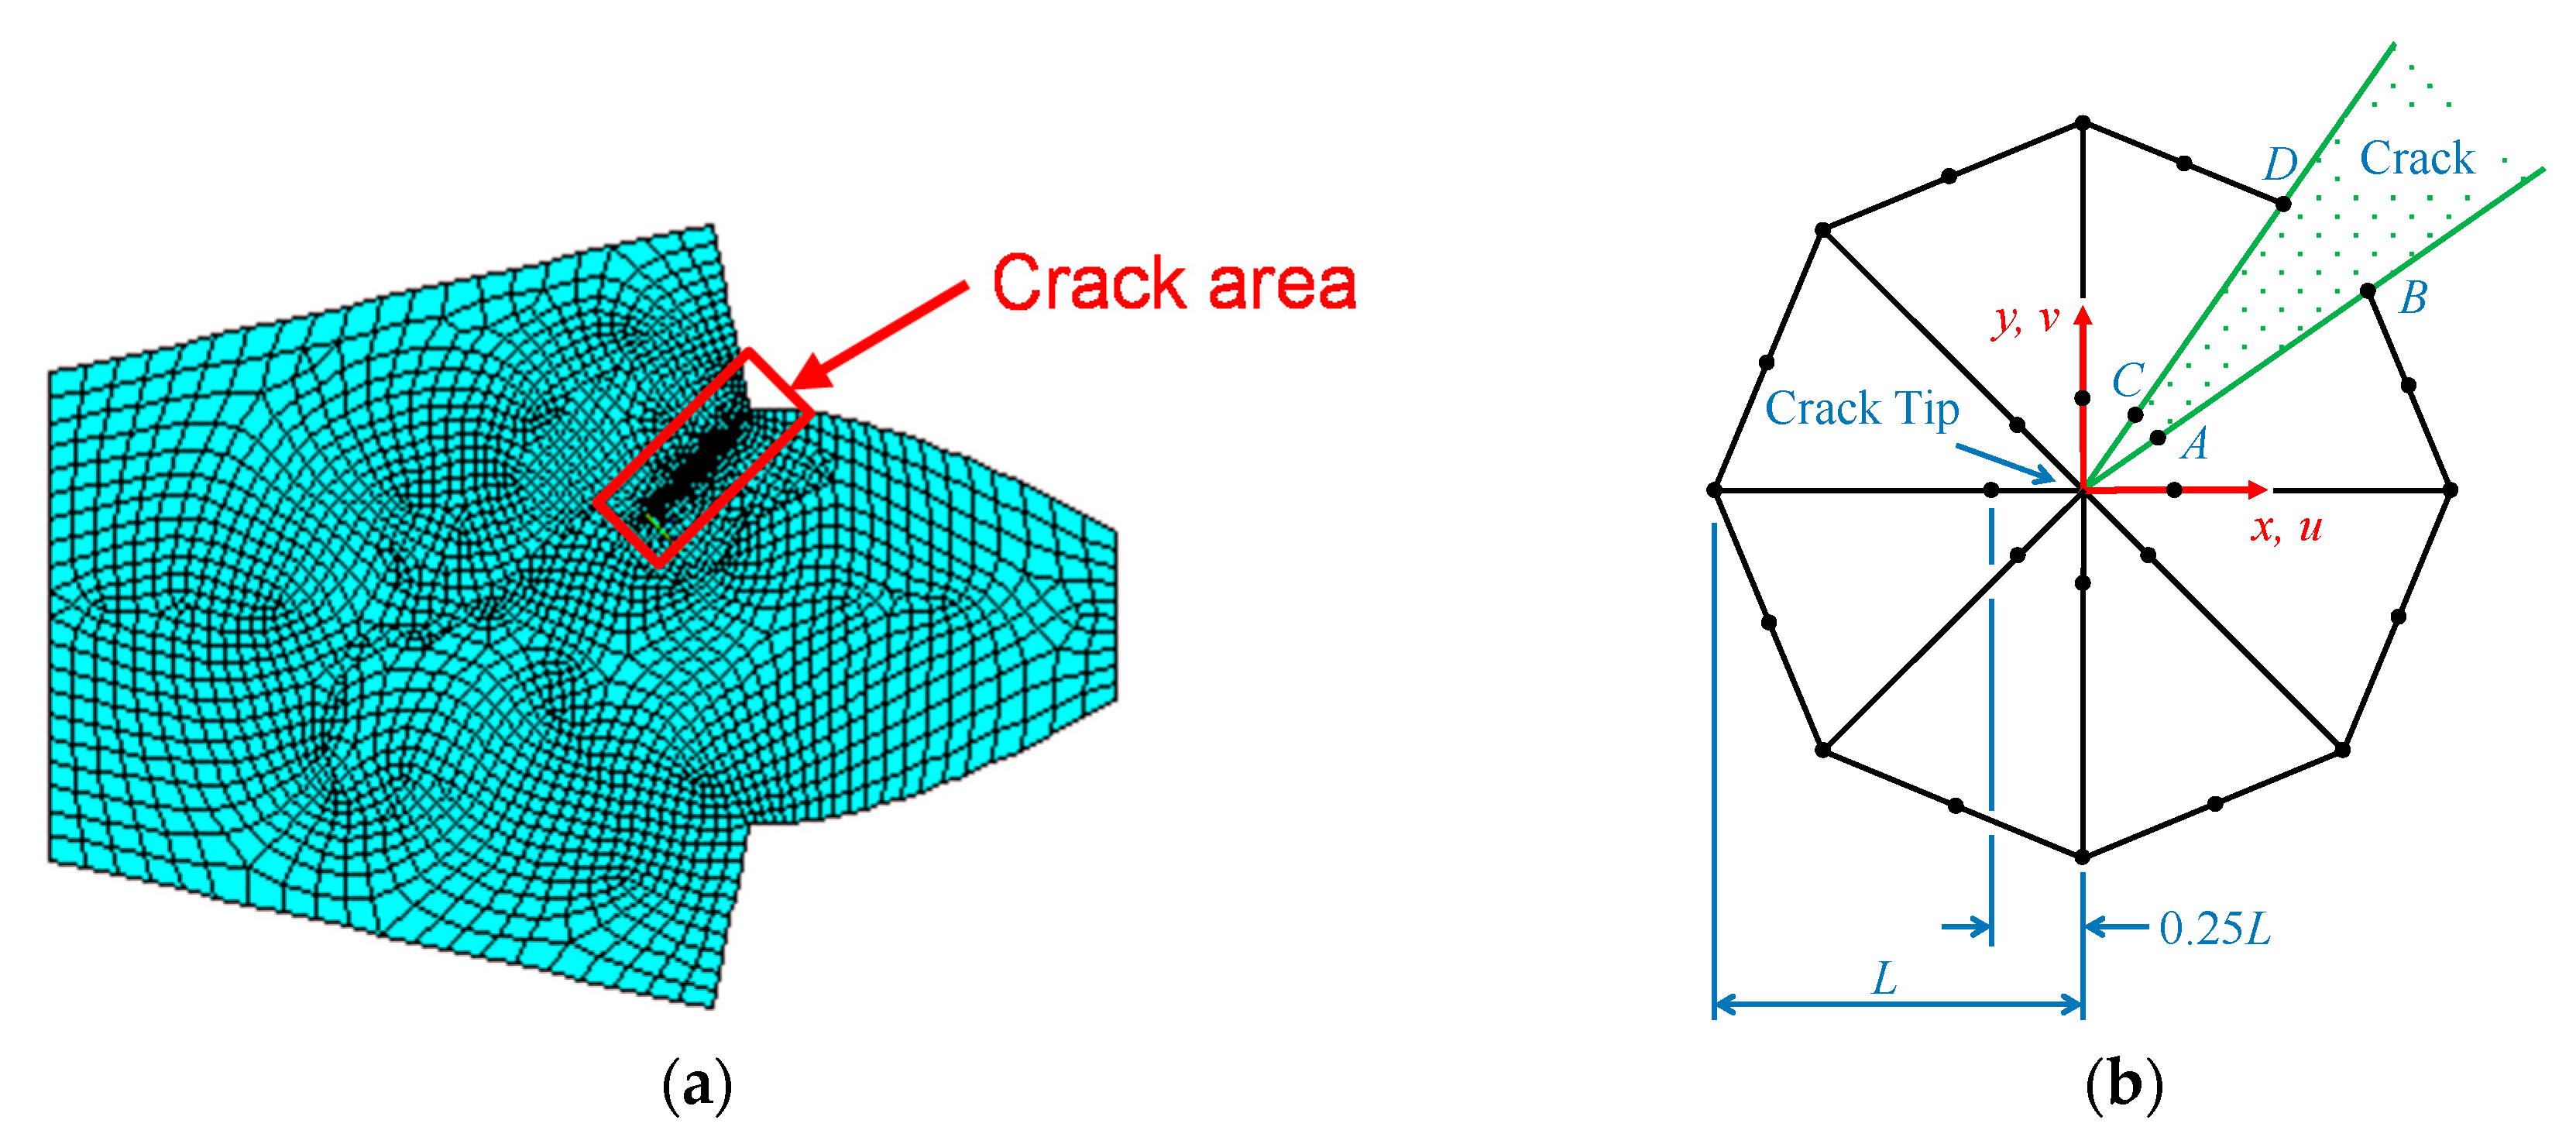
Initially, a default free mesh was used over the entire model. The mesh near the crack edges was then further refined to account for the high stress concentrations, which will occur around the crack tip. The stress and strain singularity at the crack tip is represented by singular elements surrounding the crack tip. The singular elements are quarter-point isoparametric elements, with their mid-side nodes moved a quarter unit closer to the tip of the element [21] (Figure 1b). This improves the accuracy of results near the crack tip. Since the focus of this paper is to estimate crack propagation, more emphasis was given to meshing around the crack tip to obtain accurate nodal displacements near the crack tip. It was assumed that the non-homogeneous mesh does not reduce the accuracy of the nodal displacements around the crack tip.
The calculation of SIF was performed using the displacement correlation method. Once nodal displacements of the singular elements were obtained from ANSYS, displacement correlation method was implemented to obtain the SIF. The ANSYS FE model of the cracked gear tooth is shown in Figure 1. Nodal displacements of nodes A, B, C, and D shown in Figure 1b are used to calculate mode-I SIF, KI, using displacement correlation formula which is given by [16]:
where since a plane strain condition was considered in this analysis.
2.3. Loading Uncertainty Quantification
The torque time history signal applied in the gear pair studied in this research was scaled from a rotor torque of AWT-27 (275 kW rated power, 27.4 m rotor diameter, and 42 m hub height) wind turbine. A full field wind model for a 42 m hub height, simulated by NREL’s TurbSim [22], was used as an input to NREL’s FAST [23] software to generate stochastic low speed (rotor) and high-speed shaft torque of the AWT-27 wind turbine. The stochastic torque time history data is scaled down to the level of the nominal loading of the gear pair model used by Zhao et al. [16] and stochastic loading was obtained by generating samples from generalized extreme value (GEV) probability density function (PDF) using MATLAB [6]. In addition, the parameters of the PDF of the scaled 40-s time history data were used to sample a fluctuating loading condition. The loading and Paris’ material parameter uncertainties were quantified as GEV and normal PDF, respectively (see Table 1).
2.4. Probabilistic Prediction of the Gear Crack Size
A discretized Paris’ law was used to estimate the rate of crack propagation. Due to the inherent uncertainty of material constants in Paris’ equation, randomness was incorporated to the parameters m and C in Paris’ equation,
where are the estimated and prior crack lengths, respectively, ΔN is the added number of cycles to the component, is the (k − 1)th SIF range for mode-I crack propagation, and with C and m being empirical material constants. The uncertainty in the random variables C and m will also be propagated to the state variable a. Hence, a also becomes a random variable. The randomness due to the input torque was accounted for by considering random input torque time history data which was generated from the input PDF. Figure 2 shows the characteristics of fatigue loading in the case of random loading. Note that rainflow counting (RFC) helps to categorize loading conditions with their respective cycles. Results of the RFC method should then be post-processed to obtain force applied to the gear tooth. Note that the force applied to the gear tooth ranges from zero to a maximum force value. This force is calculated using maximum torque resulting from the RFC analysis. This study involves RFC, dynamic analysis, FE analysis, and damage modeling to estimate the fatigue crack propagation.
Figure 3 shows the framework for the estimation of the gear fatigue crack propagation. The inputs for the framework are the distributions of the initial crack length and the applied fluctuating torque, T(t). The fluctuating torque was obtained by generating samples from GEV PDF, as explained in Section 2.3. The RFC was employed on the fluctuating torque to perform proper cycle counting. The output of the RFC is a torque matrix consisting of the midrange, amplitude, and the corresponding cycles, ΔN, of the torques. Using the midrange and the amplitude components, the maximum torque values were then calculated and presented as a plot relating maximum torque, T, with the cycles, ΔN. This plot was used in the subsequent analyses: the torque was used as an input to the dynamic analysis, whereas the cycles were used in the Paris’ crack growth model. Simulation of crack growth follows a series of recursive analyses, namely gearbox dynamic analysis, updating ANSYS Parametric Design Language (APDL) code, re-meshing and analyzing the FE model, and estimating crack growth. With each recursion, k − 1, the framework randomly picks a torque sample, Tk−1, from the torque plot. The torque sample was then used in the one-stage gearbox dynamic model to find the contact force between the meshed gear teeth, resulting in a force time-series, Fk−1(t). The maximum force at timestep k − 1 (i.e., Fmax,k−1) was then selected from Fk−1(t). The APDL code was used to re-mesh and simulate FE analysis of the gearbox. Hence, it contains variables such as the crack length, ak−1, which was updated with every crack growth estimation, and the force, Fmax,k−1, which is passed from the dynamic analysis. For the FE analysis, only the mean of the (k − 1)th crack length PDF (i.e., mean(ak−1)) was used to update the geometry of the model. This was done to avoid the significant computational cost due to Monte Carlo sampling of the dynamic simulation and the FE analysis.
Results of the FE analysis are nodal displacements which were used to compute ΔKI,k+1 using the displacement correlation method described in Section 2.2. Paris’s equation, Equation (10), was employed to determine the crack growth (i.e., ak). Here, Fmax,k−1, ΔKI,k+1, ΔNk−1 (the load cycles at the (k − 1)th timestep), ak−1 (crack length distribution at (k − 1)th timestep), and the material parameter distributions C and m were used. Note that Fmax,k−1, ΔKI,k+1, and ΔNk−1 are deterministic parameters, whereas ak−1, C, and m are random variables. Hence, the resulting ak is also a random variable. At the end of every recursion, the maximum value of ak will be compared with the critical crack length; failure criterion is given by max(ak) > ac. The above recursive analysis continues until the failure criterion is true, providing PDFs of the crack length at every recursion.
3. Results and Discussion
3.1. Rainflow Counting
Results of the RFC, dynamic analysis, calculation of SIF, and calculation of fatigue crack propagation are presented. The results of each section were verified first individually and then as a group. Results of the RFC were verified using the RFC Algorithm described in [24]. Mesh stiffness and dynamic force results were compared with Tian et al. [15] and were found to be in good agreement. On the other hand, results of the SIF and the fatigue crack propagation were in good agreement with those presented in Zhao et al. [16]. Once the results were verified using the aforementioned literature, the new input torque data were used to simulate load variability.
A MATLAB code for RFC was developed based on the ASTM standard for cycle counting in fatigue analysis [25]. RFC was employed to determine the characteristics of the input torque condition and the associated loading cycles. Results of the RFC analysis include torque time history signal of the input shaft and eventually torque transmitted to the gear tooth. The input torque time history data were randomly sampled from a GEV. The first 20 s of the data are shown in Figure 4.
Figure 5a,b shows the results of RFC analysis for the mid-range and for the amplitude of the input shaft torque, respectively. The midrange bar chart was obtained by using 34 bins between 800 Nm and 1800 Nm. It can be observed that the mid-range values of the torque have the highest number of cycles at approximately 1200 Nm. On the other hand, the torque amplitude was plotted using 40 bins which are between 10 Nm and 1200 Nm. Figure 5b shows that the maximum number of amplitudes were observed at small amplitudes. These torque bar graphs are used to determine the torque bar graph on the gear tooth under consideration.
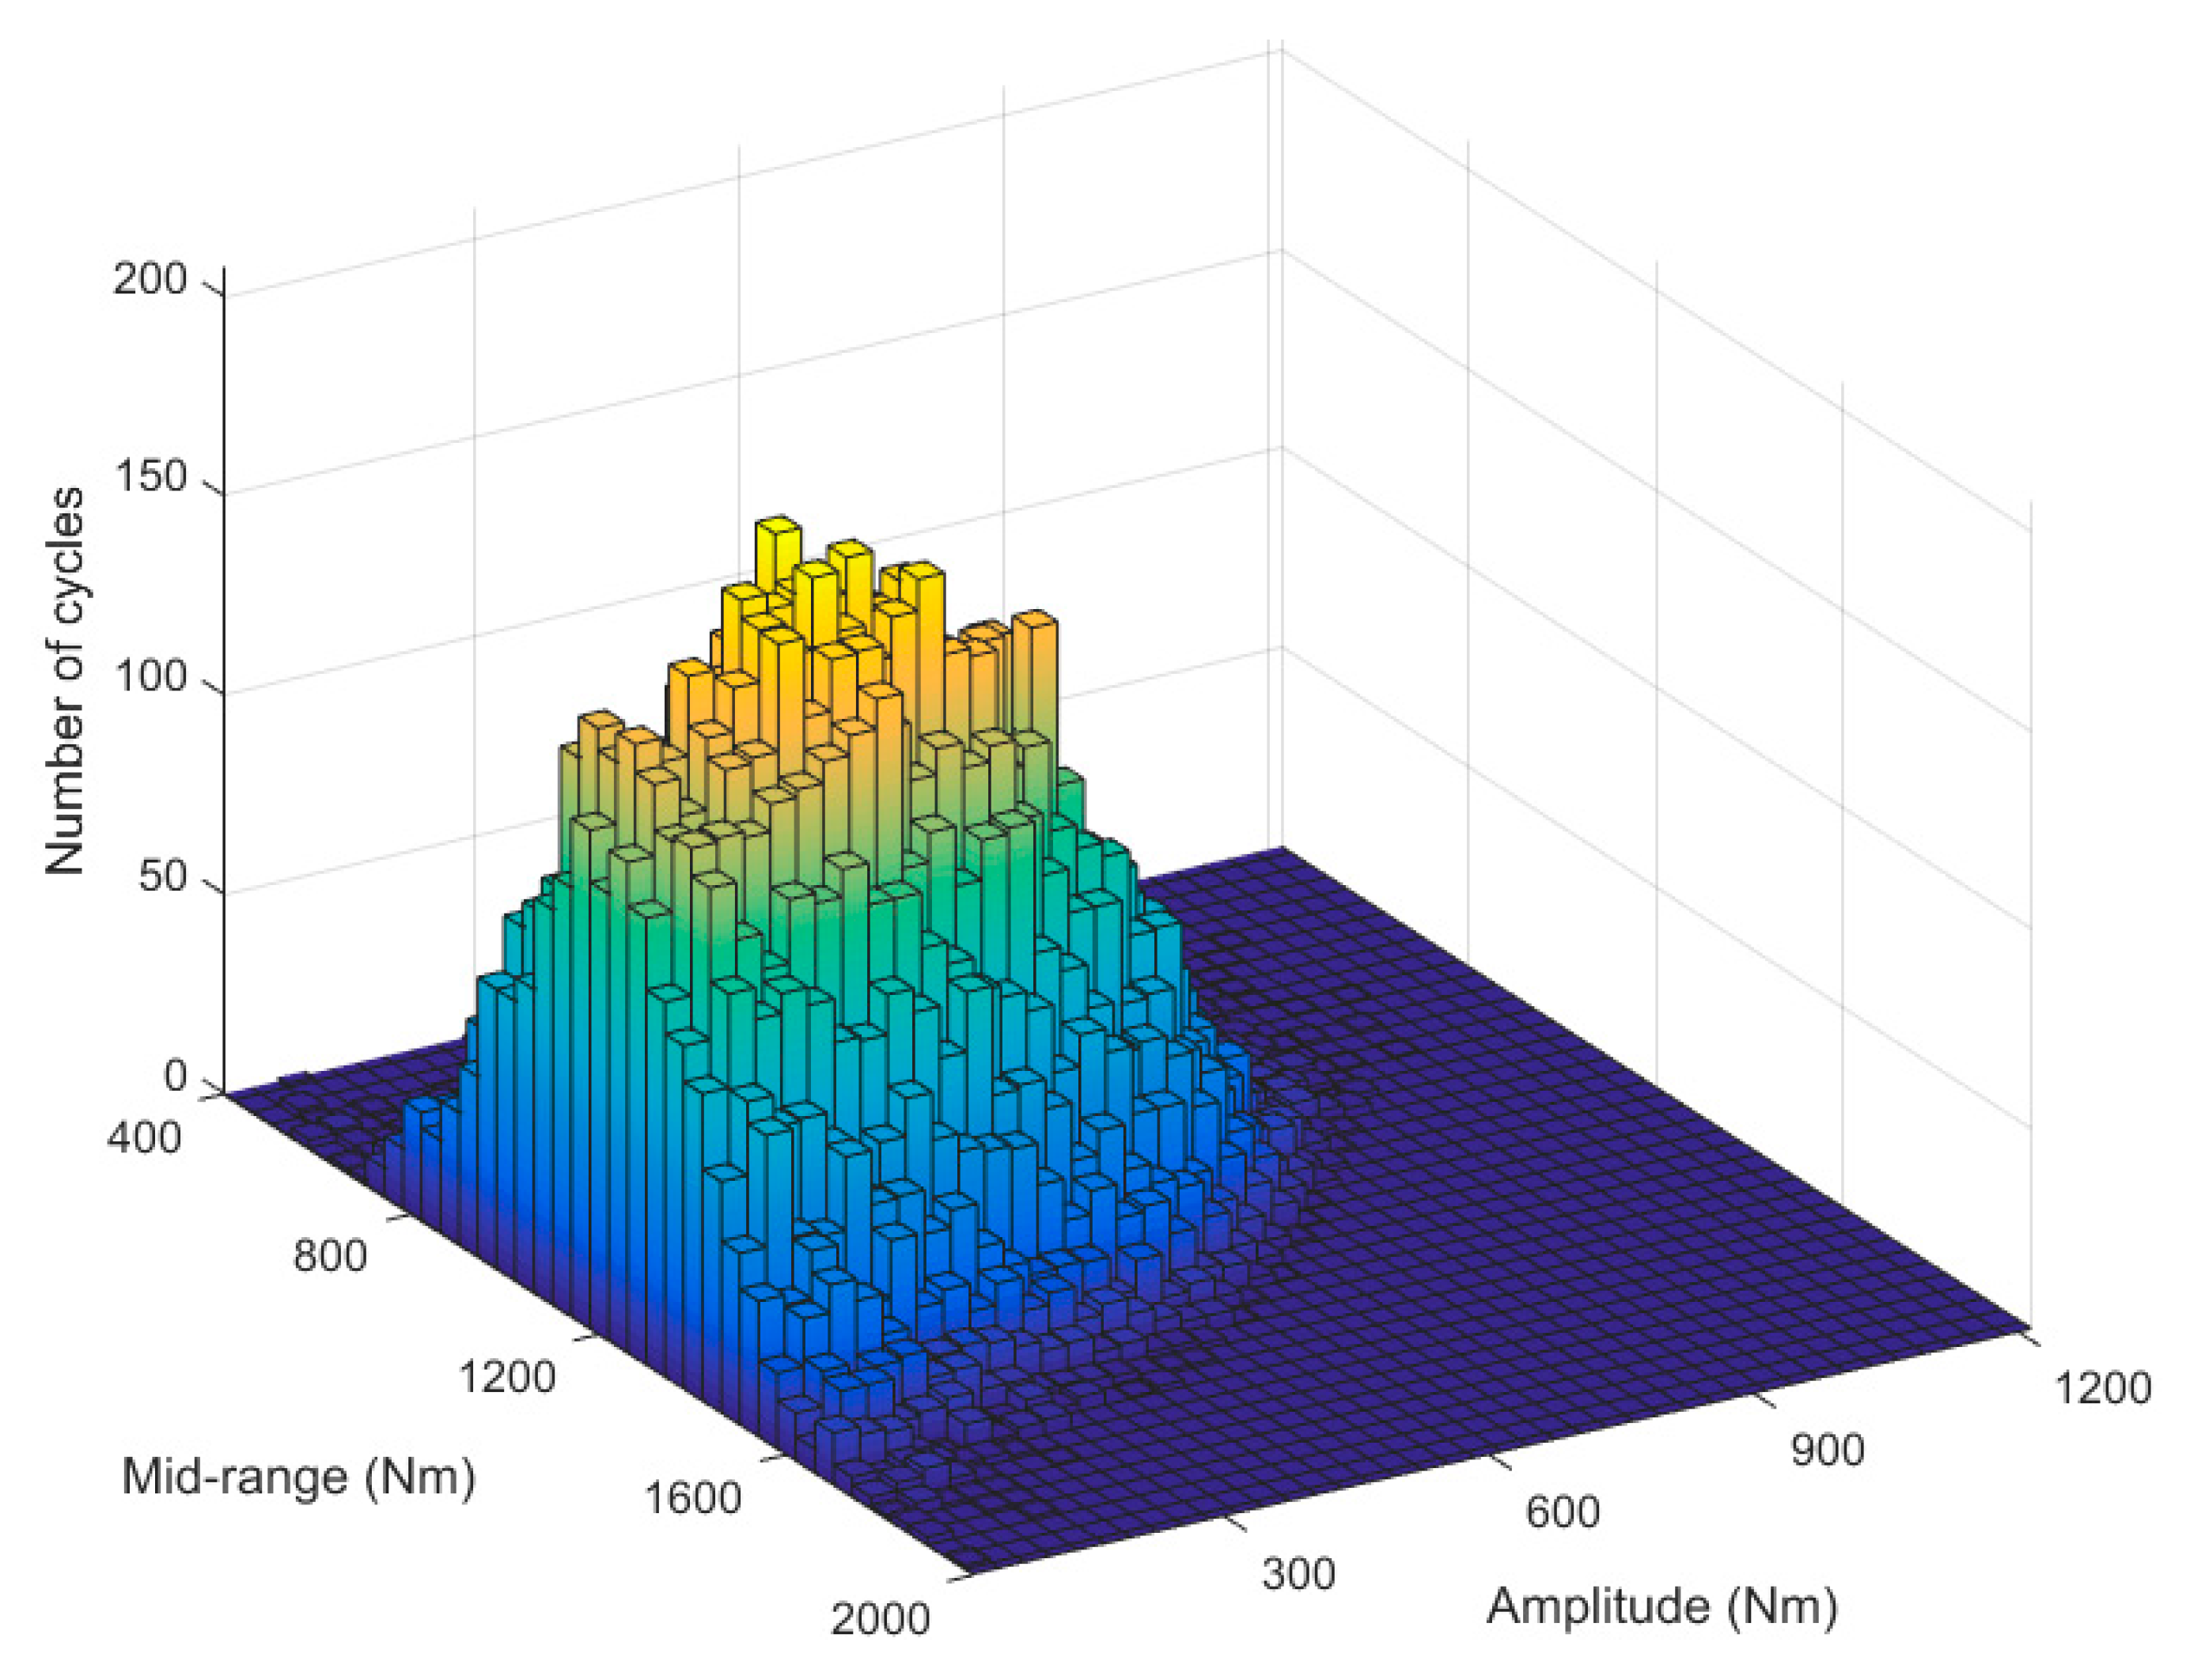
Figure 6, which is a direct output of the RFC analysis, shows a 3D representation of mid-range, amplitude, and number of cycles. The 3D plot depicts the relationship between mid-range and amplitudes. Corresponding midrange and amplitude torques, shown in Figure 6, were used to obtain the maximum torque values used in the dynamic analysis.
Note that the torque bar graphs shown in Figure 5 and Figure 6 are those of the input shaft. Since the approach in this paper is focused on the loading over the cracked pinion tooth, the torque acting on the pinion tooth needs to be obtained. Unlike the loading on the input shaft, as shown in Figure 4, the fatigue loading of the gear tooth will be a loading and unloading scenario that varies between zero and the maximum torque.
In order to perform dynamic analysis of the gearbox, the maximum input torque values were determined by adding the mid-range values and their corresponding amplitudes (see Figure 6). The resulting maximum torque was plotted against the number of cycles, as shown in Figure 7. It can be seen that the mean value of the maximum torque lies at approximately 1500 Nm, which is greater than the mean of the mid-range torque bar graphs shown in Figure 5a. The data was then fitted with a cubic spline, which was used to sample maximum torque data that are used in the one-stage gearbox dynamic model.
The maximum torque values used in the dynamic modeling were obtained by randomly generating samples of torque using a MATLAB random generator. The corresponding number of cycles were then obtained from a cubic curve fitted to the plot presented in Figure 7. The frequency of torque loading was obtained by taking the ratio of the number of cycles and the total time span of 10,000 s (≈2.8 h). The total number of cycles taken for RFC analysis was 33,312, with a frequency fT ≈ 3.33 Hz. On the other hand, the rotational frequency of the shaft (and consequently the pinion) is fp = 30 Hz. Therefore, for each cycles of input torque, each pinion tooth will experience an alternating loading ranging from 0 to Fmax, which is (see Figure 2). Input torque values were randomly selected from the fitted curve in Figure 7. Note that all loading cycles were not applied since the crack length in the gear tooth reached its critical length before all loading cycles could be applied. RFC plays a key role in fatigue loading of a gearbox since it helps to estimate the number of loading cycles accurately by considering some cycles that might otherwise have to be hidden.
3.2. Dynamic Analysis
The dynamic modeling of a six-DOF one-stage gearbox system was modeled in MATLAB. The torque values on the gear tooth obtained from the RFC analysis (see Table 1) were used as input parameters of the dynamic model, whereas the output torque values were taken as twice as that of the input torques. The remaining parameters for the dynamic model were obtained from [15,16]. The dynamic response of the undamaged gear was compared with the gear with a cracked tooth and the results are presented in Figure 8 and Figure 9.
Figure 8 shows the mesh stiffness obtained for one full revolution for the undamaged pinion and for a damaged pinion. A 2.5 mm crack was placed on the 10th tooth of the pinion with N = 19 teeth. It can be observed that there is a local reduction of the mesh stiffness for the cracked gear (Figure 8b). Consequently, this leads to an increase of the dynamic loading on the gear tooth, as shown in Figure 9b. Therefore, it is essential to compute the dynamic force after each crack increment in the prediction of the fatigue life of dynamic systems.
3.3. Calculation of the Stress Intensity Factor
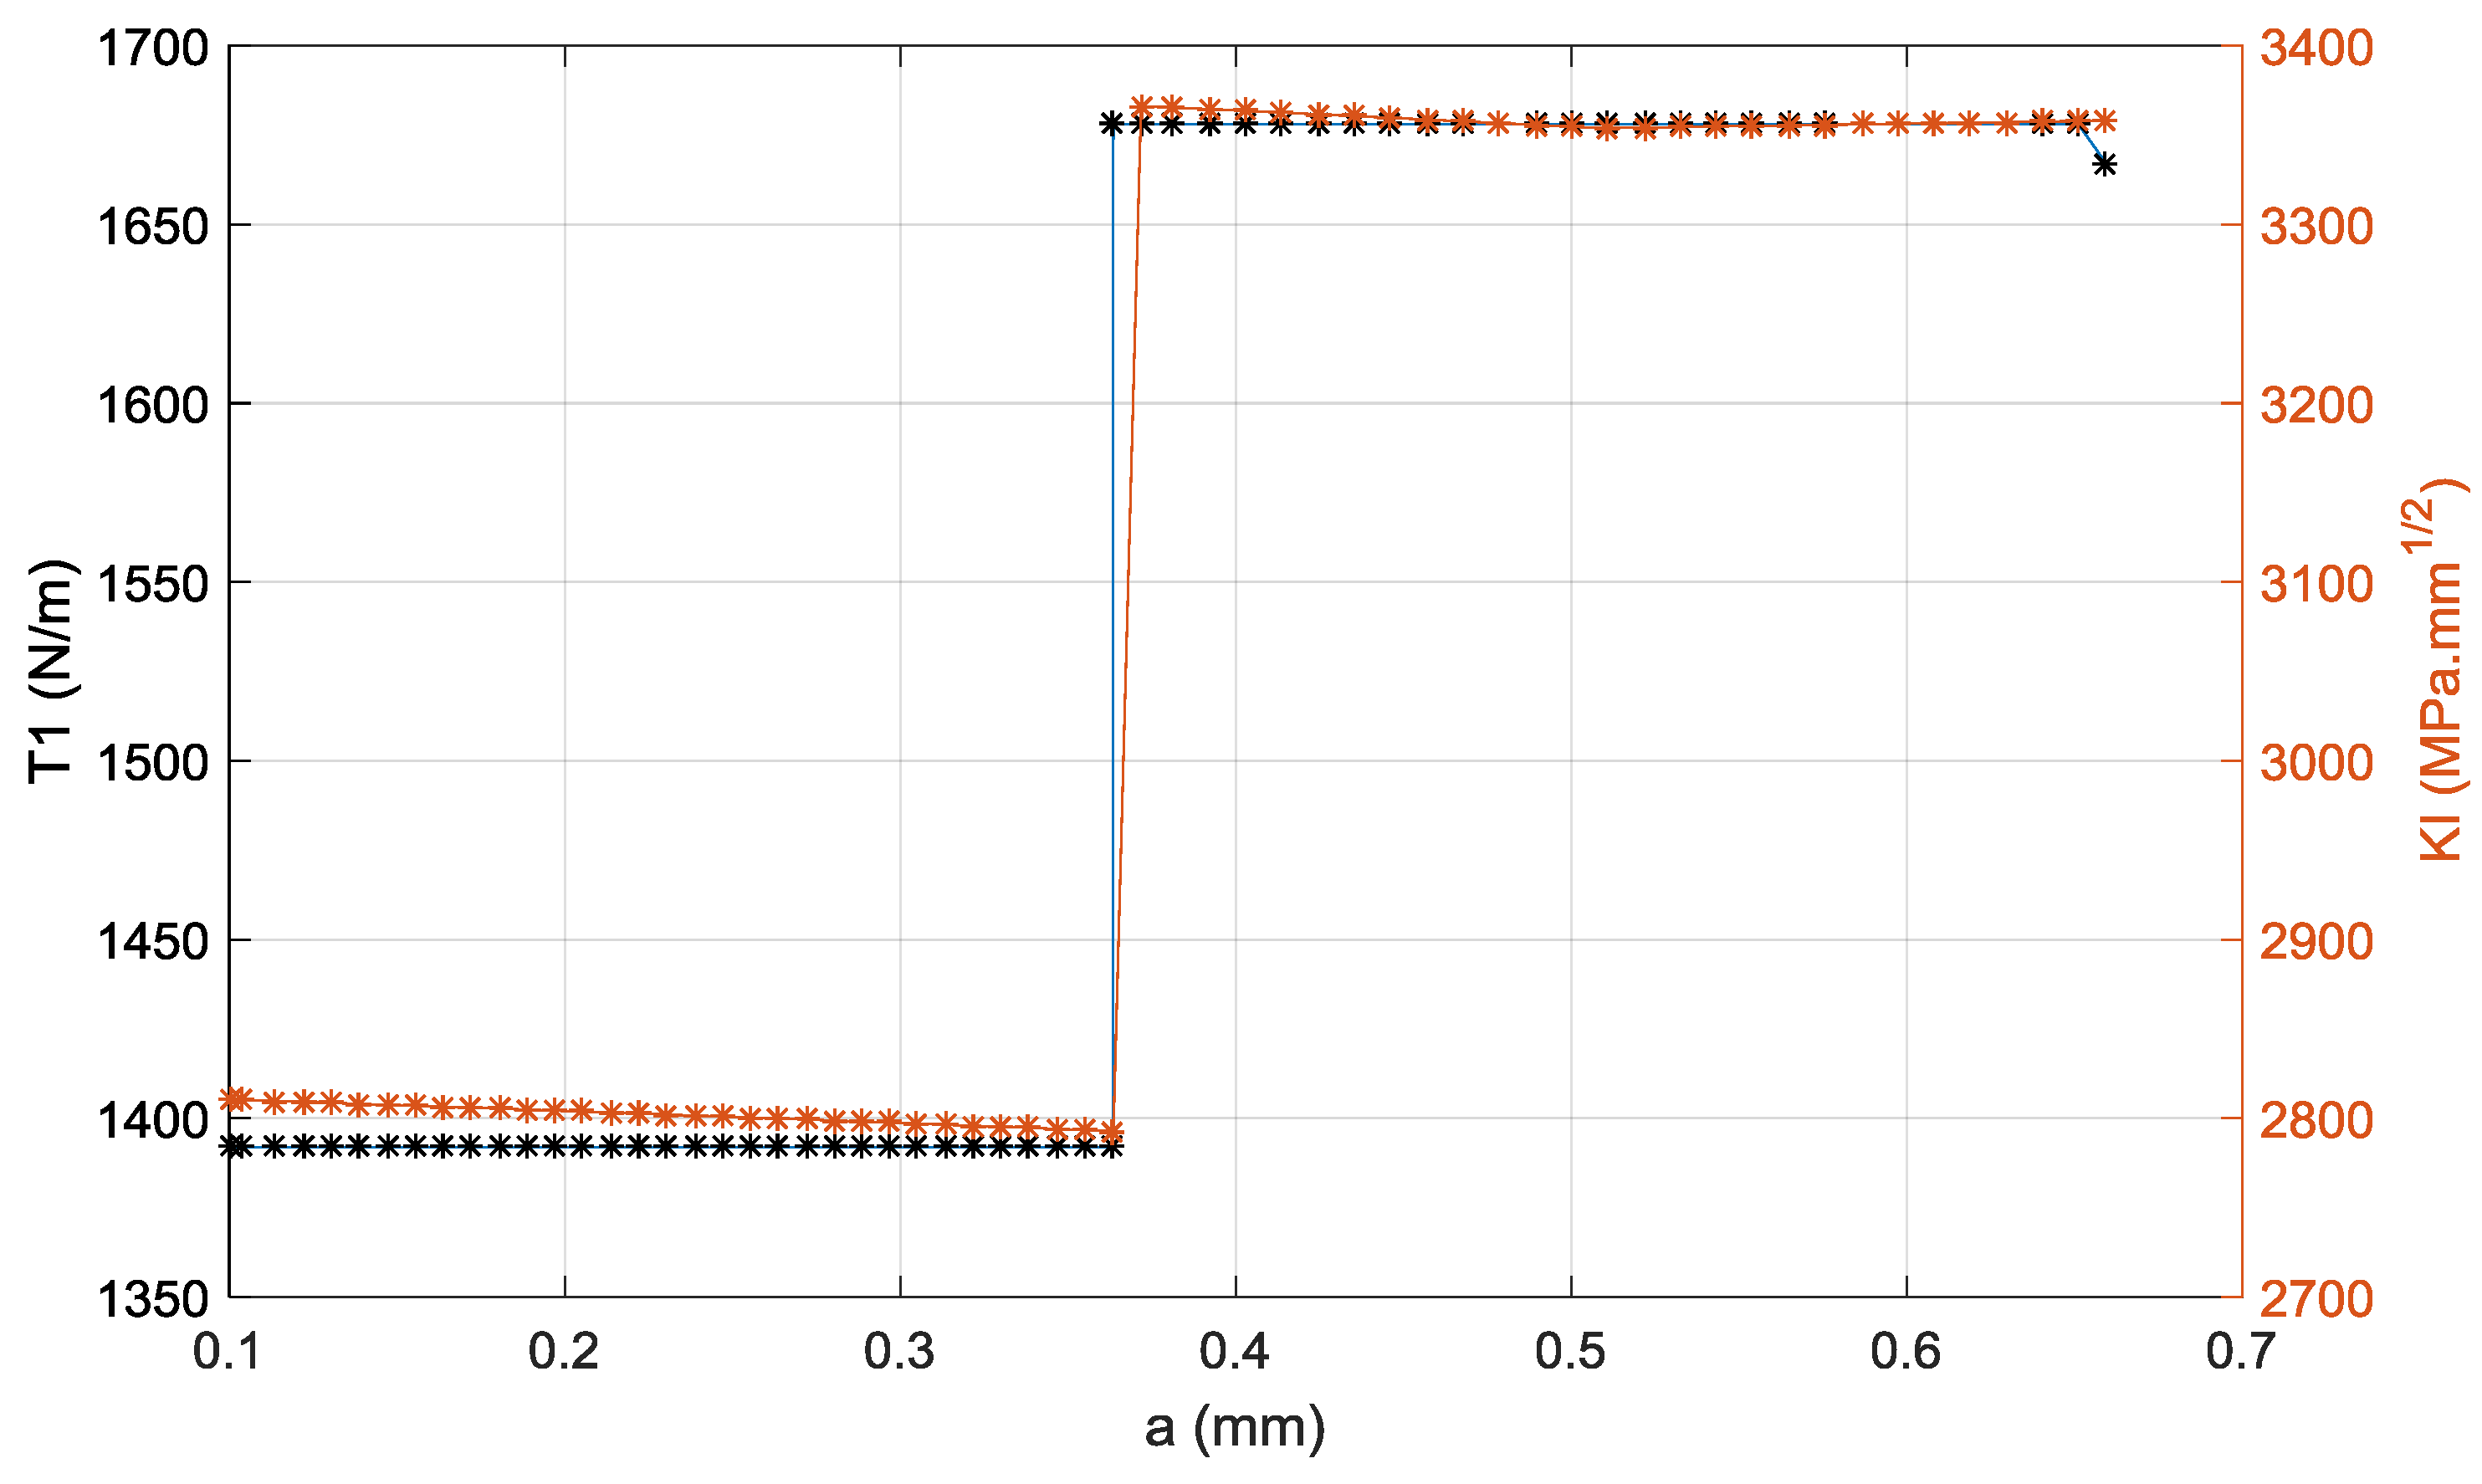
The dynamic forces obtained from the dynamic analysis were used in the FE model of the gear tooth to calculate mode-I SIF, KI. Only KI was considered since it was dominant over mode-II. The SIF is affected by crack growth as well as the magnitude of the maximum torque. Although the crack increases steadily, a sudden change in the torque may increase or decrease the SIF. Figure 10 shows the relationship between crack length and torque as well as the crack length and SIF. First, a torque of 1392 Nm was applied for about 3 × 10⁴ cycles; then the torque was increased to 1678 Nm. It can be seen that an increase in torque results in a sudden increase in the KI.
Finally, the randomly selected maximum torque and cycles data obtained from the maximum torque fit shown in Figure 7 were employed to simulate the practical scenarios. Results of this analysis are presented in Section 3.4.
3.4. Probabilistic Estimation of the Gear Fatigue Crack Propagation
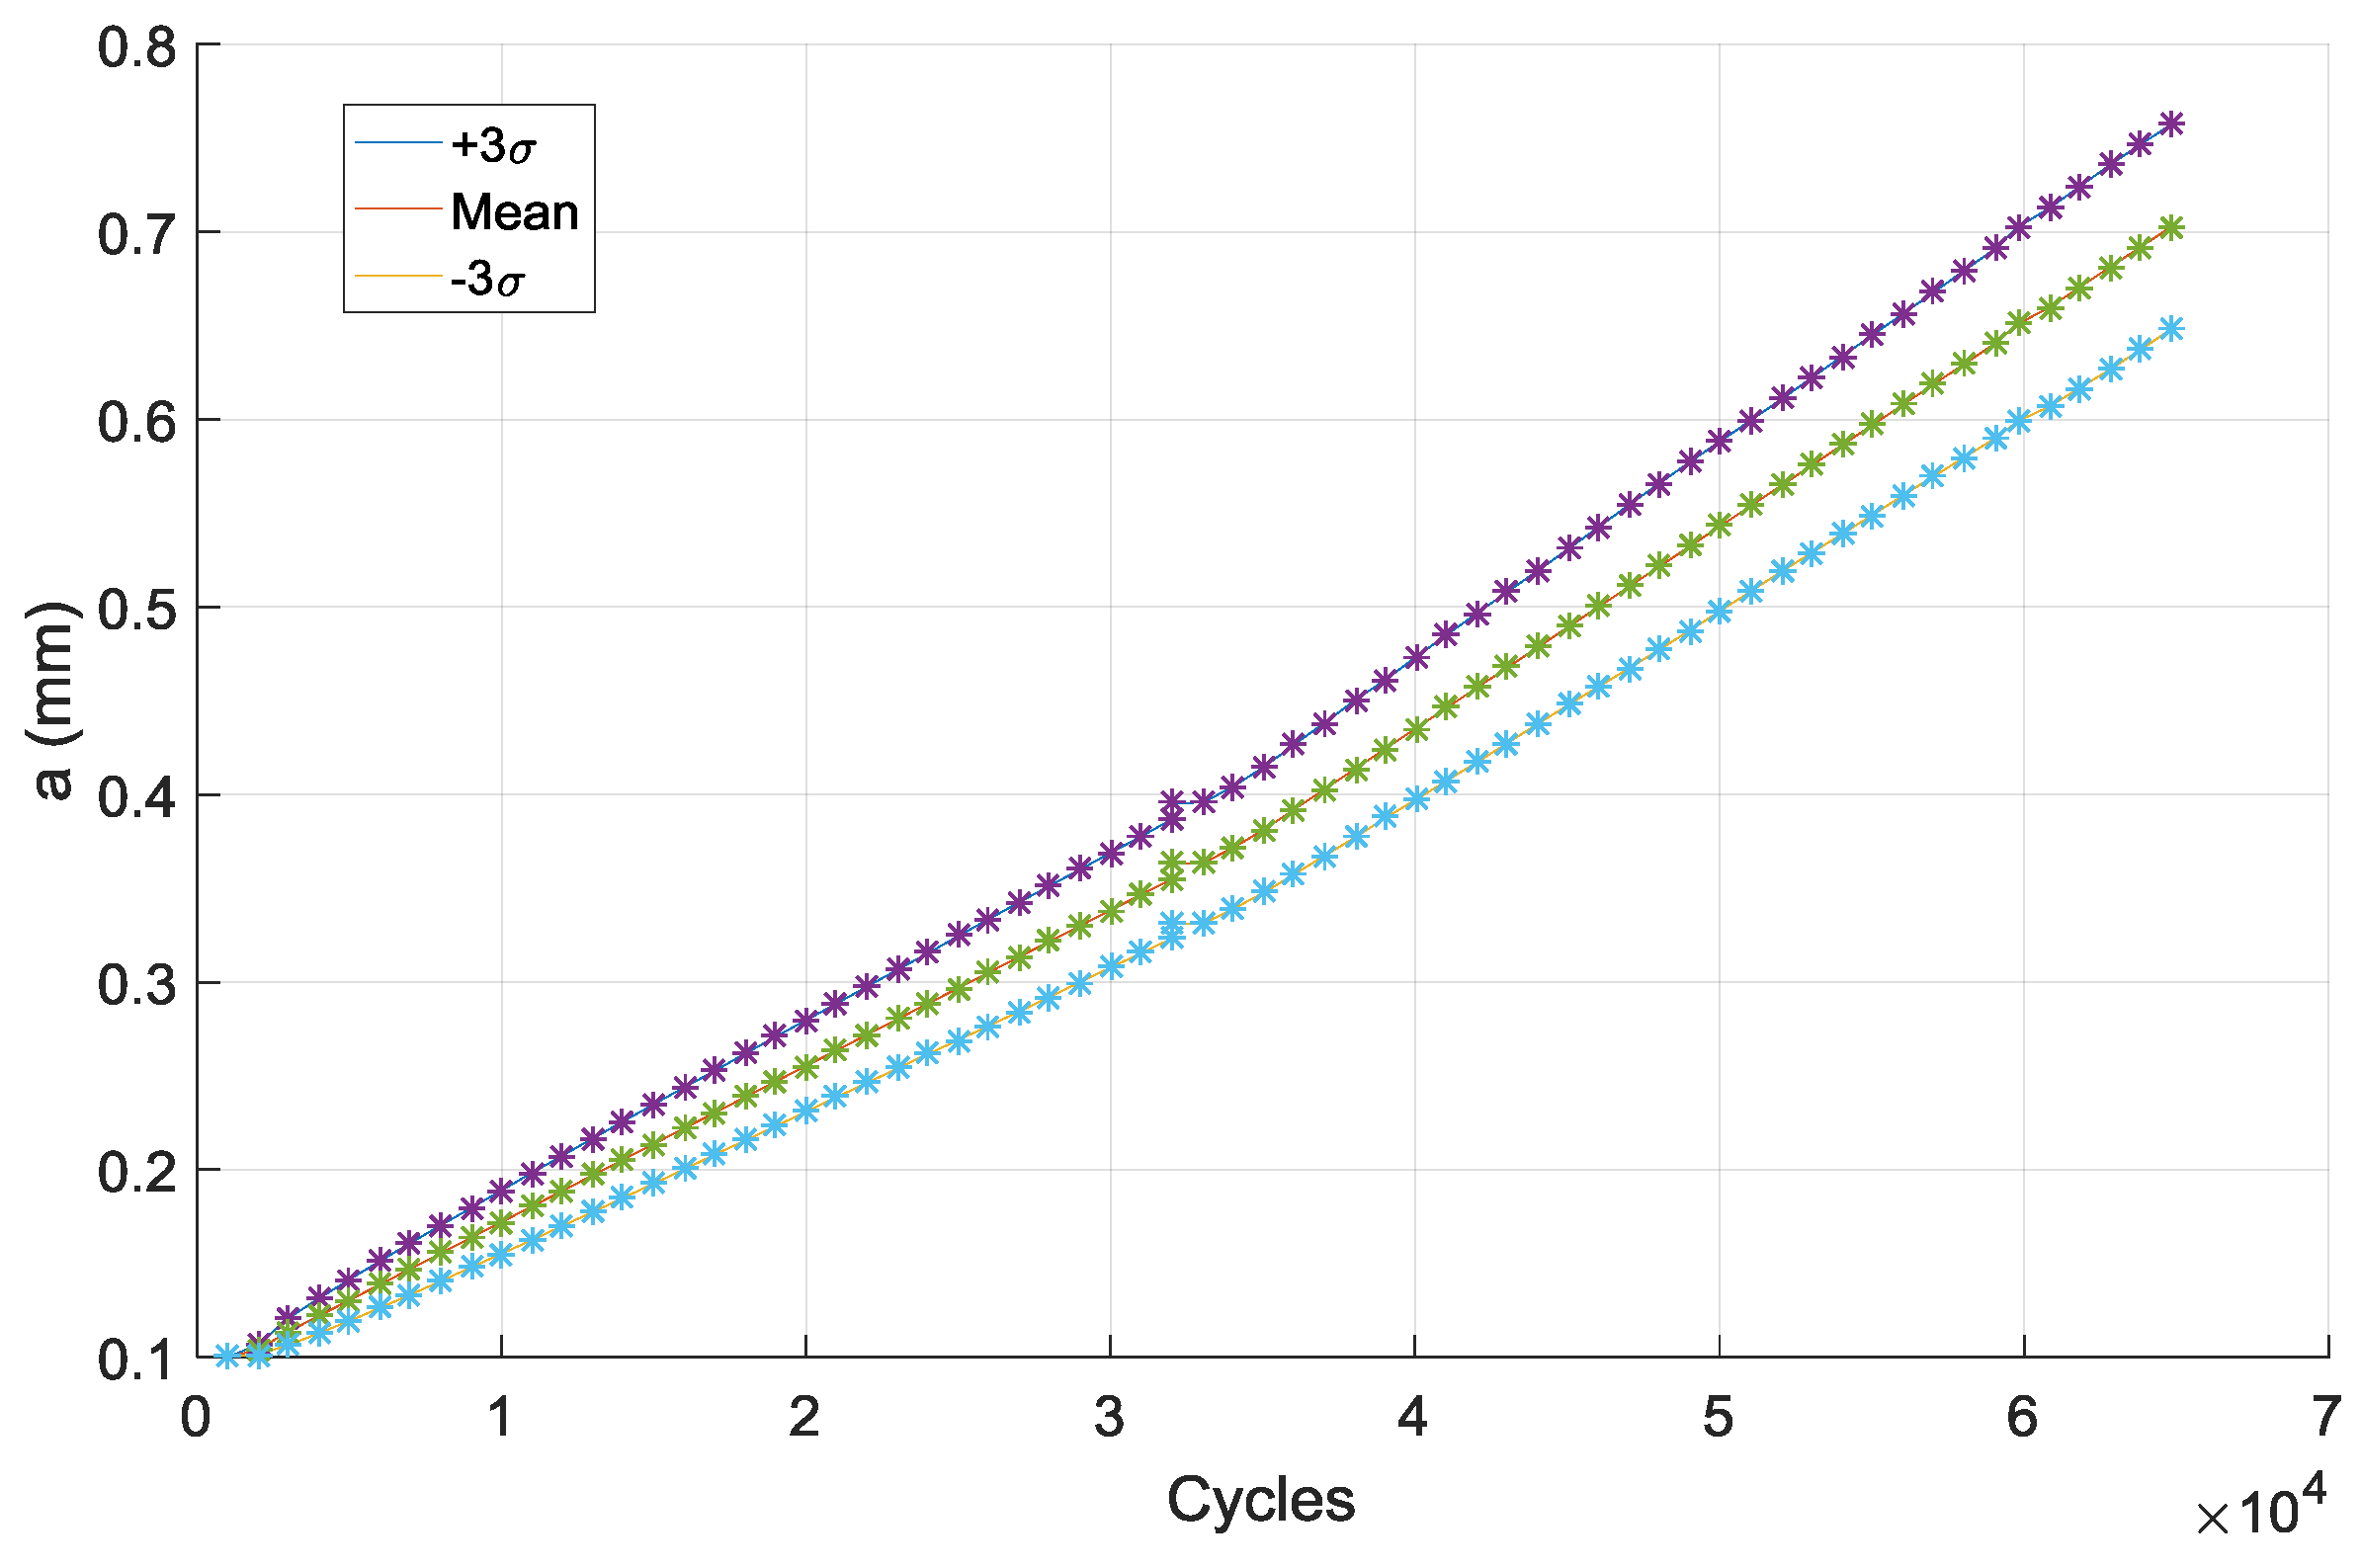
The computational framework developed for the analysis was used to calculate the crack growth autonomously for 65 iterations using the torque samples. Note that the crack length, a, becomes a random variable with its own PDF because the uncertainties in Paris’ material constants will be propagated. The randomly generated maximum torque values and their corresponding cycles were applied until failure. The total number of cycles was then obtained by taking the sum of the loading cycles ΔNk. The number of cycles of the gear as a function of the crack length is plotted in Figure 11 with 98% confidence interval. As the crack grows, the variability also increases due to uncertainty propagation.
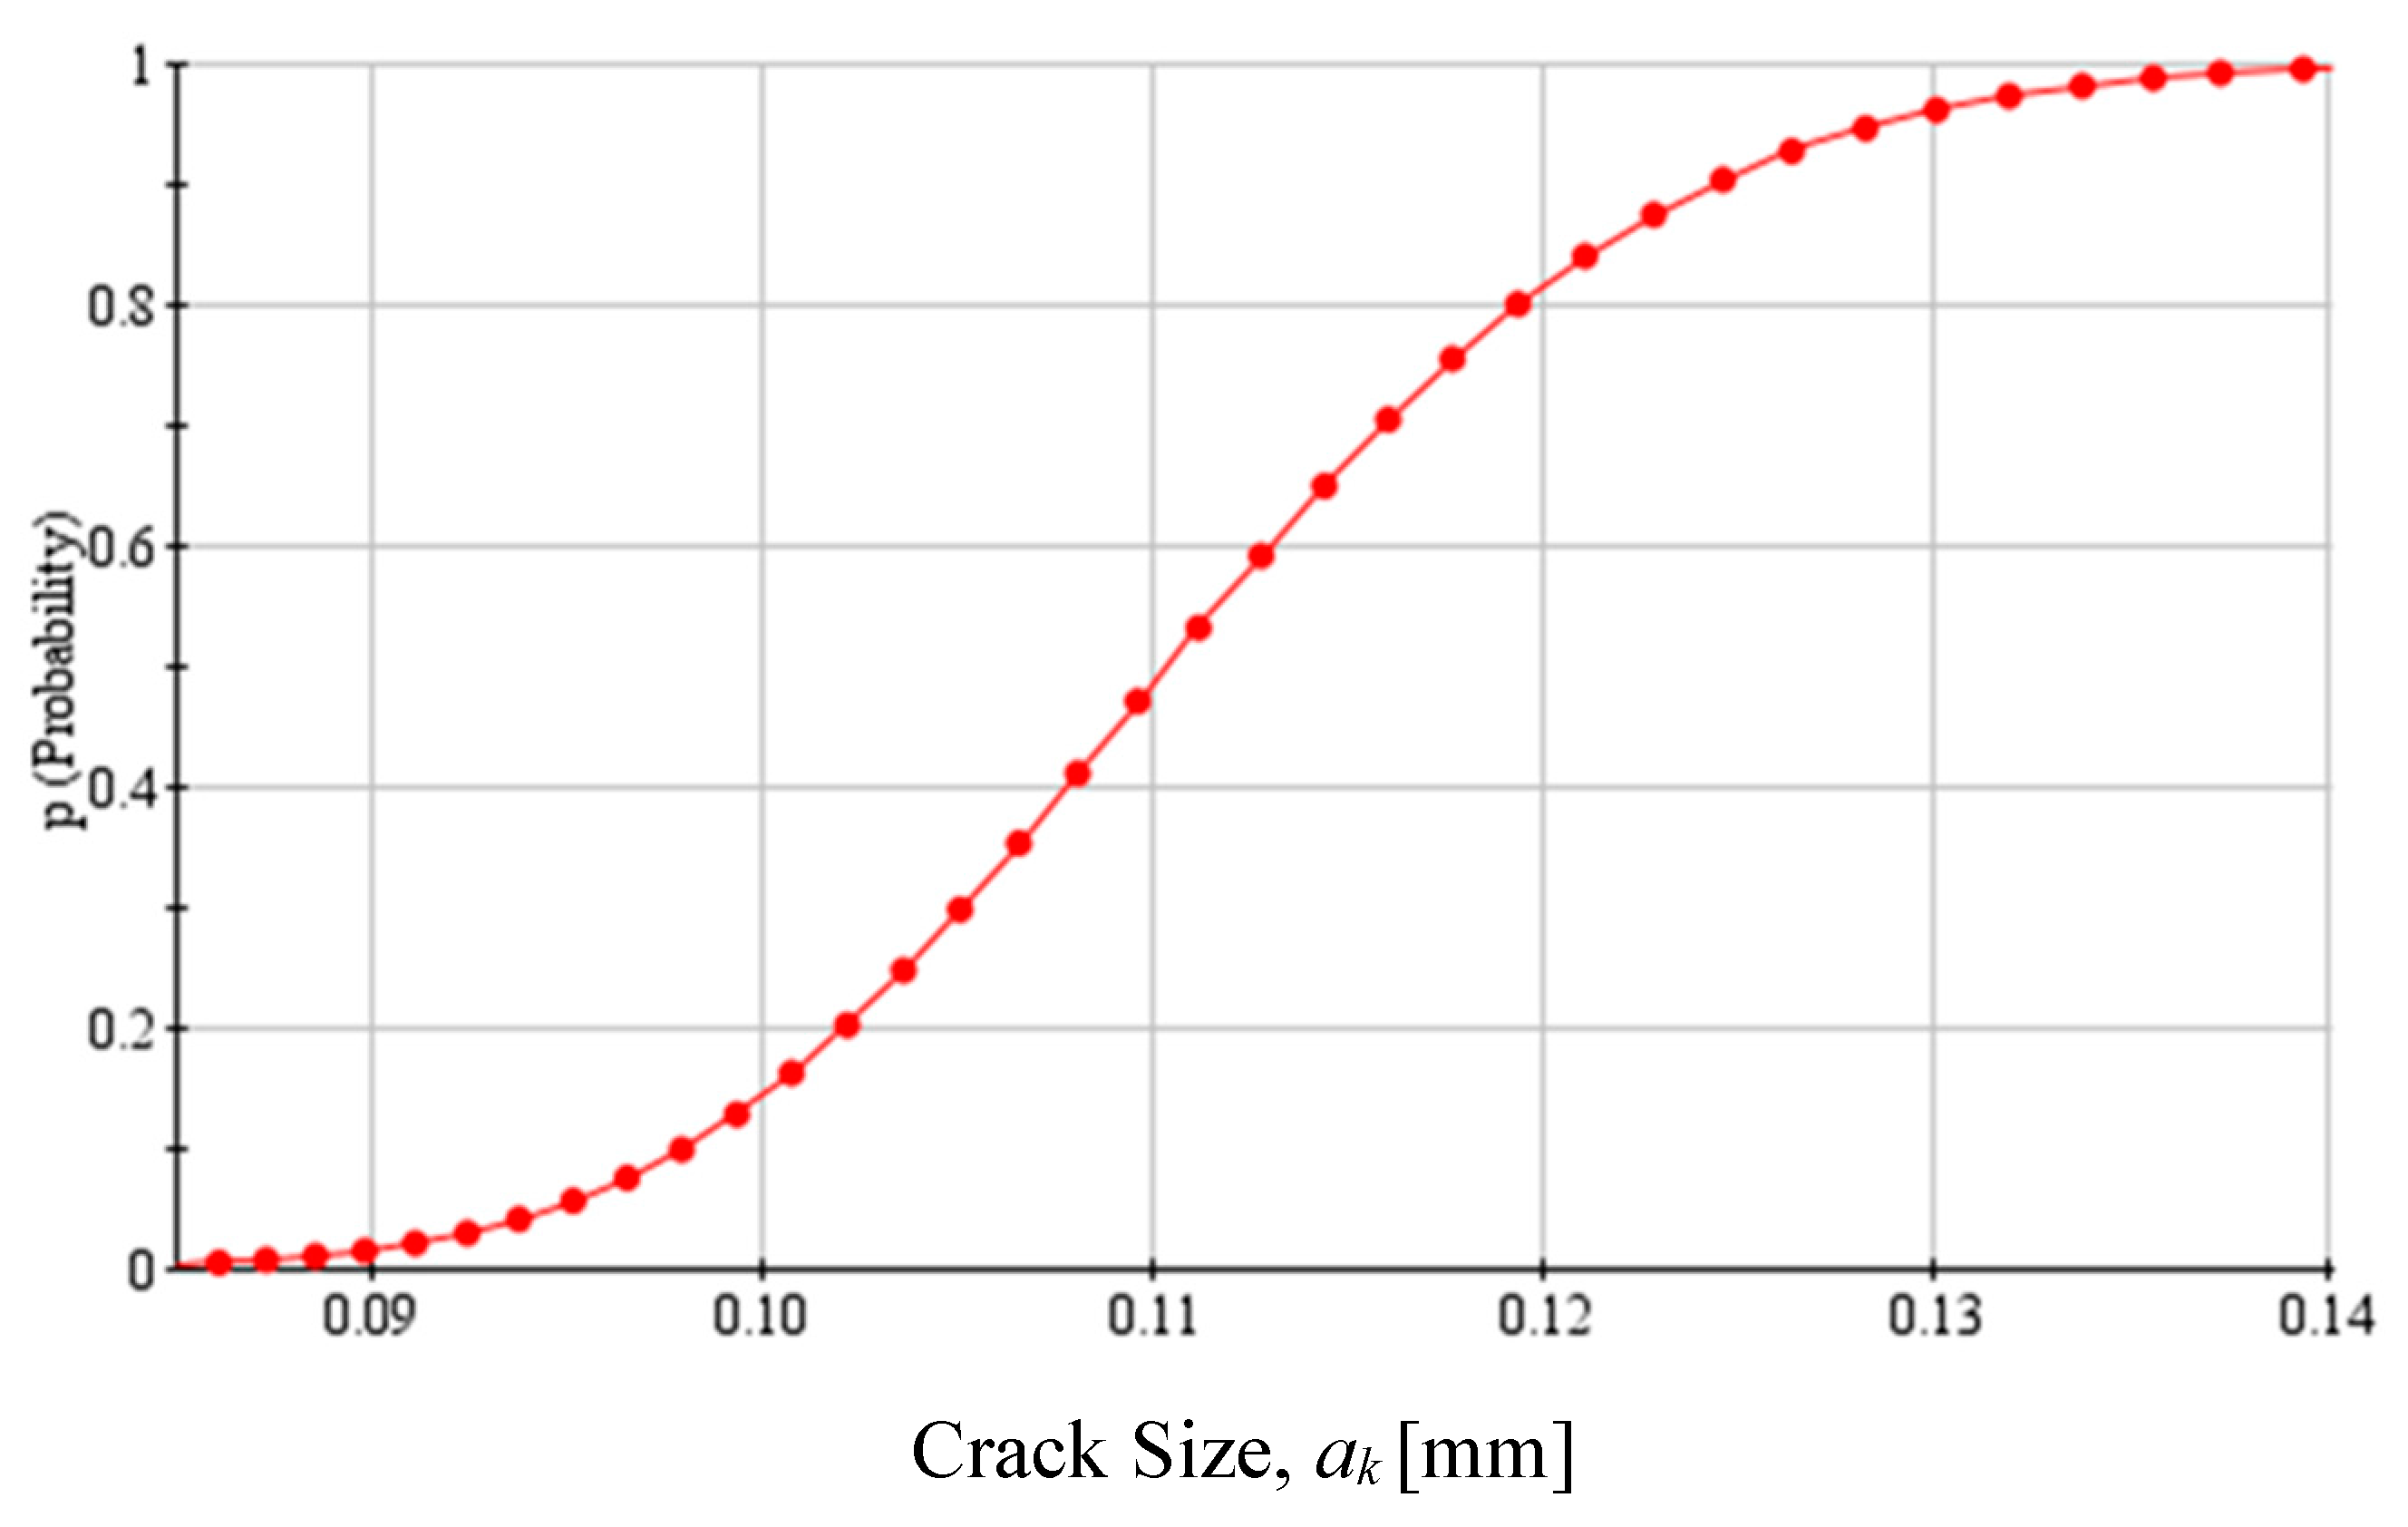
The 98% confidence interval uncertainty presented in Figure 11, at the end of N fatigue cycles, could be explained using a cumulative distribution function (CDF), as presented in Figure 12 below.
The figure depicts the probability of occurrence of a crack size, ak, after N = 1000 cycles. For example, the probability of the resulting crack length ak being 0.12 mm or less after N = 1000 cycles is about 80%. The reader should also note that the CDF plot could shift to the right or left depending on the mean values of the input random variables listed in Table 1. For example, if the mean value of the torque load, T increases, the CDF will shift to the right. This means that the probability of getting a crack size of 0.12 mm or less will reduce or the chance of getting a crack size greater than 0.12 mm will increase.
4. Conclusions
This paper presented a method to estimate the fatigue crack propagation in a gear tooth considering loading and material parameter uncertainties. The model considered was a six-DOF one-stage gearbox with a cracked pinion tooth. An uncertainty quantification of stochastic torque loading and Paris’ material constants were employed. In order to simulate the loading characteristics of a wind turbine gearbox, a scaled rotor torque of AWT-27 (275 kW rated power, 27.4 m rotor diameter, and 42 m hub height) was employed. Calculation of the fatigue crack propagation involved uncertainty quantification, rainflow counting (RFC), dynamic analysis, and FE analysis. Co-simulation using ANSYS and MATLAB was performed for the analysis. The RFC analysis demonstrated that cycle counting plays a key role in estimating the fatigue crack propagation of a gearbox under stochastic loading. The dynamic analysis shows that increased dynamic loading corresponds to an increase in crack length. It was demonstrated that uncertainties in load cycle counting and Paris’ material constants play a key role in fatigue crack propagation estimations. The results of the dynamic analysis pointed out an increase in the crack length caused a reduction in the mesh stiffness and, as a result, an increase in the dynamic force on the gear tooth. The increase in the crack length also caused an increase in the stress intensity factor calculated by the FE model. Finally, the fatigue crack propagation with 98% confidence interval and a CDF plot of a crack size after certain number of cycles were presented. If this information is used in prognostics, it is useful in scheduling maintenance and replacement. The authors are pursuing this research agenda as future investigation.
Author Contributions
H.B. Endeshaw, S. Ekwaro-Osire, F.M. Alemayehu, and J.P. Dias conceived and designed the numerical experiments; H.B. Endeshaw performed the numerical experiments; H.B. Endeshaw, S. Ekwaro-Osire, F.M. Alemayehu, and J.P. Dias analyzed the results; H.B. Endeshaw, S. Ekwaro-Osire, F.M. Alemayehu, and J.P. Dias wrote the paper.
Conflicts of Interest
The authors declare no conflict of interest.
Nomenclature
All variables used in this paper are defined below:
| ac | critical crack length |
| ak | calculated crack length, at a time step of k (random variable) |
| ak−1 | crack length at time step k − 1 |
| C | Paris’ material constant or factor (random variable) |
| c1 | vertical radial viscous damping coefficient of input bearings |
| c2 | vertical radial viscous damping coefficient of output bearings |
| cg | damping coefficient of output flexible coupling |
| cp | damping coefficient of input flexible coupling |
| ct | mesh damping coefficient |
| E | Young’s modulus |
| fp | rotational frequency of the shaft (and consequently the pinion) |
| fT | frequency of torque loading |
| Fc | damping inter-tooth force |
| Fk | stiffness inter-tooth force |
| I1/I2 | mass moment of inertia of pinion/gear |
| Ib | mass moment of inertia of the load |
| Im | mass moment of inertia of the motor |
| k1 | vertical radial stiffness of input bearings |
| k2 | vertical radial stiffness of output bearings |
| kg | torsional stiffness of output flexible coupling |
| kp | torsional stiffness of input flexible coupling |
| kt | total mesh stiffness |
| LN(μ, σ) | Lognormal probability density function with mean μ and standard deviation σ |
| m | Paris’ material constant or exponent (random variable) |
| M1 | input motor torque |
| M2 | output torque from the load |
| m1/m2 | mass of pinion/gear |
| N(μ, σ) | Normal probability density function with mean μ and standard deviation σ |
| NT | total life cycle until failure |
| Rb1/Rb2 | outside circle radius of pinion/gear |
| T | applied fluctuating torque |
| y1/y2 | linear displacement of pinion/gear in the y-direction |
| ΔN | number of cycles added to the component |
| υ | Poisson’s ratio |
| σ | standard deviation |
| θb | angular displacement of the load |
| θm | angular displacement of the motor |
| θ1/θ2 | angular displacement of pinion/gear |
Appendix A
Figure A1.
One-stage gearbox system model.
References
- Lacerda, J.S.; van den Bergh, J.C.J.M. International Diffusion of Renewable Energy Innovations: Lessons from the Lead Markets for Wind Power in China, Germany and USA. Energies 2014, 7, 8236–8263. [Google Scholar] [CrossRef]
- Jin, X.; Gan, Y.; Ju, W.; Yang, X.; Han, H. Research on Wind Turbine Safety Analysis: Failure Analysis, Reliability Analysis, and Risk Assessment. Environ. Prog. Sustain. Energy 2016, 35, 1848–1861. [Google Scholar] [CrossRef]
- Liu, W.Y.; Tang, B.P.; Han, J.G.; Lu, X.N.; Hu, N.N.; He, Z.Z. The Structure Healthy Condition Monitoring and Fault Diagnosis Methods in Wind Turbines: A Review. Renew. Sustain. Energy Rev. 2015, 44, 466–472. [Google Scholar] [CrossRef]
- Kandukuri, S.T.; Klausen, A.; Karimi, H.R.; Robbersmyr, K.G. A Review of Diagnostics and Prognostics of Low-Speed Machinery towards Wind Turbine Farm-Level Health Management. Renew. Sustain. Energy Rev. 2016, 53, 697–708. [Google Scholar] [CrossRef]
- Grujicic, M.; Chenna, V.; Galgalikar, R.; Snipes, J.S.; Ramaswami, S.; Yavari, R. Wind-Turbine Gear-Box Roller-Bearing Premature-Failure Caused by Grain-Boundary Hydrogen Embrittlement: A Multi-Physics Computational Investigation. J. Mater. Eng. Perform. 2014, 23, 3984–4001. [Google Scholar] [CrossRef]
- Alemayehu, F.M.; Ekwaro-Osire, S. Loading and Design Parameter Uncertainty in the Dynamics and Performance of High-Speed-Parallel-Helical-Stage of a Wind Turbine Gearbox. J. Mech. Des. 2014, 136, 091002. [Google Scholar] [CrossRef]
- Alemayehu, F.M.; Ekwaro-Osire, S. Probabilistic Performance of Helical Compound Planetary System in Wind Turbine. J. Comput. Nonlinear Dyn. 2015, 10, 041003. [Google Scholar] [CrossRef]
- Ossai, C.I.; Boswell, B.; Davies, I.J. A Markovian Approach for Modelling the Effects of Maintenance on Downtime and Failure Risk of Wind Turbine Components. Renew. Energy 2016, 96, 775–783. [Google Scholar] [CrossRef]
- Alemayehu, F.M.; Ekwaro-Osire, S. Uncertainty Considerations in the Dynamic Loading and Failure of Spur Gear Pairs. J. Mech. Des. 2013, 135, 084501. [Google Scholar] [CrossRef]
- Wang, Q.; Zhu, Y.; Zhang, Z.; Fu, C.; Dong, C.; Su, H. Partial Load: A Key Factor Resulting in the Failure of Gear in the Wind Turbine Gearbox. J. Fail. Anal. Prev. 2016, 16, 109–122. [Google Scholar] [CrossRef]
- Wang, L.; Shao, Y. Fault Mode Analysis and Detection for Gear Tooth Crack during Its Propagating Process Based on Dynamic Simulation Method. Eng. Fail. Anal. 2017, 71, 166–178. [Google Scholar] [CrossRef]
- Pandya, Y.; Parey, A. Simulation of Crack Propagation in Spur Gear Tooth for Different Gear Parameter and Its Influence on Mesh Stiffness. Eng. Fail. Anal. 2013, 30, 124–137. [Google Scholar] [CrossRef]
- Li, C.J.; Lee, H. Gear Fatigue Crack Prognosis Using Embedded Model, Gear Dynamic Model and Fracture Mechanics. Mech. Syst. Signal Process. 2005, 19, 836–846. [Google Scholar] [CrossRef]
- Li, Z.; Yan, X.; Wang, X.; Peng, Z. Detection of Gear Cracks in a Complex Gearbox of Wind Turbines Using Supervised Bounded Component Analysis of Vibration Signals Collected from Multi-Channel Sensors. J. Sound Vib. 2015, 371, 406–433. [Google Scholar] [CrossRef]
- Tian, Z.; Zuo, M.J.; Wu, S. Crack Propagation Assessment for Spur Gears Using Model-Based Analysis and Simulation. J. Intell. Manuf. 2012, 23, 239–253. [Google Scholar] [CrossRef]
- Zhao, F.; Tian, Z.; Zeng, Y. Uncertainty Quantification in Gear Remaining Useful Life Prediction through an Integrated Prognostics Method. IEEE Trans. Reliab. 2013, 62, 146–159. [Google Scholar] [CrossRef]
- Van Bussel, G.J.W.; Boussion, C.; Hofemann, C. A Possible Relation between Wind Conditions, Advanced Control and Early Gearbox Failures in Offshore Wind Turbines. Procedia CIRP 2013, 11, 301–304. [Google Scholar] [CrossRef]
- Beyaoui, M.; Tounsi, M.; Abboudi, K.; Feki, N.; Walha, L.; Haddar, M. Dynamic Behaviour of a Wind Turbine Gear System with Uncertainties. C. R. Mec. 2016, 344, 375–387. [Google Scholar] [CrossRef]
- Wu, S.; Zuo, M.J.; Parey, A. Simulation of Spur Gear Dynamics and Estimation of Fault Growth. J. Sound Vib. 2008, 317, 608–624. [Google Scholar] [CrossRef]
- ANSYS Mechanical APDL Element Reference; ANSYS, Inc.: Canonsburg, PA, USA, 2013.
- Guinea, G.V.; Planas, J.; Elices, M. Stress Intensity Factor Evaluation by the Displacement Extrapolation Technique. Eng. Fract. Mech. 2000, 66, 243–255. [Google Scholar] [CrossRef]
- Jonkman, J.B.; Kilcher, L. TurbSim User’s Guide: Version 1.06.00; Technical Report; National Renewable Energy Laboratory: Golden, CO, USA, 2012.
- Jonkman, J.M.; Buhl, M.L., Jr. FAST User’s Guide; Technical Report; National Renewable Energy Laboratory: Golden, CO, USA, 2005.
- Rainflow Counting Algorithm. Available online: https://www.mathworks.com/matlabcentral/fileexchange/3026-rainflow-counting-algorithm?requestedDomain=www.mathworks.com (accessed on 21 November 2017).
- American Society for Testing and Materials (ASTM). E1049-85: Standard Practices for Cycle Counting in Fatigue Analysis; ASTM: West Conshohocken, PA, USA, 2017. [Google Scholar]
Figure 1.
Finite element model for: (a) cracked gear tooth; and (b) singular element at the crack tip (adapted from [16]).
Figure 1.
Finite element model for: (a) cracked gear tooth; and (b) singular element at the crack tip (adapted from [16]).

Figure 2.
Fatigue loading characteristics of the gearbox during a random loading. RFC: rainflow counting.
Figure 2.
Fatigue loading characteristics of the gearbox during a random loading. RFC: rainflow counting.
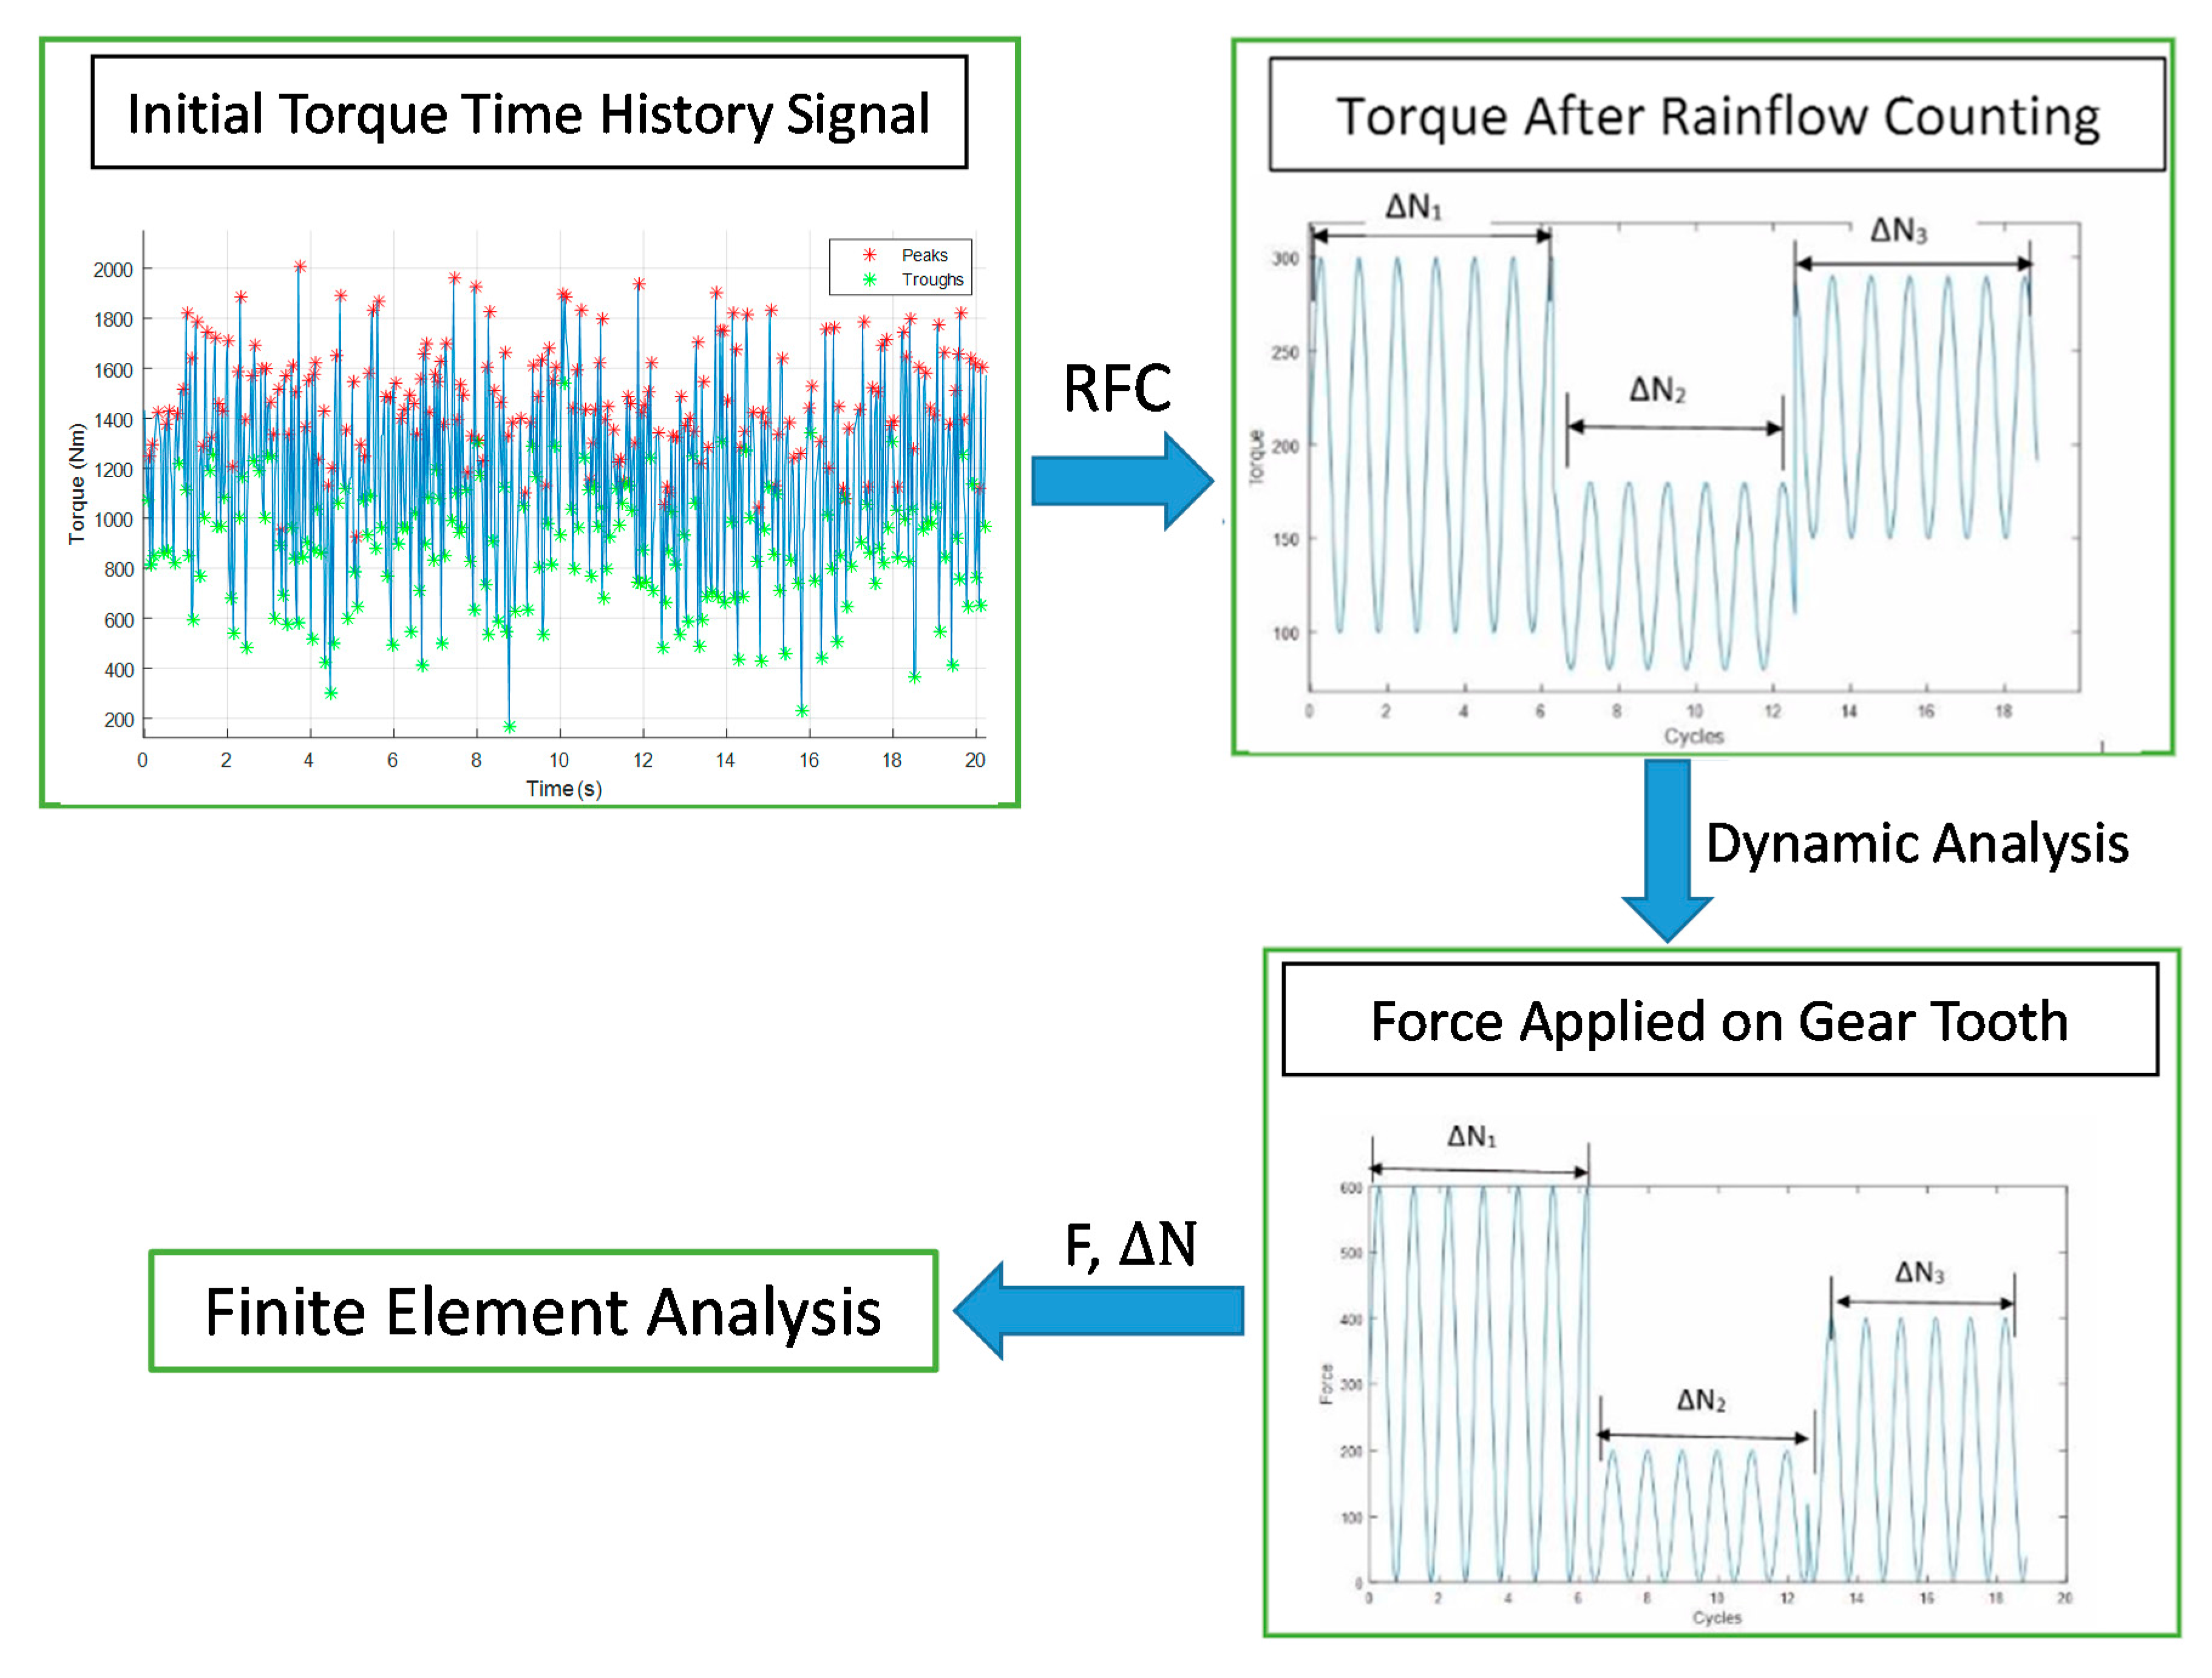
Figure 3.
Framework for fatigue crack propagation of a gear. APDL: ANSYS Parametric Design Language.
Figure 3.
Framework for fatigue crack propagation of a gear. APDL: ANSYS Parametric Design Language.
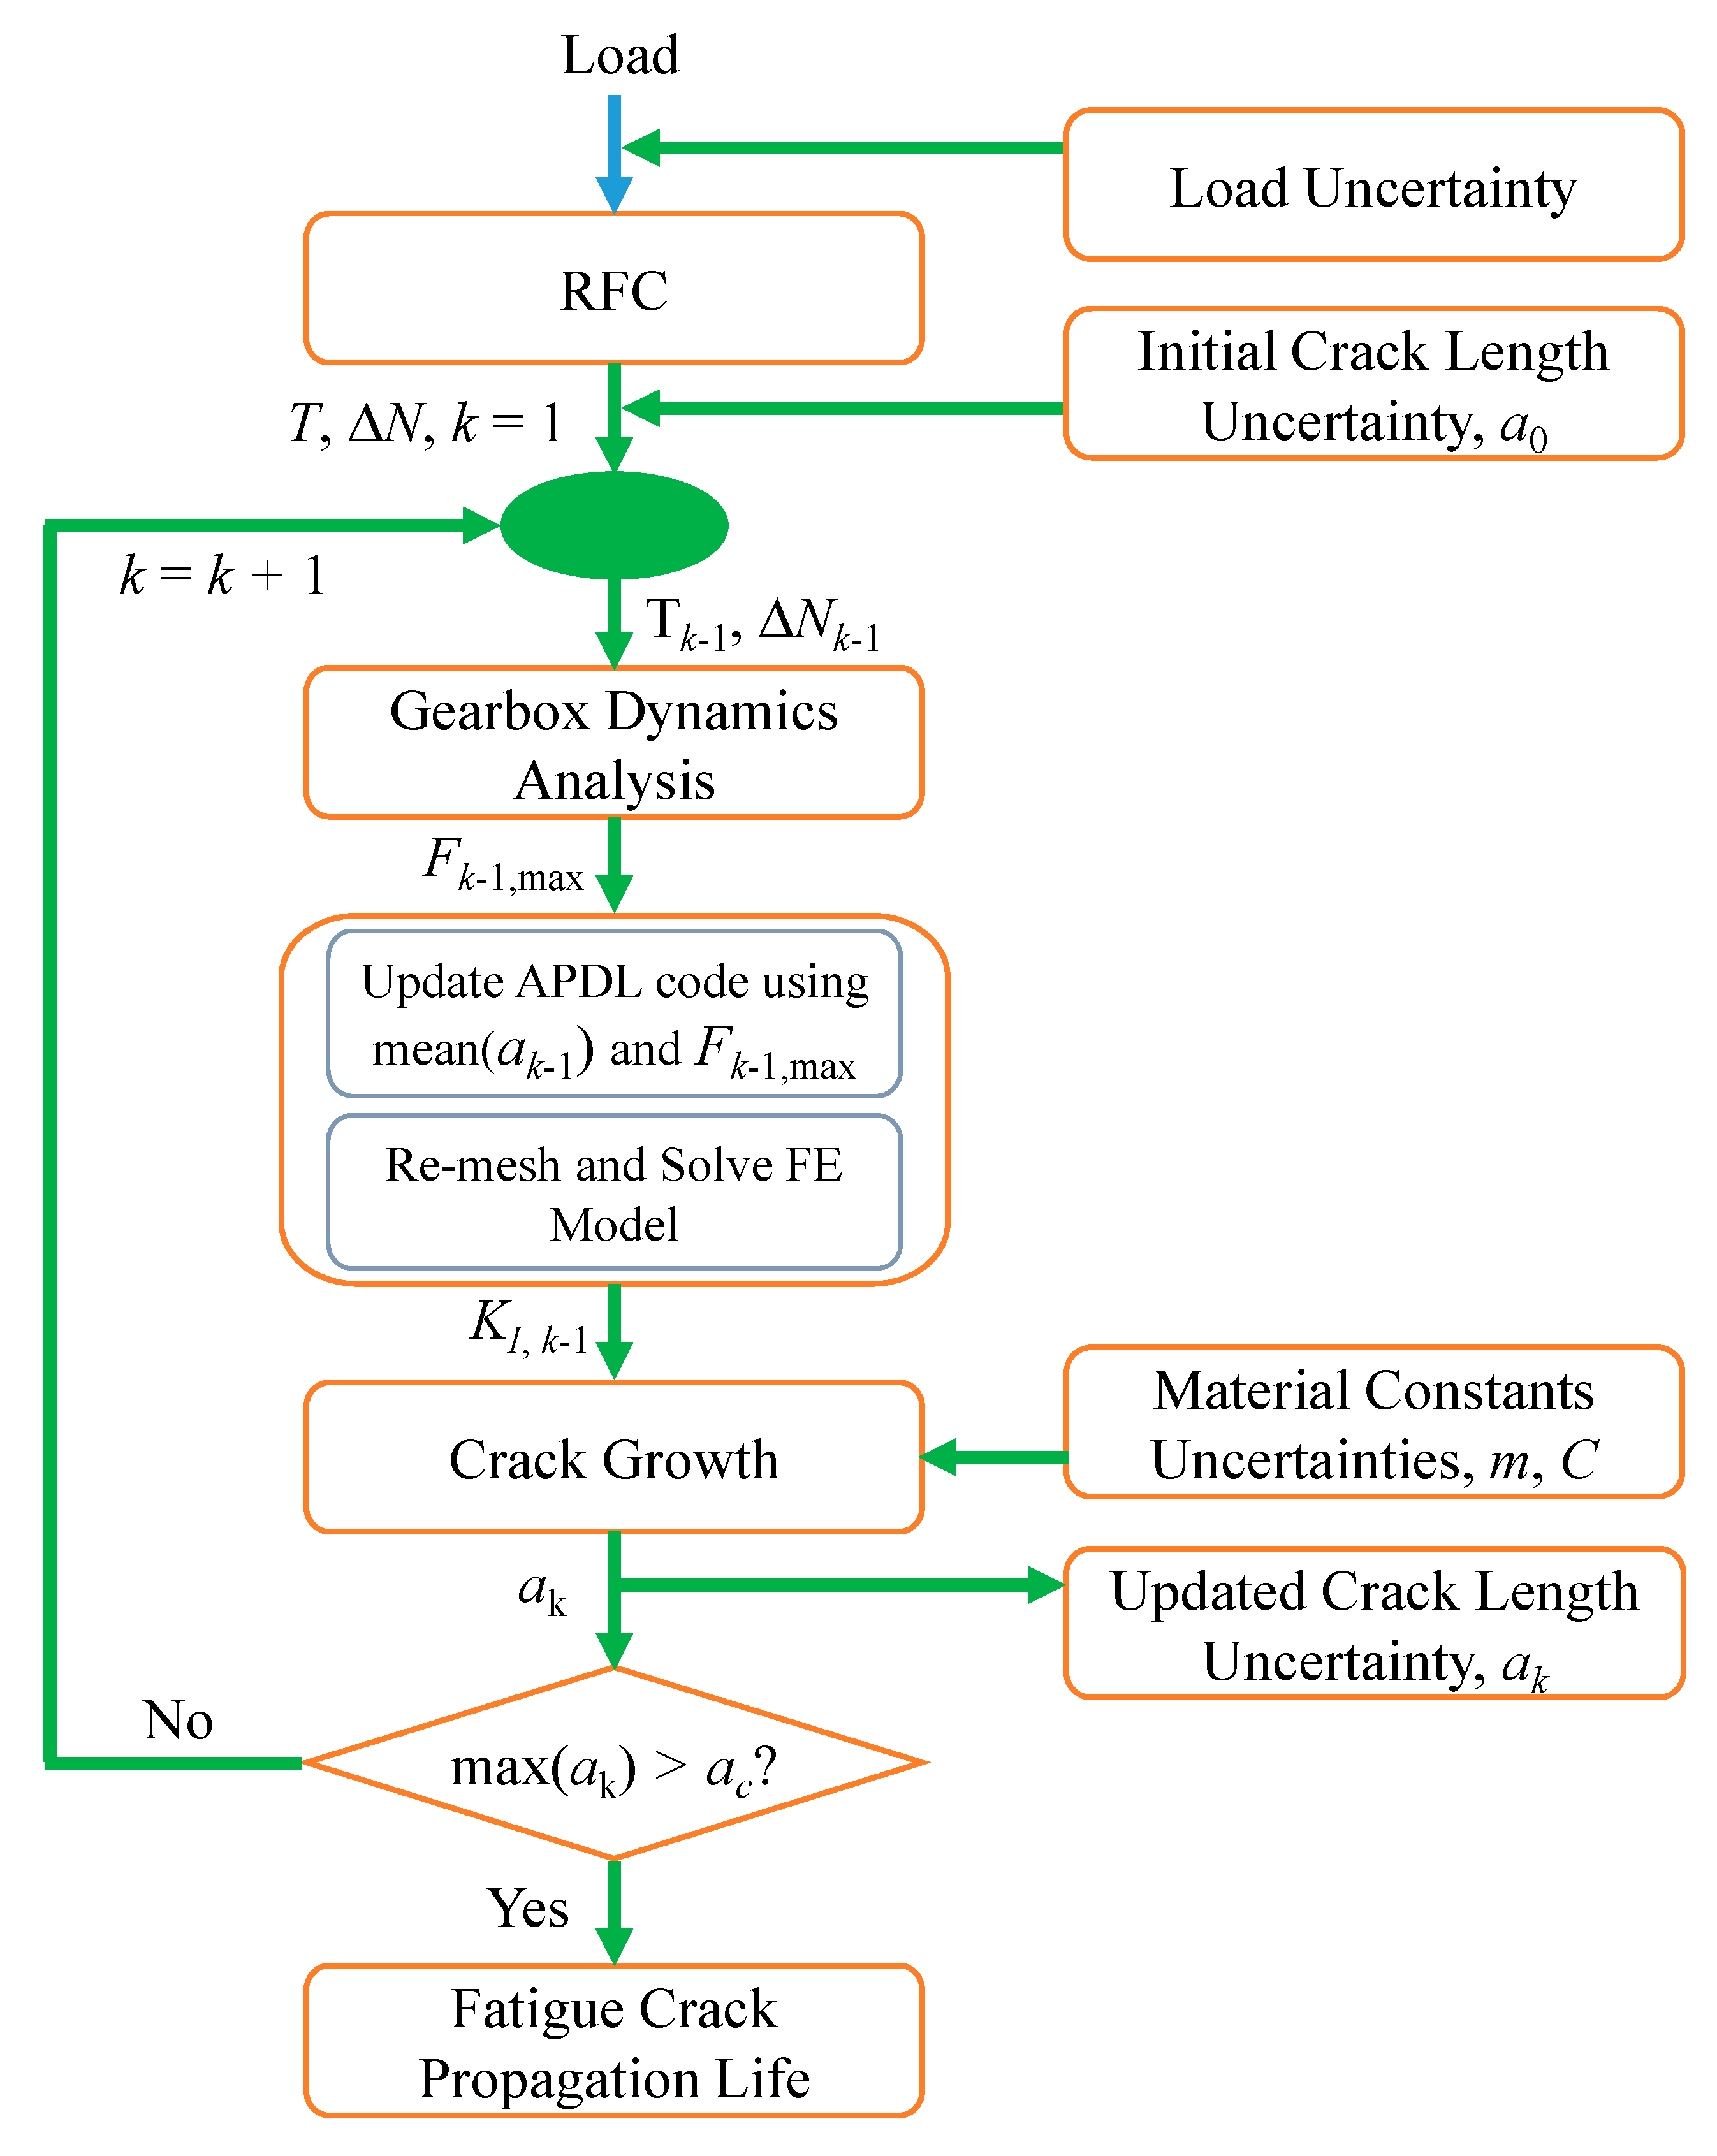
Figure 4.
Torque time history signal of the input shaft.
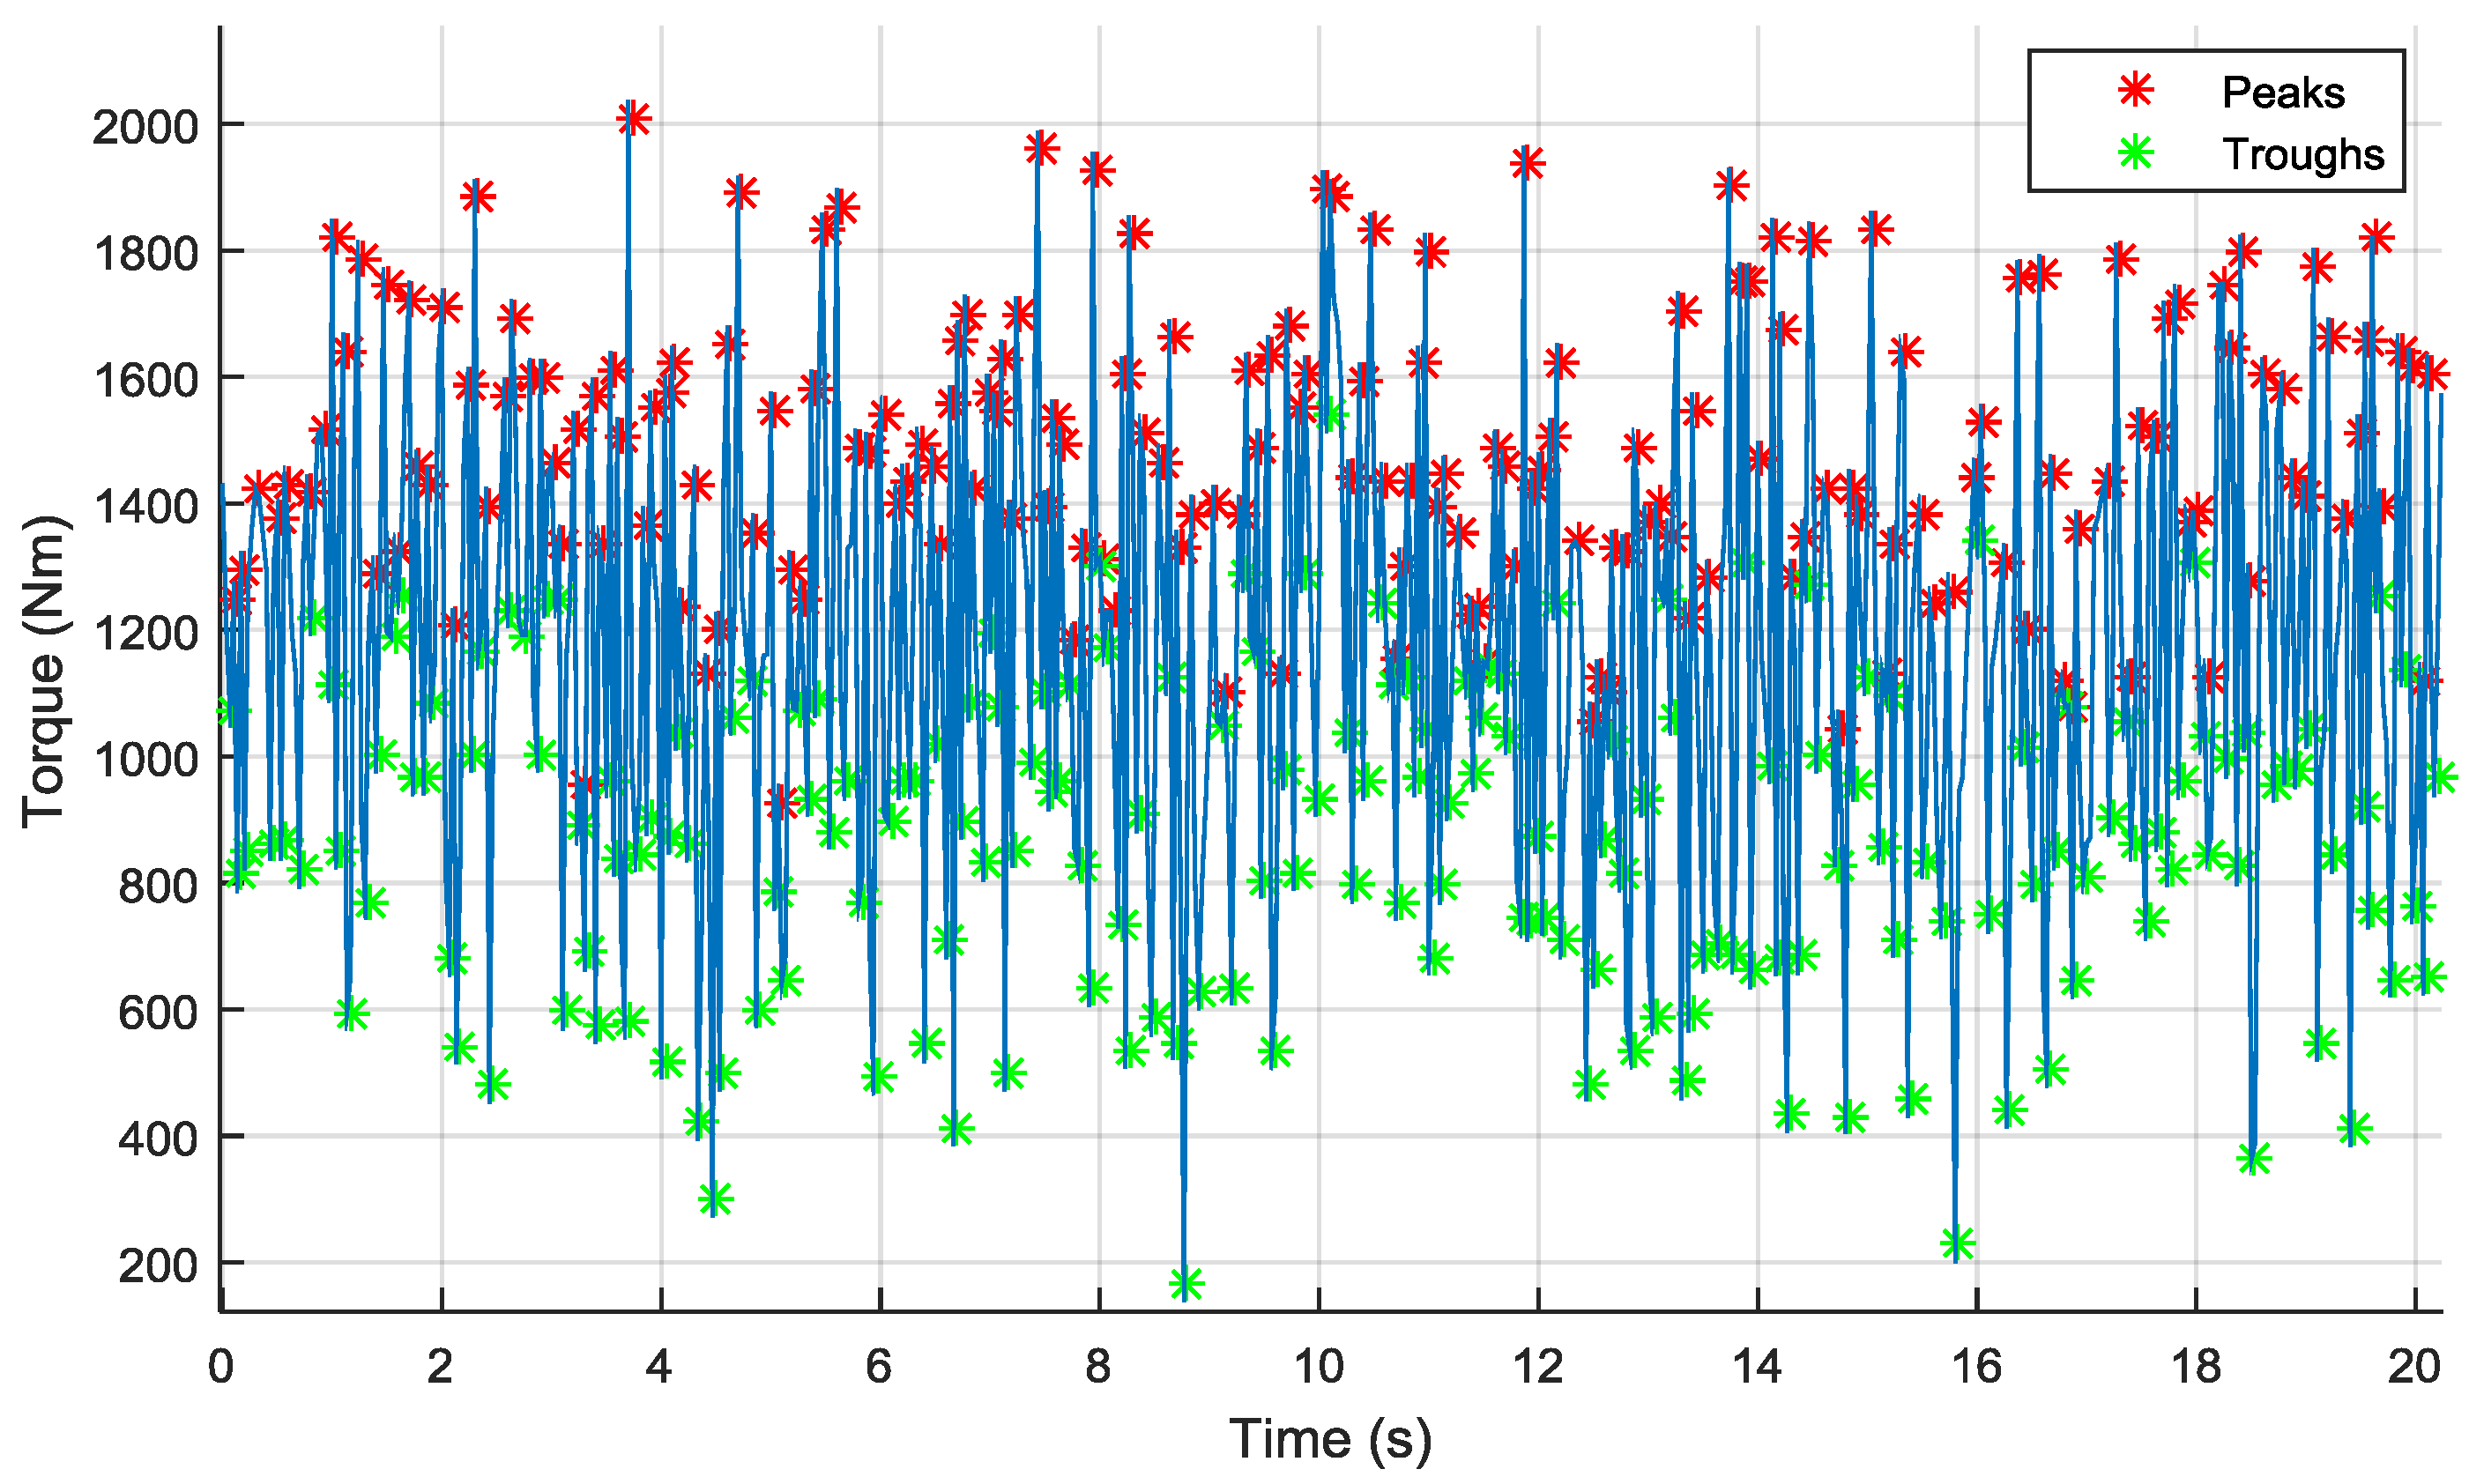
Figure 5.
RFC results of torque time history signal for: (a) mid-range; and (b) amplitude.
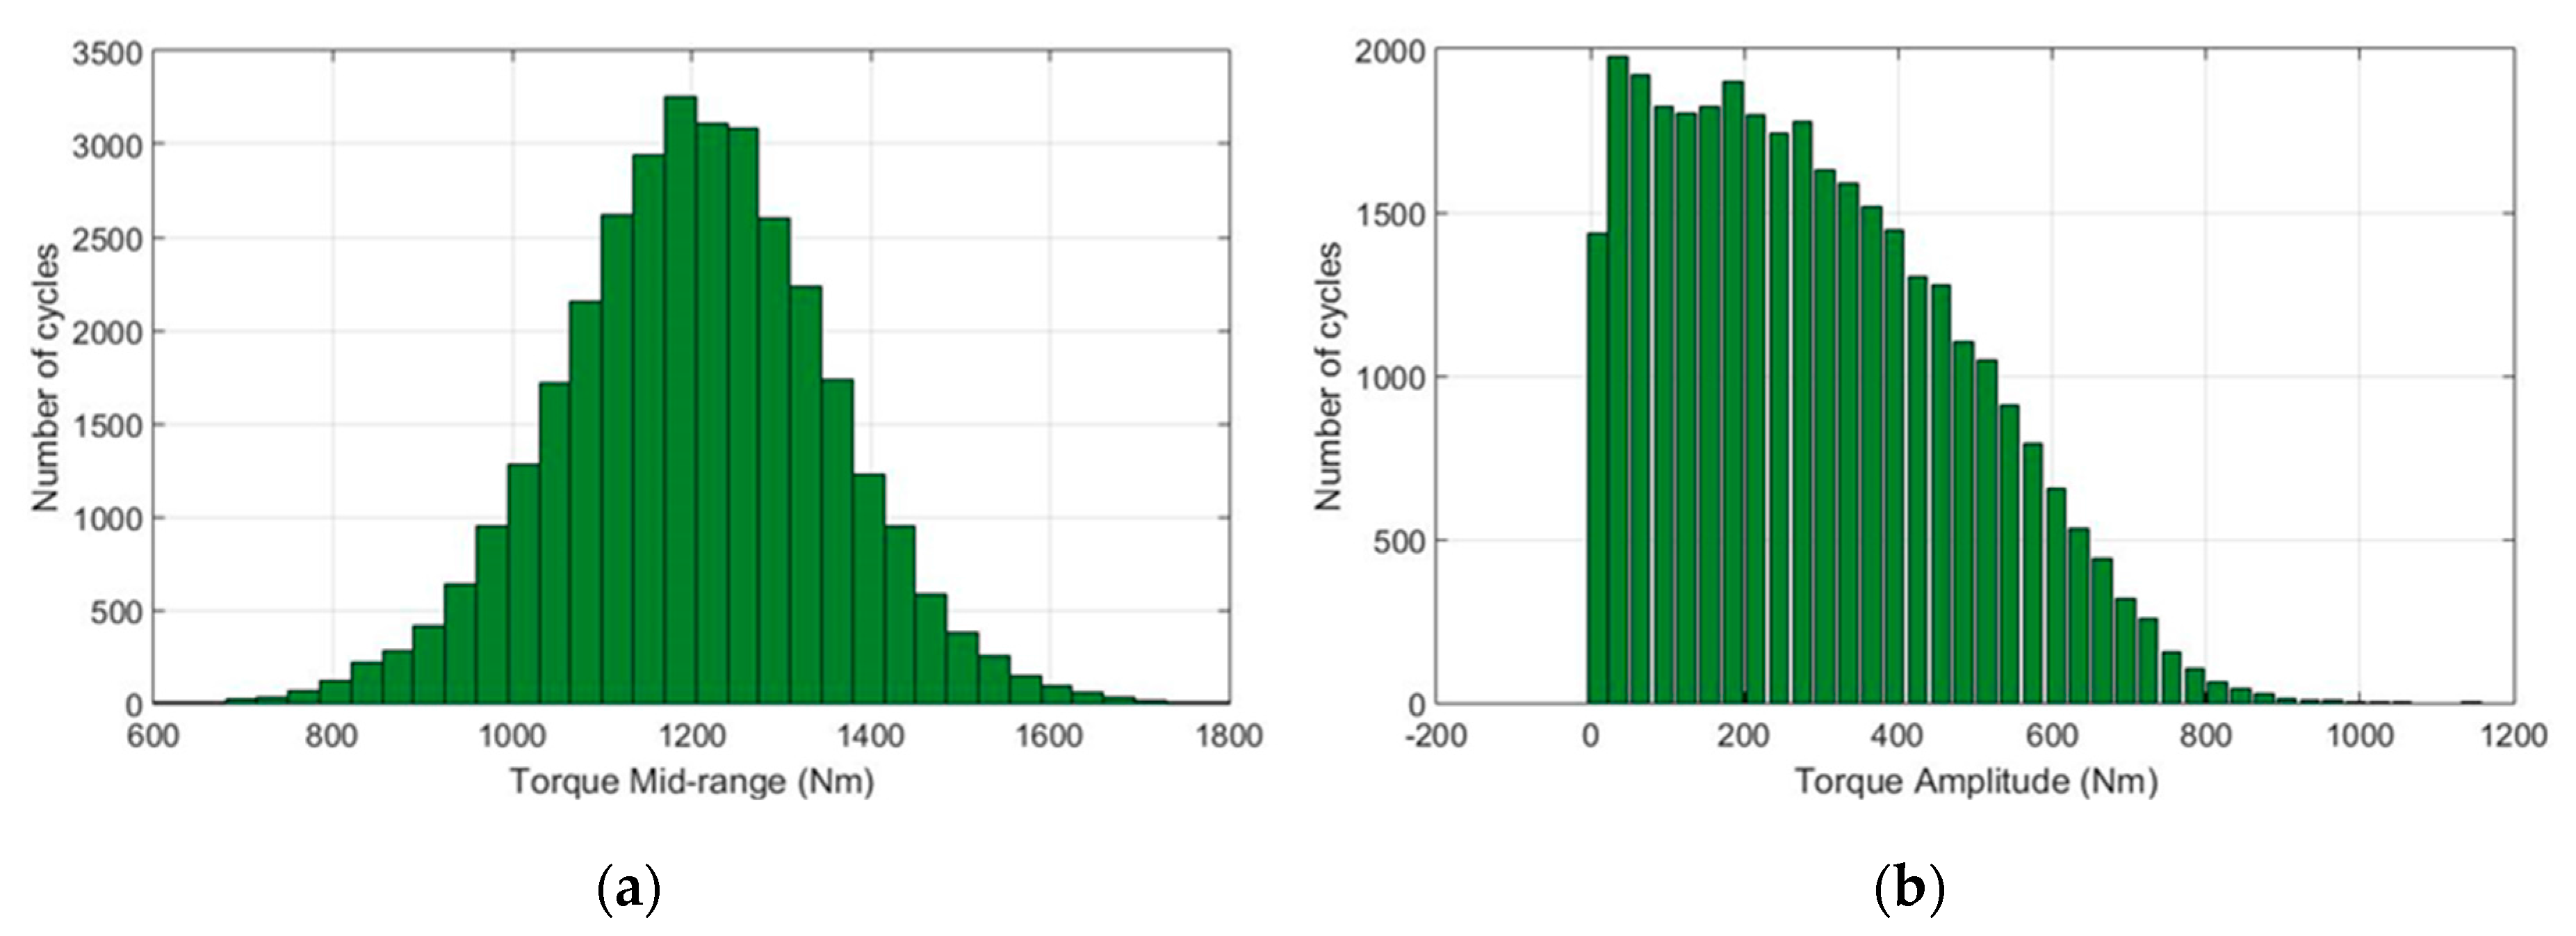
Figure 6.
RFC results of torque amplitude and torque average values plotted with respect to their corresponding number of cycles.
Figure 6.
RFC results of torque amplitude and torque average values plotted with respect to their corresponding number of cycles.

Figure 7.
Maximum input torque values.
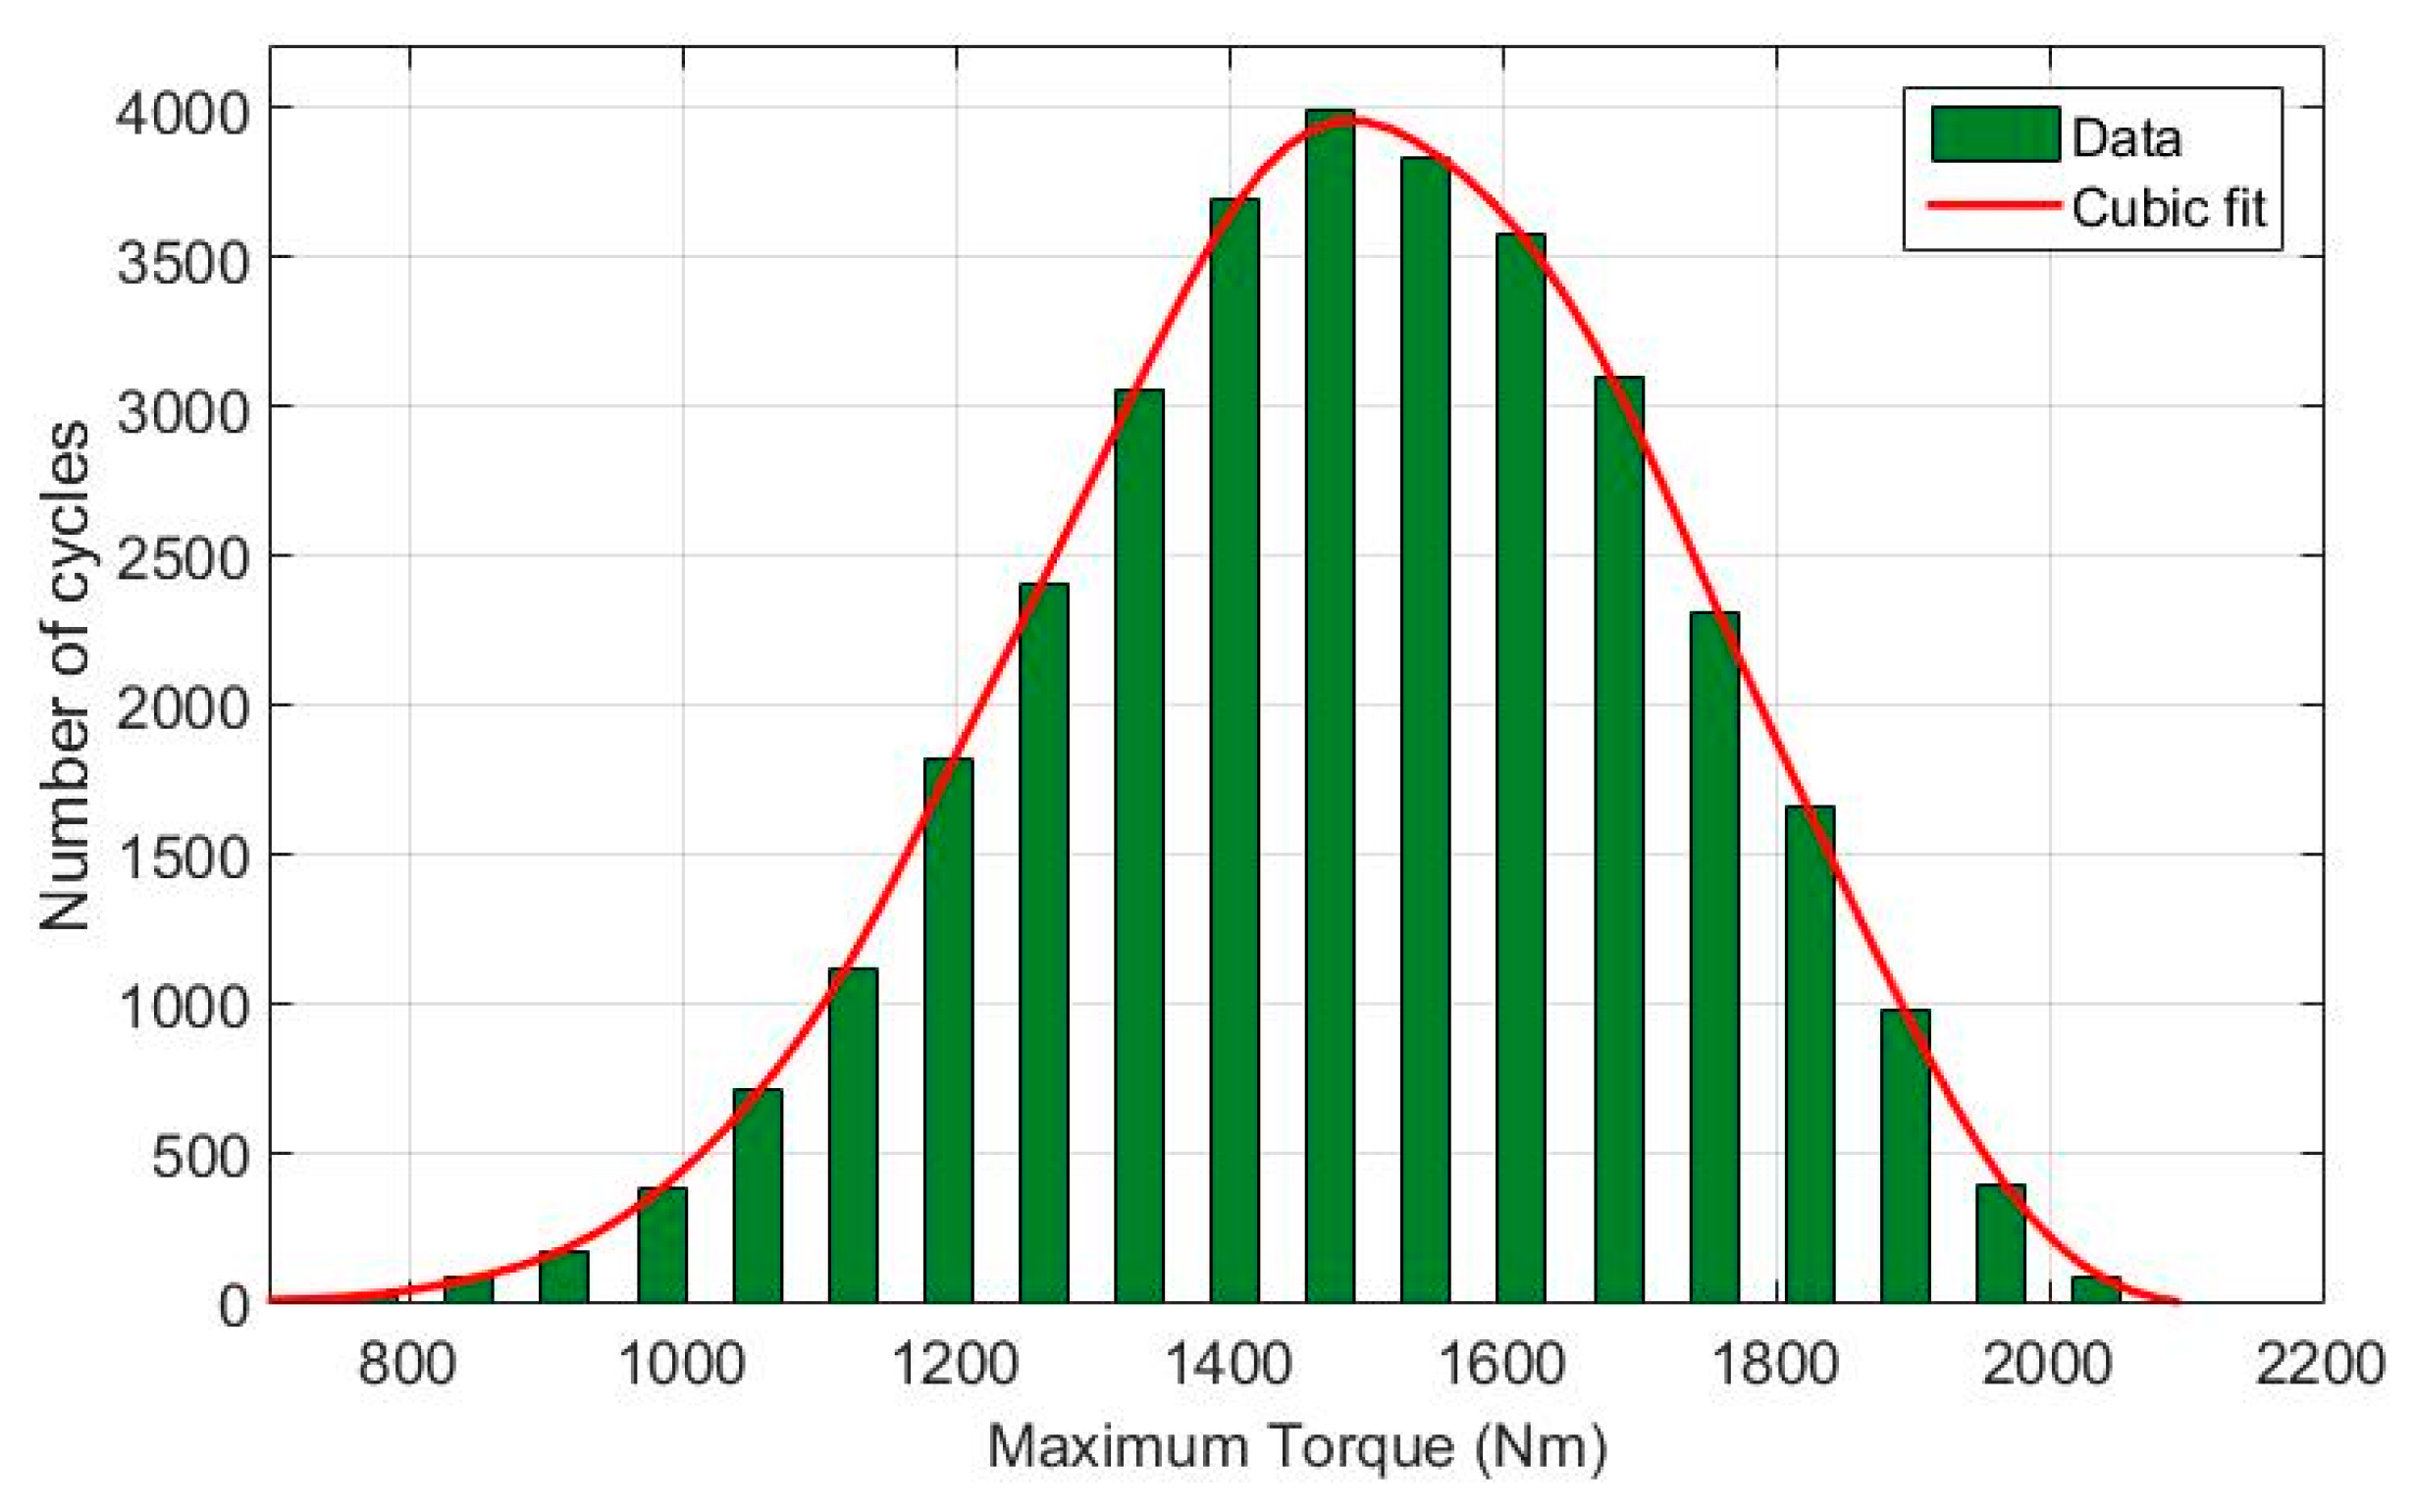
Figure 8.
Comparison between the mesh stiffness for (a) undamaged pinion and (b) pinion with a 2.5 mm crack in the 10th tooth.
Figure 8.
Comparison between the mesh stiffness for (a) undamaged pinion and (b) pinion with a 2.5 mm crack in the 10th tooth.
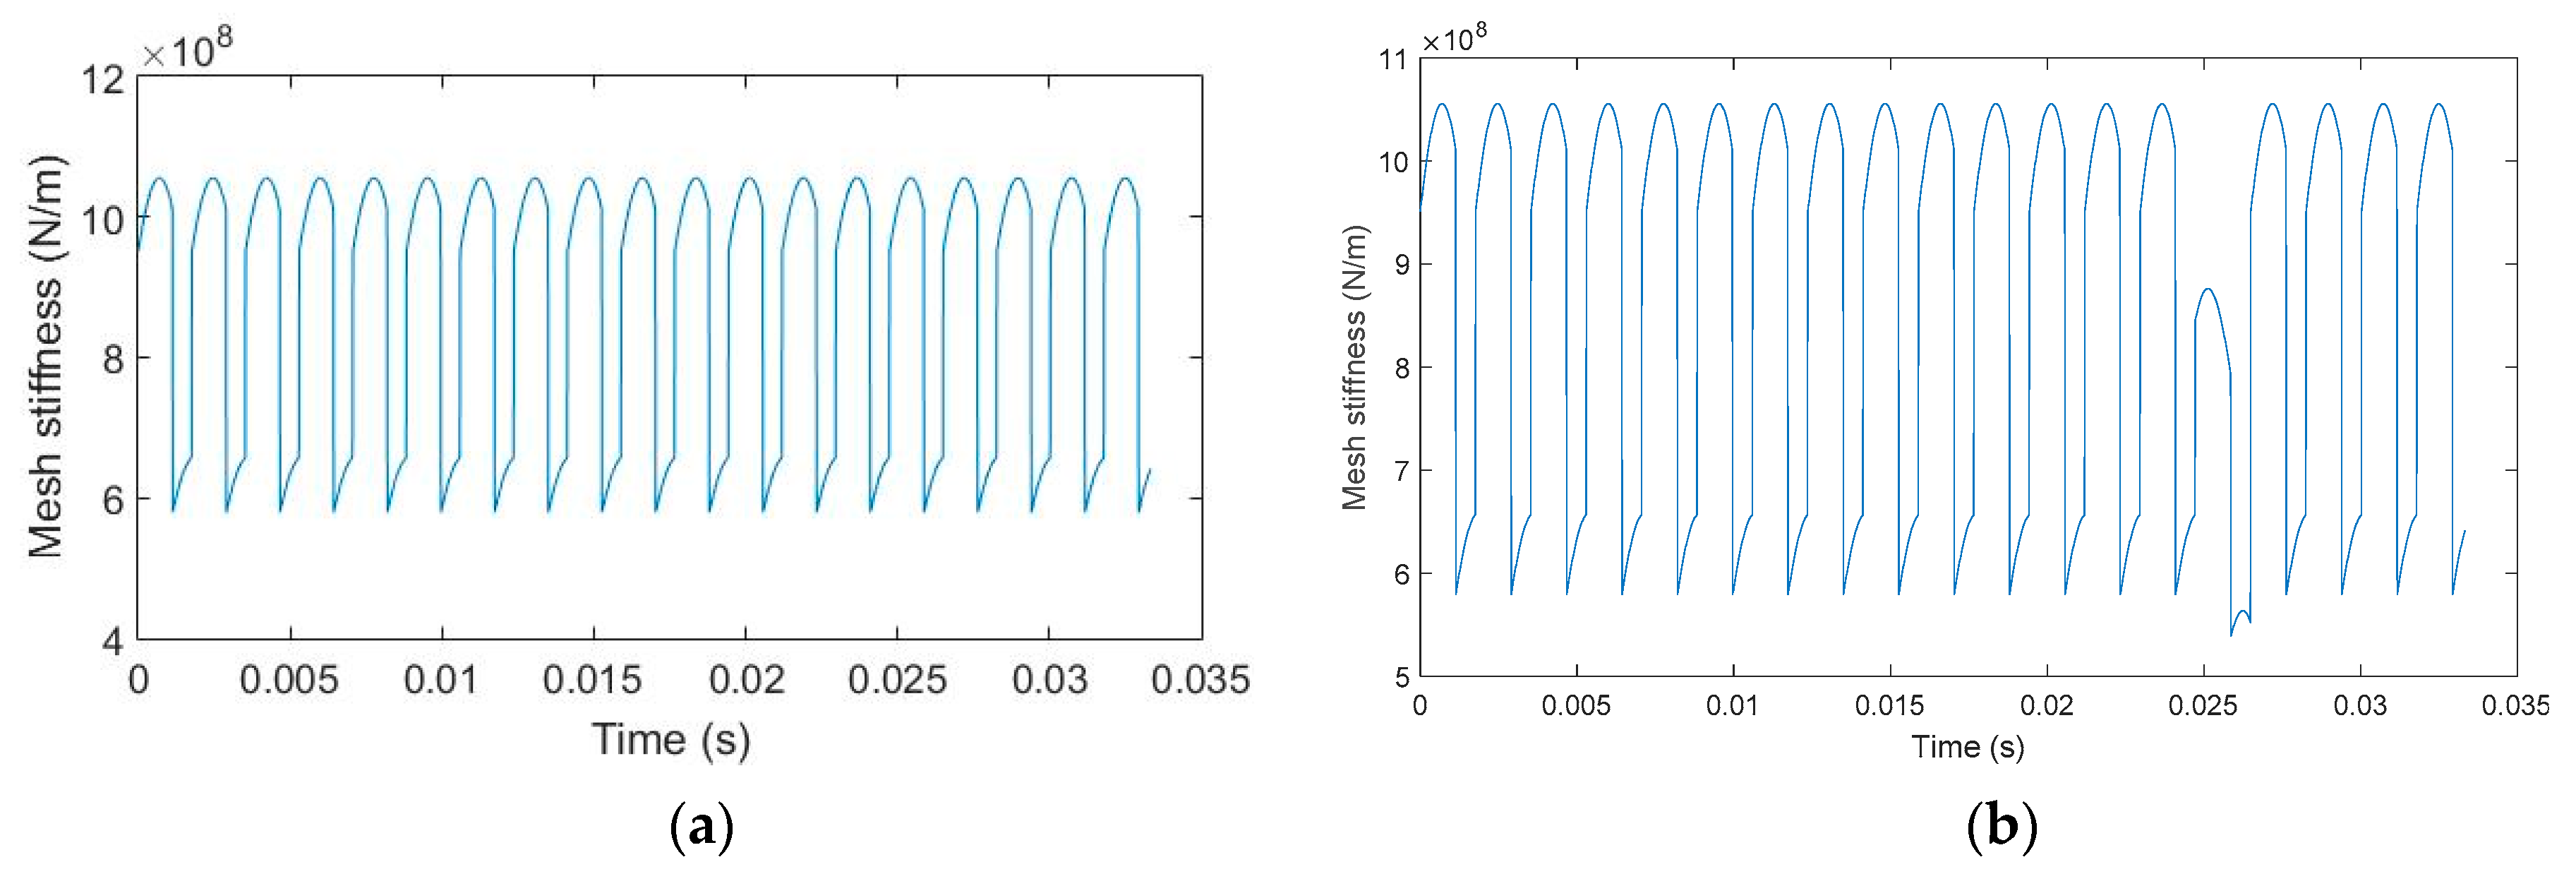
Figure 9.
Comparison between the dynamic force for (a) undamaged pinion and (b) pinion with a 2.5 mm crack in the 10th tooth.
Figure 9.
Comparison between the dynamic force for (a) undamaged pinion and (b) pinion with a 2.5 mm crack in the 10th tooth.
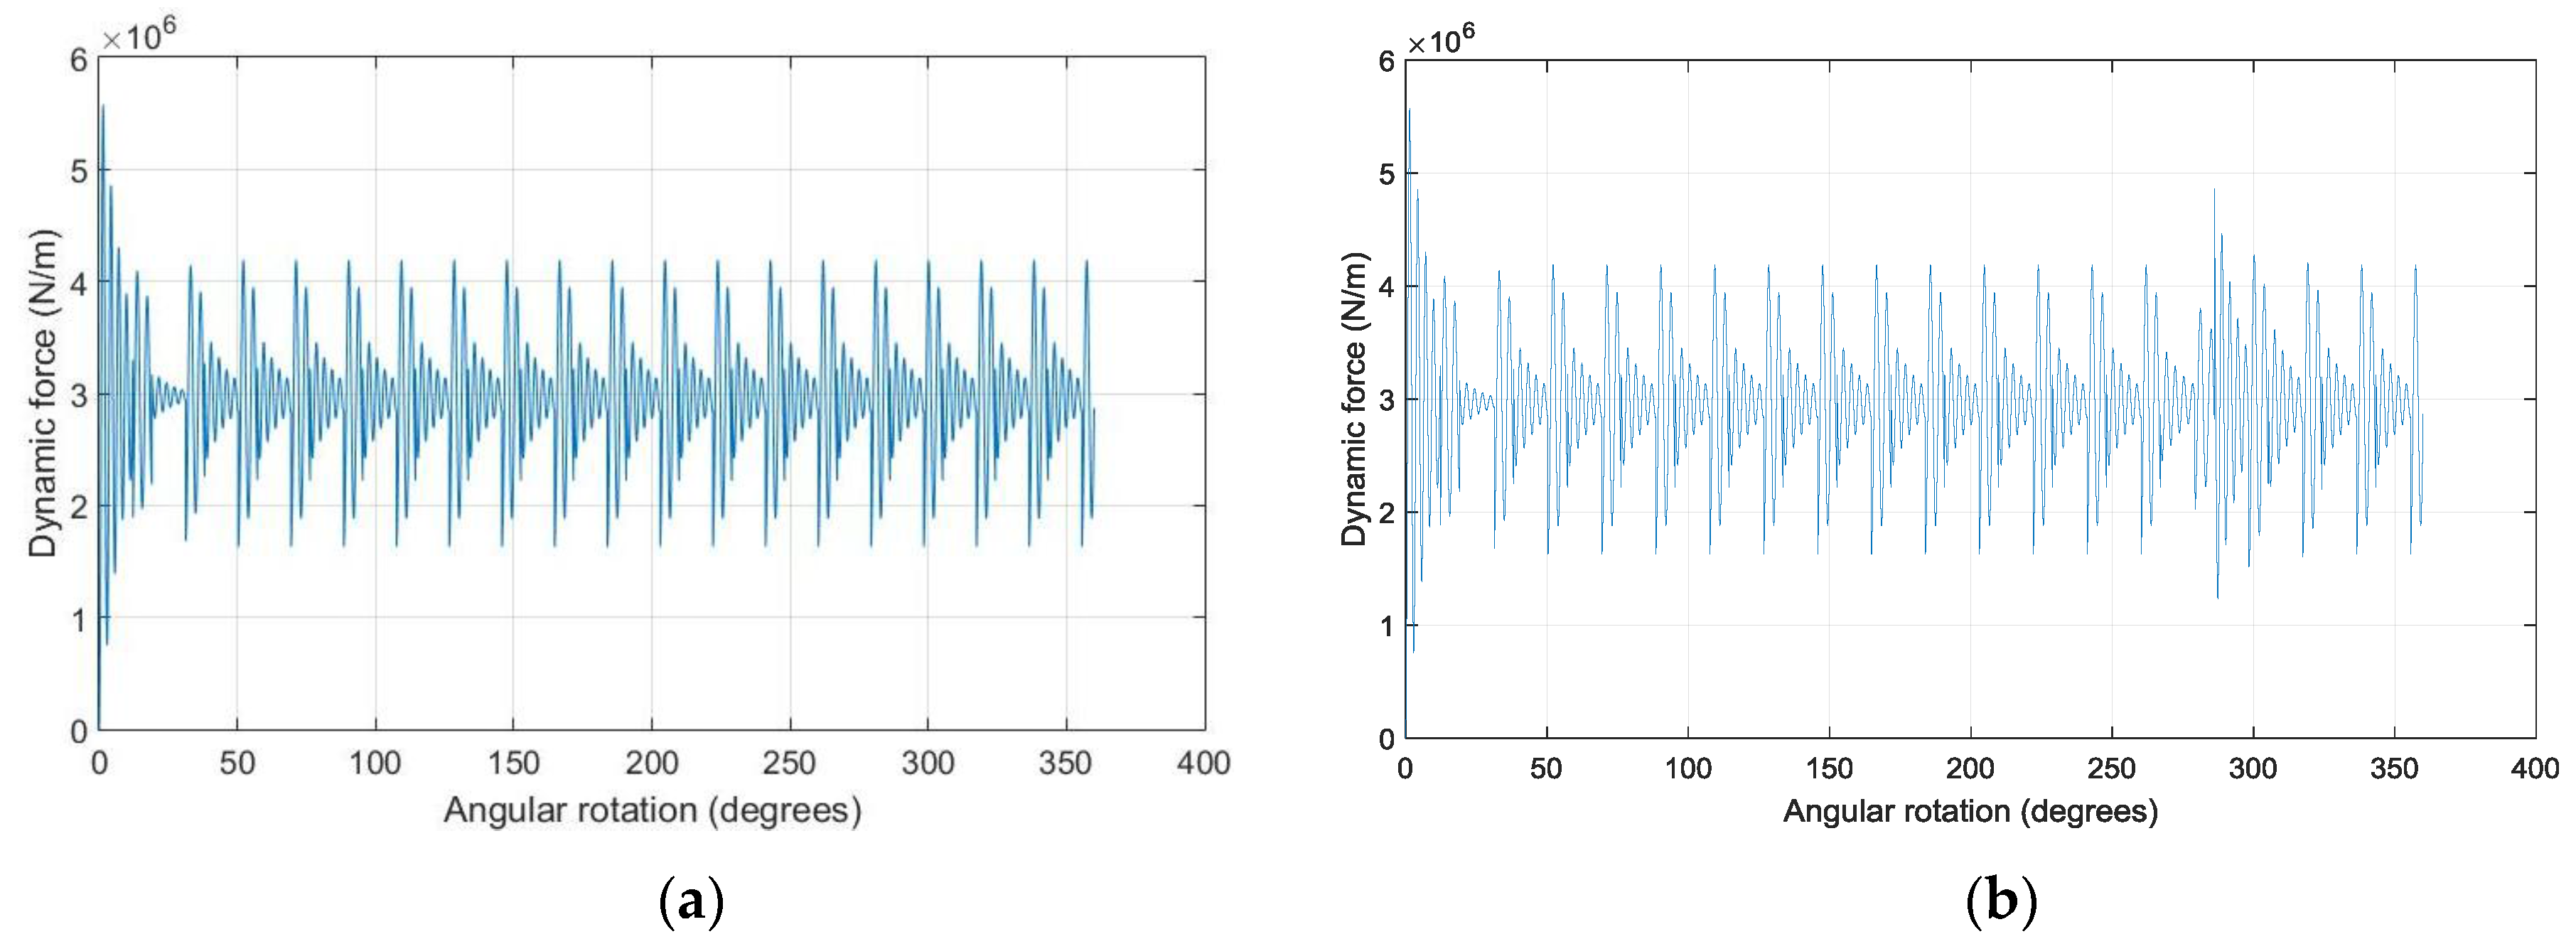
Figure 10.
The relationship between crack propagation, torque, and stress intensity factor for the gear pair.
Figure 10.
The relationship between crack propagation, torque, and stress intensity factor for the gear pair.

Figure 11.
Fatigue Crack Propagation (crack length versus number of cycles showing the mean and ±3σ bounds of variation).
Figure 11.
Fatigue Crack Propagation (crack length versus number of cycles showing the mean and ±3σ bounds of variation).

Figure 12.
Cumulative distribution function (CDF) of the resulting fatigue crack length, ak, after N = 1000 cycles (C ~ N(9.12 × 10⁻¹¹, 4.56 × 10⁻¹²) and m ~ N(1.4354, 0.0287), ak−1 ~ LN(0.1, 0.01) mm, ΔKI = 3401 MPa, ΔN = 1000 cycles). N: Normal distribution; LN: Lognormal distribution.
Figure 12.
Cumulative distribution function (CDF) of the resulting fatigue crack length, ak, after N = 1000 cycles (C ~ N(9.12 × 10⁻¹¹, 4.56 × 10⁻¹²) and m ~ N(1.4354, 0.0287), ak−1 ~ LN(0.1, 0.01) mm, ΔKI = 3401 MPa, ΔN = 1000 cycles). N: Normal distribution; LN: Lognormal distribution.

Table 1.
Load and material random variables.
| Parameter | Unit | Mean, μ (Location) | Std. Dev, σ (Scale) | Shape | COV | |
|---|---|---|---|---|---|---|
| m 1 | Normal | - | 1.4354 | 0.0287 | - | 0.02 |
| C 1 | Normal | 9.12 × 10⁻¹¹ | 4.56 × 10⁻¹² | - | 0.05 | |
| T | GEV | Nm | (320) | (35) | −0.36 | - |
1 Paris material constant [16]. PDF: probability density function; GEV: generalized extreme value; COV: coefficient of variation.
© 2017 by the authors. Licensee MDPI, Basel, Switzerland. This article is an open access article distributed under the terms and conditions of the Creative Commons Attribution (CC BY) license (http://creativecommons.org/licenses/by/4.0/).
Share and Cite
MDPI and ACS Style
Endeshaw, H.B.; Ekwaro-Osire, S.; Alemayehu, F.M.; Dias, J.P. Evaluation of Fatigue Crack Propagation of Gears Considering Uncertainties in Loading and Material Properties. Sustainability 2017, 9, 2200. https://doi.org/10.3390/su9122200
AMA Style
Endeshaw HB, Ekwaro-Osire S, Alemayehu FM, Dias JP. Evaluation of Fatigue Crack Propagation of Gears Considering Uncertainties in Loading and Material Properties. Sustainability. 2017; 9(12):2200. https://doi.org/10.3390/su9122200
Chicago/Turabian StyleEndeshaw, Haileyesus B., Stephen Ekwaro-Osire, Fisseha M. Alemayehu, and João Paulo Dias. 2017. "Evaluation of Fatigue Crack Propagation of Gears Considering Uncertainties in Loading and Material Properties" Sustainability 9, no. 12: 2200. https://doi.org/10.3390/su9122200
Note that from the first issue of 2016, this journal uses article numbers instead of page numbers. See further details here.