Article

Developing a Rating System for Building Energy Efficiency Based on In Situ Measurement in China

School of Architecture, Tsinghua University, Beijing 100084, China
*
Author to whom correspondence should be addressed.
Sustainability 2017, 9(2), 208; https://doi.org/10.3390/su9020208
Submission received: 28 December 2016 / Revised: 23 January 2017 / Accepted: 24 January 2017 / Published: 3 February 2017
(This article belongs to the Special Issue Sustainability Assessments of Buildings)

Abstract

:
Building energy consumption in China recently surpassed the US building consumption, and it is expected to increase significantly in the next decade pushed by the continuous population and urbanization increase. In response to that situation, the Chinese government introduced a series of building energy codes and rating systems to assess and enhance the building energy performance. The purpose of this study is to develop a rating system for the building energy efficiency, based on in situ measurement. The system is intended for office buildings in China’s cold zone. An evaluation framework, graphic dominant point, and principle of data collection and processing are illustrated in this paper. Three existing buildings were rated under the new rating system. The authors believe that the new system will contribute to a more accurate and comprehensive understanding for asset holders and occupants, that report on the extent to which energy efficiency buildings have been reached. Rating results are expected to be a reference for the retrofitting of existing buildings and the design of new buildings. In addition, the outlook for the rating system was also discussed.

1. Introduction

China is the country with the largest energy consumption worldwide, with a rate of 18% in 2010 [1]; in particular, the building energy consumption in China recently surpassed the US building consumption, and it is expected to increase significantly in the next decade, pushed by the continuous population and urbanization increase, and the improving living standards that are following the increasing urbanization rate [2]. The building sector is a major contributor to environmental degradation [3]. To preserve the environment and reduce building energy consumption in China, a series of measures has been implemented in order to promote building energy efficiency. The measures mainly consist of introducing and improving energy codes and design standards for new and existing buildings [4], and the energy evaluation of buildings.
China began monitoring its energy efficiency efforts in the early 1980s, in response to the continuous increase in the energy use of the residential sector [5], before expanding its efforts over a larger scope, leading to the introduction of a series of new building energy standards and codes [6,7,8]. These standards are mandatory at a national level and have a significant influence on the design phase of new buildings and the retrofitting of existing buildings. These standards defined the efficiency requirements of the building envelope, such as the minimum insulation of walls, roofs, and floors, and the thermal performance of windows, as well as HVAC systems. Energy certification standards [9,10] have also been introduced, in order to evaluate a building’s energy consumption in its operational phase. However, whilst much attention has been paid to energy consumption due to the aforementioned measure, the indoor environmental quality of buildings is an issue that has been neglected [11].
Rating systems for sustainable building were developed in the 1990s, across the globe. These rating tools evaluate a building’s environmental performance and pay much attention to energy consumption, as well as indoor environmental quality. The U.K. announced the first building environmental performance assessment system, known as BREEAM (Building Research Establishment Environmental Assessment Method) [12], and then developed countries proposed their own systems, such as the U.S.’s LEED (Leadership in Energy and Environment Design) [13], Japan’s CASBEE (Comprehensive Assessment System for Building Environmental Efficiency) [14], etc. China issued the ESGB (Evaluation Standard for Green Building) [15] in 2006. LEED, as the most recognized building environment rating system, is also widely adopted in China. Major developers often undergo LEED assessment in order to demonstrate the improved environmental performance of their building assets, thus attracting international investors. These codes and rating systems play an important role in guiding the sustainable design and decision-making processes [16,17], and have a significant impact on building industry.
Buildings rated and certificated by energy codes, LEED, or ESGB, are expected to have a high energy efficiency performance and good indoor environmental qualities. However, studies show that the actual performance of these green buildings in China cannot achieve the energy efficient goal during their operational phase. A comparative study has shown that many LEED-certified buildings performed worse than their conventional counterparts [18]. Many studies show that the actual performance of certificated green buildings, does not support the hypothesis that they are superior in terms of aesthetics, serenity, lighting, ventilation, acoustics, or humidity, when compared with non-certificated ones [19,20].
The reasons for this are illustrated, as follows: (1) In China, most of the certificated energy efficient buildings or labeled green buildings cannot achieve green standards in their operation stage, due to the lack of mature technology and skilled workers [21]; (2) The point-based rating method in LEED and GBL, encourages designers to adopt as many sustainable strategies as possible in order to achieve a high enough score in the process of assessment, which does not directly lead to the better performance of buildings; (3) According to the existing rating systems, a building’s energy performance during the operation phase is the result of simulation through theoretical calculation, based on codes or dynamic algorithms [22,23] which do not usually reveal the real behavior that an in situ measurement can show [24].
The purpose of this paper is to present a rating system for building energy efficiency, based on in situ measurement in China. The system is intended for office buildings in China’s cold zone, during the operational phase. An evaluation framework, graphic dominant point, and principle of data collection and processing, are illustrated in this paper. Three existing buildings underwent one-year in situ research and measurement in order to collect quantitative data of their actual performance, and were assessed under the new rating system. The authors believe that the system will contribute to a more accurate and comprehensive understanding for assets holders and occupants, providing information on the extent to which a building’s energy efficiency has been achieved, as well as revealing the actual indoor environmental quality of the buildings. In addition, the outlook for the rating system was also discussed.

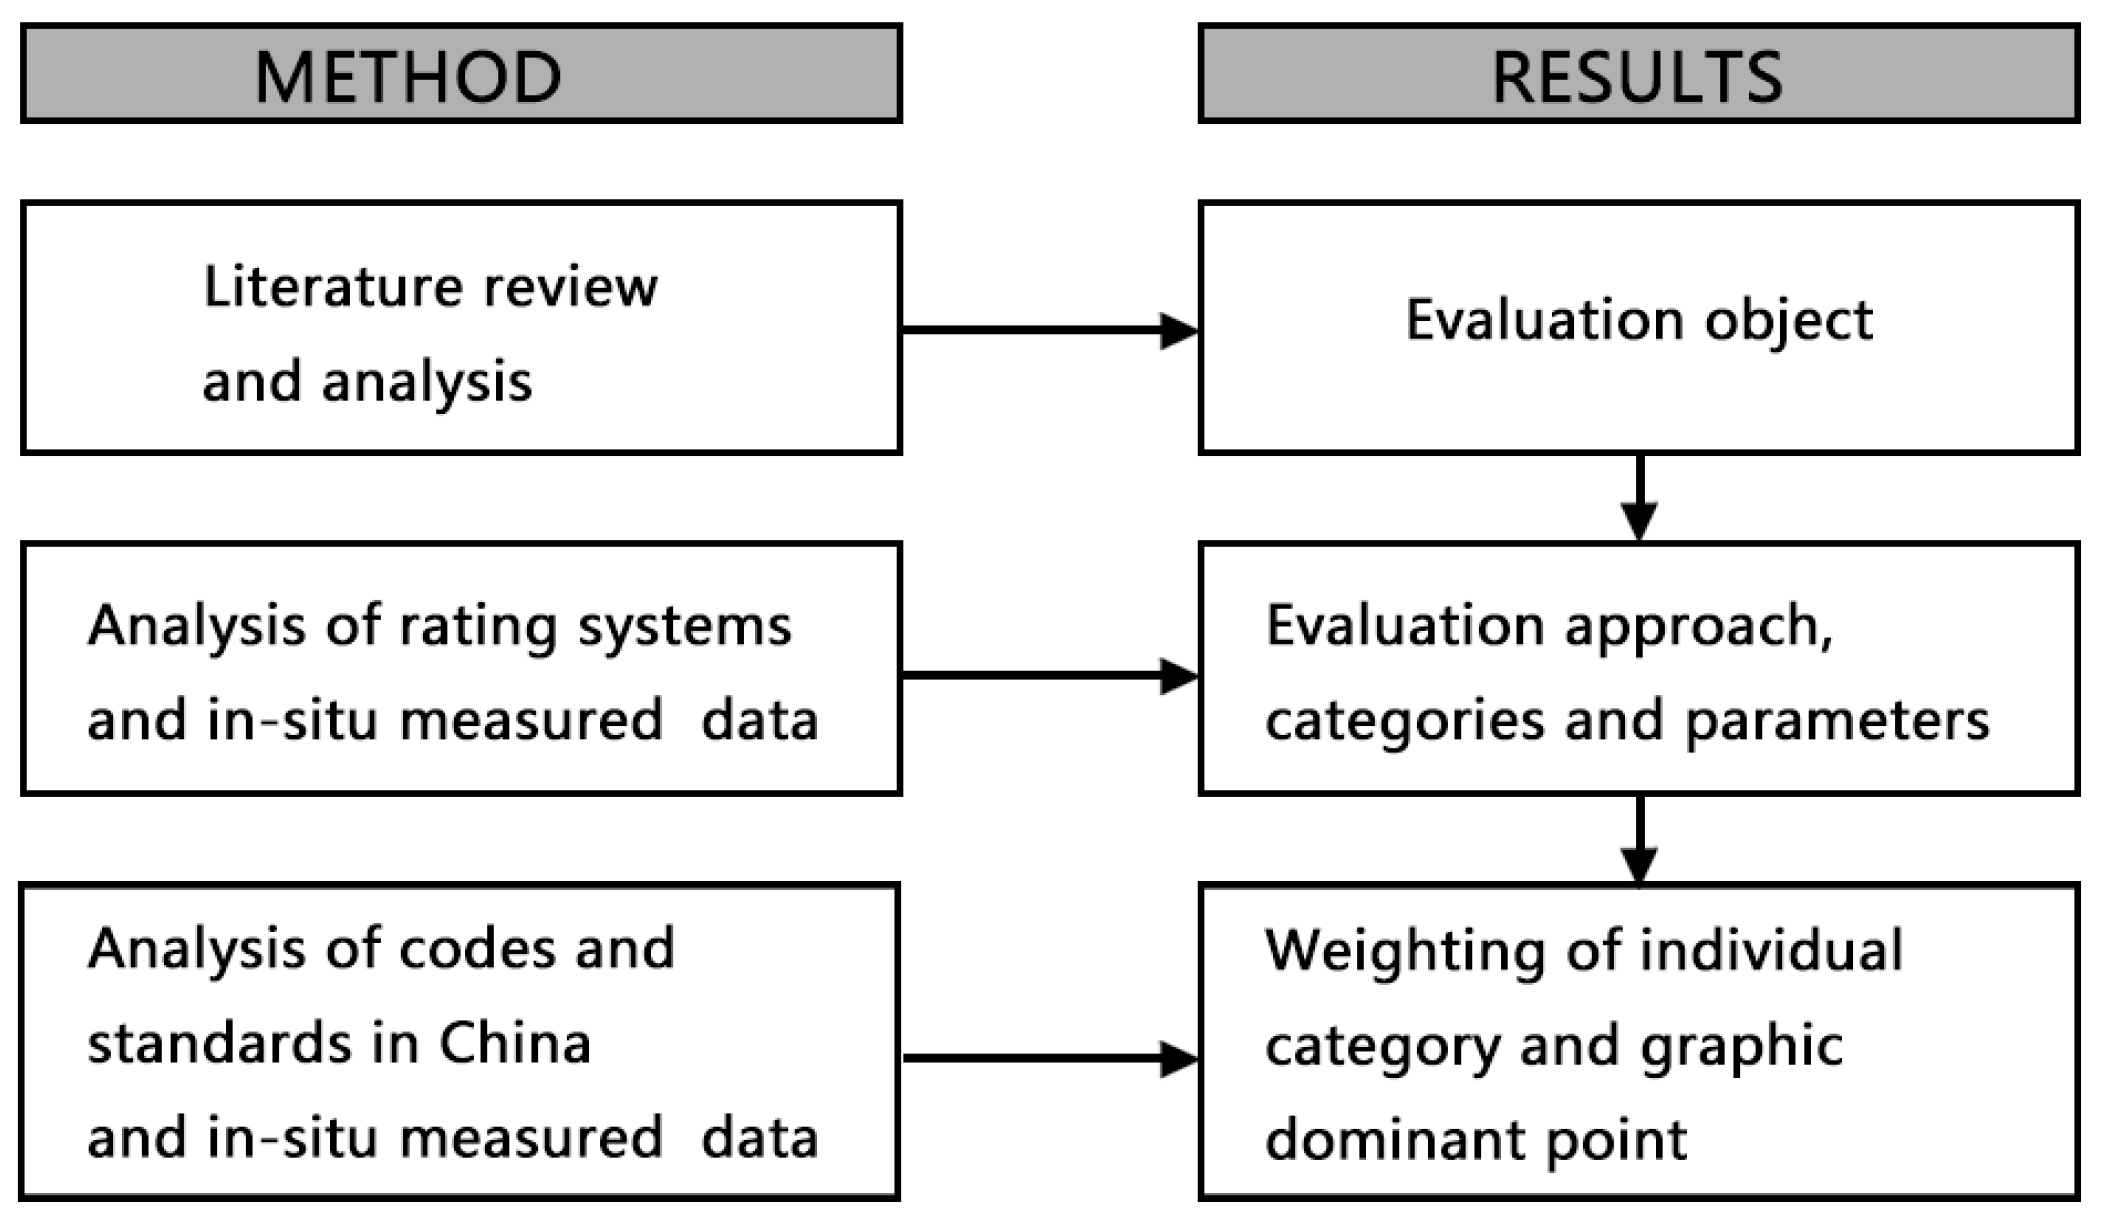
2. Description of the Rating System

2.1. Evaluation Object

Relevant rating systems such as BREEAM, LEED, and GBL, are usually divided into categories such as quality of the site, resource consumption, environmental loads, indoor comfort, quality of service, and social and economic aspects [25]. Those categories are the main concerns and comprise the evaluation objects within a system. The advantage of such a system is that they account for various factors, comprehensively. However, the disadvantage is that it’s too complicated. The authors believe that the main goal of rating systems is to reduce energy consumption and harmful impacts on environment, and that the development of buildings is intended to improve the comfort and health of the indoor environment. Thus, in this study, the evaluation object is limited to the building energy efficiency whose measurement parameter includes energy consumption and indoor environmental quality. Since the operation phase of a building has been reported to account for about 70%–98% of a building’s energy use and greenhouse gas emissions, depending on the building’s design and intended use [26,27], it is reasonable to assess a building’s sustainability by focusing on the building energy performance during its operational phase. Therefore, energy consumption and indoor environmental quality should be based on in situ measurement.
Almost all of the rating systems have been designed to suit a territory. Evidence suggests that existing rating systems were developed for different local purposes, and are not fully applicable to all regions [28]. China has a vast territory and complex terrain. Climate significantly varies in different areas, due to geographical latitude, terrain, and other conditions. So, for different climatic conditions, the building energy efficiency requires a corresponding different approach. In order to clarify the scientific relationship between architecture design and climate, the Ministry of Construction of China divides China into five main climatic zones, and puts forward different design guides for each zone. Table 1 shows the climatic classification and climatic characters for each zone. This study mainly focused on buildings in China’s cold zones, whose climate is characteristic of cold weather in winter and hot weather in summer, leading to a high energy consumption for heating and cooling. Various types of buildings differ in energy consumption and indoor environmental quality. Therefore, for the purpose of this study, the research designers only chose office buildings as a specific type for further research and assessment.

2.2. Evaluation Framework

The main purpose of this study is to develop a rating system for building energy efficiency, based on the actual performance of buildings during their operation phase. The stages of development are outlined in Figure 1.

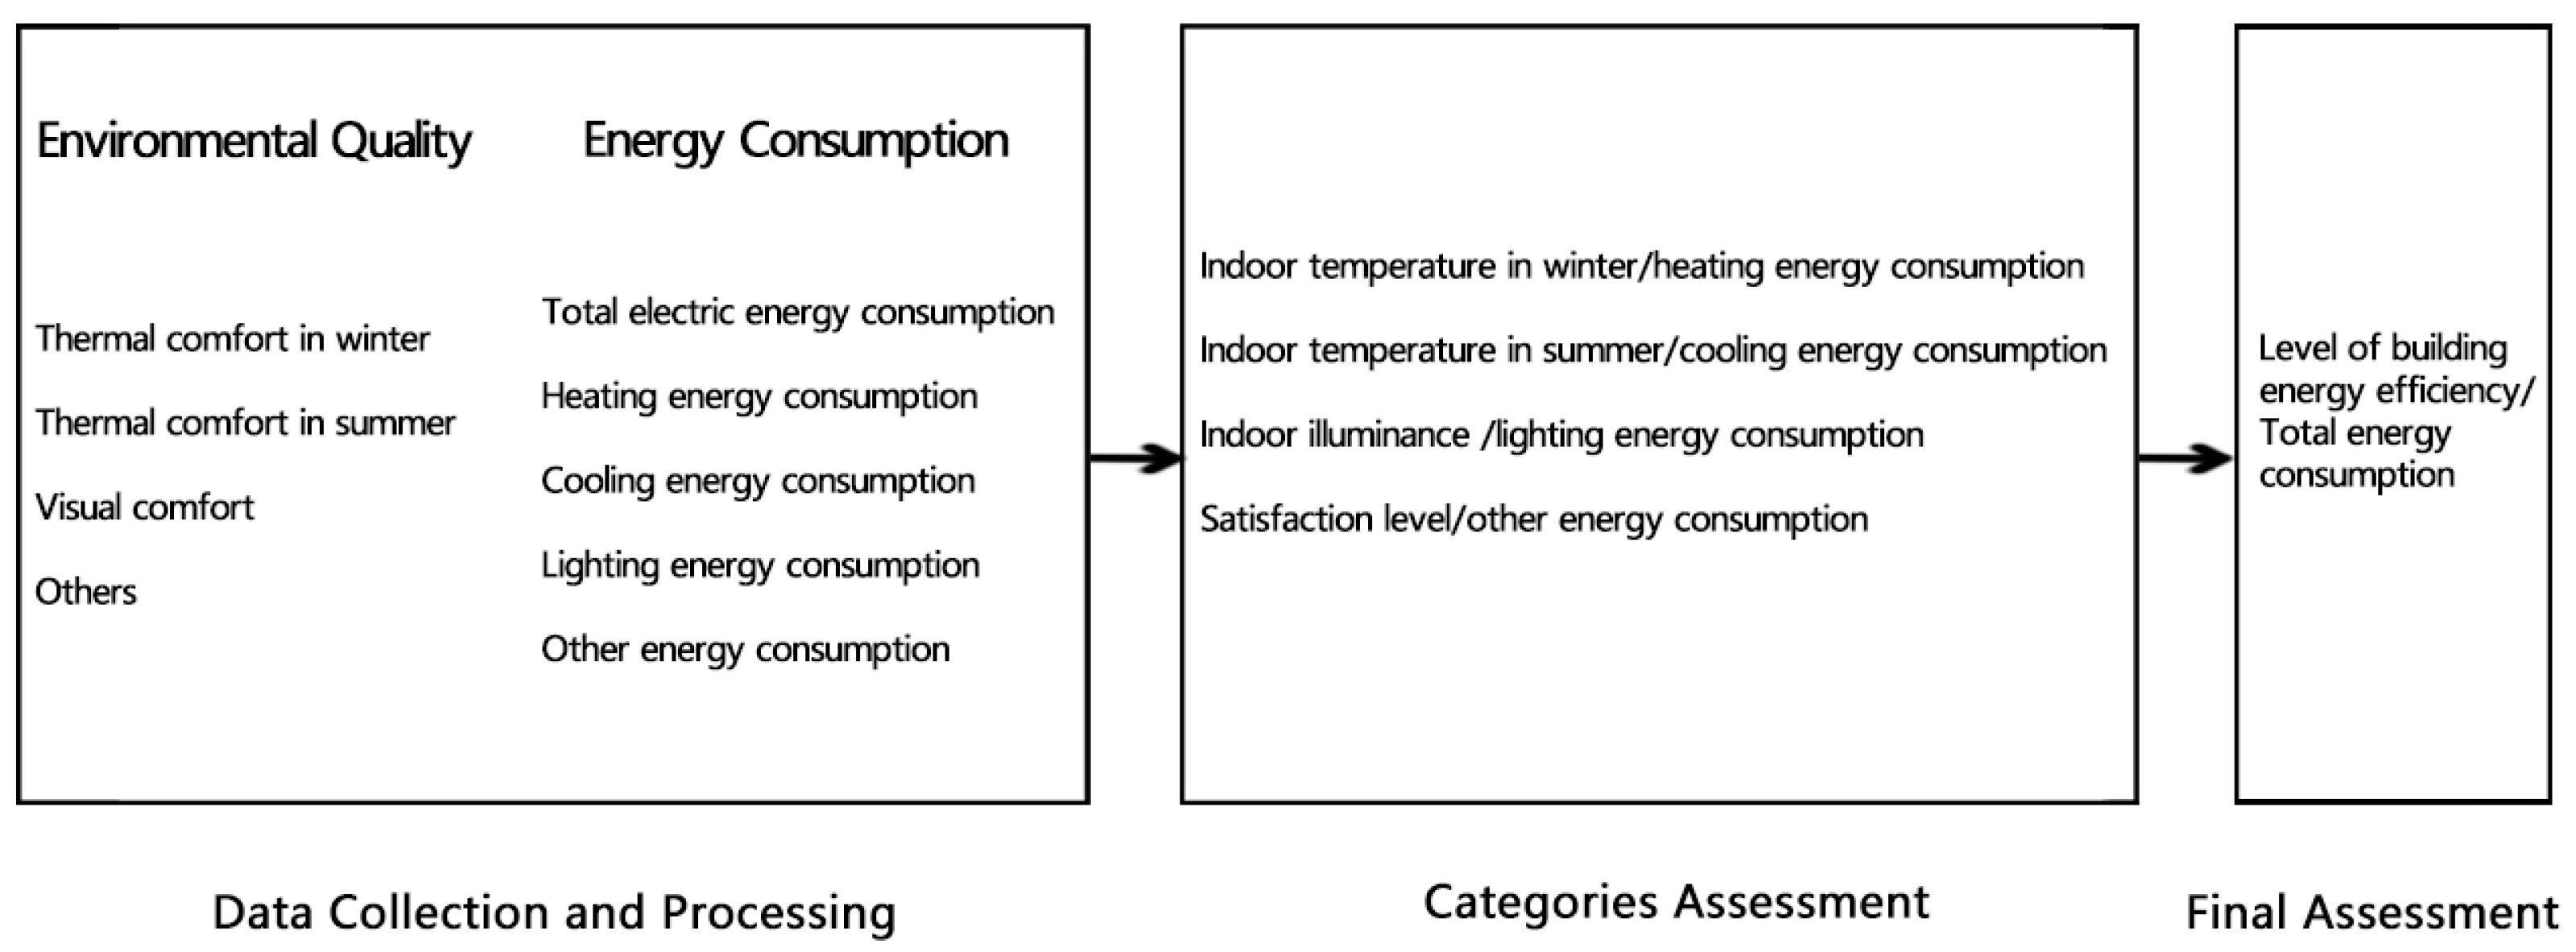
2.2.1. Development of Evaluation Framework

In the first stage, as illustrated in Figure 1, the authors defined the evaluation object of the rating system, through a literature review and analysis.
In the second stage, the authors analyzed the existing rating systems under an evaluation framework. Compared to other rating systems such as LEED, BREEAM, and GBL, CASBEE uses a different system for assessing sustainability performance. Rather than relying upon a simple additive approach, CASBEE introduced the concept of Building Environmental Efficiency (BEE), and divided the system into two aspects: Q and L (Figure 2). Q stands for the building’s environmental quality and L stands for the building’s environmental loads, which is the harmful impact caused by the construction and operation of buildings. These two aspects are integrated into a two-dimensional system. The final assessment of the results depends on the coefficient levels of Q and L.
The new rating system is focused on energy performance, as well as indoor environmental quality. Therefore, the two-dimensional system in CASBEE is chosen as a baseline for the rating framework, and modified (Figure 3) The rating result depends on two aspects of the building’s performance. (Q/L)t stands for the building energy efficiency level and L stands for the total energy consumption. The author used L (total energy consumption) as a control parameter to prevent the possibility of increasing the total burden on the environment in the new rating system, in order to improve indoor environmental quality in the category rating.
The systems are divided into four categories and every category is rated under a Q/L system. For office buildings, the authors believe that the key indoor environmental qualities affecting the occupants’ feelings, health, and productivity, are thermal comfort, lighting and visual comfort, and other factors, including air quality, acoustic comfort, convenience, and maintenance of the building’s appliances, hot water supply, etc., which are related to energy consumption. According to the statistics, in China’s cold zone, the building energy consumption of office buildings consists mainly of heating energy consumption in winter, cooling energy consumption in summer, artificial lighting energy consumption, and other energy consumption which includes power equipment energy consumption (for elevators, fans, etc.), socket-equipment energy consumption (for daily office devices), and hot water production energy consumption, etc. [29].
The indoor air temperature, relative humidity, and indoor illumination are much more related to energy consumption. So, the data of the three is collected through in situ measurement, during the operational phase. Other indoor environmental qualities are measured through subjective questionnaires. Thermal comfort is measured by air temperature, indoor wind velocity, and relative humidity. In this study, the author took indoor air temperature as a parameter to measure the thermal comfort. In this paper, summer represents the period when the cooling system is occupied; winter represents the period when the heating system is occupied.
Therefore, the four categories consist of indoor temperature in winter/heating energy consumption, indoor temperature in summer/cooling energy consumption, indoor illumination/lighting energy consumption, and the satisfaction level/other energy consumption. Each category is assigned a score on a scale of 1 (excellent) to 7 (poor) (Figure 4). The evaluation framework and process of the rating system are shown in Figure 5.

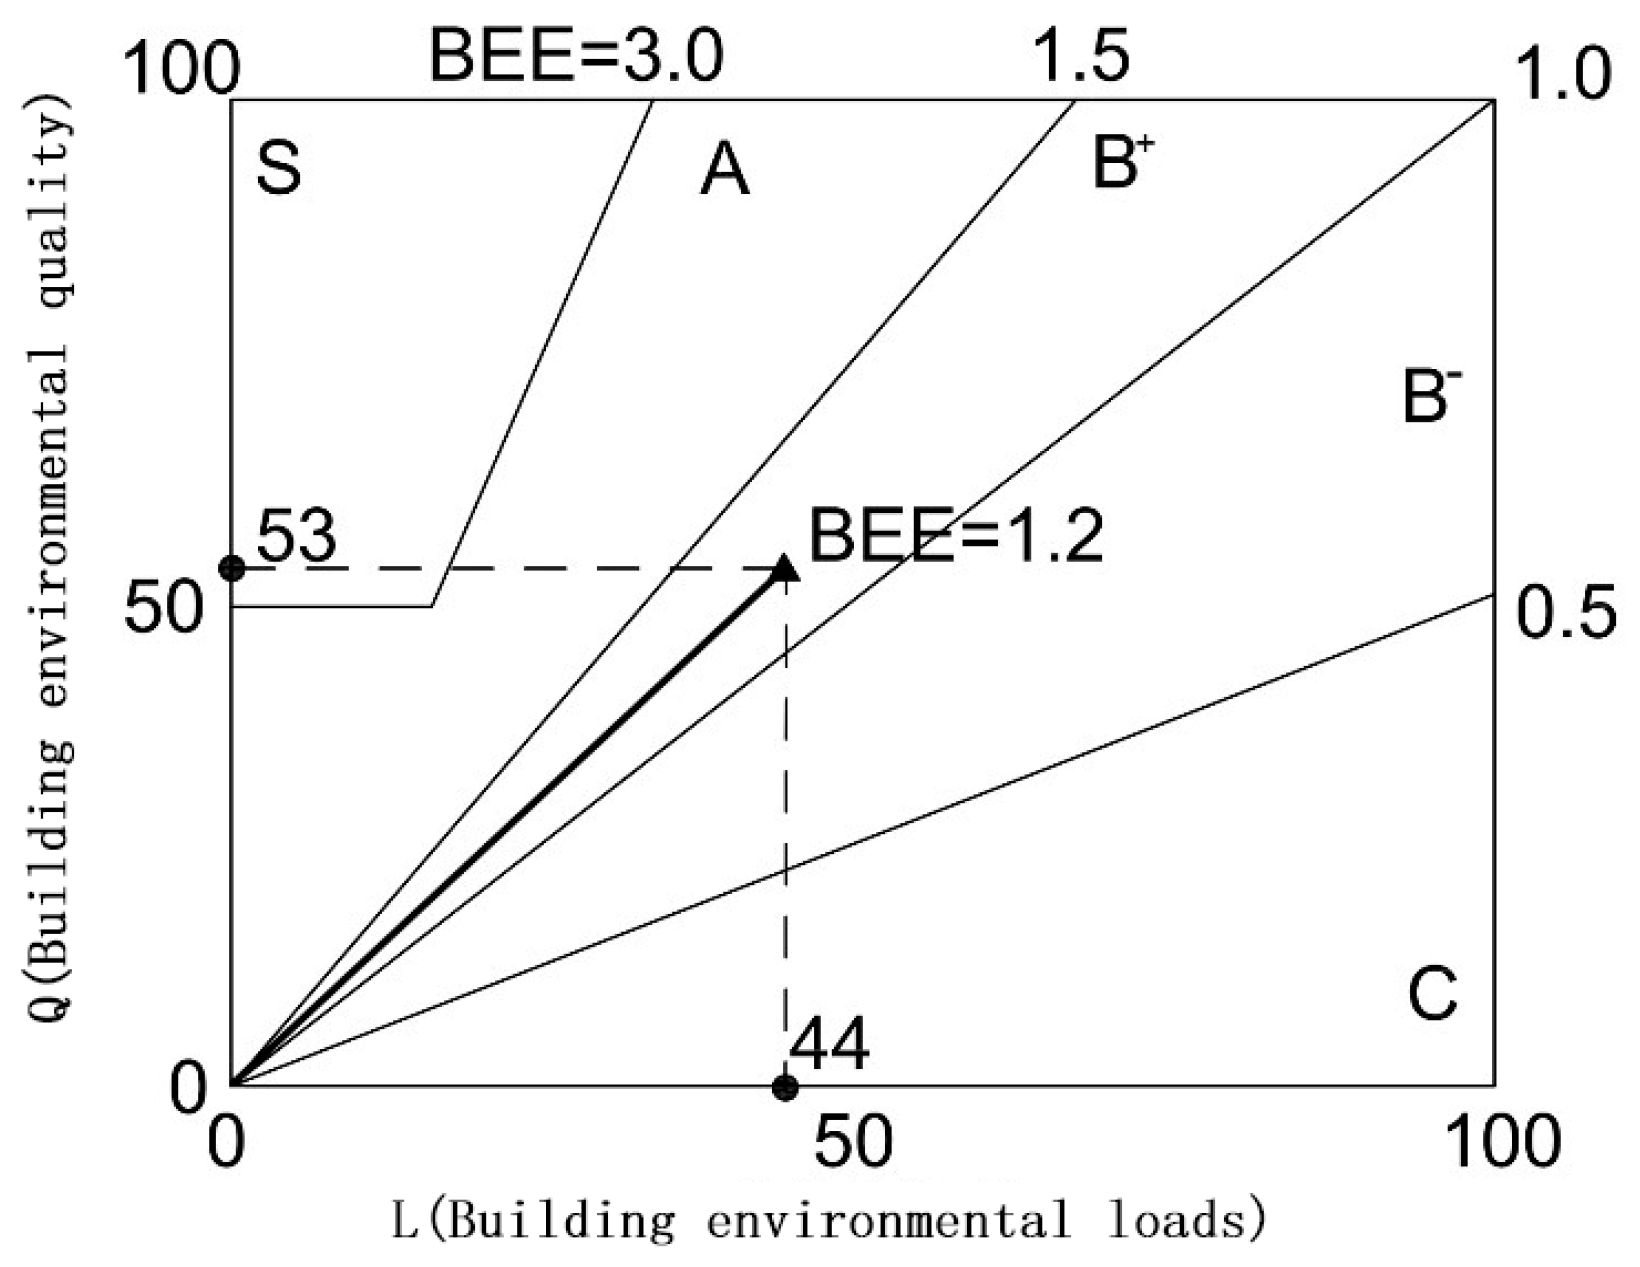
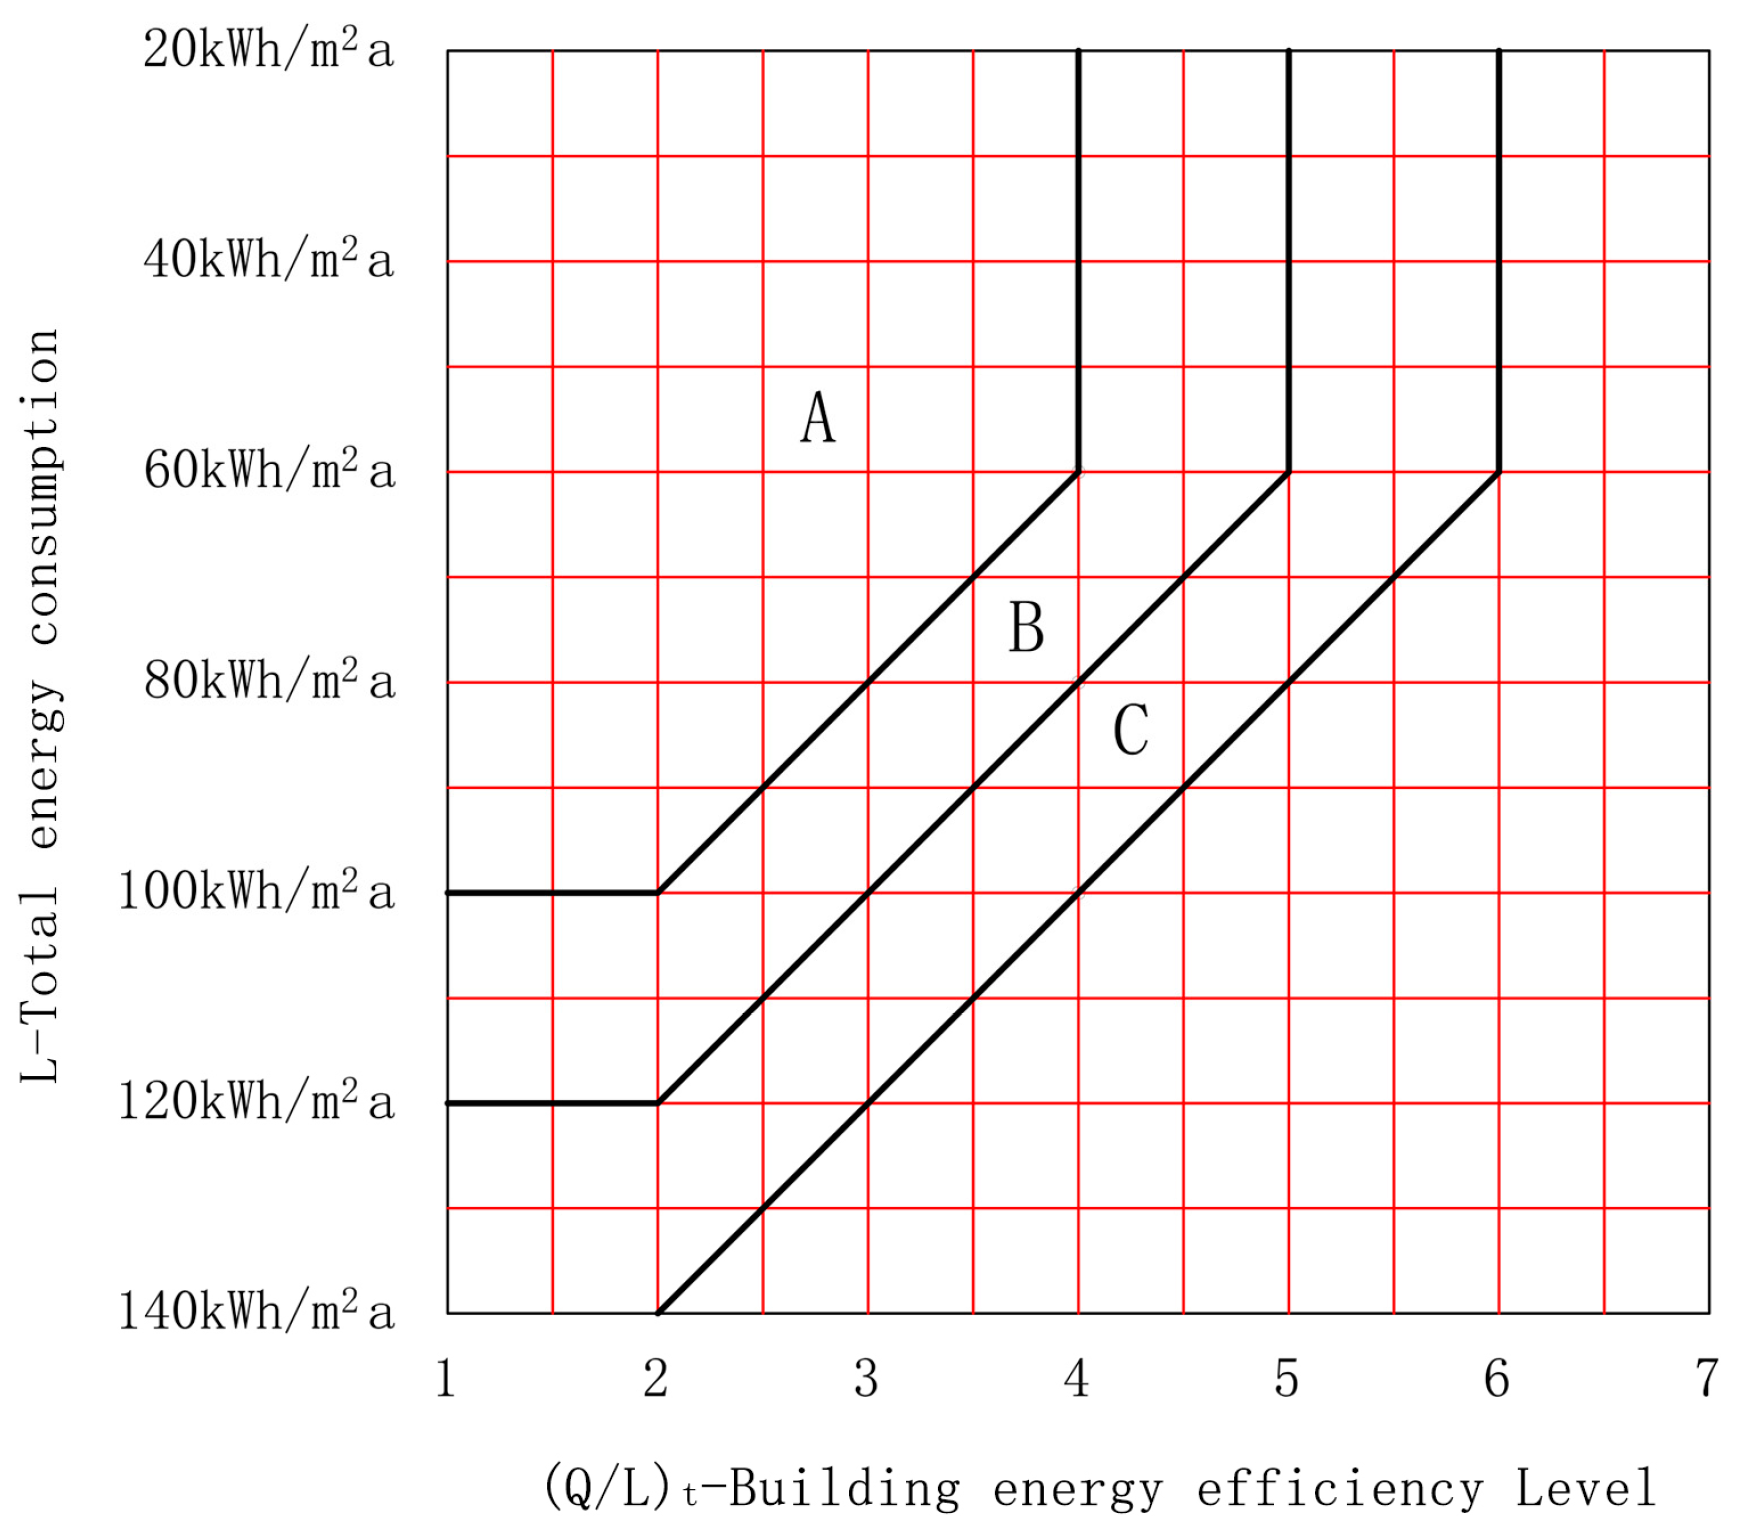
2.2.2. Determination of Weighting and Graphic Dominant Point

In the third stage, after analyzing the codes, standards in China [30,31,32], and in-situ data, the authors define the weighting of categories and the graphic dominant point.
The final rating result depends on two parameters: (Q/L)t (building energy efficiency level) and L (total energy consumption). The rated building is placed on a scale from A (good) to C (poor), and if the performance of a rated building is worse than a C building, it won’t be certified (Figure 3). The score of (Q/L)t is calculated as the sum of the scores obtained from each category, with corresponding weighting. According to relevant statistics of the data from office buildings in China’s cold zone, heating energy consumption, cooling energy consumption, lighting energy consumption, and other consumption, account for 40%, 20%, 10%, and 30% of the total energy consumption, respectively [30,31]. Therefore, the weightings of the four categories are set as 0.4, 0.2, 0.1, and 0.3, respectively (Equation (1)).
(Q/L)t = 0.4 × (Q/L)h + 0.2 × (Q/L)c + 0.1 × (Q/L)i + 0.3 × (Q/L)s
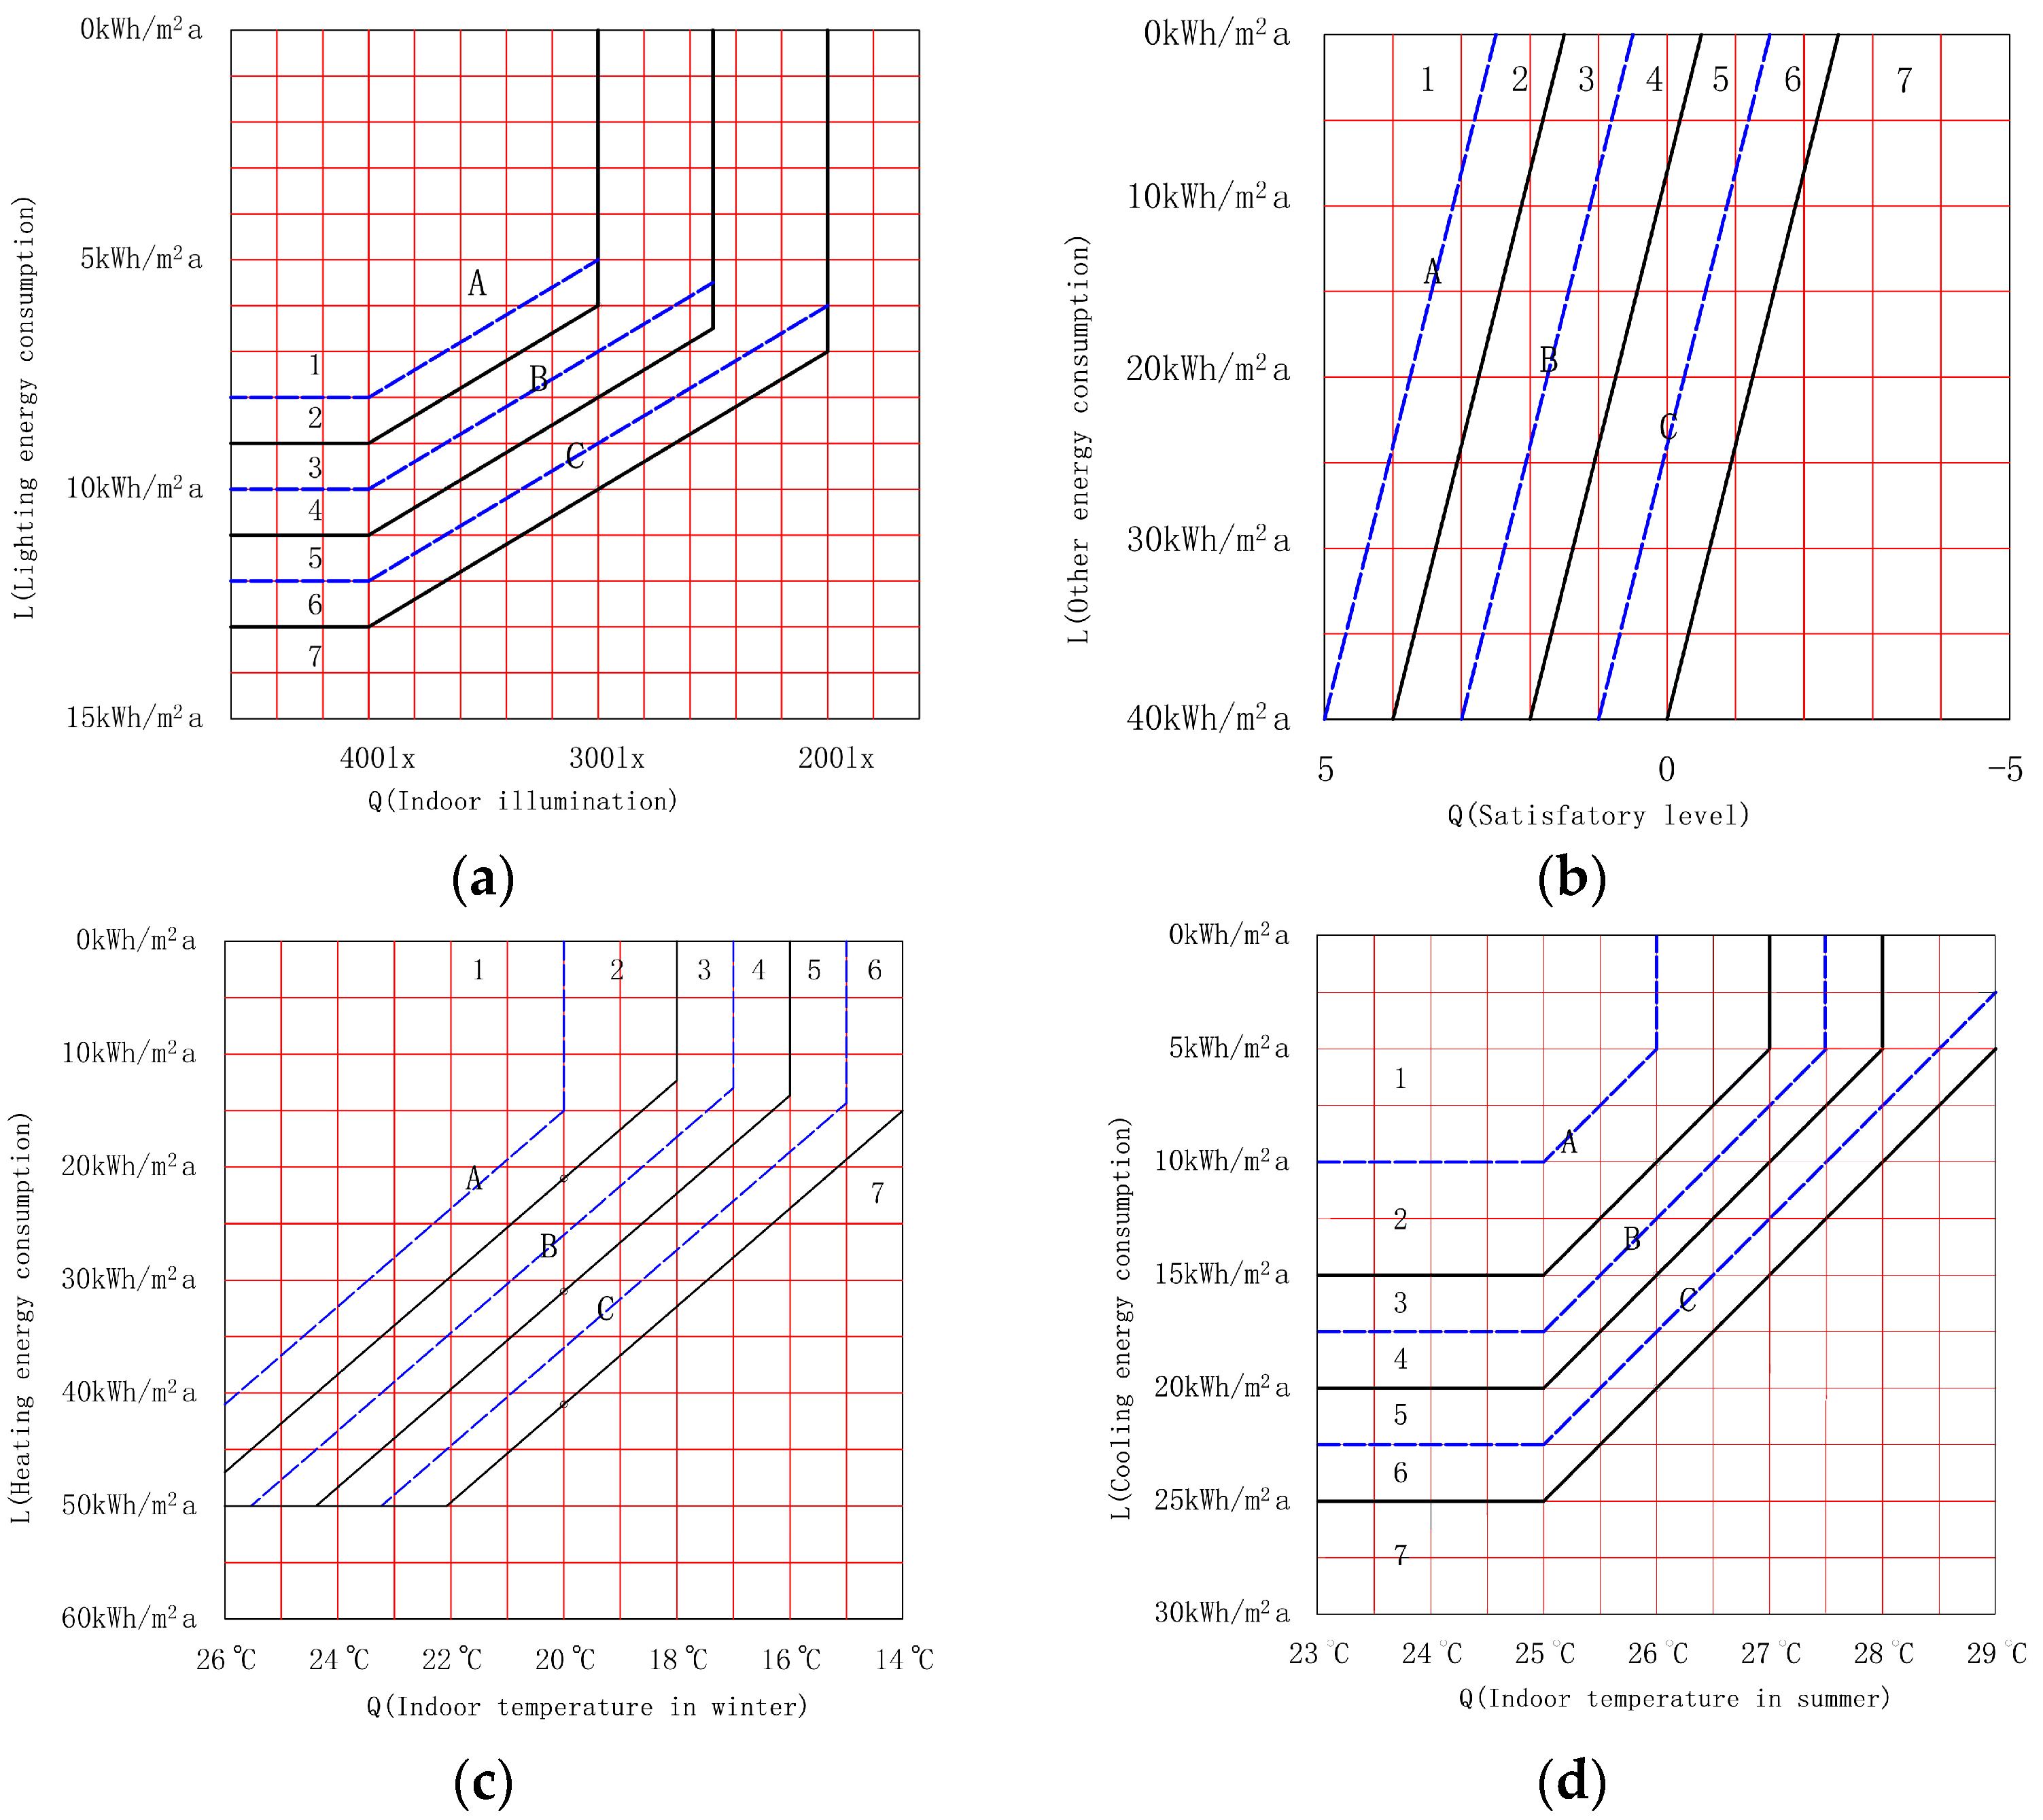
  • (Q/L)h—Score of indoor temperature in winter/heating energy consumption rating
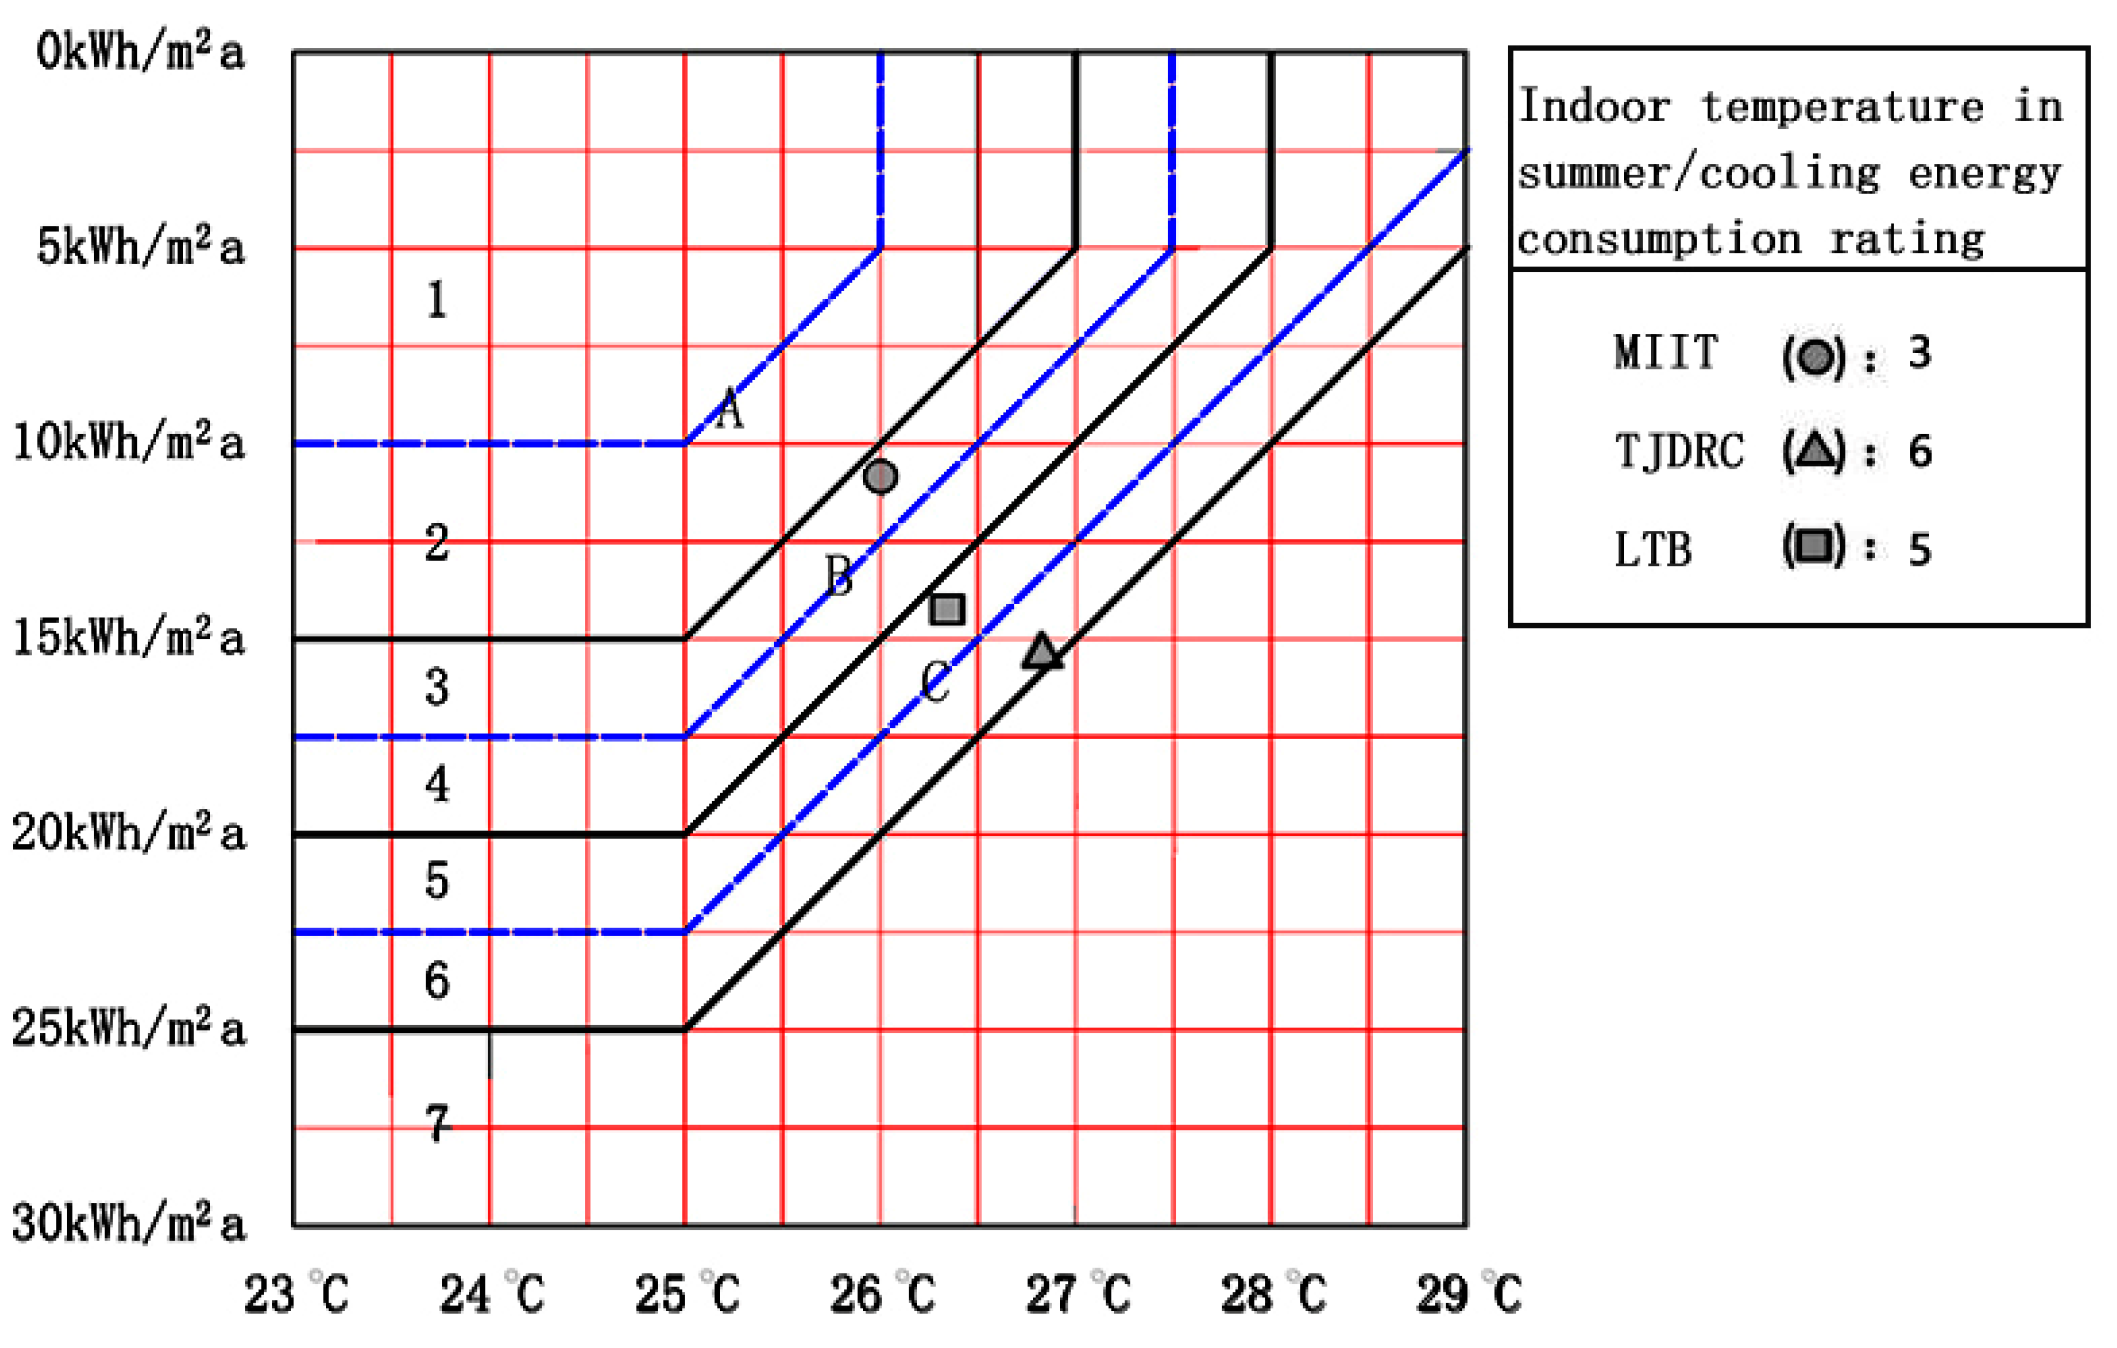
  • (Q/L)c—Score of indoor temperature in summer/cooling energy consumption rating
  • (Q/L)i—Score of indoor illumination/lighting energy consumption rating
  • (Q/L)s—Score of satisfactory level/other appliance consumption rating
  • (Q/L)t—Building energy efficiency level
The graphic dominant point of the diagrams is the basis of establishing a quantitative Q/L system rating. The values of Q and L of the graphic dominant point differ, according to the type of buildings and the climatic zone. Through referring to China’s “Building Energy Standards” literature review and the result of in situ measurement, the graphic dominant point of each diagram can be identified, and thus the quantitative system of evaluation is established.
In this study, the graphic dominant points depend on the relevant standard values of indoor environmental quality and energy consumption, in individual categories. According to the architectural design code [10,11], the authors set the values for indoor environmental qualities: standard indoor temperature in winter value is 20 °C, standard indoor temperature in summer is 26 °C, and standard indoor illumination value is 300 lx [9,31]. Table 2 and Table 3 show the heating energy consumption and non-heating energy consumption standard of a state institution office building in the Beijing region. The mandatory value and suggested value are stipulated in the standard, and an average value can be calculated and listed as the median value.
According to Table 2 and Table 3, and recent studies and analyses of literature [30,31,32], values for heating energy consumption, cooling energy consumption, lighting energy consumption, and other energy consumption of office buildings, are determined and shown in Table 4. Thus, the graphic dominant point of each diagram can be determined. The authors then defined the diagram in Figure 4, based on the graphic dominant point, reference to the relevant literature and study in China [11,32], and their experience of green building design.

2.3. Data Collection and Processing

Indoor environmental quality data is mainly collected through a temperature and illumination recording machine placed in monitoring points, and a subjective questionnaire. Temperature and illumination data are recorded through a natural year. TPJ-22 machines were used to record indoor illumination. Their measuring range is 0–20,000 lx and precision is ±5 lx. DT-171 machines were used to record indoor air temperature. Their measuring range is −40–70 °C and precision is ±1 °C. So, the indoor temperature in winter, indoor temperature in summer, and illumination of the building in working hours, can be collected. The principle of data collection is listed as follows. (1) The arrangement of monitoring points for temperature recording requirements: temperature monitoring points are distributed every 2000 m2, the number of monitoring points of each story is not less than four, and the number of monitoring points in an office area and public area (the atrium, corridor, etc.) conforms to a ratio of 3:1; (2) The arrangement of monitoring points for illumination requirements: an illumination point is distributed every 1000 m2 in an office area, and the number of monitoring points of each story is not less than two. The location of measuring points should be set in the office area at the height of the working plane, 1.5 m away from the exterior wall with windows; (3) Subjective questionnaire arrangement requirements: more than 50 effective subjective questionnaires should be collected for each rated building, and the object of the questionnaire should be chosen randomly, covering occupants who work in different areas within the building. The occupants were given a questionnaire which contained two parts: one for basic information of the person and one for the questions on satisfaction levels of the indoor environmental qualities. There were 12 questions in the latter part and related to the air quality, acoustic comfort, general feeling of the indoor environment, convenience of the building device, convenience and maintenance of the building, and hot water supply, which are related to other energy consumptions mentioned in Section 2.2.1. The scores of those questions are assigned on a scale of −5 (unsatisfactory) to 5 (satisfactory), and all of the questions have the same weighting. The indoor temperature in winter is the average indoor temperature of each monitoring point during winter. The indoor temperature in summer is the average indoor temperature of each monitoring point during summer. The indoor illumination is the average indoor illumination of each monitoring point during working hours (9 a.m.–6 p.m.) in a whole year.
Office buildings in China’s cold zones are heated by a central heating system in winter, so heating energy consumption can be recorded by the heat flow meter installed in rated buildings, or the data provided by the district central heating station. The cooling of office buildings in the summer is supported by a central air-conditioning system whose energy consumption can be recorded through an electricity meter. The lighting energy consumption can be recorded through an electricity meter. Other energy consumption can be obtained by subtracting the cooling energy consumption and the lighting energy consumption from the total electricity consumption, which is recorded by the electricity meter. Therefore, the building’s total energy consumption is the sum of the total electricity consumption, plus the heating energy consumption.

3. Rating Results and Discussion

Three existing office buildings underwent one-year of in situ research and measurement, in order to collect quantitative data on their actual performance and analysis under the new rating system. Table 5 shows the basic information of the rated buildings. The considerations for selection were: (1) the three projects are comparable in location, MIIT (Ministry of industry and information technology of PRC) is located in Beijing and the other two —TJDRC (Tianjin Development and Reform Commission) and LTB (Local Taxation Bureau of Nankai District)—in Tianjin, and both cities are cold zones in China’s climatic partition; (2) the three buildings are all office buildings which house the government agency, just in different scales and sizes.
According to the data collection principle mentioned in this article, the authors obtain the annual data of energy consumption for heating, air conditioning, illumination, and total power consumption, and total energy consumption, as well as the average indoor temperature in winter and summer, indoor illumination, and other environmental qualities, based on a subjective evaluation. The data is shown in Table 6.

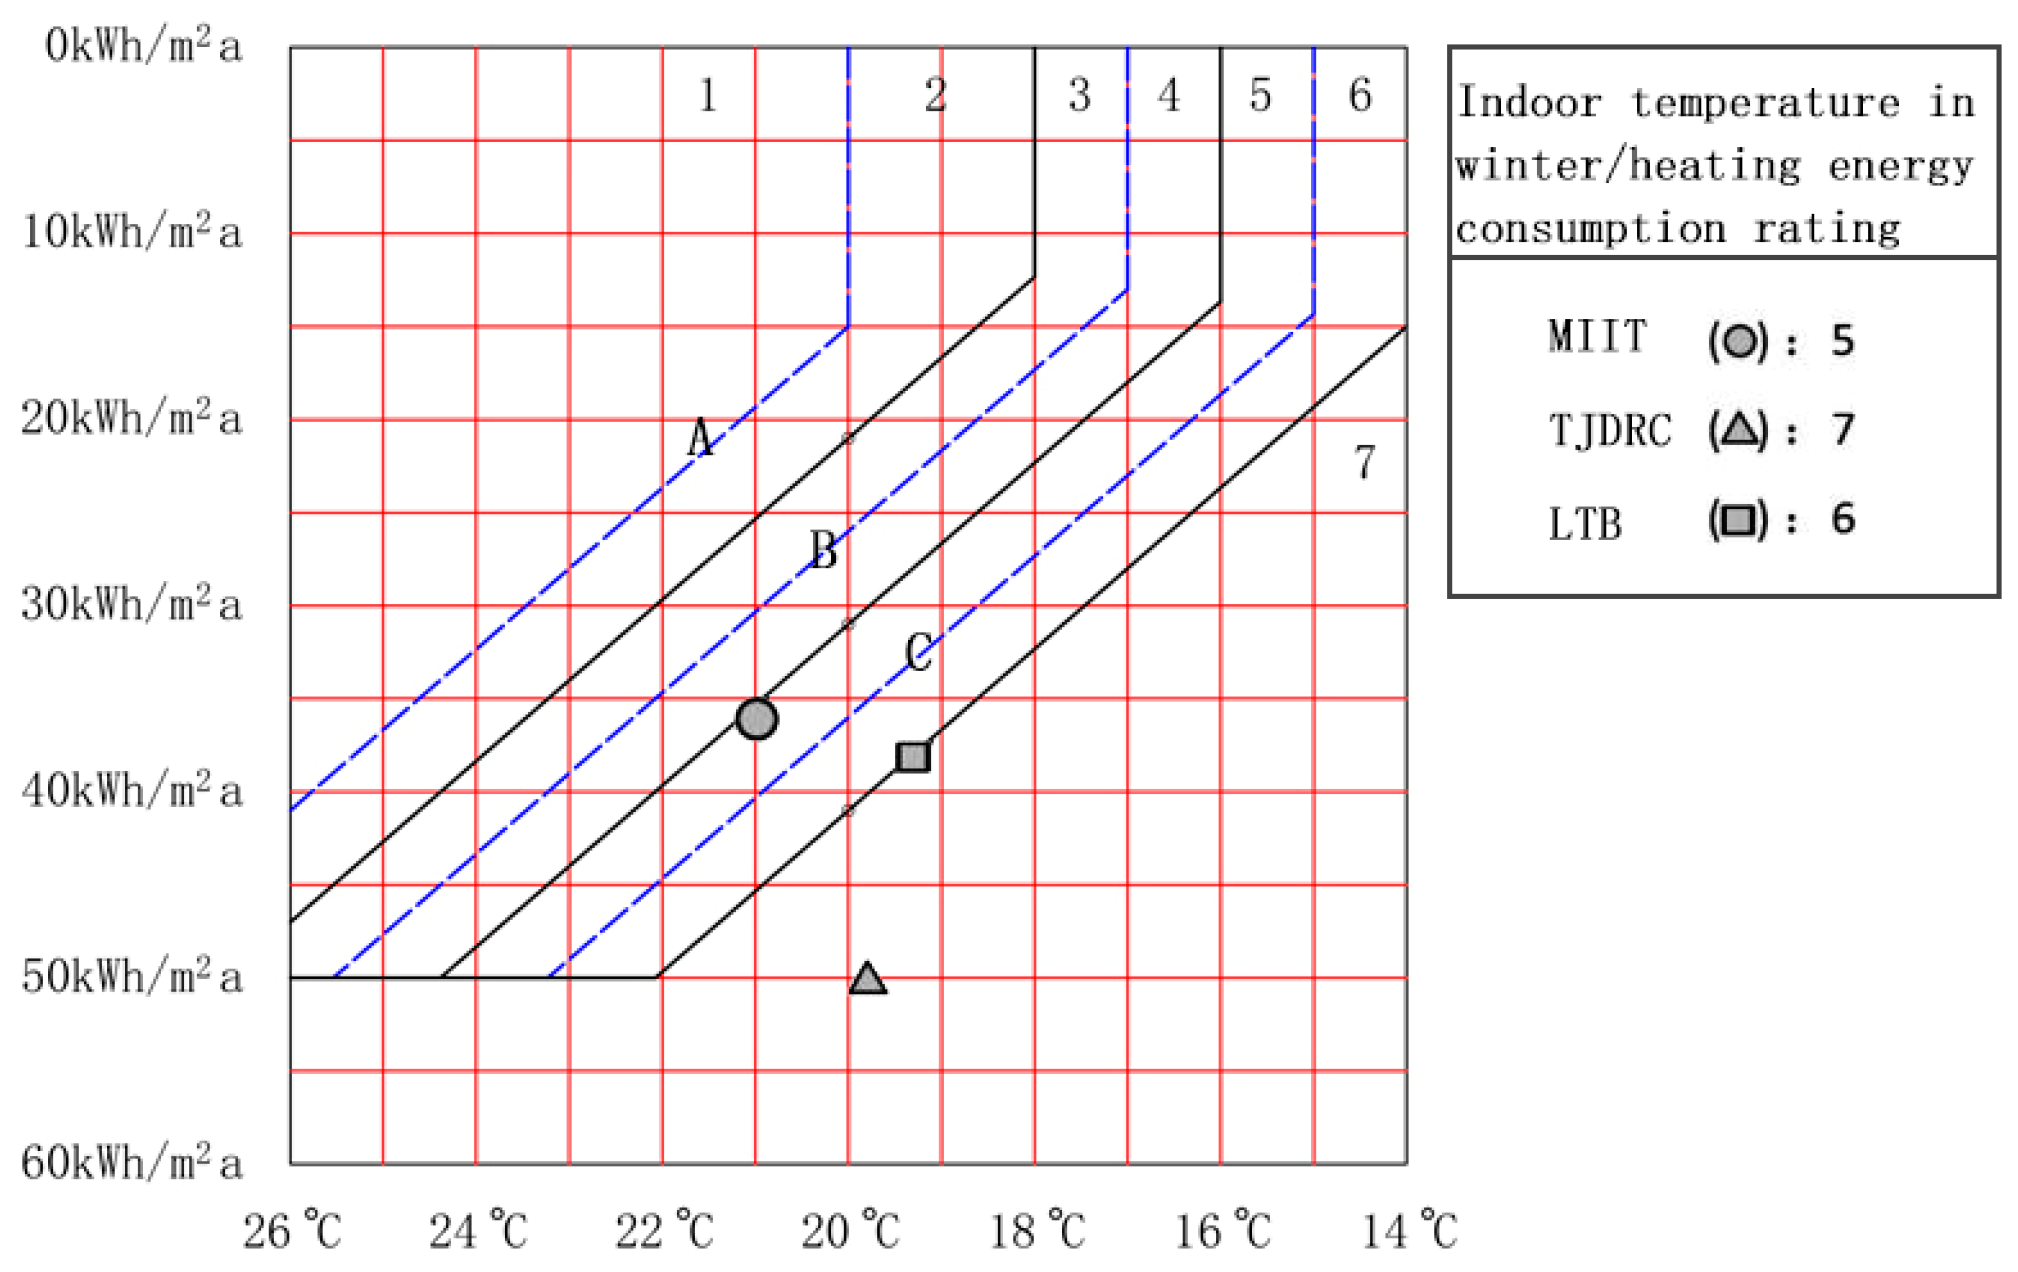
3.1. Indoor Temperature in Winter/Heating Energy Consumption Rating

The indoor temperature in winter/heating energy consumption rating results of the three buildings are shown in Figure 6. The heating energy consumption of MIIT is 36.0 kWh/m2a, indoor temperature in winter is 21.0 °C, and the score is 5 (very close to 4). The indoor temperature is higher than the recommended design temperature, of 20.0 °C. Thus, there is a potential for the score of MIIT to be improved to 4, if the heating supply and the time of window-opening are reduced, leading to a reduction in heating energy consumption. The heating energy consumption of LTB is 38.0 kWh/m2a, indoor temperature in winter is 19.2 °C, and the score is 6. The thermal comfort of LTB is close to that of MIIT, but the energy consumption of LBT is much higher than that of MIIT, so the score of LBT is much worse than MIIT. The heating energy consumption of TJDRC is 50.0 kWh/m2a, indoor temperature in winter is 19.8 °C, and the score is 7, which is the worst of the three. The construction of TJDRC was completed in 1997, when the codes for the performance of buildings were not as strict as today. In order to maintain a comfortable indoor temperature in winter, the heating energy consumption must be very high. Also, there is little possibility of improving the rating score of TJDRC through optimizing the operation of buildings and the habits of its occupants.

3.2. Indoor Temperature in Summer/Cooling Energy Consumption Rating

The indoor temperature in summer/cooling energy consumption rating results of the three buildings are shown in Figure 7. The cooling energy consumption of MIIT is 10.8 kWh/m2a, indoor temperature in summer is 26.0 °C, and the score is 3. The thermal comfort of MIIT is good, and the energy consumption of cooling is low, so the overall score of MIIT is good. There is a possibility that the rating of MIIT can be improved to 2, if the natural ventilation time (especially at night) is prolonged, leading to reduction in the cooling energy consumption. The cooling energy consumption of TJDRC is 16.0 kWh/m2a, indoor temperature in summer is 26.8 °C, and the score is 6. The thermal comfort of TJDRC is close to that of MIIT, but the cooling energy consumption is much higher than that of MIIT, thus the score of TJDRC is worse than MIIT, by 2 points. The cooling energy consumption of LTB is 14.0 kWh/m2a, indoor temperature in winter is 26.4 °C, and the score is 5.

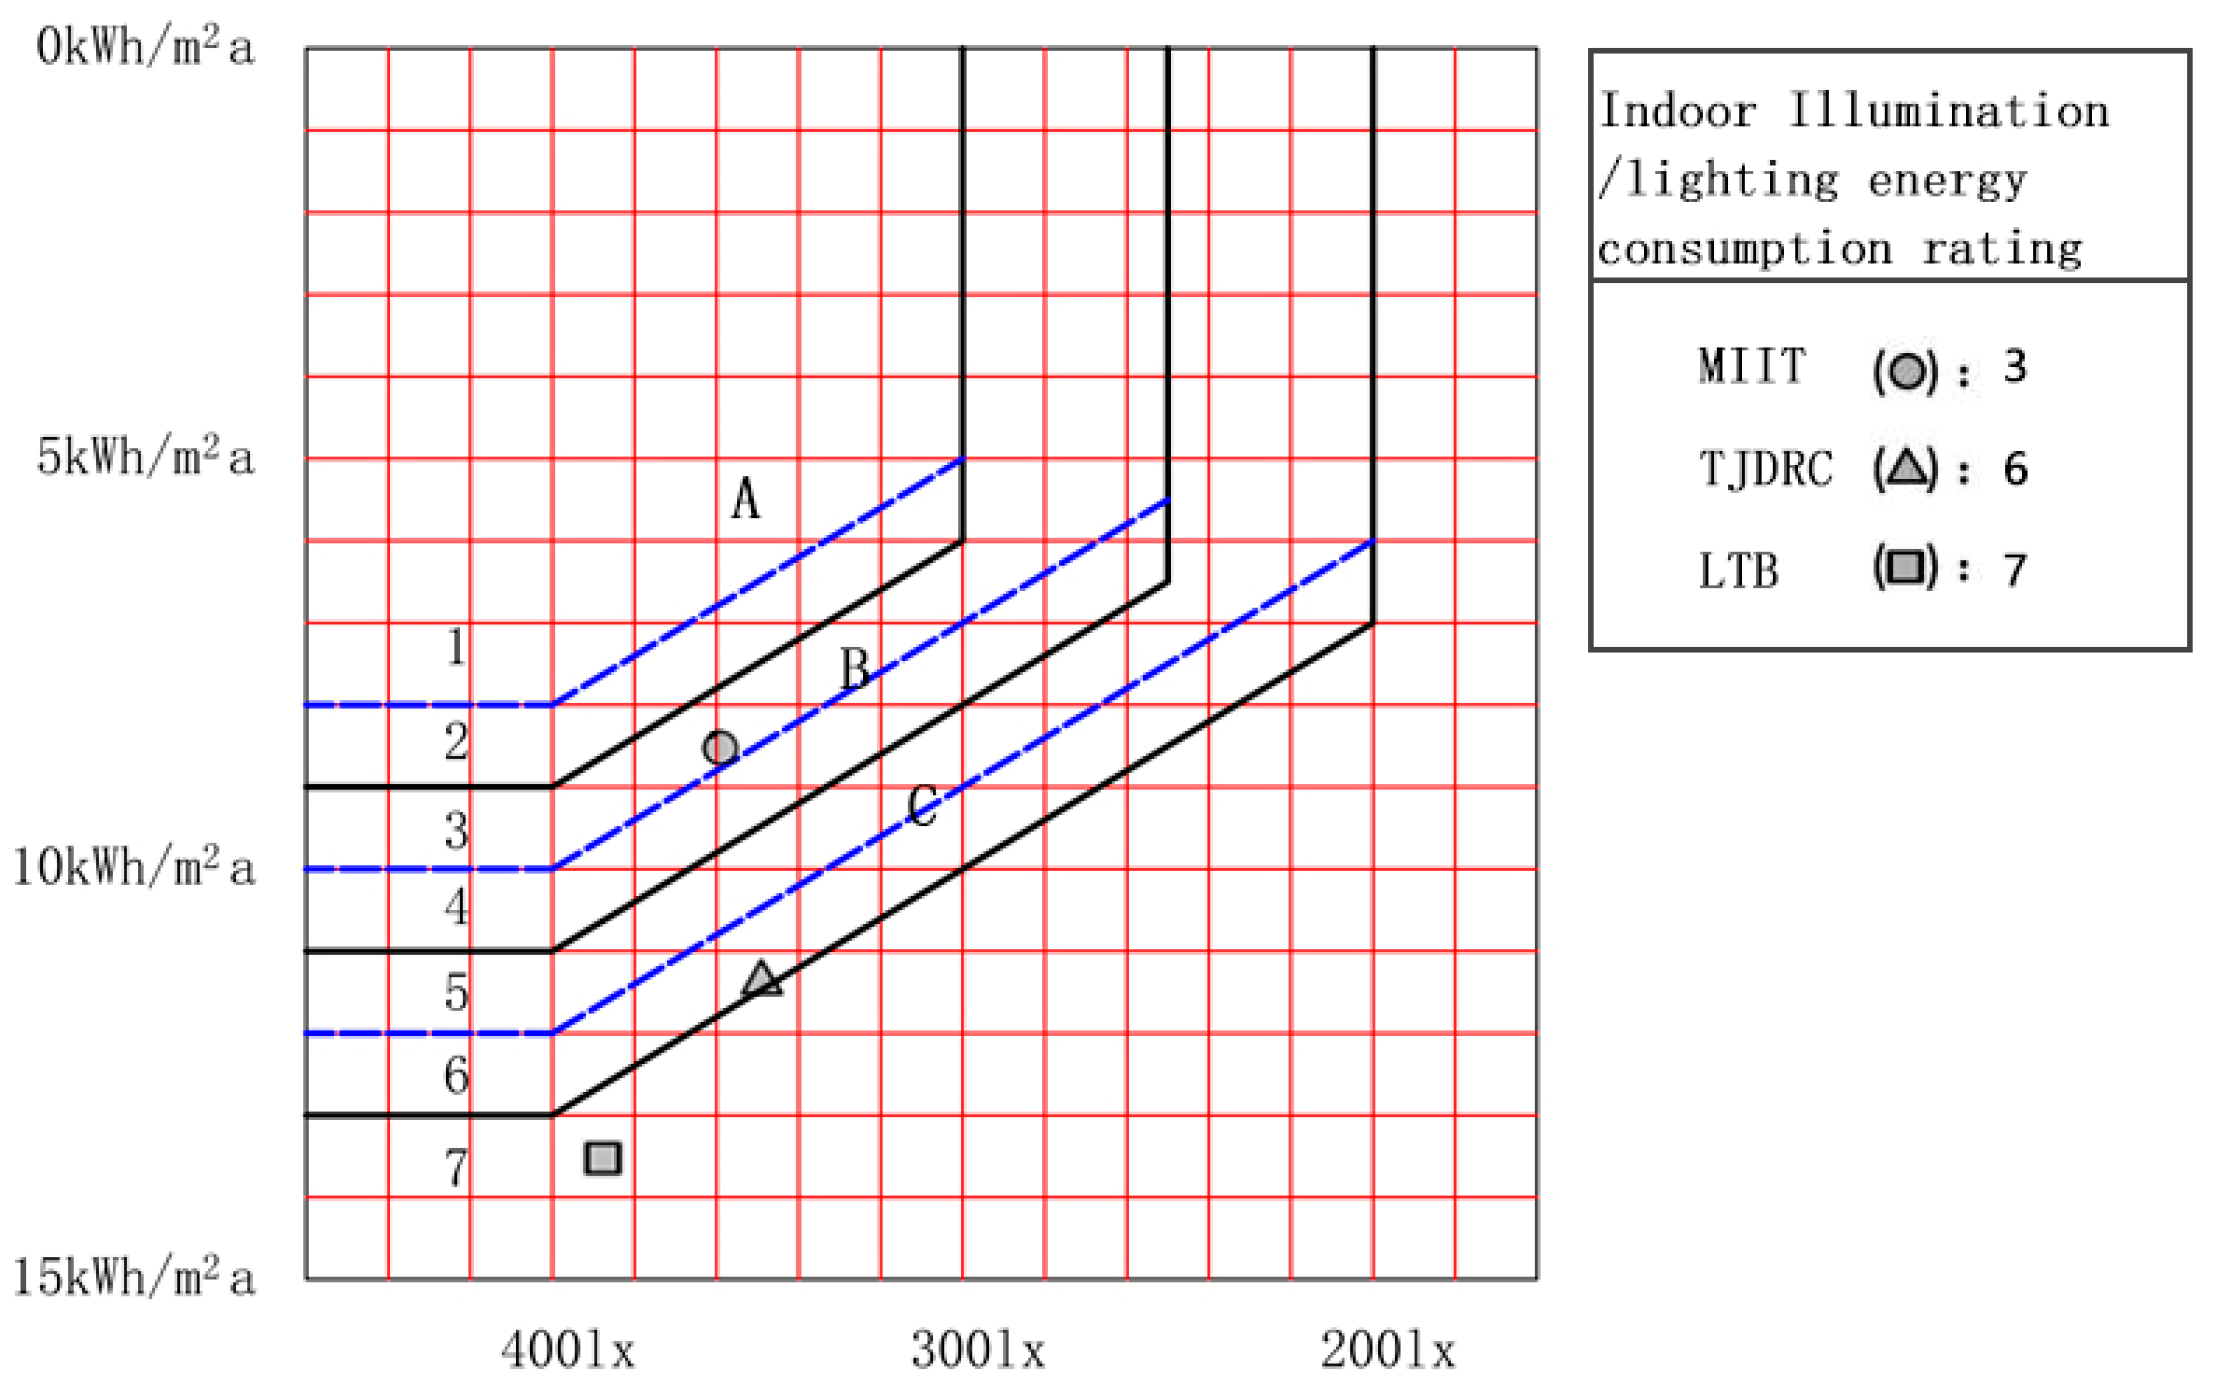
3.3. Indoor Illumination/Lighting Energy Consumption Rating

The indoor illumination/lighting energy consumption rating results are illustrated in Figure 8. The indoor illumination of MIIT is 360 lx, lighting energy consumption is 8.5 kWh/m2a and the score is 3. The indoor illumination of MIIT is comfortable and energy consumption is low. The rational layout design of MIIT, which provides an abundance of natural light, and the usage of energy saving lighting facilities, both contribute to lower lighting energy consumption. Thus, the rating result of MIIT is good. The indoor illumination of TJDRC is 350 lx, lighting energy consumption is 11.3 kWh/m2a and the score is 6. Although the indoor illumination of TJDRC is close to that of MIIT, its lighting energy consumption is much higher. So, the score is worse than MIIT, by 3 points. The indoor illumination of LTB is 390 lx, lighting energy consumption is 13.5 kWh/m2a, and the score is 7. The compact layout design and rich depth of LTB leads to bad natural lighting. The occupants of LTB are used to utilizing artificial lighting during the daytime to maintain a comfortable working environment, so the lighting energy consumption is higher than the other two. Optimizing the lighting facilities in LTB is unlikely to reduce energy consumption to a reasonable level.

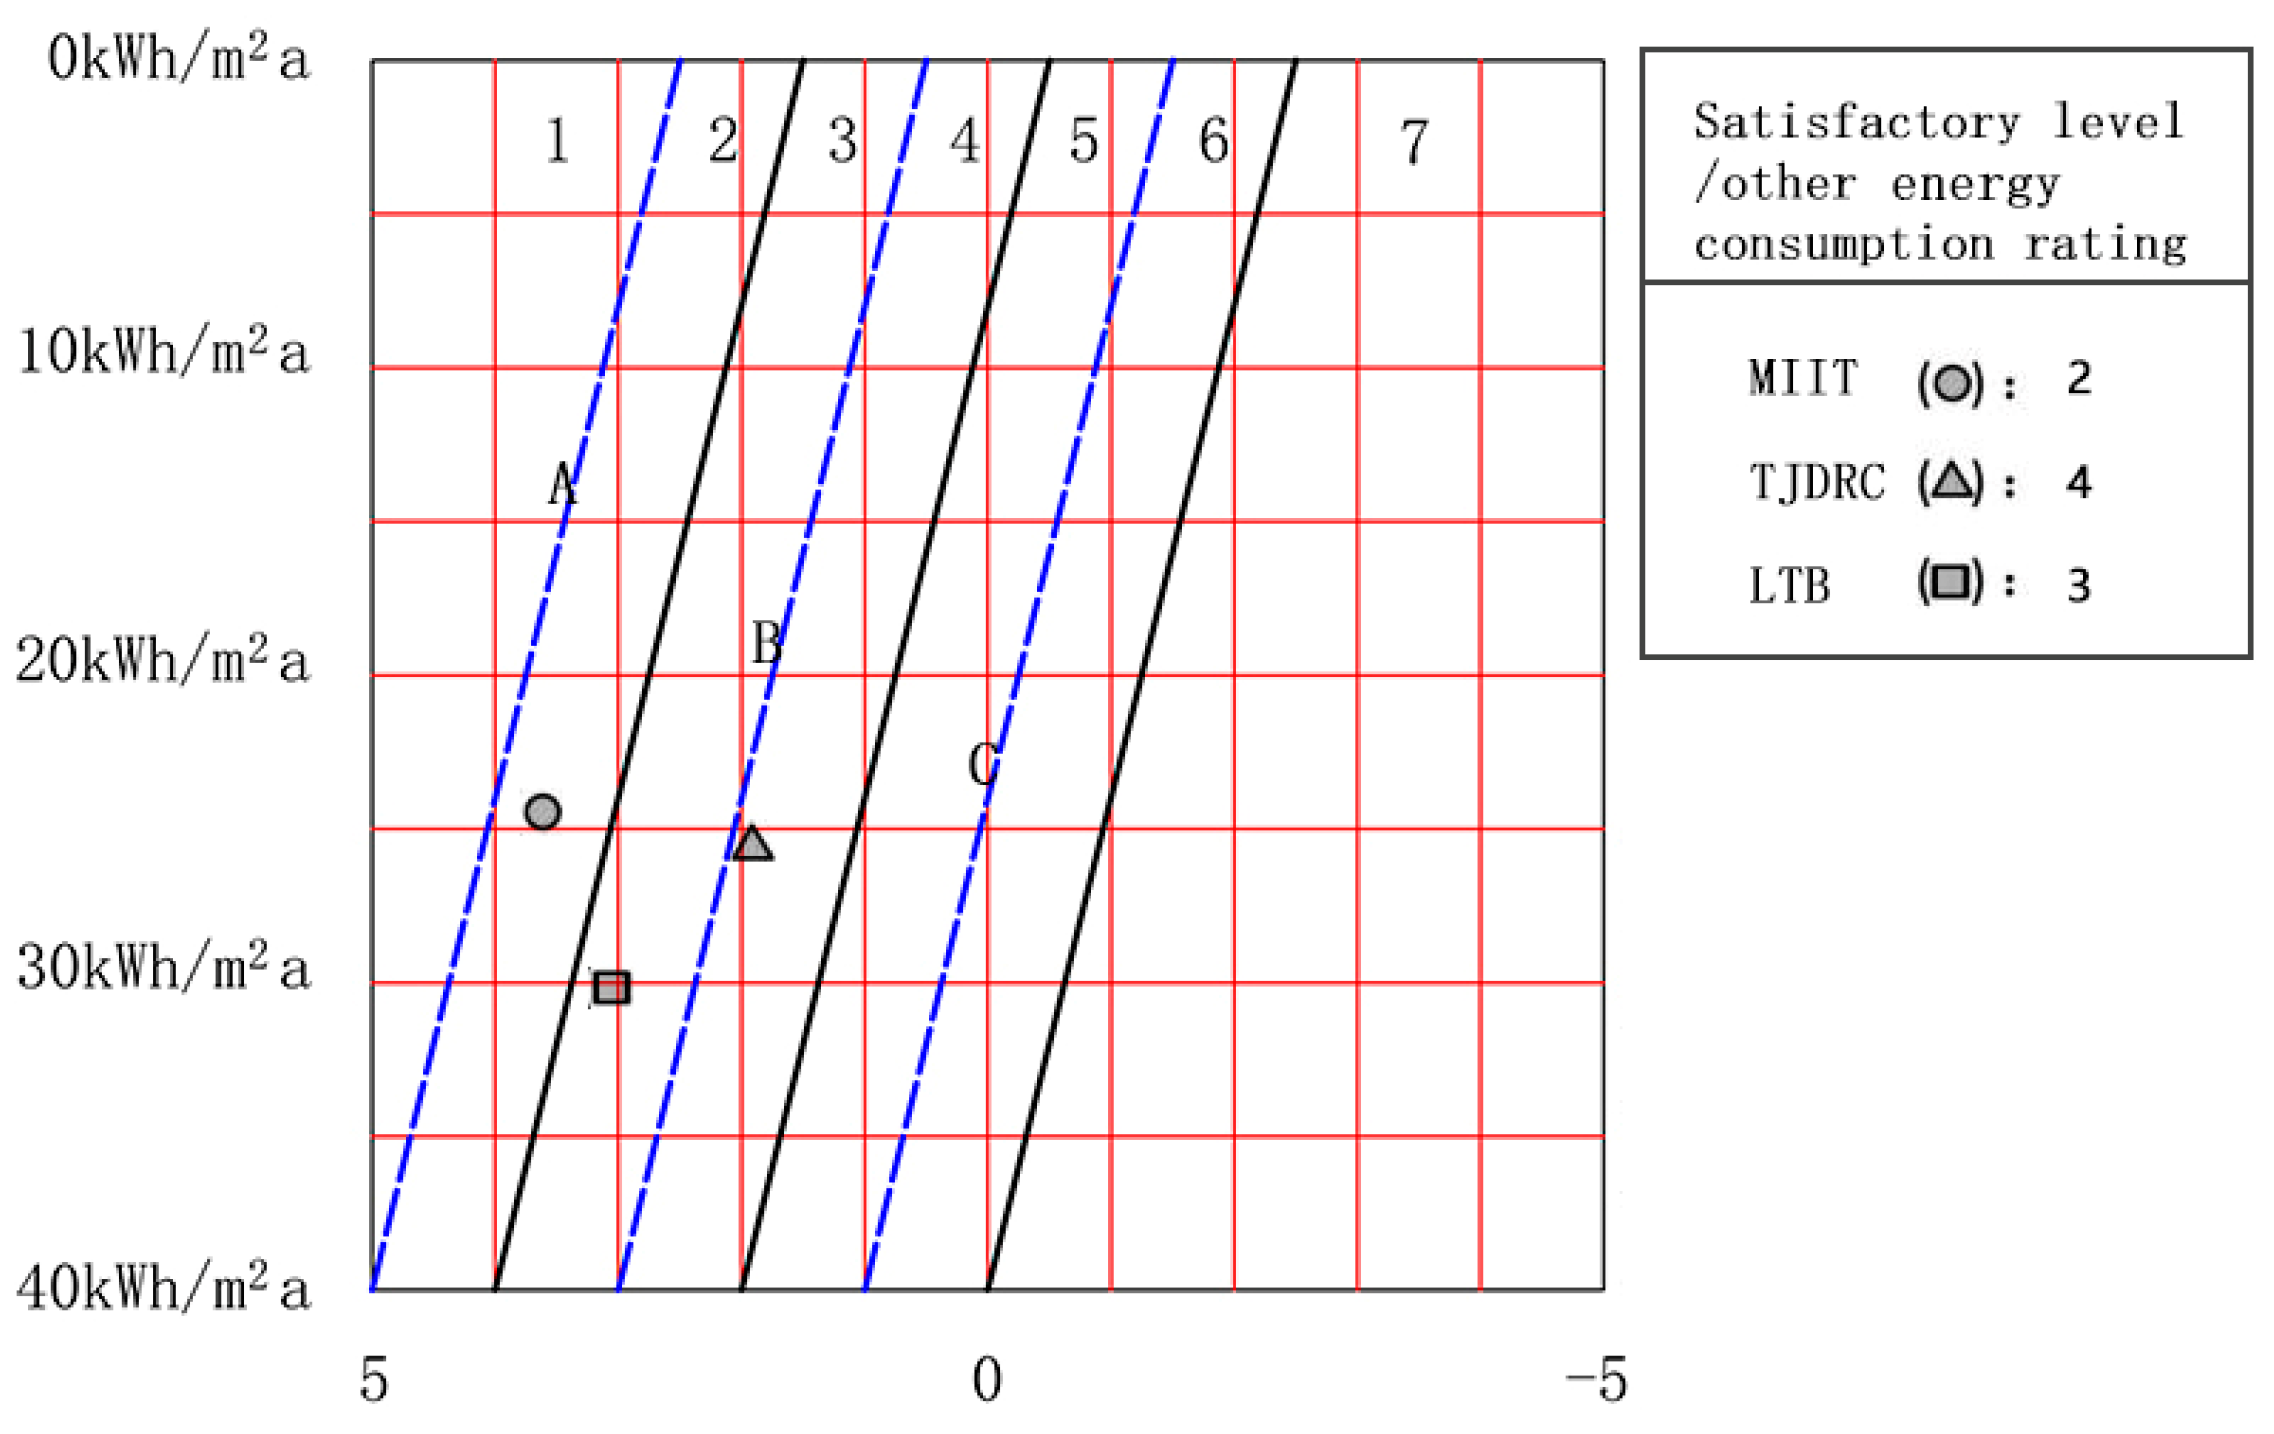
3.4. Satisfactory Level/other Energy Consumption Rating

The satisfactory level/other energy consumption rating results are illustrated in Figure 9. The questions in the subjective questionnaire involve an occupants’ satisfaction level when considering indoor environmental qualities, such as thermal comfort, visual comfort, and other factors. When calculating the value of the satisfactory level, subjective assessments of thermal comfort in summer and winter, and visual comfort are excluded. So, the satisfactory level in this category stands for an occupants’ assessment of other indoor environmental qualities relating to energy consumption. The satisfactory level of the MIIT is 3.7 and the correspondent energy consumption is 24.4 kWh/m2a. The satisfactory level of the TJDRC is 2.0 and the energy consumption is 25.4 kWh/m2a. The satisfactory level of the LTB is 3.1 and the energy consumption is 30.5 kWh/m2a. The three buildings scored 2, 4, and 3, respectively.

3.5. Final Rating

Figure 10 shows the final rating results for the three buildings. The score of (Q/L)t of MIIT, TJDRC, and LTR, which are obtained through weighted calculations, are 3.5, 5.8, and 4.9, respectively.
The total energy consumption of MIIT is 79.7 kWh/m2a, and the building energy efficiency of MIIT is labeled as B grade. The total energy consumption of TJDRC is 102.7 kWh/m2a, and the total energy consumption of LTB is 96.0 kWh/m2a. TJDRC and LTB are not certified by the new rating system, due to their poor performance in energy consumption.

4. Conclusions and Outlook

This article has presented a new rating system for building energy efficiency, and it is intended to evaluate office buildings in China’s cold zone. The main novelty of the presented method is that the evaluation and rating is based on in situ measurement results of existing buildings, during their operational phase. The method was developed on the basis of the Q/L system of CASBEE, and a series of studies on relevant literature, rating systems, codes, and standards in China. The rating system considers the actual energy consumption and indoor environmental quality. Three occupied office buildings in Beijing and Tianjin underwent one year of in situ measurement and research. The collected data were processed and the buildings were evaluated using the new rating system. The result of MIIT is a GBL-certified building, rated as B grade under the new system, but it can be seen from the discussion that there is great potential for a better grade, through optimizing the occupation and operation of the building. The other two offices were not certified by the rating system because of their poor performance in energy consumption. There is a need to improve the building energy efficiency of these two buildings, by optimizing the operation, occupants’ using habits, and maybe the retrofitting of the buildings.
The rating system is intended to provide a more accurate and comprehensive understanding of energy performance of a building to asset holders, occupants, and designers. It reveals the real energy efficiency and indoor environmental qualities that simulation in energy certification and existing rating systems can not show. Rating results under the new rating system, combined with design data of the buildings, can also be a reference for the retrofitting of existing buildings and the design of new buildings. It may inspire designers to make more climate-adapted decisions, instead of adopting strategies in order to meet relevant requirements under the existing certification or evaluation systems. In this study, only one type of building (office building) and one type of climatic context were taken into account, but the authors believe that through more research and study, the rating system can be expanded to a more complete level, under the framework and methodology that can serve a larger variety of buildings in all kinds of climatic zones in China.

Acknowledgments

This study was supported by the Project in the National Science & Technology Pillar Program during the Twelfth Five-year Plan Period (grant number 2013BAJ15B01) and National key research and development program during Thirteenth Five-year Plan Period (grant number 2016YFC0700206).

Author Contributions

Zhengnan Zhou designed research; Li Zhao completed Introduction section and literature research; all authors performed research and analyzed the data; all authors participated in writing the paper. All authors read and approved the final manuscript.

Conflicts of Interest

The authors declare no conflict of interest.

References

  1. Energy Information Administration (EIA). International Energy Outlook 2014. Available online: http://www.eia.gov/outlooks/archive/ieo14/pdf/0484(2014).pdf (accessed on 25 January 2017).
  2. Berardi, U. A cross-country comparison of the building energy consumptions and their trends. Resour. Conserv. Recycl. 2017. [Google Scholar] [CrossRef]
  3. Peuportier, B.; Thiers, S.; Guiavarch, A. Eco-design of buildings using thermal simulation and life cycle assessment. J. Clean. Prod. 2013, 39, 73–78. [Google Scholar] [CrossRef]
  4. Li, J.; Shui, B. A comprehensive analysis of building energy efficiency policies in China: Status quo and development perspective. J. Clean. Prod. 2015, 90, 326–344. [Google Scholar] [CrossRef]
  5. Long, W. China: Building and Energy Overview. In Proceedings of the Tongi-PolyU Student Seminar, Sino-German College of Applied Sciences, Tongji University, Shanghai, China, May 2005.
  6. Ministry of Construction of the People’s Republic of China. Technical Specification for Energy Conservation Renovation of Existing Heating Residential Building (JGJ 129-2001); China Building Industry Press: Beijing, China, 2001.
  7. Ministry of Construction of the People’s Republic of China. Design Standard for Energy Efficiency of Residential Buildings in Hot Summer and Warm Winter Zone (JGJ 75-2003); China Building Industry Press: Beijing, China, 2003.
  8. Ministry of Construction of the People’s Republic of China. Design Standard for Energy Efficiency of Public Buildings (GB50189-2005); China Building Industry Press: Beijing, China, 2005.
  9. Ministry of Construction of the People’s Republic of China. Standard for Building Energy Performance Certification (JGJ/T288-2012); China Building Industry Press: Beijing, China, 2012.
  10. Ministry of Construction of the People’s Republic of China. Standard for Energy Consumption of Buildings (GB/T51161-2016); China Building Industry Press: Beijing, China, 2016.
  11. Wong, S.; Abe, N. Stakeholders’ Perspectives of a Building Environmental Assessment Method: The Case of CASBEE. Build. Environ. 2014, 82, 502–516. [Google Scholar] [CrossRef]
  12. Silvestre, J.D.; de Brito, J.; Pinheiro, M.D. From the new European Standards to an environmental, energy and economic assessment of building assemblies from cradle-to-cradle. Energy Build 2013, 64, 199–208. [Google Scholar] [CrossRef]
  13. Leadership in Energy & Environmental Design (LEED). Available online: http://leed.usgbc.org/leed.html (accessed on 25 January 2017).
  14. Comprehensive Assessment System for Built Environment Efficiency (CASBEE). Available online: http://www.ibec.or.jp/CASBEE/english/overviewE.htm (accessed on 25 January 2017).
  15. Ye, L.; Cheng, Z.; Wang, Q.; Lin, W.; Ren, F. Overview on Green Building Label in China. Renew. Energy 2013, 53, 220–229. [Google Scholar] [CrossRef]
  16. Ando, S.; Arima, T.; Bogaki, K.; Hasegawa, H.; Hoyano, A.; Ikaga, T. Architecture for a Sustainable Future; Architectural Institute of Japan: Tokyo, Japan, 2005. [Google Scholar]
  17. Cole, R. Building Environmental Assessment Methods: A Measure of Success; IeJC: California, CA, USA, 2013. [Google Scholar]
  18. Newsham, G.; Birt, B.; Arsenault, C.; Thompson, L.; Veitch, J.; Mancini, S.; Galasiu, A.; Gover, B.; Macdonald, I.; Burns, G. Do green buildings outperform conventional buildings? Indoor Environ. Energy Perform N. Am. Off. 2012, 1, 1–71. [Google Scholar]
  19. Gou, Z.; Lau, S.Y.; Shen, J. Indoor environmental satisfaction in two LEED offices and its implications in green interior design. Indoor Built. Environ. 2011, 21, 503–514. [Google Scholar] [CrossRef]
  20. Paul Warren, L.; Taylor Peter, A. A comparison of occupant comfort and satisfaction between a green building and a conventional building. Build. Environ. 2008, 43, 1858–1870. [Google Scholar]
  21. Li, Y.; Yang, L.; He, B.; Zhao, D. Green building in China: Needs great promotion. Sustain. Cities Soc. 2014, 11, 1–6. [Google Scholar] [CrossRef]
  22. Desogus, G.; Mura, S.; Ricciu, R. Comparing different approaches to in situ measurement of building components thermal resistance. Energy Build. 2011, 43, 2613–2620. [Google Scholar] [CrossRef]
  23. Buratti, C.; Moretti, E.; Belloni, E.; Cotana, F. Unsteady simulation of energy performance and thermal comfort in non-residential buildings. Build. Environ. 2013, 59, 482–491. [Google Scholar] [CrossRef]
  24. Asdrubali, F.; Buratti, C.; Cotana, F.; Baldinelli, G.; Goretti, M.; Moretti, E.; Baldassarri, C.; Belloni, E.; Bianchi, F.; Rotili, A.; et al. Domenico Palladino and Daniele Bevilacqua. Evaluation of Green Buildings’ Overall Performance through in Situ Monitoring and Simulations. Energies 2013, 6, 6525–6547. [Google Scholar] [CrossRef]
  25. Bisegna, F.; Mattoni, B.; Gori, P.; Asdrubali, F.; Guattari, C.; Evangelisti, L.; Sambuco, S.; Bianchi, F. Influence of Insulating Materials on Green Building Rating System Results. Energies 2016, 9, 712. [Google Scholar] [CrossRef]
  26. Scheuer, C.; Keoleian, G.A.; Reppe, P. Life cycle energy and environmental performance of a new university building: Modeling challenges and design implications. Energy Build. 2003, 35, 1049–1064. [Google Scholar] [CrossRef]
  27. Ortiz, O.; Castells, F.; Sonnemann, G. Sustainability in the construction industry: A review of recent developments based on LCA. Constr. Build. Mater. 2009, 23, 28–39. [Google Scholar] [CrossRef]
  28. Alyami, S.H.; Rezgui, Y. Sustainable building assessment tool development approach. Sustain. Cities Soc. 2012, 5, 52–62. [Google Scholar] [CrossRef]
  29. Chen, H. The Status Quo and Countermeasures of Office Building Energy Utilization in Central Government Organs in Early Twenty-First Century. Ph.D. Thesis, School of Architecture, Tsinghua University, Beijing, China, 1 September 2008. [Google Scholar]
  30. Ministry of Housing and Urban Rural Development & State Administration of Quality Supervision, Inspection and Quarantine. Civil Building Design Standards; China Building Industry Press: Beijing, China, 2016.
  31. Building Energy Saving Research Center of Tsinghua University. China Building Energy Saving Annual Development Report; China Building Industry Press: Beijing, China, 2007. [Google Scholar]
  32. Qin, Y.G. Green building planning and design guidelines and evaluation system. China Sci. Technol. Achiev. 2007, 11, 53–54. [Google Scholar]
Figure 1. Work flow diagram.
Sustainability 09 00208 g001
Figure 2. Diagram of CASBEE assessment.
Sustainability 09 00208 g002
Figure 3. Diagram of final rating.
Sustainability 09 00208 g003
Figure 4. (a) Diagram of indoor temperature in winter/heating energy consumption rating; (b) Diagram of indoor temperature in summer/cooling energy consumption rating; (c) Diagram of indoor illumination/lighting energy consumption rating; (d) Diagram of satisfaction level/other energy consumption rating.
Sustainability 09 00208 g004
Figure 5. Diagram of evaluation framework and process.
Sustainability 09 00208 g005
Figure 6. Indoor temperature in winter/heating energy consumption rating result.
Sustainability 09 00208 g006
Figure 7. Indoor temperature in summer/cooling energy consumption rating result.
Sustainability 09 00208 g007
Figure 8. Indoor illumination/Lighting energy consumption rating result.
Sustainability 09 00208 g008
Figure 9. Satisfaction level/other energy consumption rating result.
Sustainability 09 00208 g009
Figure 10. Building energy efficiency rating result.
Sustainability 09 00208 g010
Table 1. Climatic classification and climatic characters in China.
Climate ZonesMain Climate IndexGuides for Architecture Design
ISevere cold zonesAverage temperature in January ≤−10 °C;
Average temperature in July ≤25 °C
The building must meet the requirements of heat preservation in winter, anti-freezing and other requirements.
IICold zonesAverage temperature in January −10~0 °C;
Average temperature in July 18~28 °C
The building must meet the requirements of heat preservation in winter, anti-freezing and other requirements.
IIIHot summer and cold winter zonesAverage temperature in January 0~10 °C;
Average temperature in July 25~30 °C
The building must meet anti-overheating, shading, ventilation and cooling requirements in summer. Anti-cold requirements should be taken into account in winter.
IVHot summer and warm winter zonesAverage temperature in January >10 °C;
Average temperature in July 25~29 °C
The building must meet anti-overheating, shading, ventilation, cooling and anti-rainwater requirements in summer.
VTemperate zonesAverage temperature in January 0~13 °C;
Average temperature in July 18~25 °C
The building must meet ventilation and anti-rainwater requirements in summer.
Table 2. Heating energy consumption standards of a state institution office building in the Beijing region (1 kgce = 3.695 kWh).
Heating Energy Consumption (kgce/m2a)Large-Scale Urban Central HeatingSmall-Scale Urban Central HeatingDistrict Central HeatingHousehold HeatingAverage Value
Mandatory value9.810.313.811.111.25 (≈42 kWh/m2a)
Median value 32 kWh/m2a
Suggested value4.54.57.96.95.95 (≈22 kWh/m2a)
Table 3. Energy consumption standards of a state institution office building in the Beijing region.
Energy Consumption (Heating Energy Consumption Excluded) (kWh/m2a)State Institution Office Building
(Class A)
State Institution Office Building
(Class B)
Average Value
Mandatory value457058
Median value 49
Suggested value305040
Table 4. Building energy efficiency graphic dominant point for a public office building in a cold region.
GradeEnergy Consumption
Total Energy Consumption
(kWh/m2a)
Heating Energy Consumption
(kWh/m2a)
Cooling Energy Consumption
(kWh/m2a)
Lighting Energy Consumption
(kWh/m2a)
Other Energy Consumption
(kWh/m2a)
A grade622210624
B grade813215826
C grade10042201028
Table 5. Basic information of the case study buildings.
ProjectMIITTJDRCLTB
Architectural Appearance Sustainability 09 00208 i001 Sustainability 09 00208 i002 Sustainability 09 00208 i003
Typical Floor Plan Sustainability 09 00208 i004 Sustainability 09 00208 i005 Sustainability 09 00208 i006
LocationXicheng District of BeijingHeping District of TianjinNankai District of Tianjin
Floor Area62,700 m229,300 m27870 m2
Building Story6 stories on the ground,
3 stories underground
29 stories on the ground,
2 stories underground
6 stories on the ground,
1 story underground
Completion Time201519972003
Ventilation Typehybridhybridhybrid
Type of lampsledincandescent, fluorescentled, fluorescent
Table 6. Data of energy consumption and environmental quality.
ProjectFloor Area (Underground Parking Lot Area Is Not Included) (m2)HeatingCoolingLightingOtherTotal Energy Consumption (kWh/m2a)
Heating Energy Consumption (kWh/m2a)Indoor Temperature in Winter (°C)Cooling Energy Consumption (kWh/m2a)Indoor Temperature in Summer (°C)Lighting Energy Consumption (kWh/m2a)Indoor Illumination (lx)Satisfactory LevelAppliance and Other Consumption (kWh/m2a)
MIIT48,78036.021.010.826.08.53603.724.479.7
TJDRC22,62050.019.816.026.811.33502.025.4102.7
LTB787038.019.214.026.413.53903.130.596.0

