Article

Examining the Interaction of Taxi and Subway Ridership for Sustainable Urbanization

1
School of Environmental Design, Kanazawa University, Kanazawa 920-1192, Japan
2
School of Architecture, Tsinghua University, Beijing100084, China
3
School of Architecture, Fuzhou University, Fuzhou 350116, China
4
Key Laboratory of New Technology for Construction of Cities in Mountain Area, Chongqing University, Chongqing 400044, China
5
Faculty of Construction and Environment, Hong Kong Polytechnic University, Hong Kong 00852, China
6
Department of Geography and Computational Social Science Lab, Kent State University, Kent 44242, USA
*
Authors to whom correspondence should be addressed.
Miaoyi Li and Lei Dong contributed equally to this work.
Sustainability 2017, 9(2), 242; https://doi.org/10.3390/su9020242
Submission received: 14 December 2016 / Revised: 17 January 2017 / Accepted: 19 January 2017 / Published: 10 February 2017

Abstract

:
A transit ridership study is an essential part of sustainability, and can provide a deep understanding of people’s travel patterns for efficient transportation development and urbanization. However, there is a lack of empirical studies comparing subway and taxi services, and their interactions within a city, that is to say, the interdependent transportation networks. Incorporating new data, this study aims to examine the spatial variation of urban taxi ridership due to the impacts of a new subway line operation opened in 2014 in Wuxi, China. We examine the spatial patterns and interactions of ridership in Wuxi by integrating taxi trajectory from GPS data and subway data from continuously collected fare transactions. The results indicated that the demand for taxi and subway usage is quite elastic with respect to both location and time, and the new subway’s opening had more influence on areas adjacent to subway stations and urban center-suburban travel. Furthermore, increases in travel time and distance would increase the demand for subway, while taxi trips largely represented movements for those locations that the subway could not reach. This paper betters the understanding of travel patterns through large volumes of transportation data for sustainable urbanization policy design.

1. Introduction

Fast-changing urbanization contexts demand knowledge to provide strategies for sustainable transportation development in the context of ever-increasing volumes of geospatial data. Transit ridership has long been a hot research topic among scholars and policy-makers in the fields of transport geography and urban planning [1,2,3]. Much work has been conducted to identify the interdependencies of transportation systems and their ridership [4]. Few studies focus on the spatial dependency of transit ridership in comparing subway and taxi, which is one of the vital studies in urban sustainability.
The relationship between subway and ground systems is interrelated, as they mutually affect each other. Understanding the connection of subway with taxi is essential for society-wide policy issues. Subway, as one of the popular transportation modes in urban areas for most passengers, is an important means of sustainable transportation development in reducing private travel demand [3]. Lin et al. [5] suggest that public transport networks, location of housing and employment have played significant roles in commuting. They indicate that subway significantly and negatively influenced the commuting times of low- and middle-income workers, but neither subway nor taxi had a significant influence on the commuting times of high-income workers. On the other hand, taxi meets a large amount of citizens’ travel demands and covers a wide range of urban areas with high accessibility and flexibility. Taxi, as an indispensable mode of transportation in large cities, complements other public transport modes in terms of flexible door-to-door service and 24/7 operations. This has drawn many researchers to examine a new subway system [6,7], while less attention is paid to a subway’s influence on taxi ridership [8,9].
Understanding the association between the travel patterns of subway users and the choice of taxi trip is an essential part of any transportation plan to enhance sustainable urban development [9]. A newly opened subway would have both positive and negative effect on taxi ridership in the nearby region [10]. For example, Knowles [11] observed a much larger shift from vehicle travel to transit travel because of the opening of a new subway line [12], which encouraged people to use transit and more people who like to use transit would choose to live near transit stations [2]. Previous literature focuses on examining different variables, such as travel time, costs and the level of service that are closely associated with subway and taxi ridership; however, few studies have quantitatively analyzed the impact of opening a new subway line on spatial variation of urban taxi trajectories and evaluated the changes of taxi passengers’ transportation modes that reveal the critical locations in people’s movements, because of the absence of digitalized data both in subway and in ground transportation.
The majority of existing evaluation studies on ridership reply on traditional data, including questionnaire and travel surveys, in which it is difficult and time-consuming to capture the information of origins and destinations, leading to small sample sizes, inaccurate location formation, and shorter periods of time coverage [13]. These studies seldom scrutinize the ridership and transport mode choice spatially, which may include evaluations of the expected and realized benefits from the construction of new public transport systems through questionnaires [14], studies on taxi ridership with data collected by counting the number of taxis passing roadside checkpoints [15], ridership studies on origin–destination (O–D) estimation from travel diary surveys, e.g., face to-face interviews [16], place-based trip or activity diary [17,18], and traffic count data, e.g., methods reviewed for estimating an O–D matrix [19], dynamic O–D estimation to derive day-to-day demands [20], and decomposition framework for estimating dynamic O–D flows [21].
On the other hand, the distinct techniques that capture large volumes of mobility data collected from GPS-equipped vehicles, mobile phones, and smart cards lead to the discovery of spatial-temporal features of human mobility from new perspectives and employing new tools [7,22,23]. In the environment of such new data [24], the new emerging data are more accurate, objective, plentiful, and cost-effective in describing human mobility in a spatially embedded flow network [25]. For example, researchers have adopted taxi trajectory data for understanding spatiotemporal characteristics of human mobility within a city [26,27,28,29,30], specifically exploring human travel patterns [30,31,32], observing mobility pattern at the individual level [33], and deriving O–D information and trip purpose [34,35]. Thus, these works inspire the pioneering work on characterizing spatial variation among alternative travel modes.
This study attempts to examine transit ridership among alternative travel modes from O–D pairs by employing GPS tracking data of taxis and subway transaction data from the new subway line to analyze human mobility in the network analysis by constructing a 1 km by 1 km cell grid at city level in Wuxi, China. Smaller and medium-sized developing cities have great potential to develop sustainable transport systems, which have low-cost investments and the imposition of modest fees to promote more sustainable urban transport, therefore different measures may be more appropriate for smaller and medium-sized developing cities than megacities [36]. This study presents a longitudinal analysis to deploy more accurate and complete information on the interaction between subway and taxi, which has not yet appeared in the existing transit-ridership literature. The three-fold research objectives are: (1) to present a novel quantitative method to observe the divergent behavior of human mobility by developing a geospatial citywide database of floating car trajectories and subway transaction records; (2) to explore the impacts of opening a new subway line on taxi trips in terms of spatial and temporal dimensions by taking advantage of the longitudinal large-scale trip data; and (3) to investigate the interaction between taxi trips and subway trips at the city level.
The remainder of this article is organized as follows. Section 2 describes the dataset of both subway and taxi trips, trip extraction and methodology. Section 3 provides a comparative analysis of taxi trips and subway movements and presents the differences between subway trips and taxi trips in terms of spatial location, time, and city structure. Finally, Section 4 summarizes the contributions of this paper and discusses the divergences between human mobility derived from subway and taxi usages, with a brief discussion about potential directions of this research.

2. Materials and Methods
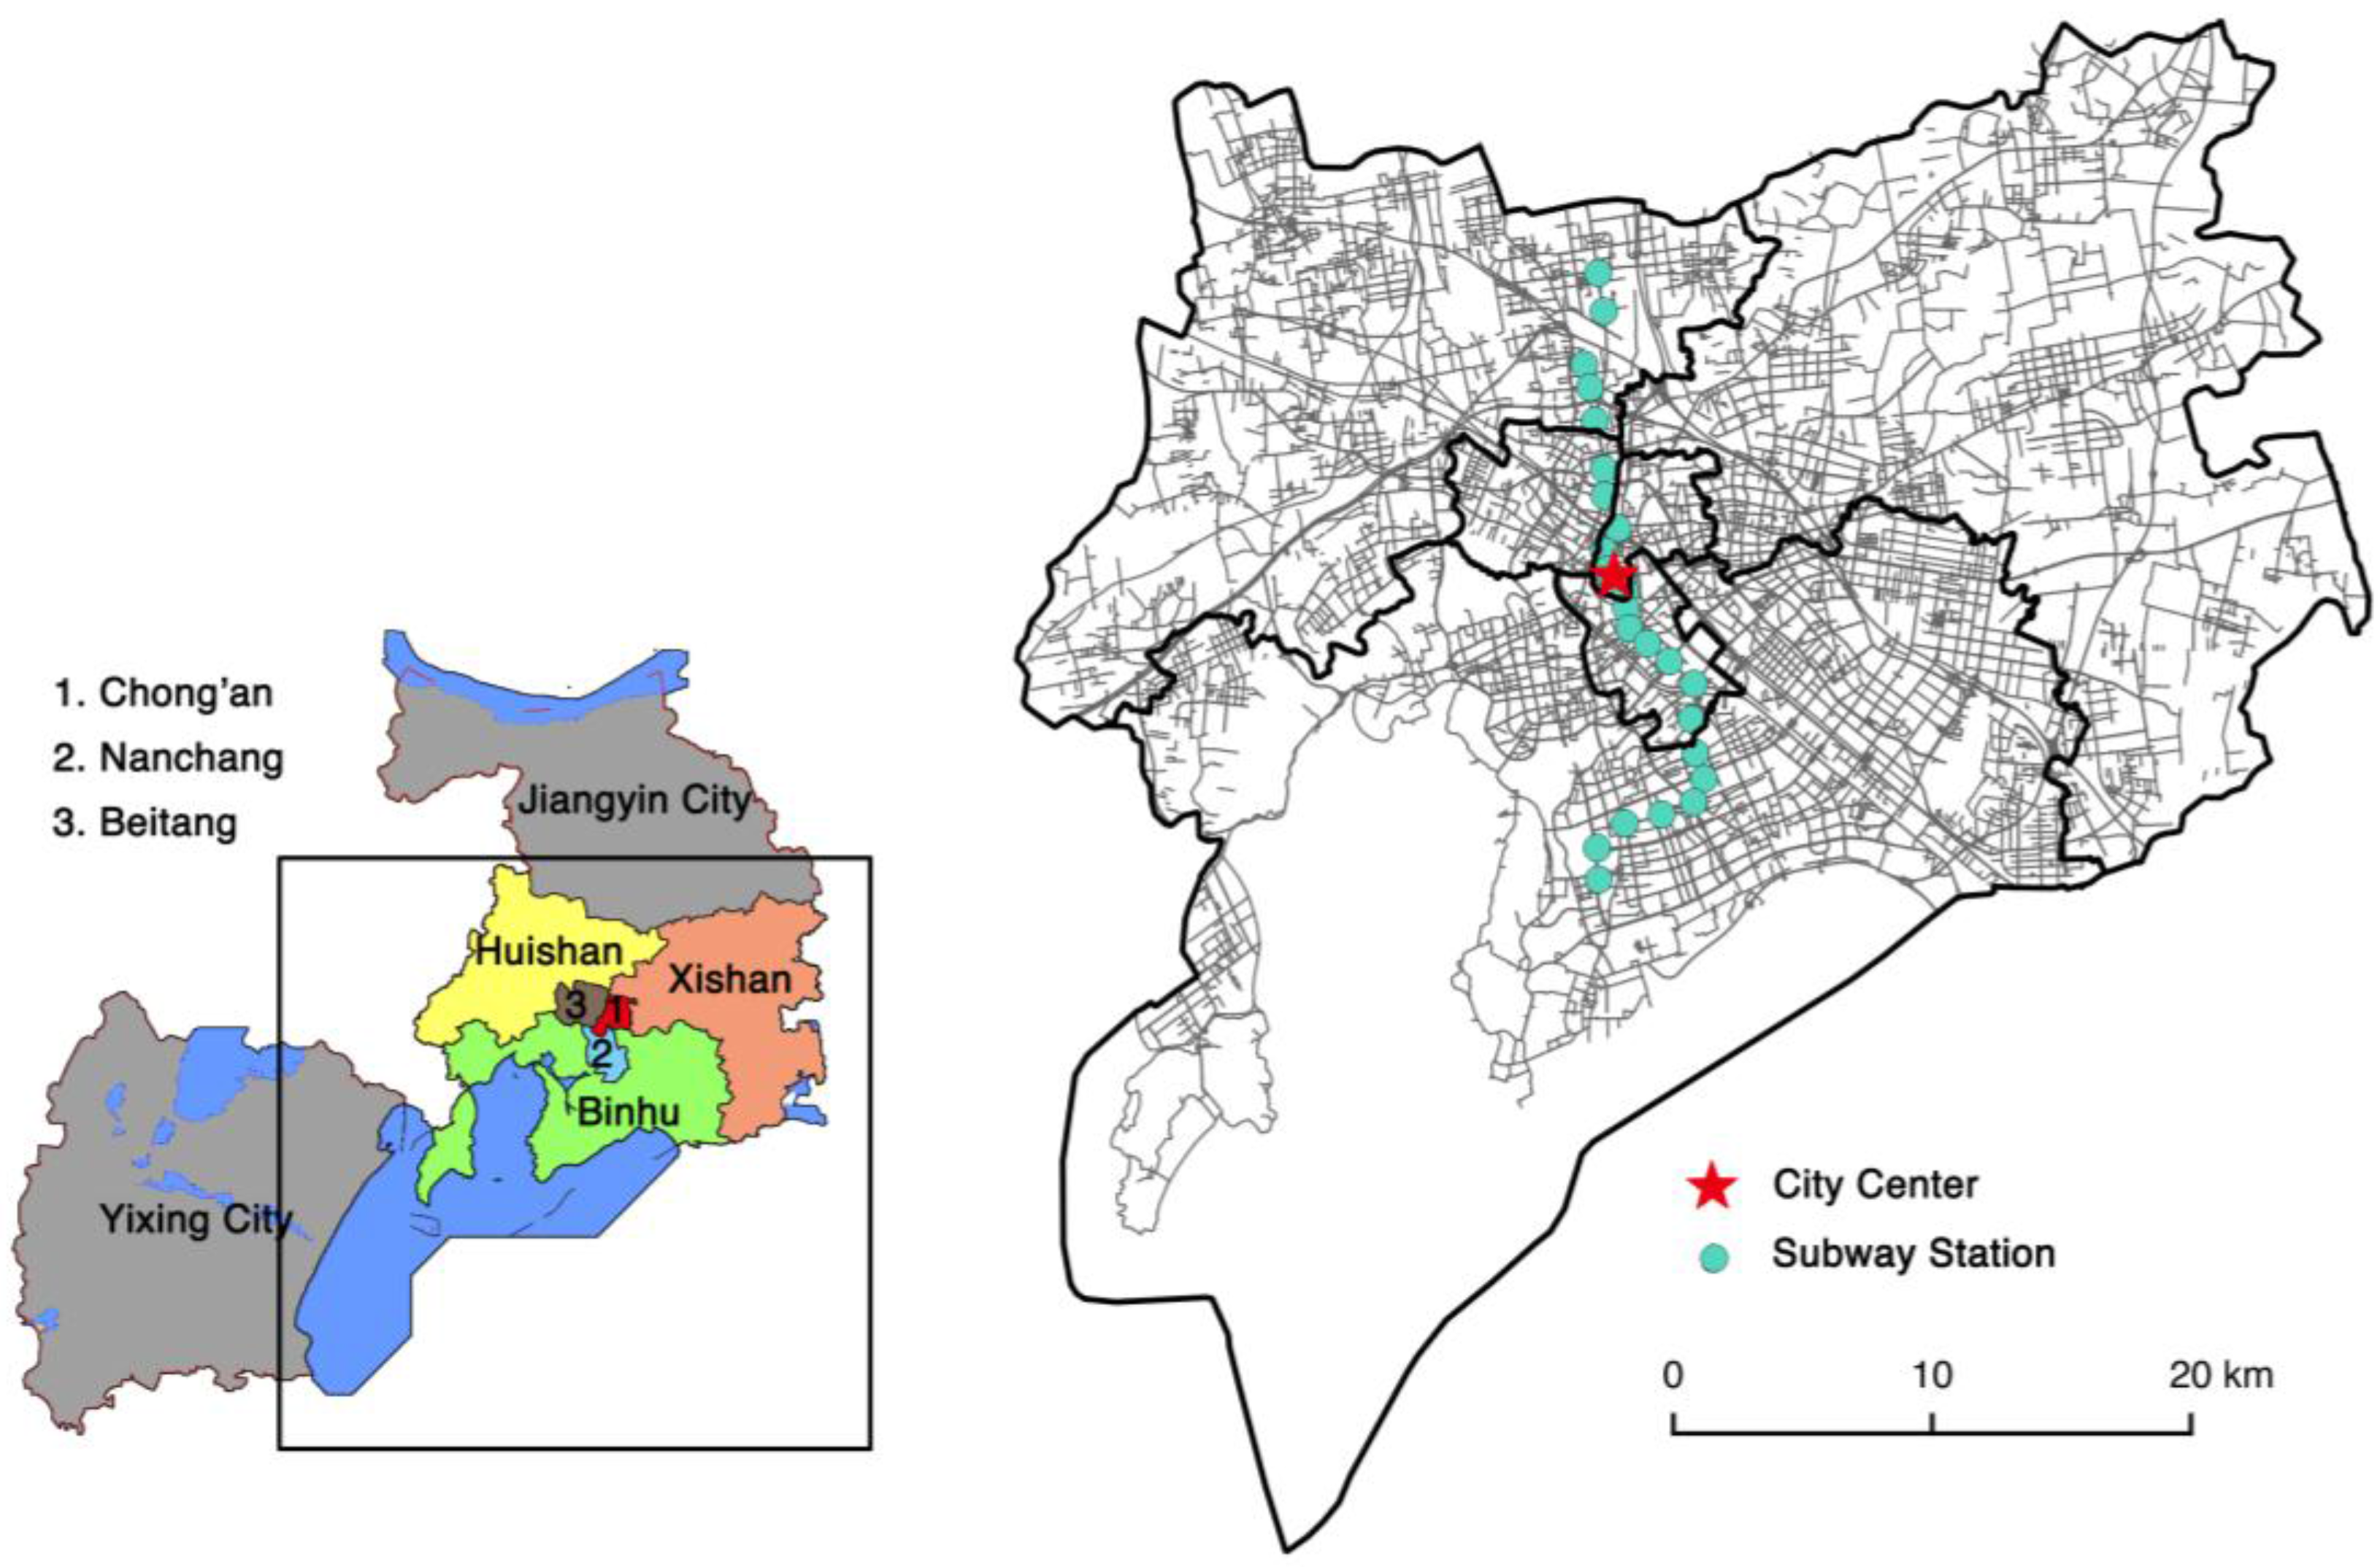
2.1. Study Area

Wuxi, located in eastern China, is one of the cities representative of fast urbanizing China and also has great potential to develop sustainable transport systems. We selected Wuxi city as the study area for two main reasons: Firstly, as one of the largest cities in the Yangtze River Delta region of China, from 2000 to 2015, Wuxi has approximately tripled its urban built-up area from 110 km2 to 320 km2 and increased fivefold its urban population from 0.6 to 3 million, depicting an ideal representation of Chinese cities in the fast urbanization process. Secondly and the most importantly, the first subway line (Line 1) of Wuxi just opened in 1 July 2014, making it possible to measure the impact of subway to urban transportation networks with data collected via Metro Card and taxi GPS. Figure 1 shows the boundary of Wuxi and the 24 subway stations (green dots) of Line 1.

2.2. Dataset

Two datasets are used in this study. The first one is subway O–D data that covers four weeks since the opening of Line 1. This dataset is extracted from the transaction records of each Metro Card, including anonymized card ID, transaction time, transaction type (enter or exit), and station ID.
The second dataset is the trajectories of 1500 taxis in Wuxi, which covers four weeks before and four weeks after the opening of the new subway. Taxi trajectory data includes drive routes, pick-up and drop-off locations, speed, and time slots, which are collected by the widely used floating car technology (Probe car) with a GPS device on board. Compared to traditional surveys, taxi trajectory data reflects more dynamical and precise travel behaviors in cities, and therefore is employed to represent the ground transportation. For the validity of this study, we only extract trajectories with passengers on board, and then keep the origin and destination points from each trajectory to construct a network (detailed in Methods). Since people may have different travel behaviors during weekdays and weekends, we analyze the travel flows on weekdays and weekend separately. Table 1 gives a short summary of the daily number of taxi trips in different time periods.

2.3. Methods

The primary goal of this study is to explore the impact of a new subway on ground transportation in a city, and we assume that in a relatively short period (four weeks, in our case) before and after the subway’s opening, the average variation of ground transportation (e.g., taxi trips) is mainly caused by the subway’s influence. Therefore, we construct two networks (subway network and taxi network) and evaluate the statistical results before and after the opening of a new subway. We build the taxi network in 1 km by 1 km grids, which are commonly used for transportation network studies [3]. In this network, the 1 km2 cells are nodes and the O–D vectors between nodes are inbound and outbound edges; the total volume of each edge is its weight.
Here, we average the daily O–D volume between cells for weekdays, weekends, in June and July respectively, and remove edges with a daily traffic volume of less than 1. Thus, we construct four direct networks (June weekday, June weekend, July weekday, and July weekend), two of which are before the opening of the subway, and two of which are after. For this directed network, the degree of node i can be divided into in-degree and out-degree. The in-degree is the sum of connections onto node i , k i i n =   j a i j , and the out-degree is the sum of connections coming from node i , k i o u t =   j a i j , here a i j is the element of adjacency matrix A. As shown in Figure 2, the in-degree of Node 1 is 1, and the out-degree is 1, while for Node 3, the in-degree is 1, and out-degree is 2. Table 2 shows the basic network statistics. We can see that the number of edges drops nearly 20% for both weekday and weekend after the opening of the subway.

3. Results

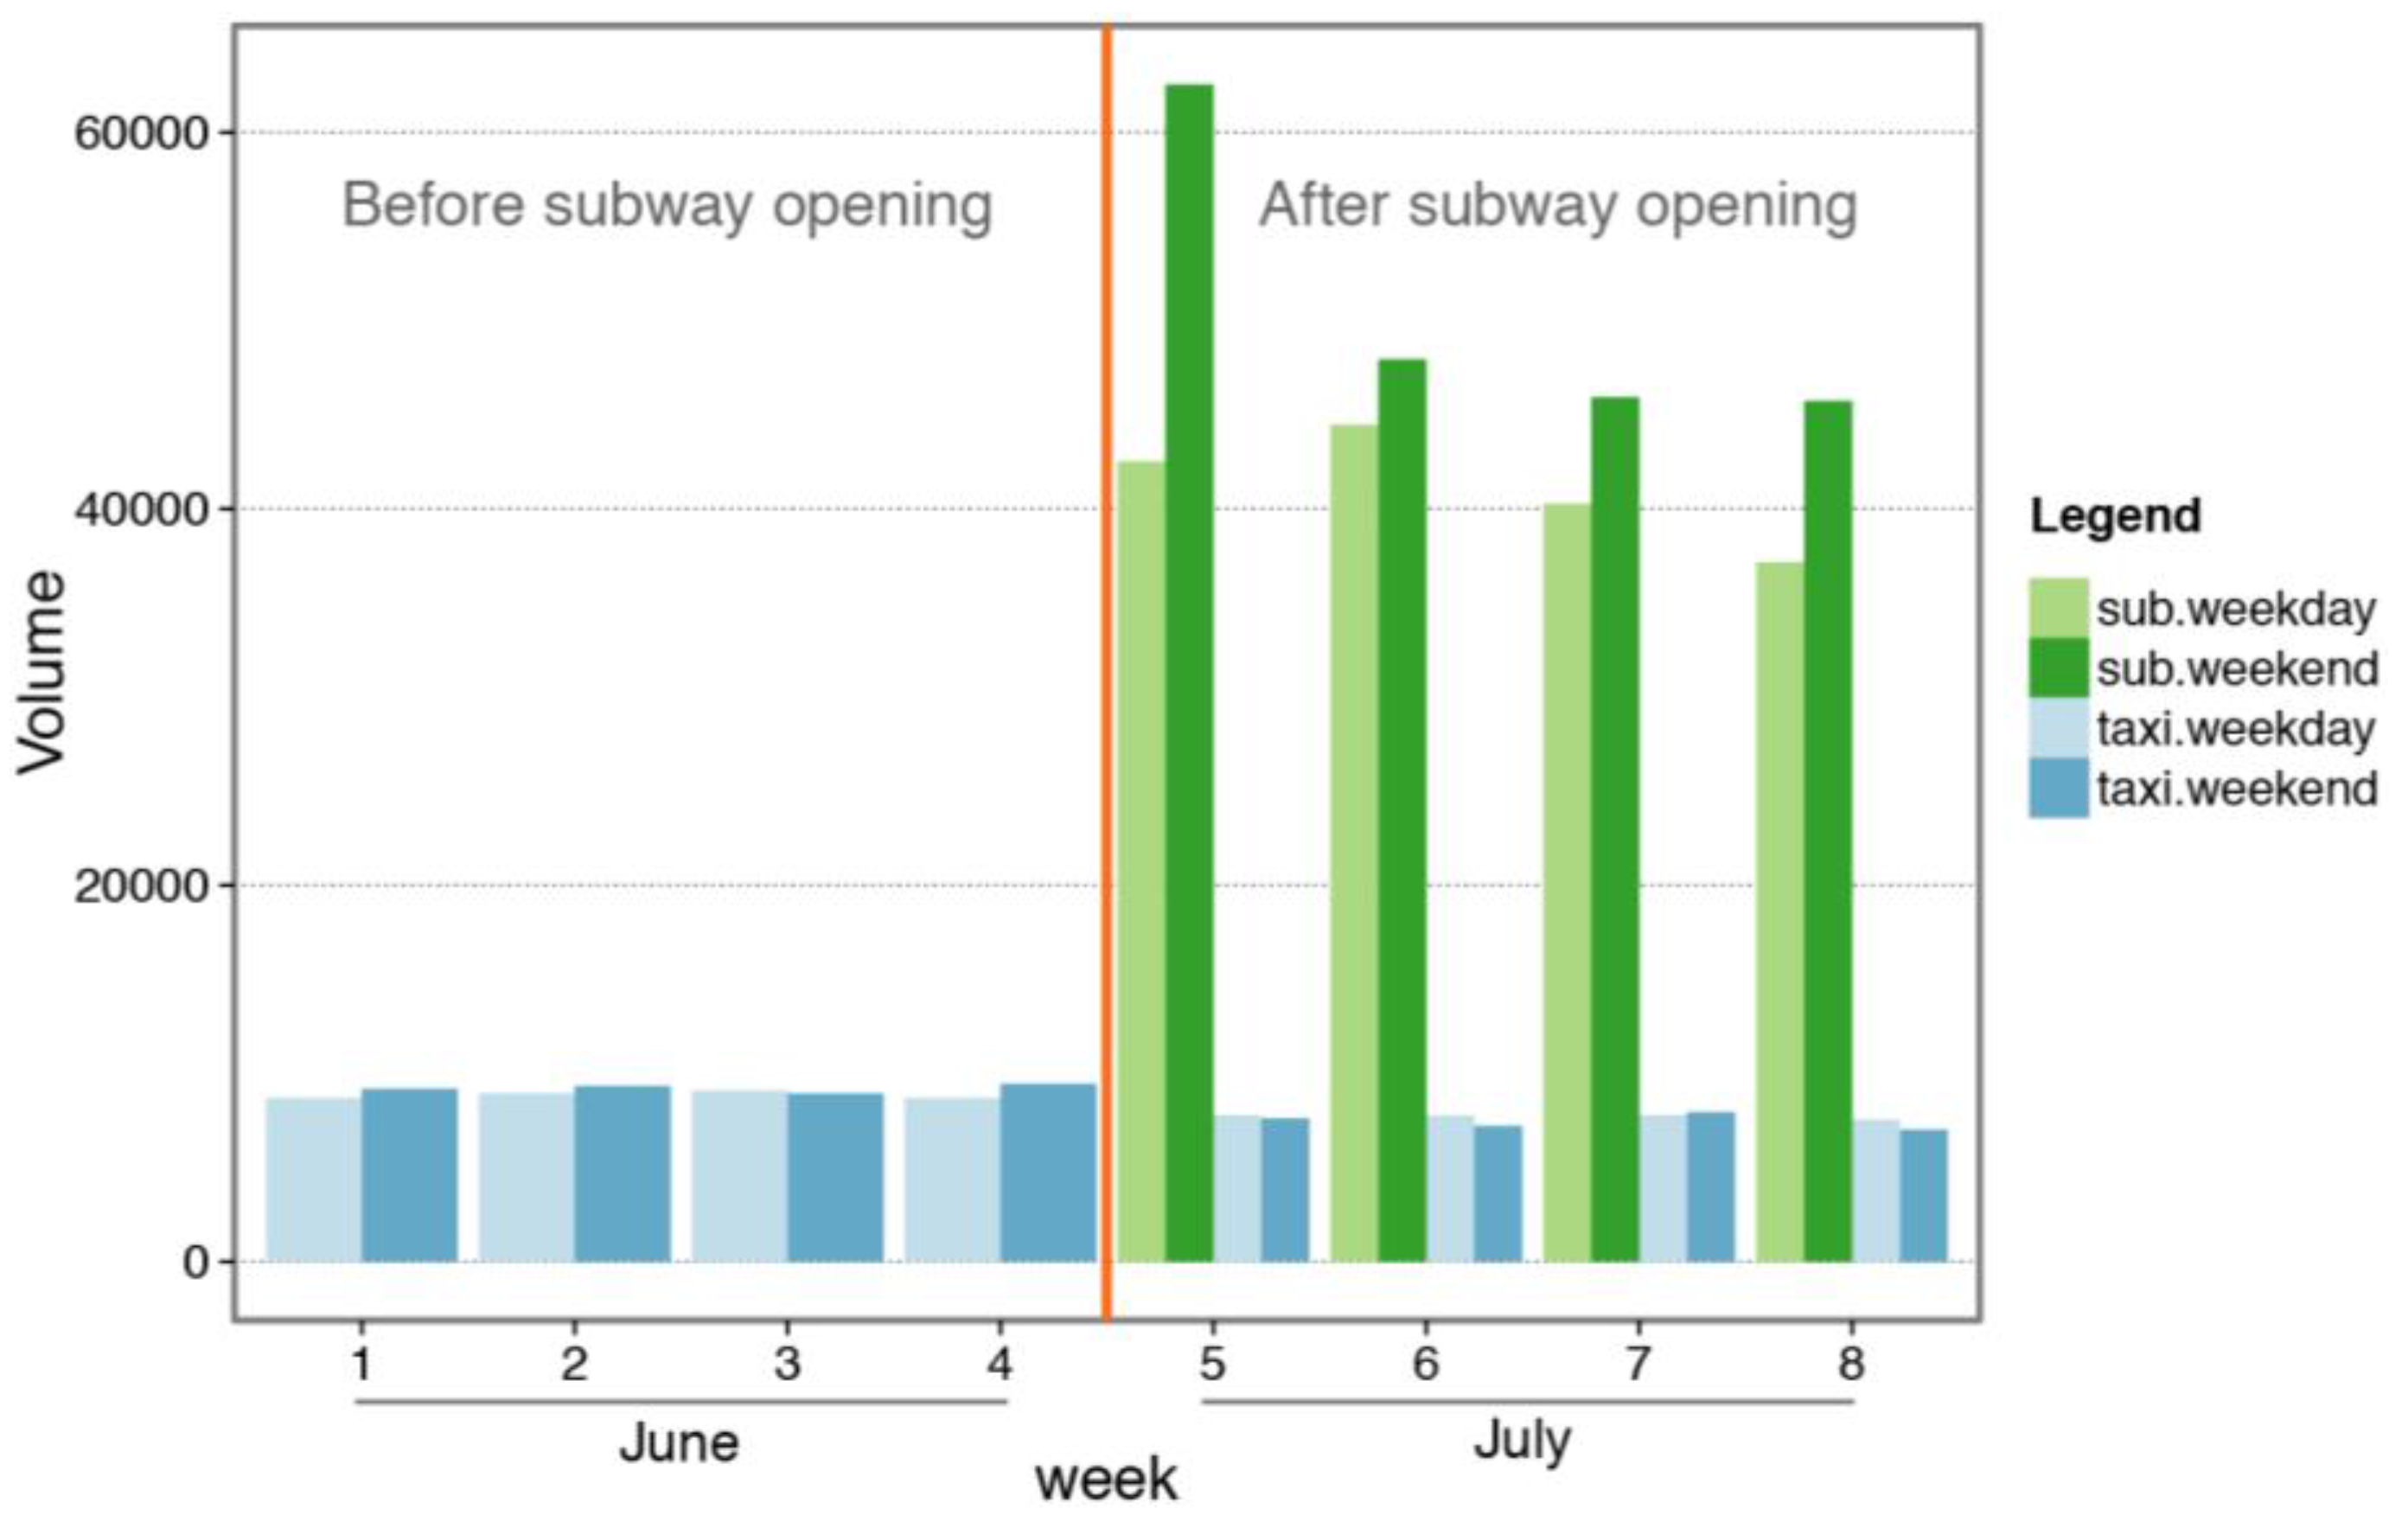
3.1. Subway Influence on Taxi Ridership

Firstly, we plot the subway O–D matrix to show the subway network structure. Figure 3 depicts each station’s ridership volume with the weekdays’ result on the left and the weekends’ on the right. In Figure 3, we can easily identify that Sanyang Square and Nanchansi are the stations with the darkest red as they are the central area of the city, and the origin-destination area is more concentrated near the city center. Additionally, the overall subway ridership intensity on weekends is higher than weekdays, which indicates that people are more likely to travel by subway Line 1 on the weekend.
Secondly, we analyze the daily taxi O–D data within a 1 km radius of the subway stations. Figure 4 and Table 3 present us with more detailed evidence of the ridership change in taxi and subway along the new subway’s (Line 1) service corridor before and after its opening. Within the observed period, we can see that: (1) The daily volume of taxi ridership near the service corridor of the subway line shows a decrease since the subway opening, indicating a sign of substitution effect, which means people would choose subway as their means of transportation rather than taxi once the subway was in operation. (2) There is a fluctuation in the ridership of the subway during the weekends, while the subway’s ridership on weekdays remains steady (Figure 4). Specifically, there is an obvious drop in the volume of subway ridership in the second weekend compared to the first weekend. One explanation is that people took the subway during weekends as a curiosity or trial to test if the subway is convenient since the subway had just opened. After that, people would choose their preferred way of traveling, thus there were not as many passengers the second weekend as there were in the first weekend.
In general, if we compare the change in total volume (Table 3), the subway volume is around 40,000–50,000 persons/day, which is much larger than the reduction in taxi volume, being only 1200 on weekdays and 1800 on weekends (note that we only use 1500 taxis, accounting for about 40% of the total number of taxis). Therefore, the operation of the subway may have more impact or substitution effect on other transportation means such as buses or private cars. In other words, a number of people who took a bus or private car before are more likely to choose the subway after its opening. At the same time, people’s travel demands are very likely stimulated by the new subway, which led to the huge differences between the ridership increase in subway and decrease in taxi.
To add a more robust check, we also perform the above-mentioned analysis to the datasets of April and September, two typical months without a long public holiday. April is two months before the subway’s opening, and September is two months after. The mean daily taxi volume of April is very close to that of June, and September’s is very close to that of July (the difference is less than 5%), showing that the proposed method is quite promising (see Supplementary Information).

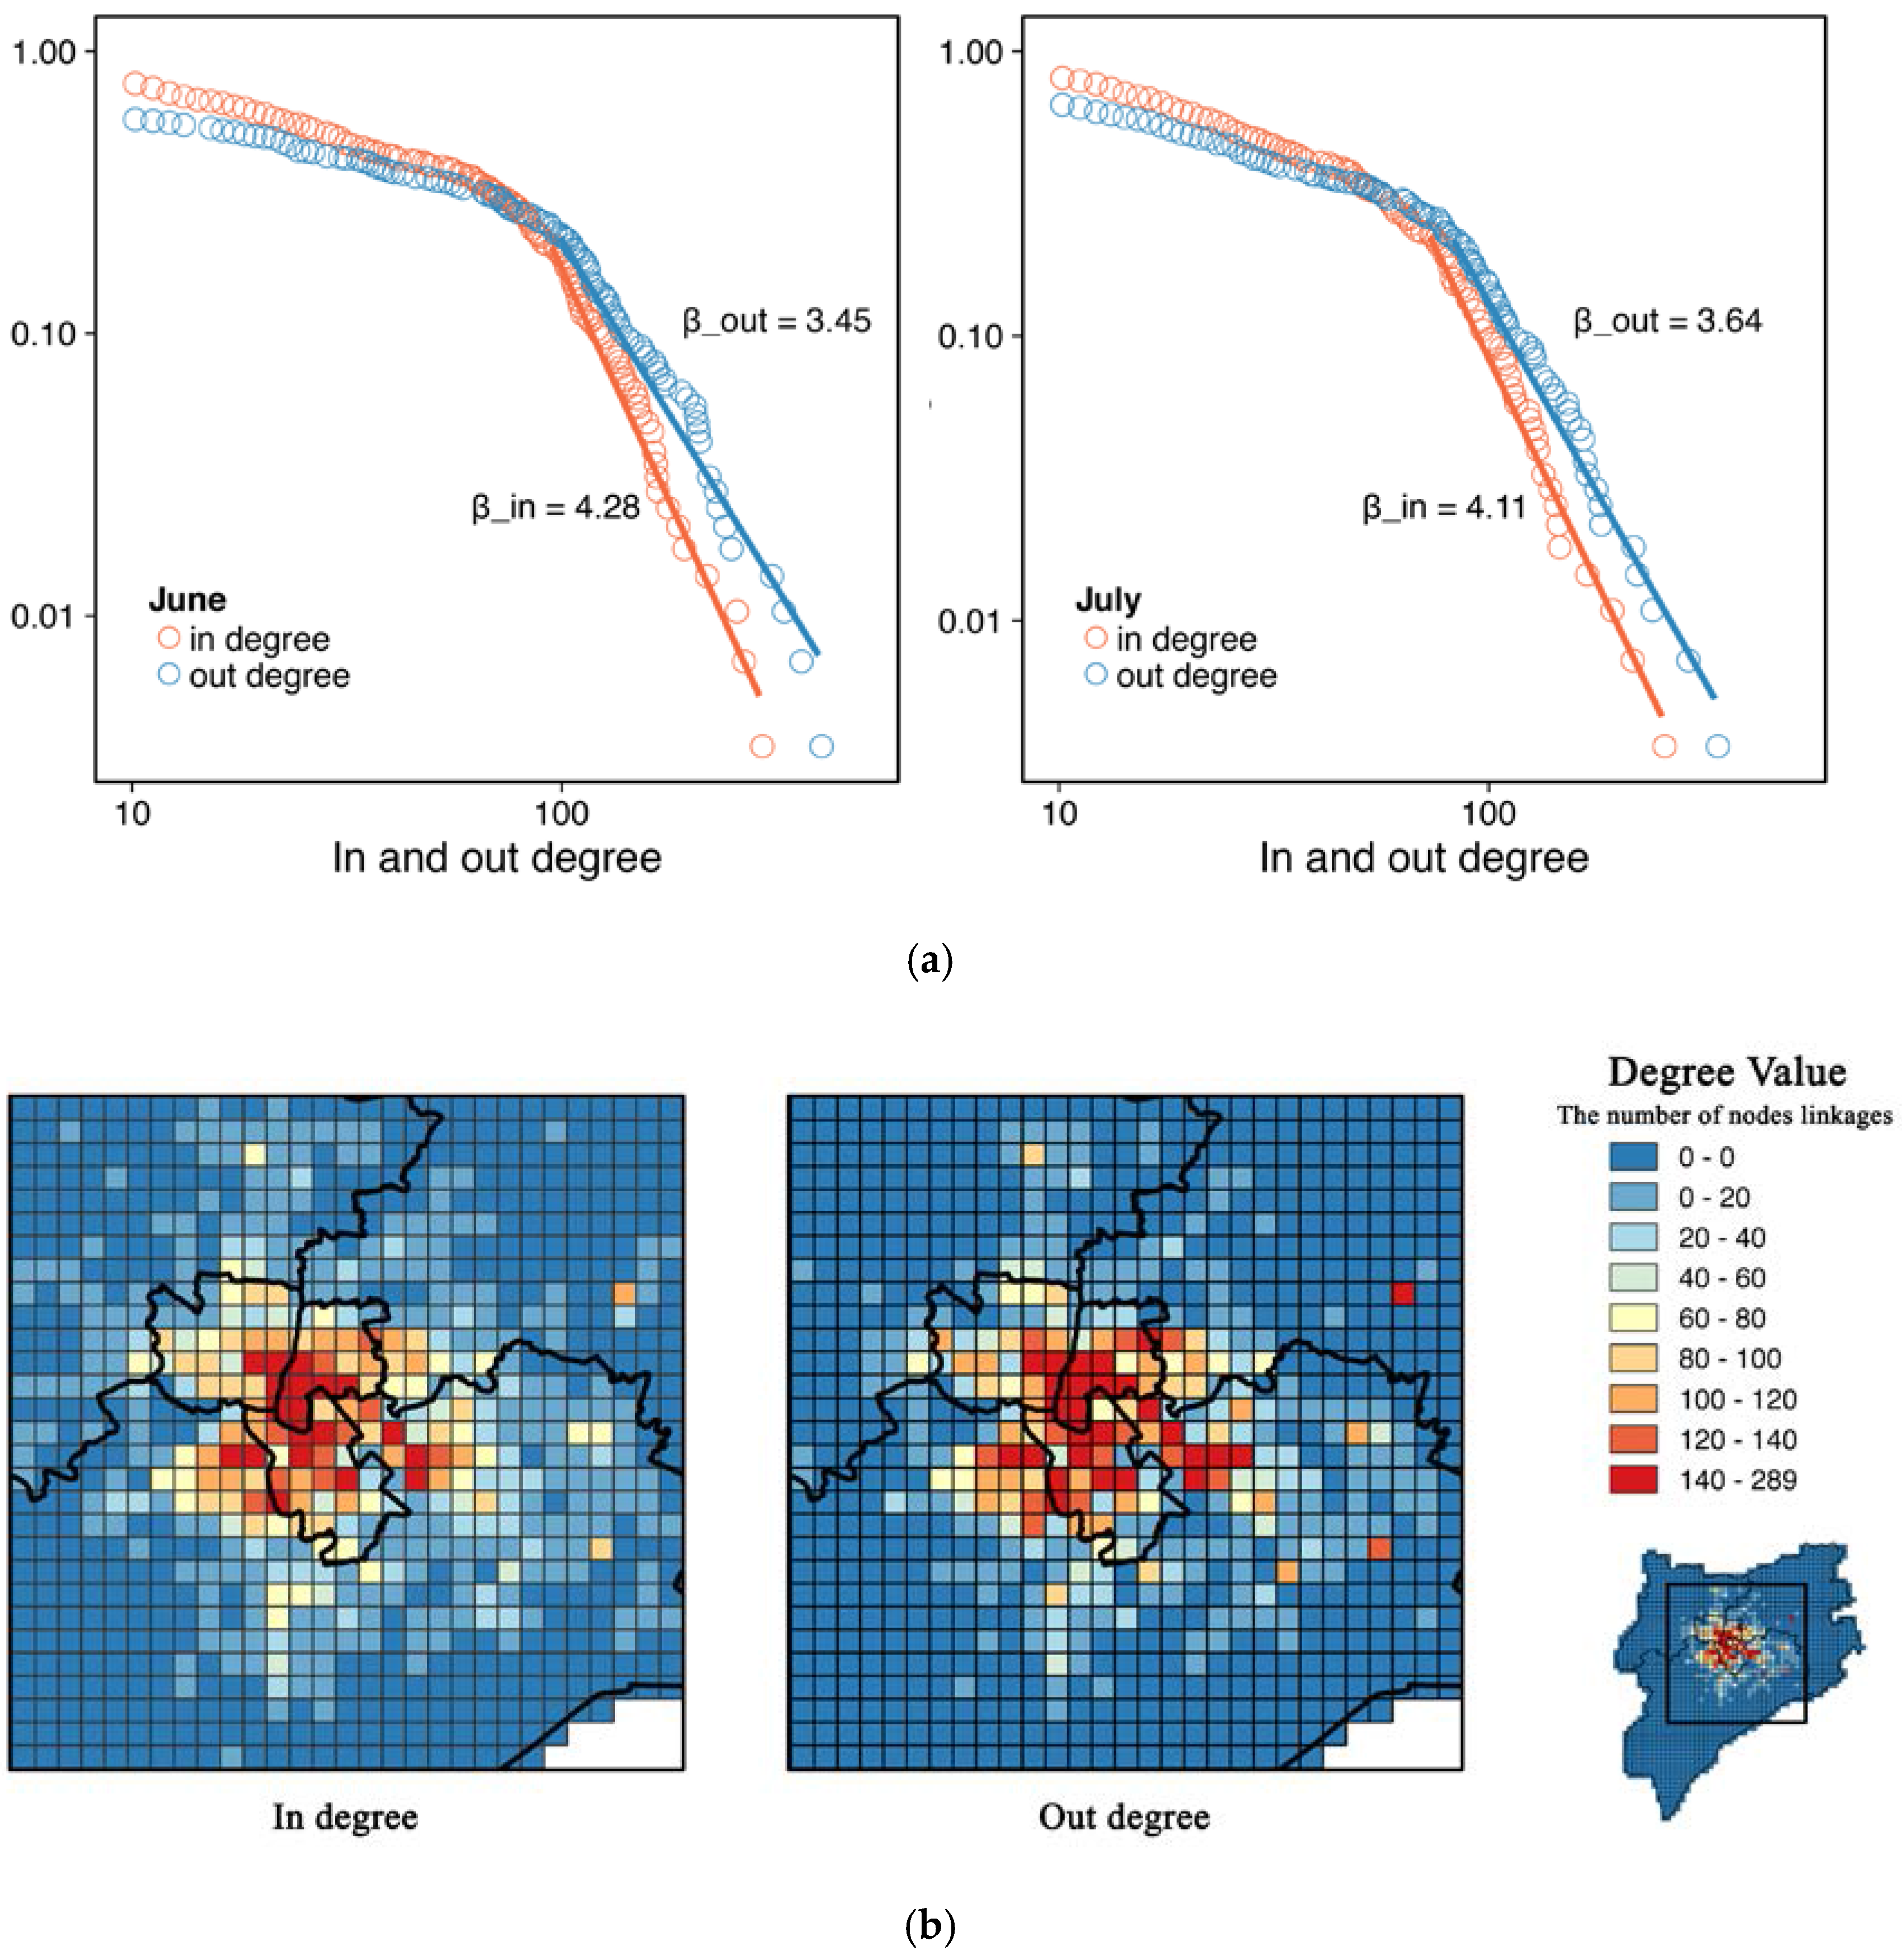
3.2. Subway Influence on Taxi Network Structure

We move our scope onto the taxi network in the entire urban area and examine the influence of subway on taxi network structure. Figure 5a shows the cumulative in- and out-degrees of the taxi network distributions before and after the subway was in use, and Figure 5b shows the geospatial distribution of in- and out-degrees values of nodes linkages of the taxi networks distributions before the subway was in use. As shown in previous research, degree distribution is one of the most important indicators for network structure [8]. In our case, the cumulative degree distributions of the taxi network are well fitted by power-law distribution, P ( d ) ~   d β , with β 4.28 and 3.45 for June in-degree and June out-degree respectively (the fitting method is the maximum likelihood estimation). We find that the July out-degree distribution increases to 3.64 after the subway’s opening, while the July in-degree decreases to 4.11 (Figure 5a), indicating that given the total volume of taxi ridership decreases after the subway’s opening, and the effects of the newly opened subway are also rippling through the travel patterns of taxis. In addition, spatial distributions of the in-degree and out-degree (Figure 5b) identifies that the intensity of the distribution of in- and out-degrees value decreases from the city center to the suburbs, which implies the mono-centric nature of Wuxi’s urban structure. We also identify hot spots from Figure 5b, such as Sanyang Square, Nanchansi and the train station. In addition, Sanyang Square was chosen as the interchange station with Line 2 in the following transportation construction, which may partially verify our conclusion.
When examining the subway’s impact on taxi trips, we also need to consider the changing volume of taxi pick-ups and drop-offs before and after the subway’s opening. In order to evaluate the balance between taxi pick-ups and drop-offs in each cell, we created an index, η , to represent the degree of balance for taxi pick-ups and drop-offs. η is equal to drop-off divided by pick-up:
η i =   D r o p i P i c k i ,
where D r o p i equals the number of drop-offs in cell i , and P i c k i equals the number of pick-ups in cell i . If pick-ups are equal to drop-offs, η will be equal to 1, which implies that the pick-up and drop-off of taxi trips are balanced in the selected area. Table 4 shows the statistical result of η based on Equation (1). However, we cannot directly compare numbers in Table 4, since cells with few trips may have very large or small η i factor, which may bias the result. In order to remove this effect and get the overall balance index, we calculate the overall balance factor η t o t a l by adding each cell’s trip percentage as weight:
η t o t a l =   i ( D r o p i + P i c k i )   ×   η i i ( D r o p i + P i c k i ) .
Based on Equation (2), the value of η t o t a l increases from 1.09 to 1.18 after the opening of subway Line 1, straying away from 1, inferring the increasingly unbalanced taxi pick-ups and drop-offs. These findings show that the opening of a new subway line may produce a certain decremental effect on the previous taxi trip pattern, e.g., spatial distribution of pick-ups and drop-offs.

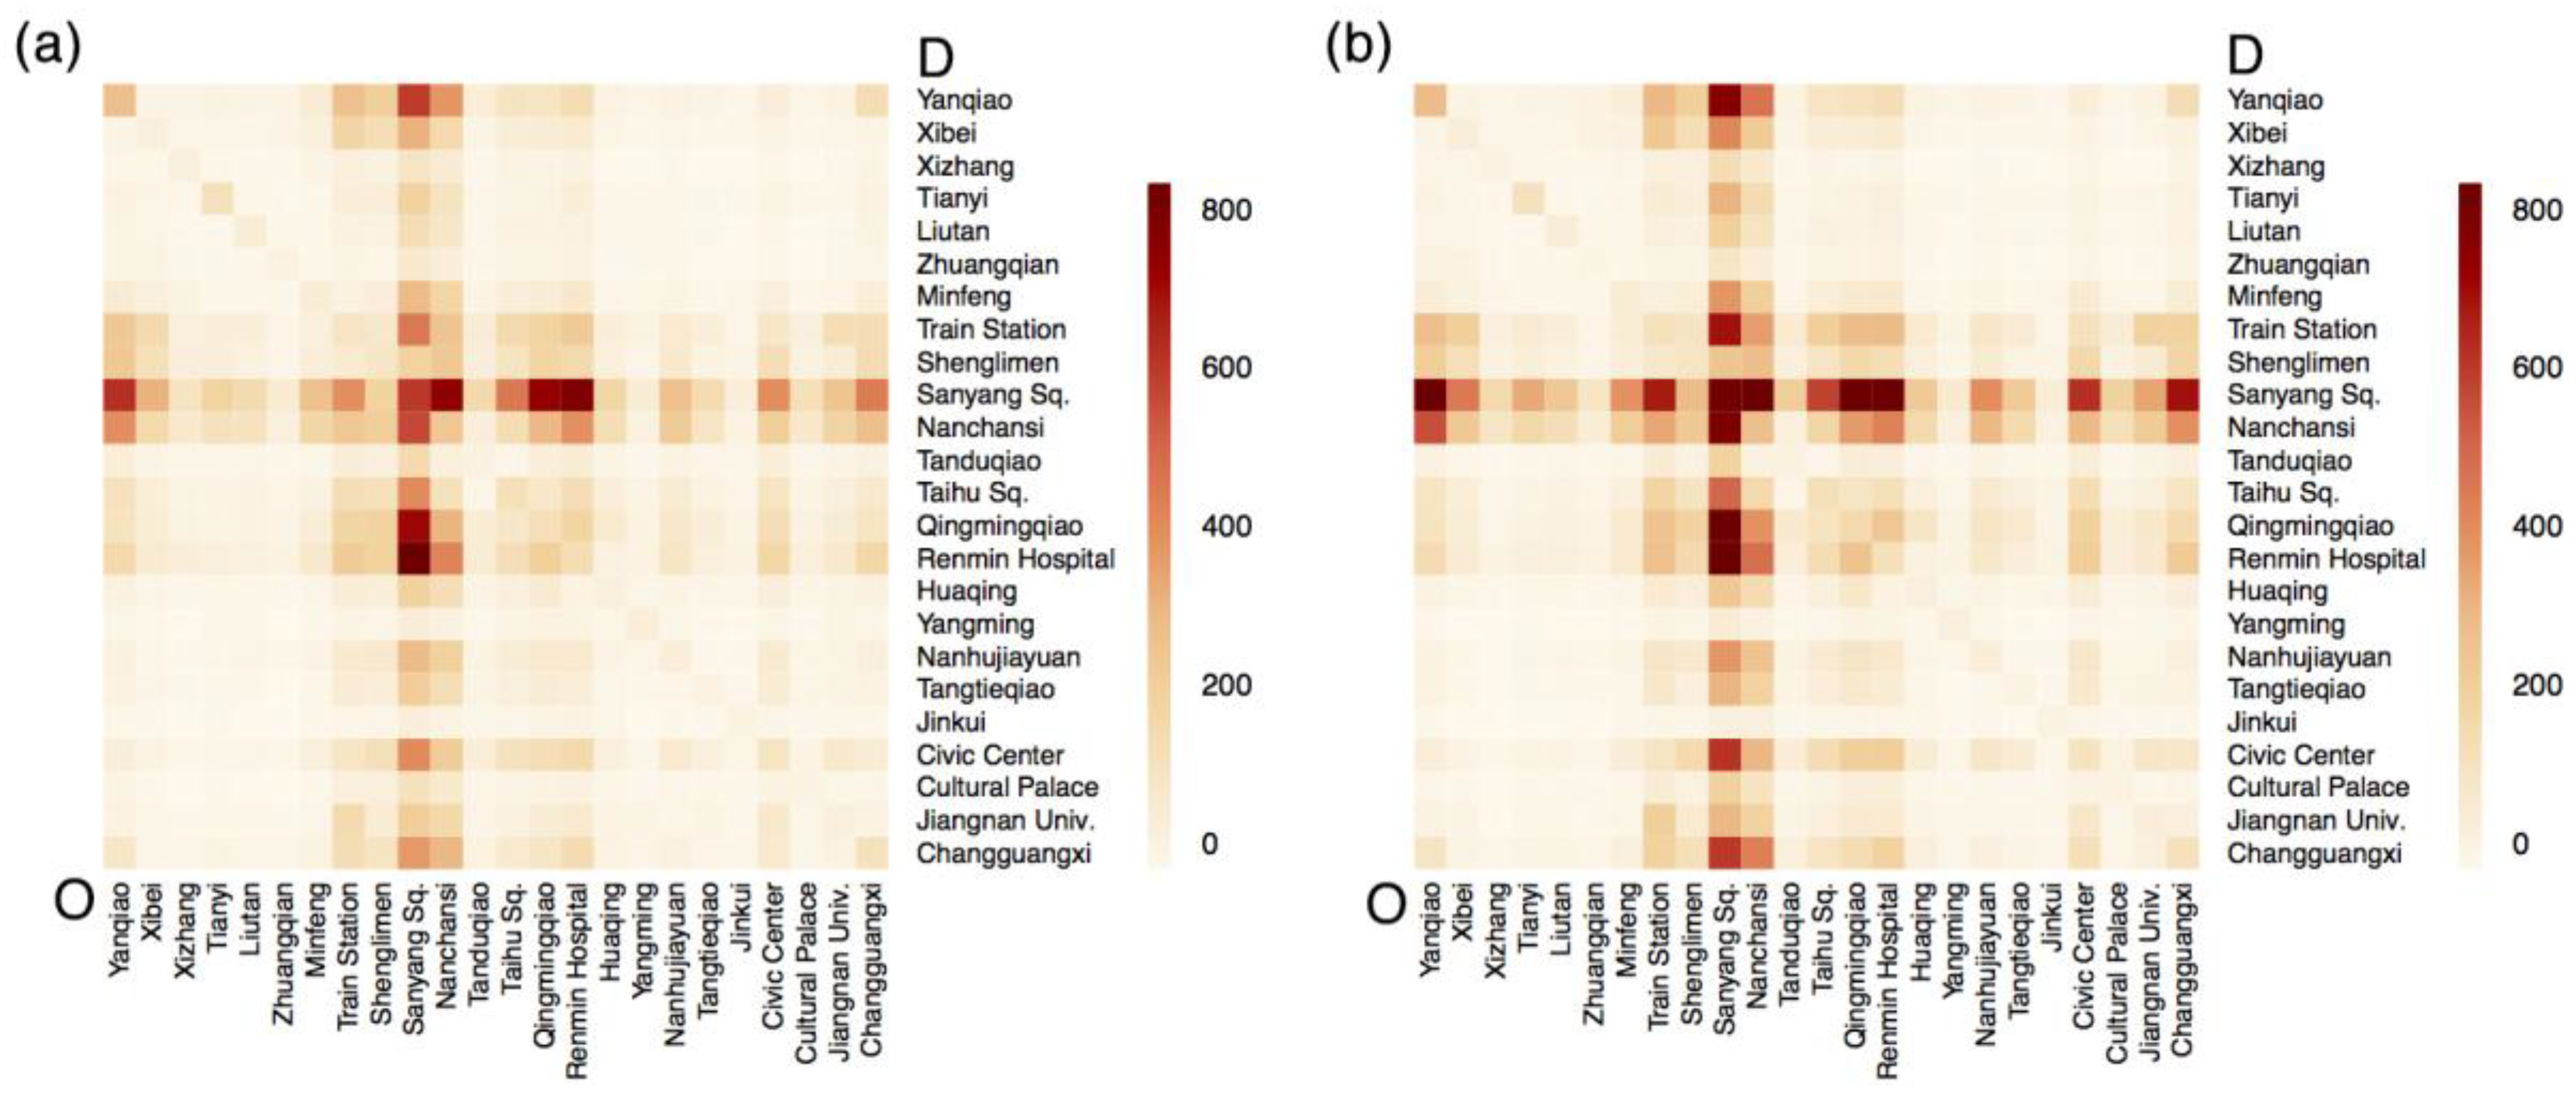
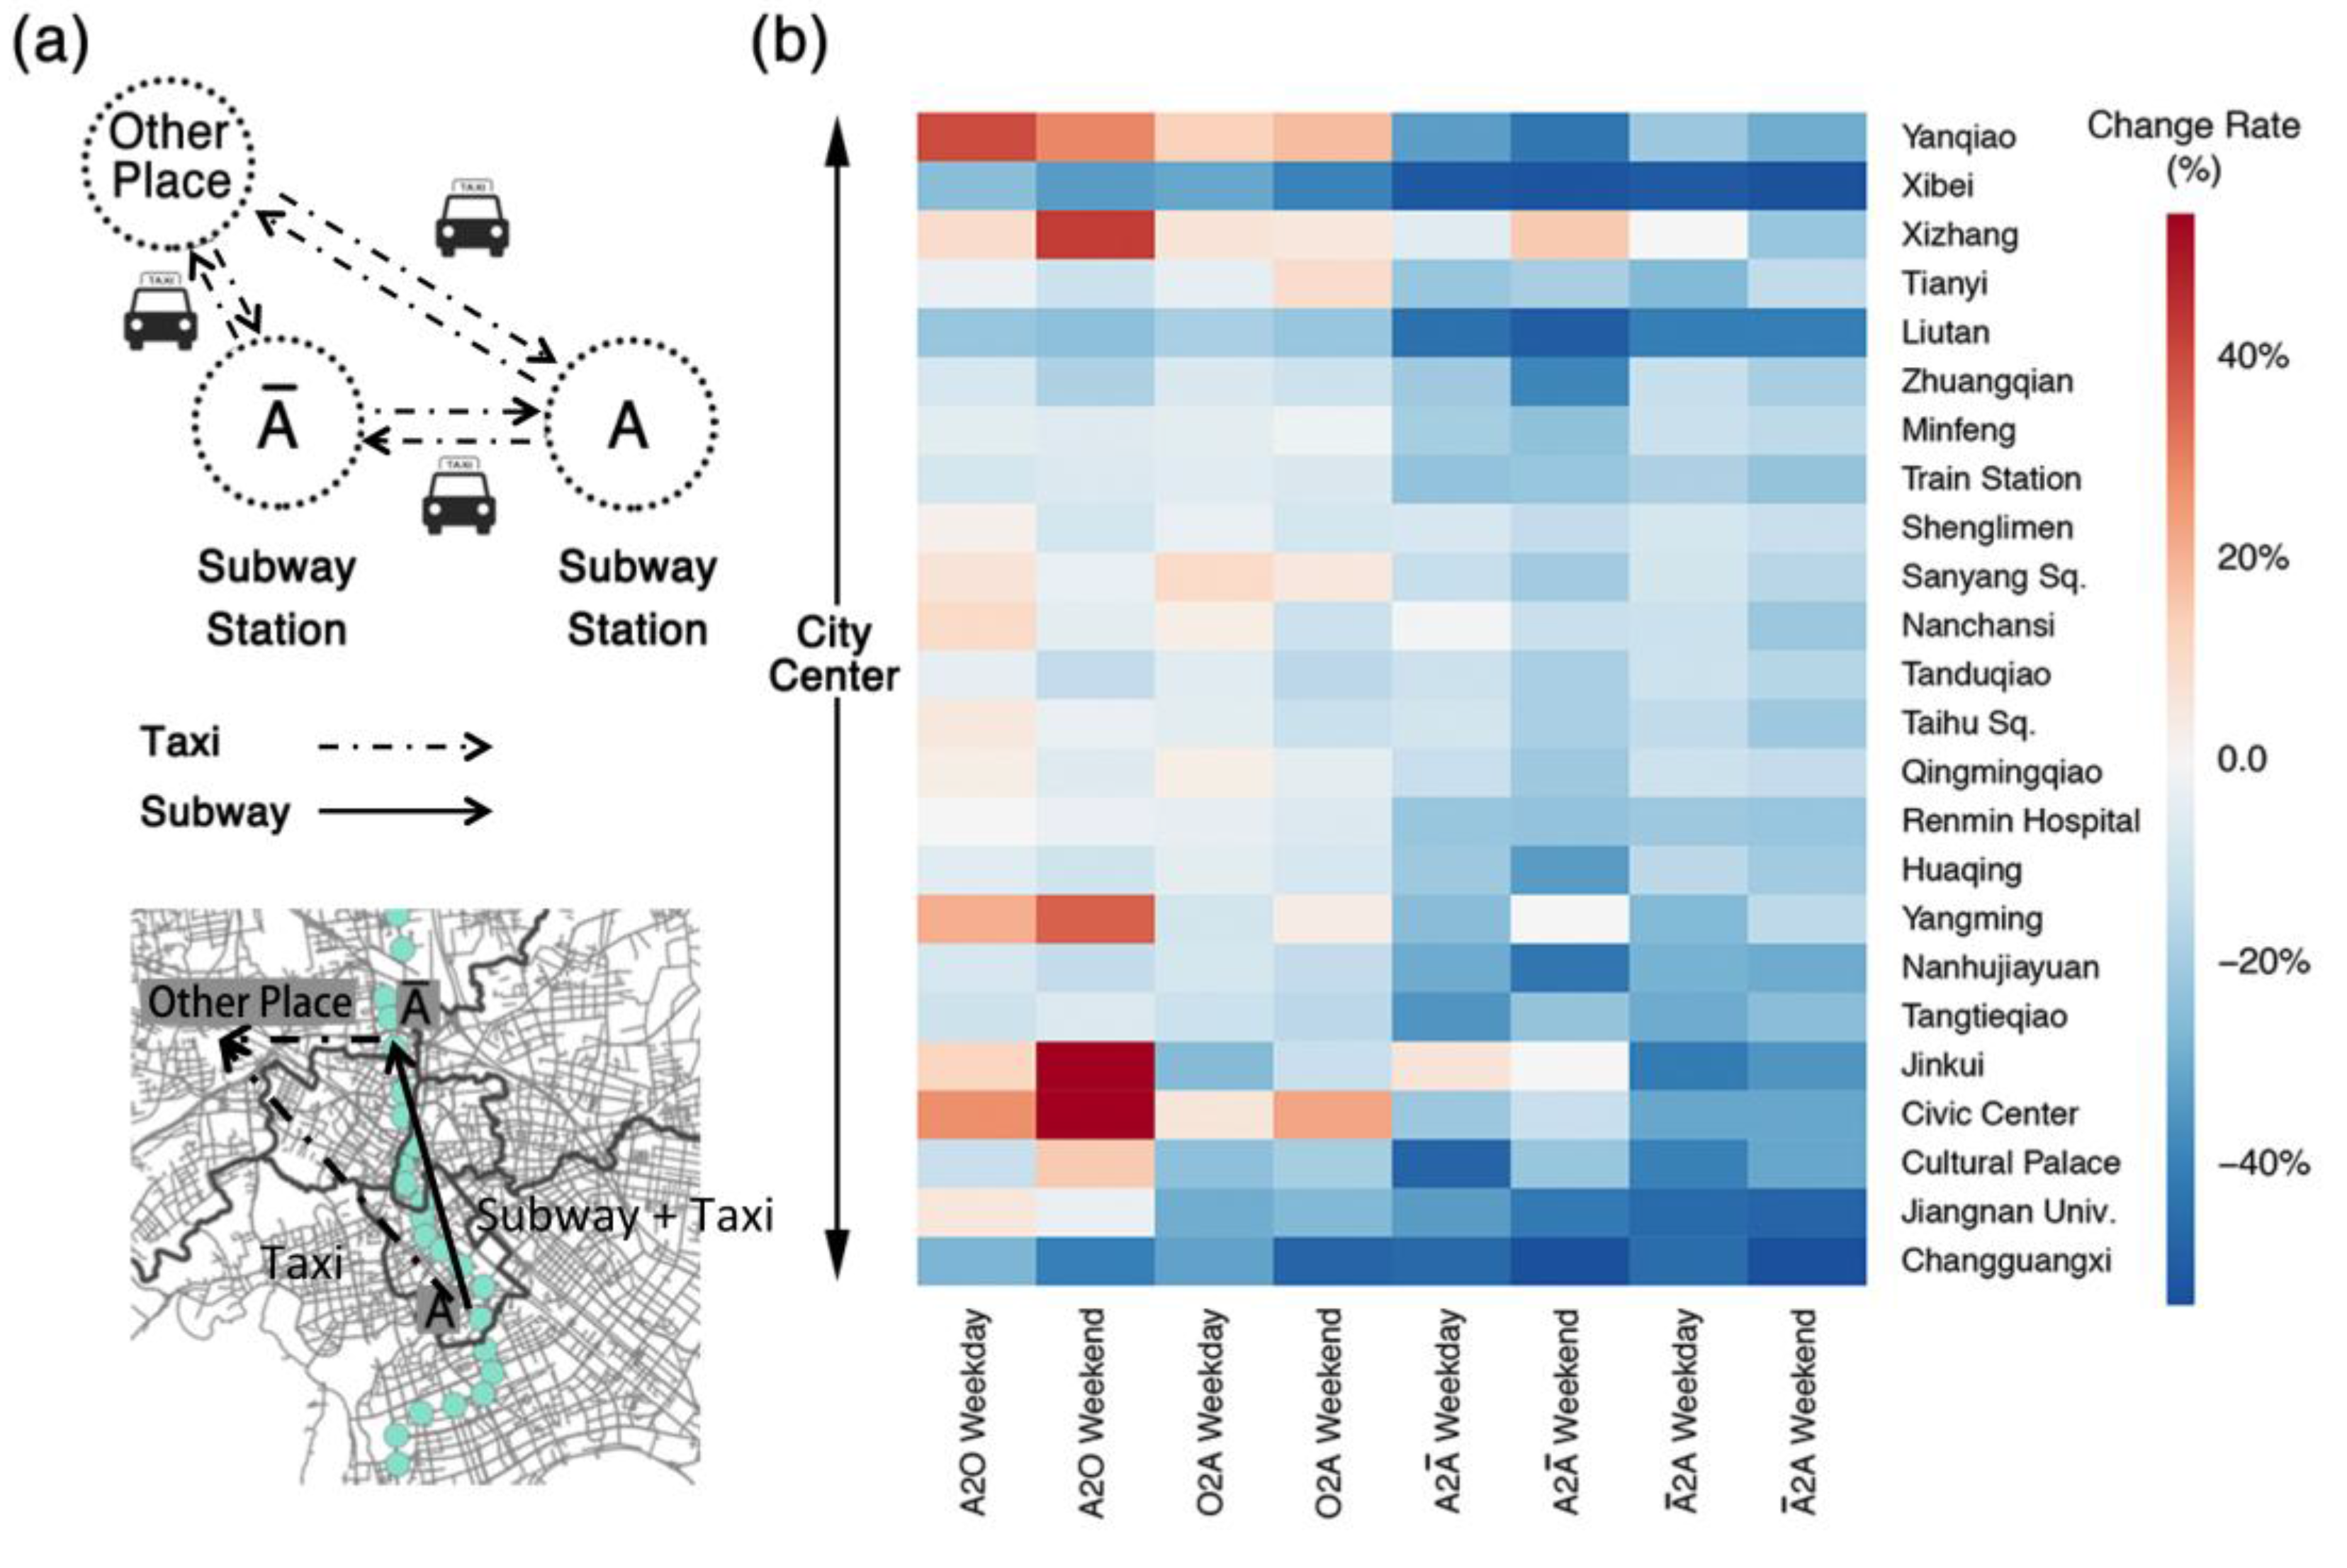
3.3. Subway Influence on Travel Patterns

After looking into the variation of taxi volume and pick-ups/drop-offs, we zoom into the variation of taxi travel patterns since the subway was put into use. Figure 6 summarizes the change rate of taxi ridership after the opening of subway Line 1. Figure 6a depicts the taxi O–D diagram. There are four modes: (i) A trip from other areas to a subway station (note as O 2 A ); (ii) A trip from a subway station to other areas ( A 2 O ); (iii) A trip from station A to all other stations ( A 2 A ¯ , where A ¯ represents the sum of all other stations except A); and (iv) A trip from all other stations to station A ( A ¯ 2 A ). The ridership change rate is shown in a heat map, Figure 6c, where the x-axis represents eight different travel modes (four modes times two time periods), the y-axis represents 24 stations, and the red and blue grids represent the rate of increase and decrease in ridership respectively. For example, the first column “A2O Weekday” is the ridership change rate of Mode i during the weekday.
Figure 6b shows that most of the taxi trip volume between stations drops dramatically, and the farther from the city center (Sanyang Square and Nanchansi), the greater the substitution effect of the subway (the color ranges from light blue to dark blue). Almost 40%–50% of the taxi volume between stations decreases in suburban areas, such as Xibei and Jiangnan University areas. Another important finding is that the closer to the station, the greater the substitution effect of the subway. The first four columns of Figure 6b represent ridership change rate between one station and other places, while the last four represent ridership change rate between stations. It is obvious that taxi ridership between subway stations declines much more than that of the first four columns. Interestingly, there is a general increase in the taxi trips between other areas and a subway station in the urban fringe (red box in Figure 6b), indicating that people may tend to use taxis as a connection between stations and other areas without subway service, covering the last mile of their trips. Figure 6a depicts a possible scenario to explain this travel behavior, showing the preference that people will cover most of their travel demand by subway while only using taxi for the last mile connection.

4. Discussions and Conclusions

This study quantitatively examines the impact of the first and newly opened subway on taxi trips, using the combination of emerging taxi GPS trajectory and subway transaction records, which can lead to a deeper understanding of human mobility and sustainable urban development as well as provide informative insights in population movement and urban configuration. We calculate the subway network and evaluate its impact on the surrounding taxi volume and analyze the influence of the subway on the taxi network structure (pick-ups and drop-offs) by defining an index to analyze the taxi imbalance issue within the city. Further, we divide the taxi trips into four modes to see where the subway impacted taxi ridership. Finally, from our findings we conclude that the farther away from the city center, the greater the impact; the closer to the subway station, the greater the impact; and we find that not all taxi ridership decreased but in fact increased in some locations, which was explained with analysis.
We identify that there is more subway ridership on weekends than on weekdays. One reason, from the demand side, is that people are more flexible and willing to take the subway over a taxi during weekends, since punctuality on weekends is not as crucial as it is for fixed business hours on weekdays. The other reason, from the service side, is that the new subway Line 1 serves a corridor mainly along more consumption-oriented places rather than job-oriented places, from the city center extending to the northern and southern parts of the suburbs. Therefore, this ridership pattern may demonstrate the variability in travel behavior within a week resulting from work–home separation.
When examining the interactions between subway and taxi in a spatial dimension, we notice the farther from the city center, the greater the substitution effect is of the subway. In addition, the taxi trip volume decreases most drastically between each O–D pair if they are both close to subway stations, which could be a reduction of 40%–50% in most suburb areas within 1 km of the subway line corridor. There is a substantial shift in the taxi volume and trip pattern within a 1 km radius of the subway line along the whole subway line. Thus, the introduction of a new subway is expected to considerably upgrade public transport within the influence area it serves. On the other hand, the connection between subway stations in the suburbs and other areas of the city without subway services shows an inverse result. People who used to take a taxi for their daily commute now choose to take the combination of subway and taxi, by using a taxi to cover the last mile to their destination, which is a way of maximizing travel efficiency and cost effectiveness. However, the volume of subway ridership is much larger than the decrease of the volume of taxi ridership, indicating a latent influence upon other means of transportation from the subway.
From the result of taxi trips’ O–D density in the travel distribution and the distance effect of distribution, we come up with the conclusion that Wuxi is a mono-centric city. The spatial distribution of taxi trip density coincides with the location of subway stations, revealing the most popular destinations in the central city. The city center shows a very high concentration of taxi trips compared to the urban fringe. People who live in places far from the city center generate large amounts of travel flow and they come to the nearest subway station by taxi for cheaper long-distance travel. Suburban areas that contain transfer facilities such as subway stations have the potential to be developed into sub-commercial centers. Thus, some long-distance trips could be turned into short local trips by encouraging densification and diversification of station neighborhoods in the suburban areas. Nevertheless, the distance decay effect makes the spatial distribution of the trips more concentrated. The farther the cell is from the city center, the lower the density of its taxi trips. This also suggests that although the subway might have impacts on the taxi ridership in the region close to subway line, taxi is still a crucial alternative for people to satisfy their travel demands properly. Transport connectivity is critical over wider spatial ranges in determining subway ridership.
From a policy perspective, this study may suggest several policy implications in aspects of urban planning for sustainable urbanization. Promoting more sustainable patterns of urban development is also crucial for improving the subway ridership of cities but the appropriateness of different forms of development is context-dependent. There is increasing recognition that combinations (or packages) of measures are necessary. Certain combinations of policies can work together and give rise to synergies, leading to more sustainable urban transport. Finally, caution is advised both in terms of the appropriateness and effectiveness of policy solutions being transferred. This study also has practical implications for urban planning and management, which contributes to a better understanding of people’s travel behavior and ways to balance the demand between subway ridership and taxi trips. Moderate interventions by spatial planning could improve subway ridership and efficiency for sustainable urbanization. The future development of subway systems should include new subway lines that have a greater focus on the outer suburbs where public transport dependent people are concentrated. This would be beneficial for peripheral residents who have less capacity to adjust their housing locations to secure connectivity to the city center through the subway.
Moreover, a promising direction is to utilize datasets with regard to human movements associating subway and taxi usages. This can broaden the literature of human mobility, origin–destination estimation, emerging data and public transit analysis [37,38,39,40,41,42]. The findings would provide an objective bottom-up view to depict human mobility as well as new insights for traffic optimization and urban transport planning policy. In future research, it is reasonable to investigate the urban form according to land use and expand the data source to include private car and bus to explore the pathways underlying the effects of the subway line. By comparing the change in points of interest composition along the subway line, we will receive a more detailed and explicit picture of a new subway’s impact on human mobility.

Supplementary Materials

The following are available online at www.mdpi.com//2071-1050/9/2/242/s1, Table S1: Daily number of taxi trips in different time periods; Table S2: Total daily taxi volume around the subway station; Table S3: Taxi pick-ups and drop-offs (weekday) in April and September.

Acknowledgements

We would like to extend our thanks to National Science Foundation (1416509, 1535031, 1637242) and National Natural Science Foundation of China (41329001).

Author Contributions

Miaoyi Li and Lei Dong contributed equally to this work; Miaoyi Li and Lei Dong designed the experiments; Miaoyi Li preprocessed the data; Lei Dong analyzed the data and prepared the figures; Miaoyi Li, Lei Dong, Wei Lang wrote the manuscript; Zhenjiang Shen and Xinyue Ye contributed some ideas for this research; Xinyue Ye revised the manuscript.

Conflicts of Interest

The authors declare no conflict of interest.

References

  1. Markovich, J.; Lucas, K. The Social and Distributional Impacts of Transport: A Literature Review; Working Paper; Transport Studies Unit School of Geography and the Environment, University of Oxford: Oxford, UK, 2011. [Google Scholar]
  2. Cervero, R. Mixed land-uses and commuting: Evidence from the American Housing Survey. Transp. Res. Part A: Policy Pract. 1996, 30, 361–377. [Google Scholar] [CrossRef]
  3. Liu, X.; Gong, L.; Gong, Y.; Liu, Y. Revealing travel patterns and city structure with taxi trip data. J. Transp. Geogr. 2015, 43, 78–90. [Google Scholar] [CrossRef]
  4. Kang, C.; Sobolevsky, S.; Liu, Y.; Ratti, C. Exploring human movements in Singapore: A comparative analysis based on mobile phone and taxicab usages. In Proceedings of the 2nd ACM SIGKDD International Workshop on Urban Computing, New York, NY, USA, 11 August 2013.
  5. Lin, D.; Allan, A.; Cui, J. Exploring Differences in Commuting Behaviour among Various Income Groups during Polycentric Urban Development in China: New Evidence and Its Implications. Sustainability 2016, 8, 1188. [Google Scholar] [CrossRef]
  6. Kain, J.F.; Liu, Z. Secrets of success: assessing the large increases in transit ridership achieved by Houston and San Diego transit providers. Trans. Res. Part A: Policy Pract. 1999, 33, 601–624. [Google Scholar] [CrossRef]
  7. Yuan, Y.; Raubal, M.; Liu, Y. Correlating mobile phone usage and travel behavior–A case study of Harbin, China. Comput. Environ. Urban Syst. 2012, 36, 118–130. [Google Scholar] [CrossRef]
  8. Barthélemy, M. Spatial networks. Phys. Rep. 2011, 499, 1–101. [Google Scholar] [CrossRef]
  9. Kivelä, M.; Arenas, A.; Barthelemy, M.; Gleeson, J.P.; Moreno, Y.; Porter, M.A. Multilayer networks. J. Complex Netw. 2014, 2, 203–271. [Google Scholar] [CrossRef]
  10. Liu, Y.; Wang, F.; Xiao, Y.; Gao, S. Urban land uses and traffic ‘source-sink areas’: Evidence from GPS-enabled taxi data in Shanghai. Landsc. Urban Plan. 2012, 106, 73–87. [Google Scholar] [CrossRef]
  11. Knowles, R.D. Transport impacts of Greater Manchester's Metrolink light rail system. J. Trans. Geogr. 1996, 4, 1–4. [Google Scholar] [CrossRef]
  12. Kim, S.; Ulfarsson, G.F.; Hennessy, J.T. Analysis of light rail rider travel behavior: impacts of individual, built environment, and crime characteristics on transit access. Trans. Res. Part A: Policy Pract. 2007, 41, 511–522. [Google Scholar] [CrossRef]
  13. Stopher, P.R.; Greaves, S.P. Household travel surveys: Where are we going? Trans. Res. Part A: Policy Pract. 2007, 41, 367–381. [Google Scholar] [CrossRef]
  14. Mackett, R.L.; Edwards, M. The impact of new urban public transport systems: Will the expectations be met? Trans. Res. Part A: Policy Pract. 1998, 32, 231–245. [Google Scholar] [CrossRef]
  15. Yang, H.; Lau, Y.W.; Wong, S.C.; Lo, H.K. A macroscopic taxi model for passenger demand, taxi utilization and level of services. Transportation 2000, 27, 317–340. [Google Scholar] [CrossRef]
  16. Brög, A.R.G. Old State, new society: Indonesia’s new order in comparative historical perspective. J. Asian Stud. 1983, 42, 477–496. [Google Scholar]
  17. Harvey, D. The New Imperialism; Oxford University Press: New York, NY, USA, 2003. [Google Scholar]
  18. Battellino, H.; Peachman, J. The joys and tribulations of a continuous survey. In Transport Survey Quality and Innovation; Emerald: Kruger National Park, South Africa, 2003; pp. 49–68. [Google Scholar]
  19. Willumsen, L.G. Estimation of an OD Matrix from Traffic Counts–A Review; Institute of Transport Studies; University of Leeds: Leeds, UK, 1978; Working paper 99. [Google Scholar]
  20. Zhou, X.; Mahmassani, H.S. Dynamic origin-destination demand estimation using automatic vehicle identification data. IEEE Trans. Intell. Transp. Syst. 2006, 7, 105–114. [Google Scholar]
  21. Lou, Y.; Yin, Y. A decomposition scheme for estimating dynamic origin–destination flows on actuation-controlled signalized arterials. Transp. Res. Part C: Emerg. Technol. 2010, 18, 643–655. [Google Scholar] [CrossRef]
  22. Calabrese, A.; Costa, R.; Menichini, T. Using Fuzzy AHP to manage Intellectual Capital assets: An application to the ICT service industry. Expert Syst. Appl. 2013, 40, 3747–3755. [Google Scholar] [CrossRef]
  23. Chen, C.; Bian, L.; Ma, J. From traces to trajectories: How well can we guess activity locations from mobile phone traces? Transp. Res. Part C: Emerg. Technol. 2014, 46, 326–337. [Google Scholar] [CrossRef]
  24. Long, Y.; Lang, W. Fine-scale human settlement studies of China in the new data environment. J. Urban Reg. Plan. 2016, 8, 10–32. [Google Scholar]
  25. Batty, M. The New Science of Cities; Mit Press: Cambridge, MA, UK, 2013. [Google Scholar]
  26. Chowdhury, D.; Santen, L.; Schadschneider, A. Statistical physics of vehicular traffic and some related systems. Phys. Rep. 2000, 329, 199–329. [Google Scholar] [CrossRef]
  27. Cichocki, A.; Zdunek, R.; Phan, A.H.; Amari, S.I. Nonnegative Matrix and Tensor Factorizations: Applications to Exploratory Multi-Way Data Analysis and Blind Source Separation; John Wiley & Sons: West Sussex, UK, 2009. [Google Scholar]
  28. Ciscal-Terry, W.; Dell'Amico, M.; Hadjidimitriou, N.S.; Iori, M. An analysis of drivers route choice behaviour using GPS data and optimal alternatives. J. Trans. Geogr. 2016, 51, 119–129. [Google Scholar] [CrossRef]
  29. Fan, Z.; Song, X.; Shibasaki, R. CitySpectrum: A non-negative tensor factorization approach. In Proceedings of the 2014 ACM International Joint Conference on Pervasive and Ubiquitous Computing, New York, NY, USA, 13 September 2014.
  30. Gonzalez, M.C.; Hidalgo, C.A.; Barabasi, A.L. Understanding individual human mobility patterns. Nature 2008, 453, 779–782. [Google Scholar] [CrossRef] [PubMed]
  31. Schneider, C.M.; Belik, V.; Couronné, T.; Smoreda, Z.; González, M.C. Unravelling daily human mobility motifs. J. R. Soc. Interface 2013, 10, 20130246. [Google Scholar] [CrossRef] [PubMed]
  32. Ratti, C.; Frenchman, D.; Pulselli, R.M.; Williams, S. Mobile landscapes: using location data from cell phones for urban analysis. Environ. Plan. B: Plan. Des. 2006, 33, 727–748. [Google Scholar] [CrossRef]
  33. Kwan, M.P. Interactive geovisualization of activity-travel patterns using three-dimensional geographical information systems: A methodological exploration with a large data set. Transp. Res. Part C: Emerg. Technol. 2000, 8, 185–203. [Google Scholar] [CrossRef]
  34. Wolf, J.; Loechl, M.; Thompson, M.; Arce, C. Trip rate analysis in GPS-enhanced personal travel surveys. In Transport Survey Quality and Innovation; Elsevier Science: Oxford, Kruger Park, South Africa, 2013; Volume 28, pp. 483–498. [Google Scholar]
  35. Bohte, W.; Maat, K. Deriving and validating trip purposes and travel modes for multi-day GPS-based travel surveys: A large-scale application in The Netherlands. Transp. Res. Part C: Emerg. Technol. 2009, 17, 285–297. [Google Scholar] [CrossRef]
  36. Pojani, D.; Stead, D. Sustainable urban transport in the developing world: Beyond megacities. Sustainability. 2015, 7, 7784–7805. [Google Scholar] [CrossRef]
  37. Huang, X.; Zhao, Y.; Yang, J.; Zhang, C.; Ma, C.; Ye, X. TrajGraph: A graph-based visual analytics approach to studying urban network centralities using taxi trajectory data. Vis. Comput. Graph. 2016, 22, 160–169. [Google Scholar] [CrossRef] [PubMed]
  38. Chong, Z.; Qin, C.; Ye, X. Environmental regulation, economic network and sustainable growth of urban agglomerations in China. Sustainability 2016, 8, 467. [Google Scholar] [CrossRef]
  39. Wang, Y.; Wang, T.; Ye, X.; Zhu, J.; Lee, J. Using social media for emergency response and urban sustainability: A case study of the 2012 Beijing rainstorm. Sustainability 2016, 8, 25. [Google Scholar] [CrossRef]
  40. Zhang, F.; Zheng, Y.; Xu, D.; Du, Z.; Wang, Y.; Liu, R.; Ye, X. Real-time spatial queries for moving objects using storm topology. ISPRS Int. J. Geo-Inf. 2016. [Google Scholar] [CrossRef]
  41. Al-Dohuki, S.; Kamw, F.; Zhao, Y.; Ma, C.; Wu, Y.; Yang, J.; Ye, X.; Wang, F.; Li, X.; Chen, W. SemanticTraj: A~new approach to interacting with massive taxi Trajectories. IEEE Trans. Vis. Comput. Graph. 2017, 23, 11–20. [Google Scholar] [CrossRef] [PubMed]
  42. Ye, X.; Huang, Q.; Li, W. Integrating big social data, computing, and modeling for spatial social science. Cartogr. Geogr. Inf. Sci. 2016. [Google Scholar] [CrossRef]
Figure 1. The Wuxi study area and the subway stations (green dots).
Sustainability 09 00242 g001
Figure 2. Illustration of network construction. Boxes 1–4 represent four nodes, and gray arrows represent four direct edges, number on each arrow represents the traffic volume.
Sustainability 09 00242 g002
Figure 3. Subway O–D matrix; the order of stations is organized as the spatial sequence along Line 1. (a) Weekday; (b) Weekend.
Sustainability 09 00242 g003
Figure 4. Comparison of taxi and subway ridership.
Sustainability 09 00242 g004
Figure 5. (a) Cumulative degree distribution of spatial connections in nodes linkages of taxi networks before and after the opening of the subway. Left: June cumulative in- and out-degree distribution (log-log); right: July cumulative in- and out-degree distribution (log-log). The straight line in each graph is the power-law fitting line; (b) Geographical distribution of in-degree (left) and out-degree (right) before the opening of the subway. Left: June in-degree distribution; right: June out-degree distribution. (All colors are in the same scale). The degree value is the number of nodes (not edge) linkages rather than O-D counts numbers, which denotes the degree of spatial connection.
Sustainability 09 00242 g005
Figure 6. Taxi ridership patterns. (a) Taxi O–D diagram. A to O(A2O) means from station A to Other place by taxi, O to A(O2A) means from other place to station A by taxi, A to A ¯ (A2 A ¯ ) means from station A to A ¯ by taxi, A ¯ to A ( A ¯ 2A) means from station A ¯ to A by taxi, where A ¯ represents the sum of all other stations except A; People may choose subway + taxi for longer distance trips after the opening of subway; (b) The heat map of taxi volume variations. X-axis represents eight different travel modes (four modes mentioned above (a), two time periods are Weekday and Weekend). Y-axis represents 24 stations, with Sanyang Square and Nanchansi being the urban central areas. The red and blue indicate increasing and decreasing rates respectively.
Sustainability 09 00242 g006
Table 1. Daily number of taxi trips in different time periods.
DateJune WeekdayJune WeekendJuly WeekdayJuly Weekend
Count136,135144,036130,839134,107
Table 2. Basic network statistics based on taxi GPS data in Wuxi.
Number of NodesNumber of EdgesAverage Edge Volume
June weekday40414,9027.02
June weekend40715,9107.16
July weekday40512,1687.77
July weekend41612,9297.86
Table 3. Total daily taxi and subway volume.
Before Subway OpenAfter Subway Open
WeekdayWeekendWeekdayWeekend
Taxi8860 (202) *9245 (182)7680 (116)7435 (420)
Subway--41,000 (3066)50,528 (8086)
* Note: Number within brackets is standard error.
Table 4. Taxi pick-ups and drop-offs (weekday) before and after the subway’s opening.
MinimumMedianMeanMaximum
Before0.371.632.4816.00
After0.251.512.8781.00

