Article

Energy Consumption Analysis for Concrete Residences—A Baseline Study in Taiwan

Department of Civil and Ecological Engineering, I-Shou University, Kaohsiung 84001, Taiwan
*
Author to whom correspondence should be addressed.
Sustainability 2017, 9(2), 257; https://doi.org/10.3390/su9020257
Submission received: 1 December 2016 / Revised: 6 February 2017 / Accepted: 7 February 2017 / Published: 12 February 2017

Abstract

:
Estimating building energy consumption is difficult because it deals with complex interactions among uncertain weather conditions, occupant behaviors, and building characteristics. To facilitate estimation, this study employs a benchmarking methodology to obtain energy baseline for sample buildings. Utilizing a scientific simulation tool, this study attempts to develop energy consumption baselines of two typical concrete residences in Taiwan, and subsequently allows a simplified energy consumption prediction process at an early design stage of building development. Using weather data of three metropolitan cities as testbeds, annual energy consumption of two types of modern residences are determined through a series of simulation sessions with different building settings. The impacts of key building characteristics, including building insulation, air tightness, orientation, location, and residence type, are carefully investigated. Sample utility bills are then collected to validate the simulated results, resulting in three adjustment parameters for normalization, including ‘number of residents’, ‘total floor area’, and ‘air conditioning comfort level’, for justification of occupant behaviors in different living conditions. Study results not only provide valuable benchmarking data serving as references for performance evaluation of different energy-saving strategies, but also show how effective extended building insulation, enhanced air tightness, and prudent selection of residence location and orientation can be for successful implementation of building sustainability in tropical and subtropical regions.

1. Introduction

Sustainable development and reduction of energy consumption have been the center of attention in many countries due to the joint effects of climate change, urban heat island effect, rising cost of energy, and environmental concerns [1]. Among all energy consumers, buildings are responsible for over 30% of global energy consumption, and are considered one of the largest energy consumers in modern society [2]. A substantial proportion of building energy consumption comes from the heating, ventilation, and air conditioning systems to enhance indoor thermal comfort [3]. Various modeling studies have predicted that heating, ventilation, and air conditioning system energy demand will rise significantly in the near future due to global warming and increased living standards in metropolitan areas [4].
Many researchers have examined regional builiding energy consumptions from different parts of the world, and they have provided valuable information to estimate future sustainable trends [2]. China is the most researched nation for its rising economy and ever-growing energy demands. Case studies with statistical data and/or real-time measurement in Beijing, Shanghai, Guangzhou, Chongqing, Changsha, and Hong Kong have been conducted to identify localized energy consumption patterns and corresponding energy-saving strategies [5,6,7,8,9,10,11,12,13,14]. A recent study by Berardi [2] conducts a cross-nation comparison of building energy consumption and shows that the total building energy consumptions in BRIC (Brazil, Russia, India, and China) countries has already surpassed those in developed countries, which creates an urgent need to promote building energy efficiency policies in these countries. The study also suggests that appropriate policies coherent with local energy demand patterns are required to achieve substantial building energy reduction.
Taiwan started to adopt residential building energy standards in 1997, presenting an official commitment to achieve sustainable development. These national standards are mandatory for a obtaining building permit so that they are profoundly implemented in practice. The standards primarily cover the performance of the building envelope with U-factor requirements in thermal conductivity for the roof and walls, and a Req index (Ratio of Equivalent Transparency Index) for fenestration. According to the standards, the following three basic code requirements have to be observed:
Uar (average U-factor of roof) < 1.0 W/(m2·K)
Uaw (average U-factor of wall) < 3.5 W/(m2·K)
Req < Reqs (baseline)
where Reqs is region specific and is set at 13% in north, 15% in middle, and 18% in south.
In addition to the mandatory building energy standards, the Taiwan government has also proposed a voluntary green building certification system called EEWH (Ecology, Energy, Waste Reduction, and Health), as a more aggressive sustainability-driving program. However, voluntary compliance of EEWH has had little commercial success due to limited understanding of the possible benefits frm the program.
To implement extra energy-efficiency strategies, stakeholders need to estimate energy consumption of each strategy so that they can understand what level of savings can be achieved. However, estimating building energy consumption is difficult because it deals with complex interactions among uncertain weather conditions, occupant behaviors, and building characteristics. 3D simulation tools employing robust physical principles can be used for estimation purposes, but collection and operation of detailed parameters in 3D modeling are time-consuming and cost inefficient at an early stage of building development [15]. Furthermore, due to a lack of precise building and environment parameters and uncertainties of occupant behaviors, discrepancy between data inputs and real situations can easily lead to poor simulation results. To reduce elaborated data inputs, some researchers have developed simpler models for some particular applications. For example, White and Reichmuth [16] proposed to use average monthly temperatures to predict monthly building energy consumption, and the outcome was proven to be more accurate than that of standard simulation procedures using heating and cooling degree days. Nevertheless, when simulation tools are applied, aperformance gap, which is the difference between the predicted energy use and actual measured energy use, always happen and sometimes this gap is too significant to be overlooked [17]. To improve simulation accuracy, calibration is suggested in some studies [18]. Repeated calibration to fine tune different inputs can progressively match simulated results with that of a real building [19] but calibration is a tedious and complex process that effectively reveals the demanding efforts to conduct an accurate simulation [20]. In spite of some complications with the data inputs and operations, 3D simulation tools can provide a satisfactory energy performance basis for comparing different design alternatives with proper assumptions [21].
Other than struggling with uncertainties encountered in 3D simulation, a benchmarking system with predetermined baseline consumption data of sample buildings can be employed to predict how a real building with similar characteristics should perform. This kind of benchmarking prediction usually has to be normalized in consideration of the different settings between the sample building and the one being predicted [22,23]. Baseline consumption data of sample buildings can function as an immediate energy comparison indicator, and have the advantage of encouraging poor performers to spot their problematic areas and consequently encourage them to promote efficient use of energy. Although limited in scope, the implementation of energy performance prediction from baseline data is inexpensive, fast, and relatively reliable [24].
Aiming at implementing energy benchmarking to promote building sustainability, this study attempts to develop energy consumption baselines of typical concrete residences in Taiwan with scientific simulation. Subsequently, the baselines are used to facilitate a simple energy prediction model at an early design stage of building development. This study is intended to define what typical modern residences are like and how middle-class occupants behave in Taiwan. Therefore, a residence matching the type of the sample building and the basic assumptions should have a similar energy consumption profile to the baseline. Using a trustworthy simulation engine of a sustainable design software Ecotect Analysis® (Autodesk, San Rafael, CA, USA), and utilizing weather data from three major metropolitan cities of Taiwan as testbeds, two popular types of modern concrete residences, a 5-story single family house and a 12-story high-rise condominium, are modeled. In addition to residence type, other building characteristics considered in the simulation include building insulation, airtightness, orientation, and location. The impacting magnitudes of building characteristics on energy use are analyzed and compared. The goal is to identify key building characteristics that will impact building energy efficiency the most for Taiwan’s concrete residences. To validate the simulated results, sample utility bills are then collected and aligned with the baselines. Adjustment parameters for normalizing energy prediction can also be determined with the validation process.

2. Study Area and Model Descriptions
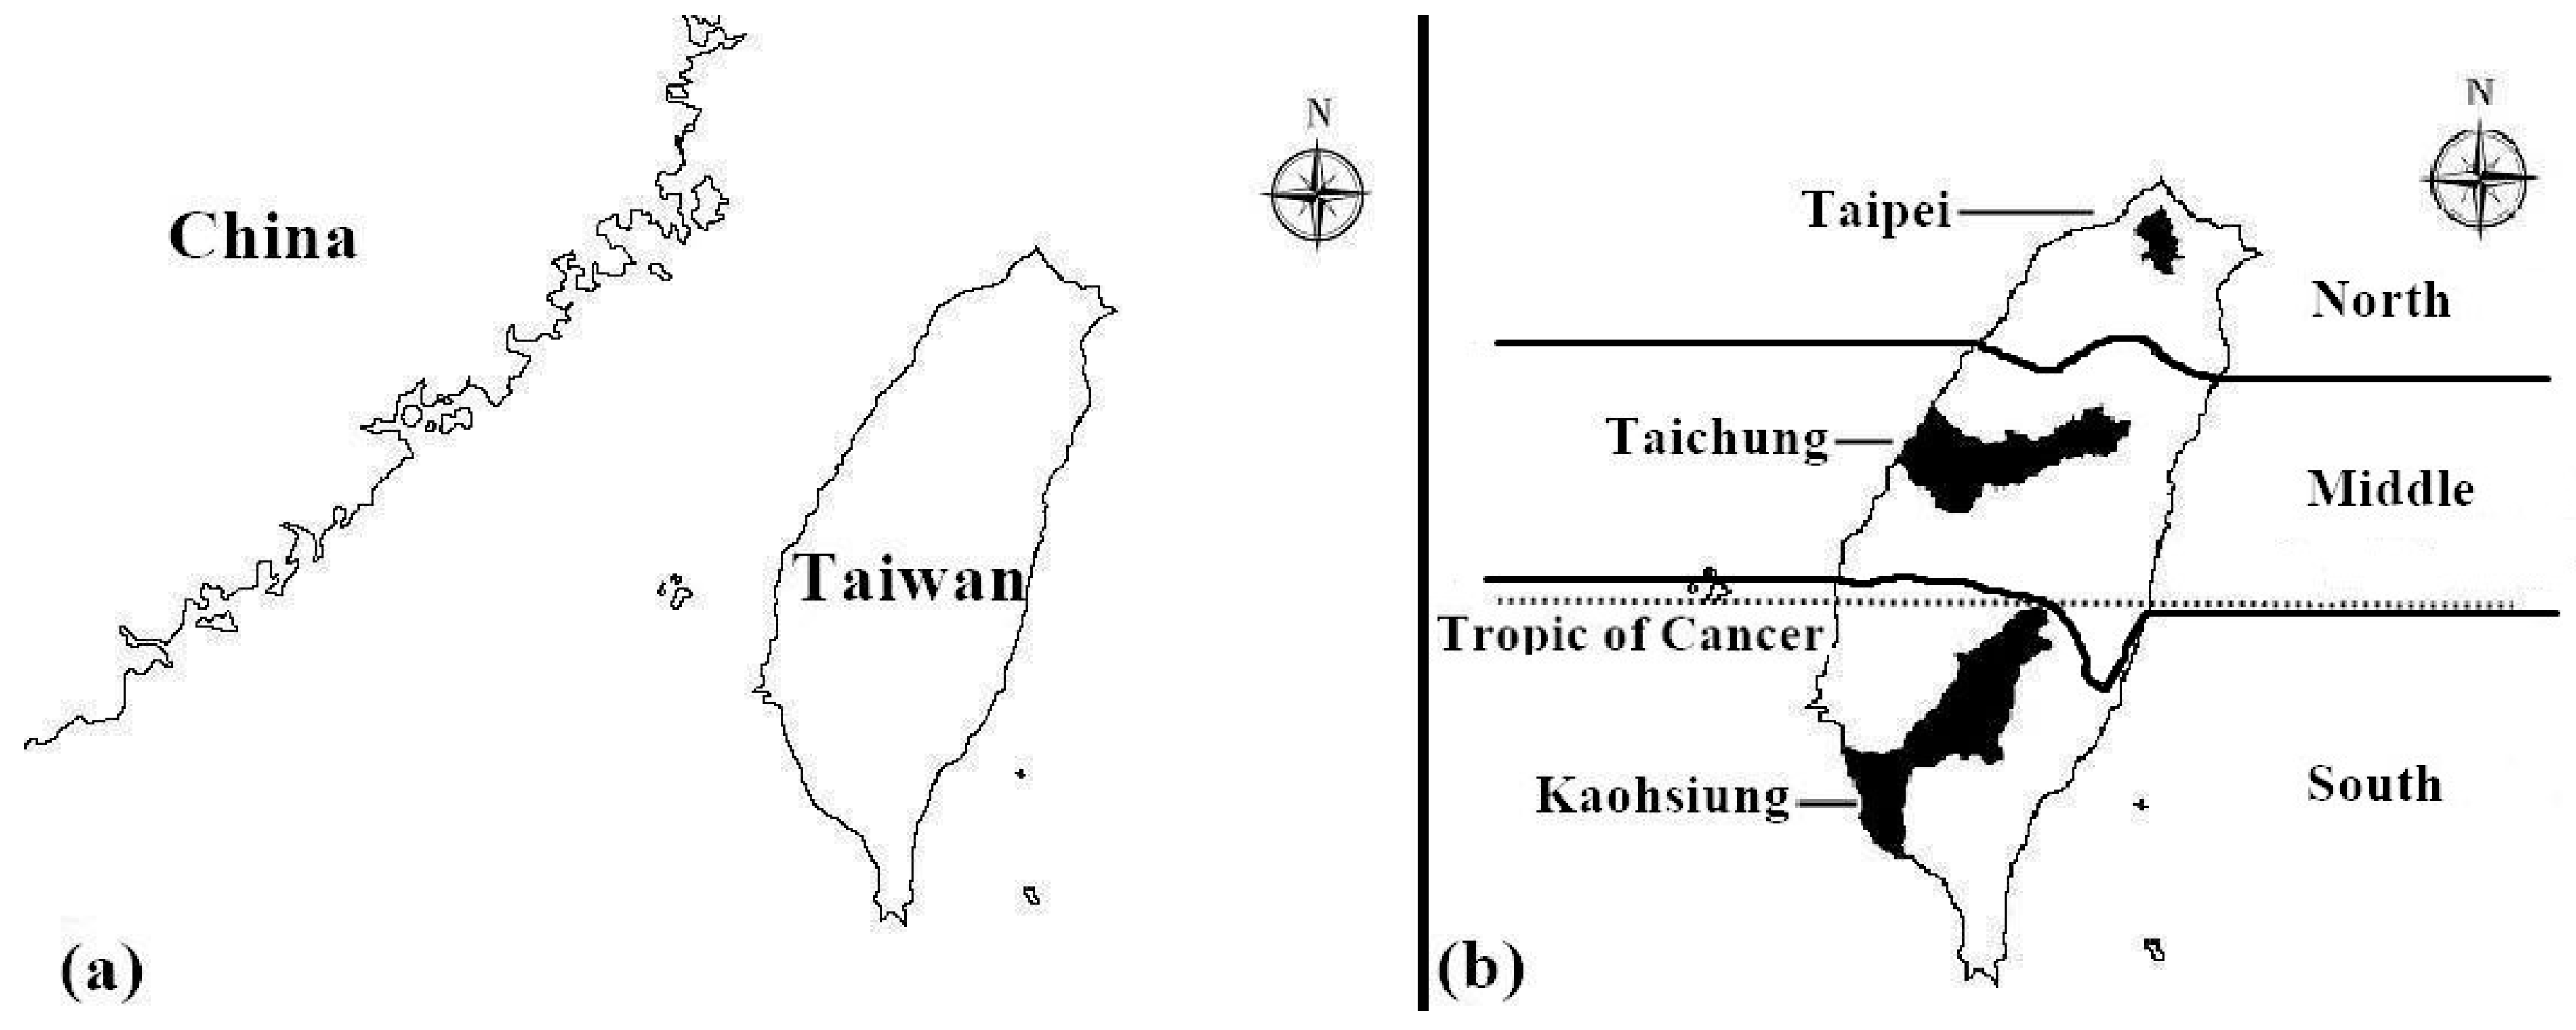
2.1. Study Area

Situated at the boundary between the Eurasian Plate and Philippine Sea Plate, Taiwan is an earthquake-prone country (Figure 1). To fight against frequent earthquakes, Taiwan has strict building codes that make concrete the main structural material for modern residential buildings. Concrete, on the other hand, is a poor insulator, which allows the sun’s powerful rays to penetrate through the building envelope and heat up the interior. On a typical summer day in Taiwan, the temperature inside concrete building can easily exceed mid-30 degrees Celsius without air conditioning.
In this study, energy consumption of Taiwan’s three major cities—Taipei, Taichung, and Kaohsiung—are investigated. Taipei and Taichung are located in the subtropical region, and Kaohsiung is located in tropical region. The average temperature of these three cities from 1981 to 2010 is shown in Table 1 [25].

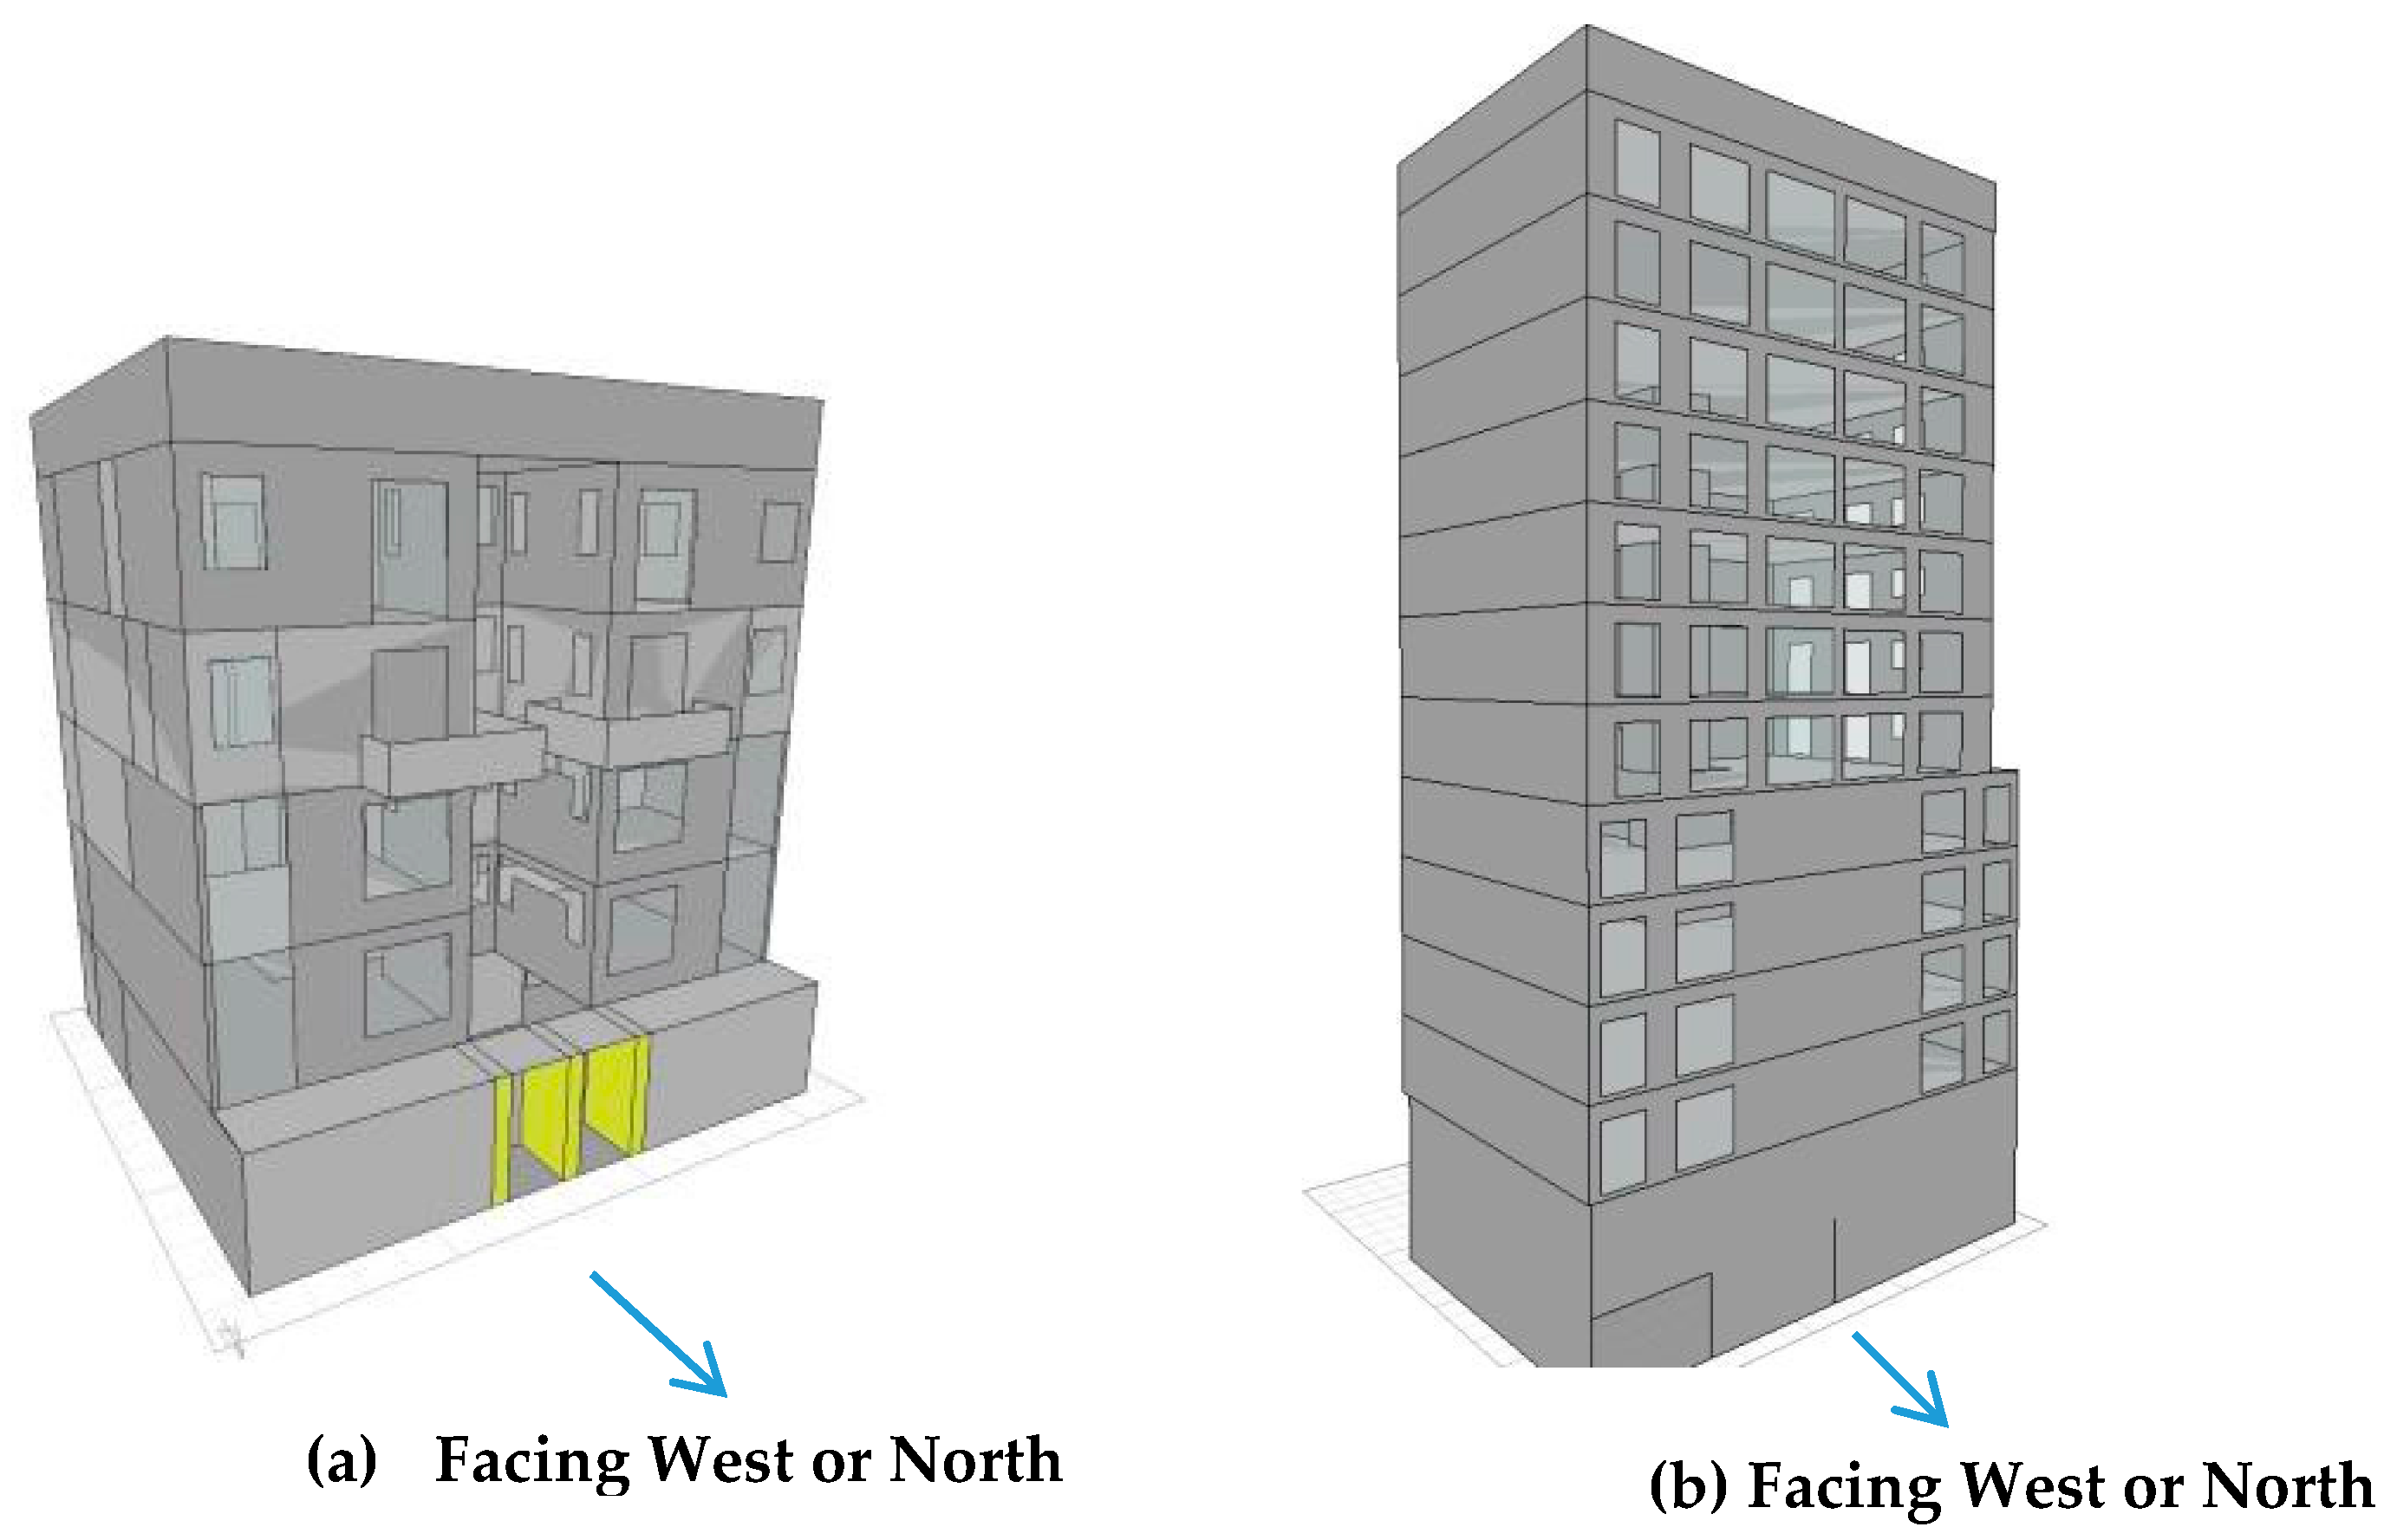
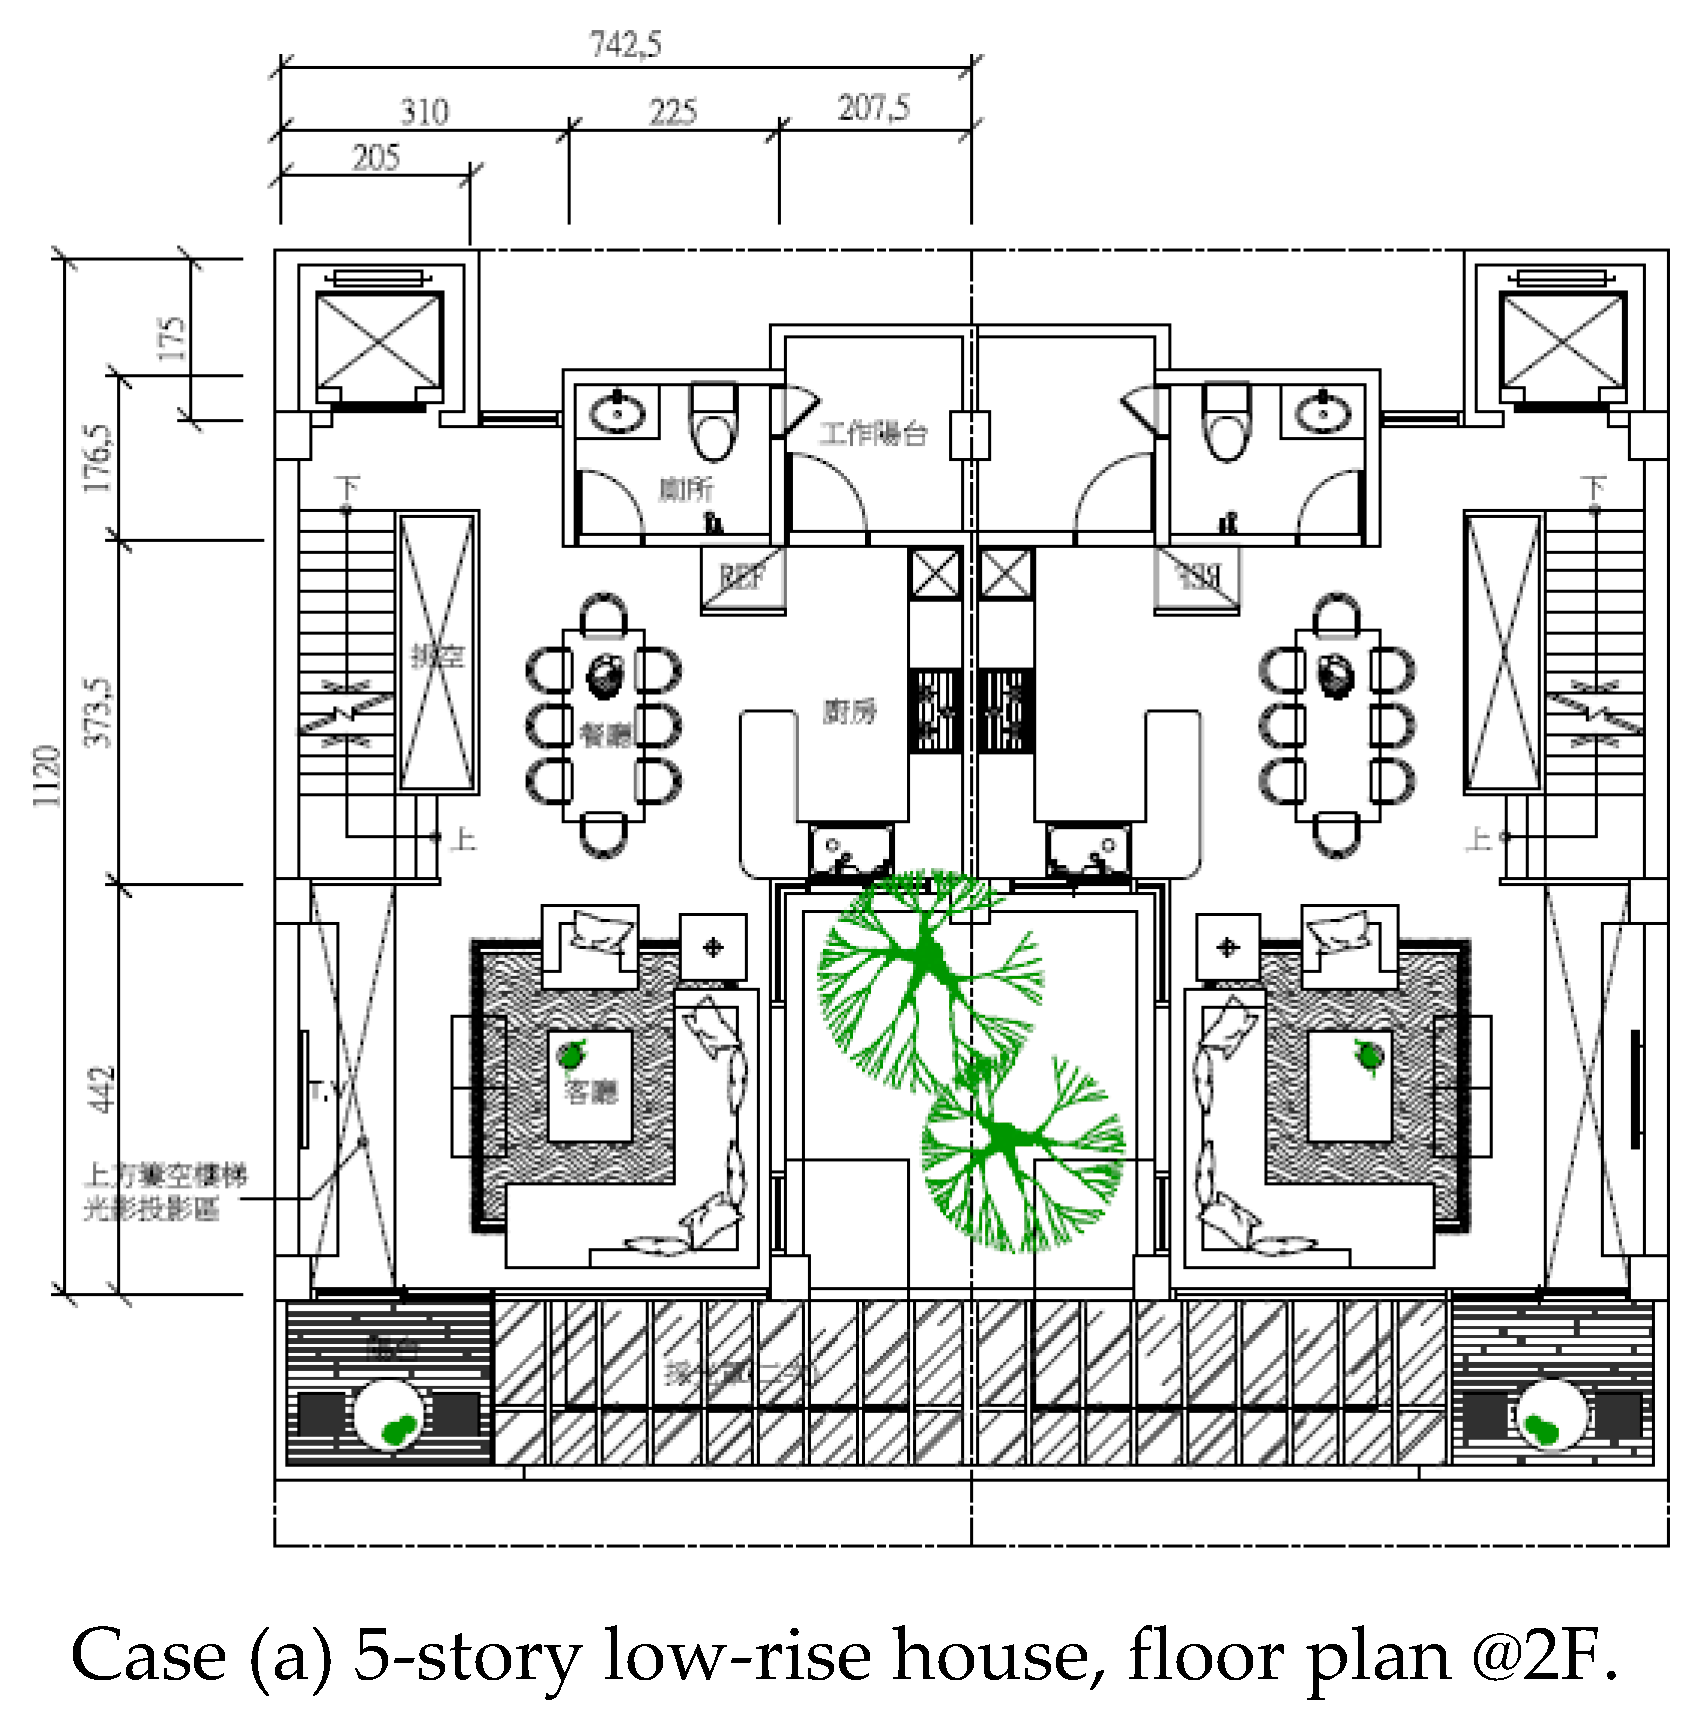
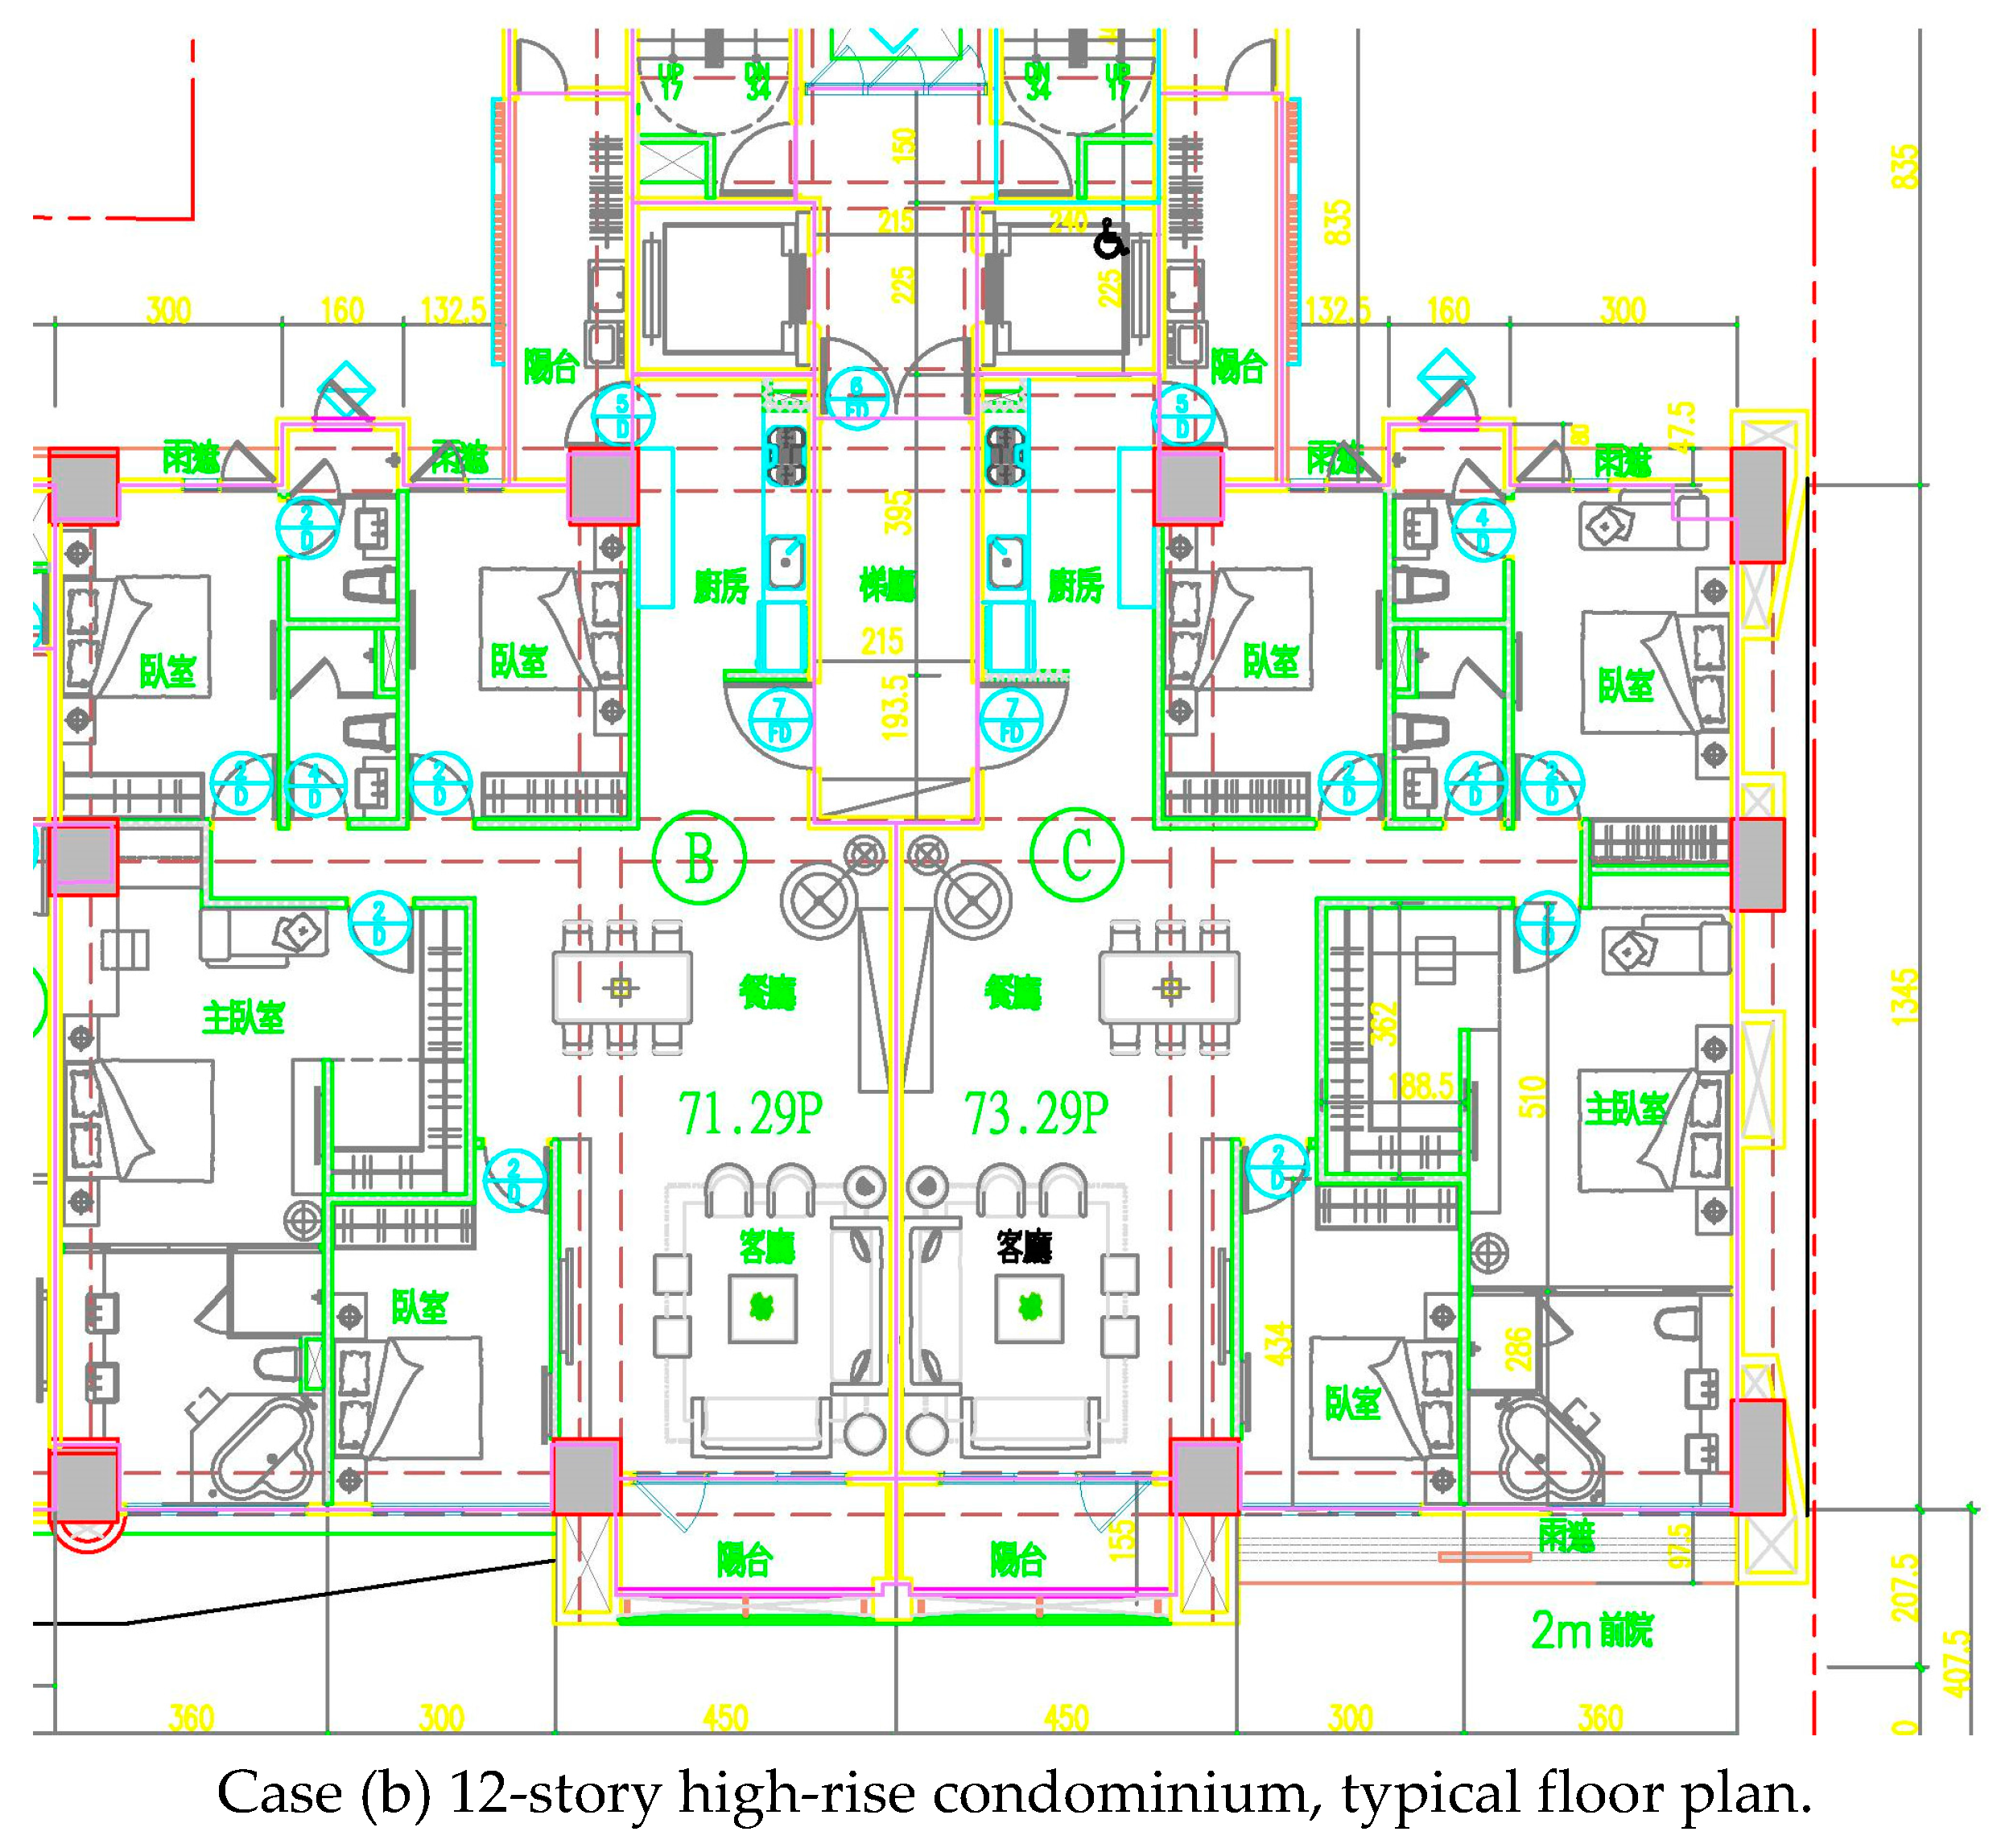
2.2. Model Descriptions

Two types of concrete residences are often found in Taiwan: low-rise houses, and high-rise condominiums. Unlike in large countries such as the United States, most suburban low-rise houses in Taiwan do not stand alone due to limited available land and the towering land cost [26]. A popular style of such low-rise residence is a twin-unit type consisting of two identical houses of three to five stories. The other popular type of residence is high-rise condominiums and most of them are 12 to 14 stories tall with a height of 50 meters or less [27]. Figure 2 shows these two typical modern residence types studied in this research. Case (a) is a twin-unit low-rise house of five stories and the floor area of each unit is 397 m2 (794 m2 in total). Case (b) is a high-rise condominium of 12 stories, while each story has two living units (24 units in total) and the floor area of each unit is 161 m2 (3864 m2 in total). Both cases are based on real projects in the 2010s, targeting middle to upper-class buyers. Floor height for both cases is 3.6 m and the ratio of equivalent transparency (fenestration) is 15%, and their typical floor plans are shown in Figure 3.
This study utilizes Ecotect Analysis 2011 student version as the internal load analysis tool to determine energy consumption, and Ecotect uses the admittance method by the Chartered Institution of Building Services Engineers (CIBSE) for its thermal analysis. Like other thermal analysis methods, the admittance method does not guarantee absolute accuracy of a calculation, but as long as the assumption bases of any comparative calculations are the same and that relative accuracy can be achieved [28]. The purpose of this study takes advantage of the great benefit of the admittance method when it is used as a comparative tool to compare the relative impacts of different design options. For simulation purposes, general assumptions in this study are described as follows:
(1)
Occupancy and operation setting: the occupancy of each house is set at 6, including grandparents, parents, and a pair of kids. Parents and kids leave home at 8:00 am and come back at 6:00 pm, while grandparents stay at home all day. The occupancy of each unit in the condominium is set at 4 (parents, and a pair of kids), and all four leave home at 8:00 am and come back at 6:00 pm. In both cases, human activity level is in sedentary mode at 70 W;
(2)
Air conditioning: air conditioning is turned on when room temperature is above 26 °C in a 24-h setting;
(3)
Internal gains (values for both lighting, and small power loads per unit floor area): sensible gain is set at 5 W/m2 (by lighting, and small power loads), and latent gain is 5 W/m2 (by small power loads such as cookers, electric kettle, hot water heaters, etc.) in both cases;
(4)
Internal design conditions setting: clothing is set at 1.0, relative humidity at 60%, air velocity at 0.5 m/s, and lighting level at 300 lux; and
(5)
Windows setting: windows remain closed all time.
Building orientation is defined as the most important facade of the building, which generally has the most windows and receives the most solar energy. Two orientation options are modeled: ‘facing west’ (denoting the case with largest solar heat reception in summer) and ‘facing north’ (denoting the case with strongest wind chill reception in winter).
‘Typical insulation’ and ‘extended insulation’ are the two options for building insulation. ‘Typical insulation’, the common concrete building envelope in Taiwan [29], uses ceramic tile for wall finishing, basic roof insulation with lightweight concrete and thin polystyrene foam, and traditional glass for all windows (as shown in Table 2). ‘Typical insulation’ exibits a basic code-compliance thermal conductivity of 3.230 W/m2∙k on the wall, 1.00 W/m2∙k on the roof, and 6.00 W/m2∙k on the windows, respectively.
‘Extended insulation’ is an enhanced heat resisting envelope which adds expanded polystyrene (EPS) to the wall and roof, and also uses double-layered Low-E glass for windows. The addition of EPS (with a U-value of 0.04) and Low-E glass reduces the thermal conductivity to 1.07 on the wall, 0.75 W/m2∙k on the roof, and 2.5 W/m2∙k on the windows. Table 3 shows the material composition of ‘extended insulation’.
Air tightness is measured in air changes per hour (ac/h) at an indoor-outdoor pressure difference of 50 Pascals, and air change is air flow rate normalized by building interior volume. According to a case study in Lithuania, the ac/h of normal houses varies [31]. The study showed that ac/h value is between 4.17 and 8.05 when the houses were not properly tightened, and ac/h could be below 0.5 if properly sealed. STR 2.05.01:2005 [32] states that the air change rate (ac/h) has to be three air changes per hour for detached houses without ventilation devices. In Taiwan, no ac/h specification has been reinforced, while a study shows an average ac/h (natural ventilation) in a Taiwanese residence is 3–6 [33]. This study assumes that the typical ac/h in Taiwan is 3.25. On the other hand, for energy saving purposes, the ac/h for a properly air tightened residence is set at 0.5.

3. Results and Discussion

3.1. Annual Energy Consumption

Creating geometric models, assigning building properties, and applying climate and weather data are the three primary steps required for estimating annual energy consumption using simulation. In this study, two building models are created. Three major sets of building properties are assigned, including two orientations (facing west and facing north), two levels of insulation (typical insulation and extended insulation), and two degrees of air tightness (0.5 ac/h and 3.5 ach). Climate and weather data of three cities (Taipei, Taichung, Kaohsiung) are then applied. The research team has completed a total of 48 different simulation scenarios (2 building types × 2 orientations × 2 insulations × 2 air tightness × 3 cities), and annual energy consumption data of all 48 scenarios is summarized in Table 4.
For low-rise house, the maximum annual energy consumption is 118,164.58 KWH, which occurs when the house is facing north, located in Kaohsiung, and with typical insulation and air leak feature of 3.25 ac/h. In contrast, the minimum annual energy consumption is 37,757.78 KWH, when the house is facing west, located in Taipei, and with extended insulation and air tight feature 0.5 ac/h. The most energy-efficient house requires only 31.95% of the least energy-efficient one. In other words, the house at improper location and orientation and without enhanced insulation and air tightness can consume 3.13 times energy of the one with better choices. For high-rise condominium, the least energy-efficient type (Kaohsiung, facing west, typical insulation, and air leak) requires 506,015.62 KWH, while the most energy-efficient type (Taipei, facing north, extended insulation, and air tight) requires 182,175.39 KWH, which is only 36.00% of (or 2.78 times more energy-efficient than) the ill-schemed condominium.
To examine individual impact of each factor, impacting percentage from the baseline data is calculated and it is defined as the following:
Impacting   ( % ) = energy   consumption   with   the   examined   factor     baseline   energy   consumption baseline   energy   consumption  
Baseline data represents current energy consumption condition, which is always the worst case in each individual category. Table 5 summarizes the baseline data for both house and condominium in different cities. Comparing the data between house and condominium, it is found that 12-story condominium can achieve around 10% (ranging from 8.01% to 12.03%) energy saving per unit area, and over 44% (ranging from 44.03% to 46.47%) saving per capita when compared with living in house. Totally, each family living in a condominium can save over 62% (ranging from 62.69% to 64.31%) energy annually. It shows that living in the big house is much less energy-efficient than living in the smaller condominium.
From the impacting percentage calculation on each studied factor, the research team has concluded the following individual impacts of insulation, air tightness, orientation, and location on the two types of residences (as shown in Table 6):
  • Insulation impacts: Annual energy savings from 13.83% to 21.15% are achieved. Average impact is 17.77%. Insulation impacts on the condominium (from 18.57% to 21.15%) appear to be larger than that on the house (from 13.83% to 17.03%).
  • Air tightness impacts: Annual energy savings from 36.98% to 42.20% are achieved. Average impact is 39.78%. Different from insulation impacts, air tightness impacts on the condominium (from 36.98% to 40.16%) are smaller than that on house (from 39.72% to 42.20%), but the difference is considered not significant.
  • Double impacts (insulation + air tightness): Annual energy savings from 48.19% to 54.68% are achieved. Average impact is 52.63%.
  • Orientation impact: Using typical insulation in Taipei as an example ‘facing west’ results in 1.59% (12-story condominium) to 3.11% (5-story house) energy increase. Compared with impacts from insulation and air tightness, orientation impact is small and can almost be neglected.
  • Location impact: Houses (facing north) in Kaohsiung require 45.03% more annual energy than the same house in Taipei. Houses (facing north) in Taichung require 12.84% more annual energy than the same house Taipei. Condominiums (facing north) in Kaohsiung and in Taichung require 41.44% and 13.49% more annual energy than the same condo in Taipei, respectively. Houses and condominiums facing west have similar results.
Among all factors, ‘air tightness’ results in the greatest impact at about 40% energy improvement. On the other hand, envelope insulation, which has been recognized as the most effective energy-saving methodology, results in only less than 18% improvement. This study shows that ‘air tightness’ should be the foremost strategy for home developers. However, building code enforcement of air tightness has been ignored by a lot of countries, including Taiwan. The simulations also show that the impacts of simultaneous implementation of both insulation and air tightness results in 52.63% energy improvement. Further examining the individual impact of insulation and air tightness, which are 17.77% and 39.78% respectively, we have found that the simulated double impact of 52.63% is less than the summation of individual implementation (17.77% + 39.78% = 57.55%).
The same house located in different cities such as Taipei and Kaohsiung results in an over 45% energy consumption variation. This kind of result would not be surprising if the study was on large countries like USA or China which sit across various climate zones with widely ranging temperatures. However, this study is conducted in Taiwan, which is a tiny island with a total area of a mere 36,000 square km. The 45% energy variation is surprisingly high, considering the fact that the two studied cities, Taipei and Kaohsiung, which sit respectively on the north and south of the island, are only separated by 350 km. In fact, the tropic of Cancer (23.5 latitude) cuts through the middle of Taiwan, which separates the entire island into two different climate zones. The northern part of the island belongs to the subtropics, which has warm to hot summers and cool to mild winters with infrequent frost. In contrast, the southern part belongs to tropics, which is warm, hot, and humid in springs, summers, and autumns, with very mild winters. The study shows that the energy consumption depends largely on local climate characteristics and requires regional-specific investigation to provide accurate predictions.

3.2. Baseline Validation and Adjustment Parameters

A sample family’s utility bills fitting the living condition settings in this study are collected to compare with the simulated results. This sample family locates at the 10th floor a 12-story north-facing condominium in Sungshan district of Taipei City, and has a floor area of 183 m2. This sample family has three members, including a pair of middle-class parents (double income) and a 10-year-old daughter. The sample family’s utility bills from 2014 through 2016 and the calculated energy consumption indexes are summarized in Table 7. Compared with the sample utility bills, the simulation seems to yield an exaggerated energy consumption number. A possible explanation for such discrepancy is that the sample family usually does not cook at home and does not always demand the highest level of air-conditioning comfort, which could result in some degrees of energy saving. The utility bills also show a constant increase of energy use from 2014 through 2016, and it is possibly because of the increasing energy demands of the grown-up daughter and the ascending heat island effects in the Taipei metropolitan area as well.
Past empirical studies have revealed noticeable differences between simulated and measured performances of energy consumption [34,35]. Some studies have also revealed that uncertainties such as occupant behavior, life style and even building construction practices may contribute to the variation in energy consumption in different households, but the extent of their exact influences are still undetermined [36,37,38]. The comparison between the simulated data and the actual utility bills shows the same conclusion. To narrow the large performance gap, normalization process is conducted to fit occupant behaviors of the sample family with the simulation settings. Three parameters, including number of residents, floor area, and desired comfort level are suggested to justify the simulated data for normalization purposes. A simple normalization approach is employed as suggested in [22,23], so that these three parameters are assumed to be linearly scalable, however exact impacting magnitude may vary from case to case and require further future investigation. These three parameters are explained as follows:
  • Number of residents (Pno_res): 6 residents in house and 4 residents in condominium are assumed in the simulation. Energy consumption is strongly correlated to the number of residents [39]. A linear regression has been used to describe the relationship between occupancy rate and energy consumption [40], suggesting linear relationship a reasonable hypothesis. Hence, a “number of residents” adjustment parameter (Pno_res) in the form of “actual number of residents/6, for house” or “actual number of residents/4, for condominium” is suggested when the number of residents varies.
  • Total floor area (Pfl_area): The initial assumption of the house and condominium area are set at 397 m2 and 161 m2 respectively. These are considered typical settings for upper middle class communities in suburban areas in Taiwan. However, floor area may vary in different cases. When calculating energy consumption with the admittance method, the internal gains (W/m2), energy use intensity, and lighting intensity (lm/m2, lux) are defined based on floor area, the resulting energy is directly proportional to floor area. Energy consumption from air conditioning load due to solar gains is calculated based on the respective sunlit area on wall, roof, and glaze (m2) and the solar intensity (M/m2). Sunlit area on roof is the same as floor area, and when both fenestration ratio and floor height are fixed, the envelope area on the wall and glaze is not directly proportional to the floor area but has strong correlation. This study suggests a linear ‘total floor area’ adjustment parameter (Pfl_area) in the form of “actual floor area/397, for house” or “actual floor area/161, for condominium” be asserted in estimation when floor area varies to simplify the estimate.
  • Air conditioning comfort level (PAC_comf): The simulation assumed air conditioning (AC) is turned on in the entire floor area when room temperature goes above 26 °C in a 24-h setting, no matter whether residents are home or not. This setting results in the maximum comfort, but is not at all energy efficient. According to the simulation results of such setting, the average daily AC operation time is 7.44 h, and AC accounts for 54.38% of annual energy consumption in concrete residences. That is, when AC is turned off completely, an energy saving of 54.38% can be achieved. However, turning-off AC is not a reasonable scenario in the metropolitan areas in investigated regions, where interior temperature can reach high-30 degrees Celsius in summer. Based on the simulation, a minimum AC energy requirement to secure least comfort level could achieve an energy saving of 43.12% when the AC temperature is turned on at 30 °C and in limited hours between 10:00 PM and 4:00 AM and also in limited cooling areas. From the data derived from simulation, this study suggests a four-level air conditioning comfort level setting (PAC_comf) that could be asserted to meet different AC comfort level requirements: (a) for maximum AC comfort, PAC_comf is set at “1”; (b) for moderate AC comfort, PAC_comf is set at “0.8563”(AC on at 27 °C and operates for 14 h); (c) for less than moderate AC comfort, PAC_comf is set at “0.7125” (AC on at 28 °C and operates for 10 h); and (d) for least AC comfort, PAC_comf is set at “ 0.5688– (1-0.4312) (AC on at 30 °C and operates for 6 h).
By accompanying with the baseline energy consumption data in Table 4 and Table 5, the three proposed adjustment parameters can be used to develop a better prediction of energy consumption appropriate for different living standards. After normalization with these adjustment parameters, the energy consumption can be described as the following equation:
Predicted Energy Consumption = (Baseline Data) * (Pno_res) * (Pfl_area) * (PAC_comf)
For example, we can normalize the energy demand of the sample family (3 members/183 m2/ facing north/condominium/typical insulation/standard air tightness/Taipei/moderate AC comfort) as follows and it shows that the normalization significantly close the performance gap:
Annual Energy Consumption = 14,650.92 KWH* (3/4) * (183/161) * (0.8563) = 10,694 KWH
(where 14,650.92 KWH is the baseline data retrieved from Table 5).

4. Conclusions

Based on scientific simulation, this study develops energy consumption baselines for two popular types of modern concrete residences in three major cities of Taiwan. The impacts of residence locations/orientations/types and key building characteristics including envelope insulation and air tightness are analyzed and presented. To validate the baseline, utility bills of a sample middle-class family are collected and compared with the simulated results. For normalization of predicted results, three adjustment parameters (‘number of residents’, ‘total floor area’, and ‘air conditioning comfort level’) are suggested and proved to narrow the performance gap significantly. With the simulated baselines and the three adjustment parameters, an inexpensive, fast, and reliable energy consumption estimate becomes possible.
In addition to the demonstration of benchmarking approach for energy prediction, this research has also drawn the following conclusions: (1) Both extended insulation and enhanced airtightness can substantially reduce energy consumption, while air tightness is more effective, reaching an average impact of 39.78%; (2) Buildings facing west always consume more energy than buildings facing north, and this impact is between 1.59% and 3.11%; (3) Location wise, buildings in Kaohsiung are less energy-efficient, consuming 45% more energy than identical buildings in Taipei.
As one of the pioneering energy consumption simulation studies in Taiwan, which take into account different locations/orientations and residence types, as well as other key building characteristics, this research has demonstrated that scientific simulation can provide valuable and accountable data for stakeholders in affirming their energy-reduction implementation decision while pursuing sustainable innovation. During the simulation sessions, this study also found that basic assumptions such as window open/close, occupancy number, relative humidity, and internal loading are also factors that can affect energy consumption. The exact impacting magnitudes of these assumptions require further detailed investigations in the future.

Author Contributions

Kuo-Liang Lin managed the study, administered the simulation sessions, and prepared the manuscript. Min-Young Jan conducted the analysis and provided constructive opinions in revision. Chien-Sen Liao edited and revised the manuscript.

Conflicts of Interest

The authors declare no conflict of interest.

References

  1. Jim, C.Y. Air-conditioning energy consumption due to green roofs with different building thermal insulation. Appl. Energy 2014, 128, 49–59. [Google Scholar] [CrossRef]
  2. Berardi, U. A cross-country comparison of the building energy consumptions and their trends. Resour. Conserv. Recycl. 2016, in press. Available online: http://dx.doi.org/10.1016/j.resconrec (accessed on 14 April 2016). [Google Scholar] [CrossRef]
  3. Chua, K.J.; Chou, S.K.; Yang, W.M.; Yan, J. Achieving better energy-efficient air conditioning: A review of technologies and strategies. Appl. Energy 2013, 104, 87–104. [Google Scholar] [CrossRef]
  4. IEA, International Energy Agency. CO2 Emissions from Fuel Combustion; IEA, International Energy Agency: Paris, France, 2014. [Google Scholar]
  5. Chen, S.; Yoshino, H.; Li, N. Statistical analyses on summer energy consumption characteristics of residential buildings in some cities of China. Energy Build. 2010, 42, 136–146. [Google Scholar] [CrossRef]
  6. Zhou, N. Current Status and Future Scenarios of Residential Building Energy Consumption in China; Lawrence Berkeley National Laboratory: Berkeley, CA, USA, 2010. [Google Scholar]
  7. Jiang, P. Analysis of national and local energy-efficiency design standards in the public building sector in China. Energy Sustain. Dev. 2011, 15, 443–450. [Google Scholar] [CrossRef]
  8. Bojic, M.; Yik, F. Cooling energy evaluation for high-rise residential buildings in Hong Kong. Energy Build. 2005, 37, 345–351. [Google Scholar] [CrossRef]
  9. Li, Z.; Jiang, Y. Characteristic of cooling load and energy consumption of air conditioning in residential buildings in Beijing. HV & AC 2006, 36, 1–11. [Google Scholar]
  10. Meier, A.; Lin, J.; Liu, J.; Li, T. Standby power use in Chinese homes. Energy Build. 2004, 36, 1211–1216. [Google Scholar] [CrossRef]
  11. Geoffrey, K.F.T.; Kelvin, K.W.Y. A study of domestic energy usage patterns in Hong Kong. Energy 2006, 28, 1671–1682. [Google Scholar]
  12. Hu, T.; Yoshino, H.; Jiang, Z. Analysis on urban residential energy consumption of Hot Summer & Cold Winter Zone in China. Sustain. Cities Soc. 2013, 6, 85–91. [Google Scholar]
  13. Yoshino, H.; Lou, H. Indoor thermal environment of residential buildings in three cities of China. J. Asian Archit. Build. Eng. 2002, 1, 129–136. [Google Scholar] [CrossRef]
  14. Zhang, H.; Yoshino, H. Analysis of indoor humidity environment in residential buildings. Build. Environ. 2010, 45, 2132–2140. [Google Scholar] [CrossRef]
  15. Fumo, N.; Mago, P.; Luck, R. Methodology to estimate building energy consumption using EnergyPlus Benchmark Models. Energy Build. 2010, 42, 2331–2337. [Google Scholar] [CrossRef]
  16. White, J.A.; Reichmuth, R. Simplified method for predicting building energy consumption using average monthly temperatures. In Proceedings of the 31st Intersociety Energy Conversion Engineering Conference, Washington, DC, USA, 11–16 August 1996; Volume 3, pp. 1834–1839.
  17. Pan, Y.; Huang, Z.; Wu, G. Calibrated building energy simulation and its application n a high-rise commercial building in Shanghai. Energy Build. 2007, 39, 651–657. [Google Scholar] [CrossRef]
  18. Reddy, A. Literature review on calibration of building energy simulation programs: Uses, problems, procedures, uncertainty, and tools. ASHRAE Trans. 2006, 112, 226–240. [Google Scholar]
  19. Canyurta, O.E.; Ozturka, H.K.; Hepbaslib, A.; Utlu, Z. Estimating the Turkish residential–commercial energy output based on genetic algorithm (GA) approaches. Energy Policy 2005, 33, 1011–1019. [Google Scholar] [CrossRef]
  20. Zhao, H.; Magoulès, F. A review on the prediction of building energy consumption. Renew. Sustain. Energy Rev. 2012, 16, 3586–3592. [Google Scholar] [CrossRef]
  21. Ahn, K.U.; Kim, D.W.; Kim, Y.J.; Yoon, S.H.; Park, C.S. Issues to be solved for energy simulation of an existing office building. Sustainability 2016, 8, 345. [Google Scholar] [CrossRef]
  22. Filippín, C. Benchmarking the energy efficiency and greenhouse gases emissions of school buildings in central Argentina. Build. Environ. 2000, 35, 407–414. [Google Scholar]
  23. Birtles, A.B.; Grigg, P. Energy efficiency of buildings: Simple appraisal method. Build. Ser. Eng. Res. Technol. 1997, 18, 109–114. [Google Scholar] [CrossRef]
  24. Chung, W. Review of building energy-use performance benchmarking methodologies. Appl. Energy 2011, 88, 1470–1479. [Google Scholar] [CrossRef]
  25. Central Weather Bureau. Available online: http://www.cwb.gov.tw/V7/climate/monthlyMean/Taiwan_tx.htm (accessed on 12 August 2016).
  26. Hsieh, H.Y. The 1990s Taiwan residential construction boom: A supply side interpretation. Constr. Manag. Econ. 2005, 23, 265–284. [Google Scholar] [CrossRef]
  27. Hsieh, H.-Y. The Taiwanese Residential Construction Peak in the 1990s: Interpreting Industry and Developer Behaviour, Chapter 4 Taiwan’s Residential Construction Industry. Ph.D. Thesis, Griffith University, Nathan, QLD, Australia, 2003. [Google Scholar]
  28. Wu, N.W.; Fu, C.C. Tile application as the indication of modernization in colonial taiwan, international proceedings of economics development and research. Acad. J. 2012, 54, 215. [Google Scholar]
  29. Marsh, A.J. Rgermal analysis and the Admittance Method. Nat. Freq. 26 December 2005. Issue No. 100. Available online: https://forums.autodesk.com/autodesk/attachments/autodesk/356/1967/1/D__Square%20One_Documentation_Software%20Help%20Files_Ecotect%20.pdf (accessed on 10 July 2016).
  30. Construction and Planning Agency Ministry of Interior. Available online: http://www.cpami.gov.tw/chinese/filesys/file/chinese/publication/law/lawdata/1000810233-5.pdf (accessed on 12 July 2016).
  31. Šadauskienė, J.; Šeduikytė, L.; Paukštys, V.; Banionis, K.; Gailius, A. The role of air tightness in assessment of building energy performance: Case study of Lithuania. Energy Sustain. Dev. 2016, 32, 31–39. [Google Scholar] [CrossRef]
  32. Thermal Technology of Building Elements; STR 2.05.01:2005; Ministry of Environment of Republic of Lithuania: Vilnius, Lithuania, 2005. (In Lithuanian)
  33. Chou, B.C; Jiang, C.M.; Mon, W.D; Lee, J.H. Difference of the indoor ventilation aeration efficiency from the various construction of stone-slab house. In Proceedings of the 16th Symposium of Research, Architect Institute of Taiwan, Taipei, Taiwan, 12 June 2004; Available online: http://www.pws.stu.edu.tw/paul/B_Conference/B088.pdf (accessed on 29 October 2016).
  34. Zhu, D.T.; Hong, D.Y.; Wang, C. A detailed loads comparison of three building energy modeling programs: EnergyPlus, DeST and DOE-2.1 E. Build. Simul. 2013, 6, 323–335. [Google Scholar] [CrossRef]
  35. Pan, Y.; Huang, Z.; Wu, G.; Chen, C. The application of building energy simulation and calibration in two high-rise commercial buildings in Shanghai. In Proceedings of the 2nd National IBPSA-USA Conference, Cambridge, MA, USA, 2–4 August 2006; pp. 252–261.
  36. Branco, G.; Lachal, B.; Gallinelli, P.; Weber, W. Predicted versus observed heat consumption of a low energy multifamily complex in Switzerland based on long-term experimental data. Energy Build. 2004, 36, 543–555. [Google Scholar] [CrossRef]
  37. Groot, E.D.; Spiekman, M.; Opstelten, I. Dutch Research into User Behaviour in Relation to Energy Use of Residences. In PLEA 2008—25th Conference on Passive and Low Energy Architecture, Dublin, Ireland, 22–24 October 2008; Available online: https://www.healthyheating.com/downloads/Thermostats/PLEA_FinalPaper_ref_361.pdf (accessed on 30 October 2016).
  38. Olivia Guerra Santin, O.G.; Itard, L.; Visscher, H. The effect of occupancy and building characteristics on energy use for space and water heating in Dutch residential stock. Energy Build. 2009, 41, 1223–1232. [Google Scholar] [CrossRef]
  39. Martani, C.; Lee, D.; Robinson, P.; Britter, R.; Ratti, C. ENERNET: Studying the dynamic relationship between building occupancy and energy consumption. Energy Build. 2012, 47, 584–591. [Google Scholar] [CrossRef]
  40. Hietanen, P. Paljonko Tilaa Organisaatio Tarvitsee? Työympäristökehittämisen Ympäristövaikutukset. Kiinko Kipa Project Work; Senate Properties: Helsinki, Finland, 2009; p. 33. (In Finnish) [Google Scholar]
Figure 1. Study area and three investigated cities of this study: (a) Study area; and (b) three investigated cities.
Sustainability 09 00257 g001
Figure 2. Two typical modern residence types modeled in this study: (a) 5-story low-rise house; and (b) 12-story high-rise condominium.
Sustainability 09 00257 g002
Figure 3. Floor Plan for the two typical modern residence types modeled in this study: (a) 5-story low-rise house; and (b) 12-story high-rise condominium.
Sustainability 09 00257 g003aSustainability 09 00257 g003b
Table 1. The average temperature (°C) of three sampled cities from 1981 to 2010.
StationJanuaryFebruaryMarchAprilMayJuneJulyAugustSeptemberOctoberNovemberDecemberAverage
Taipei16.116.518.521.925.227.729.629.227.424.521.517.923.0
Taichung16.617.319.623.126.027.628.628.327.425.221.918.123.3
Kaohsiung19.320.322.625.427.528.529.228.728.126.724.020.625.1
Weather Data—Major Cities 1981~2010. updated every 10 years, data from Central Weather Bureau 2010 (Taiwan).
Table 2. ‘Typical insulation’, a minimum insulation setting which meets basic building code requirements, and this represents the most common RC building envelope in Taiwan.
Layer NameWidthDensitySp. HeatU *
Wall Composition, U = 3.23Ceramic Tiles0.012.48401.3
Cement Mortar0.01528001.5
Reinforced Concrete0.152.28801.4
Cement Mortar0.0128001.5
Roof Composition, U = 1.00Cement five-leg tile0.050.79001.5
Polystyrene Foam0.021.0411300.04
Concrete Lightweight0.050.95656.90.8
Asphaltic Felt0.011.029000.11
Cement Mortar0.0228001.5
Reinforced Concrete0.152.28801.4
Cement Mortar0.01528001.5
Typical Glass, U = 6.0Glass Standard0.0062.3836.81.05
* U-value is the heat transfer coefficient describing how well a building element conducts heat (W/m2·K). Data from Construction and Planning Agency Ministry of the Interior [30].
Table 3. ‘Extended insulation’, a suggested insulation setting with an low overall thermal conductivity which can effectively reduce thermal gain inside the residence.
Layer NameWidthDensitySp. HeatU *
Wall Composition, U = 1.07Ceramic Tiles0.012.48401.3
EPS0.02521.0413000.04
Cement Mortar0.01528001.5
Reinforced Concrete0.152.28801.4
Roof Composition, U = 0.75Concrete 1-4 Dry0.052.38001.4
PU Block0.0251.0512500.028
PU0.0051.0512500.05
Cement Mortar0.01528001.5
Reinforced Concrete0.152.28801.4
Cement Mortar0.01520008001.5
Low-e Glass, U = 2.5Glass Standard0.0062300836.81.046
Air Gap0.031.310045.56
Glass Standard0.0062300836.81.046
* U-value is the heat transfer coefficient describing how well a building element conducts heat (W/m2·K). Data from Construction and Planning Agency Ministry of the Interior [30].
Table 4. Annual Energy Consumption in 48 cases (in KWH).
HouseCondominium
TaipeiTaichungKaohsiungTaipeiTaichungKaohsiung
Air Leak (3.25 ach)Extended InsulationFacing West68,879.1777,094.6598,015.24287,970.94323,584.38401,207.81
Facing North68,059.1375,902.0296,717.30286,335.81320,017.95398,511.36
Typical InsulationFacing West81,434.48 *92,917.36 *118,164.58 *357,222.50 *410,404.90 *506,015.62 *
Facing North78,978.82 *89,117.29 *114,543.31 *351,622.05 *399,040.54 *497,345.66 *
Air Tight (0.5 ac/h)Extended InsulationFacing West38,745.7942,109.5253,881.35184,184.72190,285.38236,623.65
Facing North37,757.7840,827.7152,460.78182,175.39186,811.36234,554.69
Typical InsulationFacing West48,331.5256,010.9370,411.45222,238.40258,618.91306,444.61
Facing North45,650.8152,038.9366,643.06216,380.24247,091.92297,598.66
* baseline data for calculating impacting %: Baseline data is the worst energy consumption case in each category in both orientations: Facing West and Facing North and it is can be regarded as the energy demand level of higher living standard in Taiwan.
Table 5. Baseline data for different cities (in KWH).
HouseCondominium
TaipeiTaichungKaohsiungTaipeiTaichungKaohsiung
Facing WestTotal Energy81,434.4892,917.36118,164.58357,222.50410,404.90506,015.62
Energy/m2102.56117.02148.8292.42 (−9.88%)106.18 (−9.26%)130.92 (−12.03%)
Energy/family40,717.2446,458.6859,082.2914,884.27 (−63.44%)17,100.20 (−63.19%)21,083.98 (−64.31%)
Energy/capita6786.217743.119847.053721.07 (−45.17%)4275.05 (−44.79%)5271.00 (−46.47%)
Facing NorthTotal Energy78,978.8289,117.29114,543.31351,622.05399,040.54497,345.66
Energy/m299.47112.24144.2690.98 (−8.54%)103.24 (−8.01%)128.68 (−10.80%)
Energy/family39,489.4144,558.6557,271.6614,650.92 (−62.90%)16,626.69 (−62.69%)20,722.74 (−63.82%)
Energy/capita6581.577426.449545.283662.73 (−44.35%)4156.67 (−44.03%)5180.68 (−45.73%)
House details: 2 families, 6 residents/family, total residents: 12, floor area: 794 m2 in total or 397 m2/family. Condominium details: 12 stories, 24 families, 4 residents/family, total residents: 96, floor area: 3865 m2 in total or 161 m2/family. Impacting percentage is calculated by (examined data—baseline data)/baseline data, where house energy consumption is used as baseline.
Table 6. Insulation and air tightness impact on annual energy consumption.
TaipeiTaichungKaohsiung
Insulation Impact
(ave. −17.77%)
HouseFacing West−15.42%−17.03%−17.05%
Facing North−13.83% *−14.83%−15.56%
CondominiumFacing West−19.39%−21.15% **−20.71%
Facing North−18.57%−19.80%−19.87%
Air Tightness Impact
(ave. −39.78%)
HouseFacing West−40.65%−39.72%−40.41%
Facing North−42.20% **−41.61%−41.82%
CondominiumFacing West−37.79%−36.98% *−39.44%
Facing North−38.46%−38.08%−40.16%
Double Impact: Insulation + Air Tightness (ave. −52.63%)HouseFacing West−52.42%−54.68% **−54.40%
Facing North−52.19%−54.19%−54.20%
CondominiumFacing West−48.44%−53.63%−53.24%
Facing North−48.19% *−53.18%−52.84%
* lowest impacting%; ** highest impacting%; Impacting (%) = (examined consumption—baseline consumption)/baseline consumption.
Table 7. Annual energy consumption—sample family.
2016Energy2015Energy2014Energy
November–December1863November–December1858November–December1268
September–October2878September–October2477September–October1995
July–August2311July–August2406July–August1512
May–June1912May–June1708May–June1073
March–April741March–April671March–April673
January–February714January–February630January–February644
Total Energy10,419 9750 7165
Energy/Capita3473.00 3250.00 2388.33
Energy/m256.93 53.28 39.15
Baseline: Total energy: 14,884 KW, Energy/Capita: 3721 KW, Energy/m2: 92.42 (Taipei, Condominium, Facing West).

