Article

Ecological Land Fragmentation Evaluation and Dynamic Change of a Typical Black Soil Farming Area in Northeast China

College of Earth Sciences, Jilin University, 2199 Jianshe Street, Changchun 130061, China
*
Author to whom correspondence should be addressed.
Sustainability 2017, 9(2), 300; https://doi.org/10.3390/su9020300
Submission received: 20 December 2016 / Revised: 12 February 2017 / Accepted: 14 February 2017 / Published: 17 February 2017
(This article belongs to the Section Environmental Sustainability and Applications)

Abstract

:
Ecological land is a land use category provided with considerable ecological value and a vital indicator reflecting regional eco-environmental quality. However, it has experienced severe fragmentation during the rapid urbanization in China which strongly threatened the regional ecological security, land use pattern and human living environment. Therefore, analysis of spatiotemporal change of ecological land use and ecological landscape pattern is particularly essential. In this paper, a case study was made in Nong’an County, which is a typical black soil farming area located in northeast China facing severe conflicts among cultivated land protection, urban expansion and ecological security. A landscape fragmentation evaluation model was proposed to measure the degree of regional ecological land fragmentation. We also determined the land use change features through the methods of dynamic change information exploration and by performing transfer trajectory analysis during the period from 1996 to 2014. The results showed that the ecological land in Nong’an County has experienced increasing fragmentation during the past 18 years. The statistical results showed that the land transition between ecological land and other land categories was quite frequent, and it especially appeared as a dramatic decline of grassland and severe increase of saline-alkali land. In addition, human interferences especially construction activities and cultivated land occupation were still the dominant factors to the fragmentation of ecological land and the frequent transition among the land use categories. The fragmentation degree showed a downward tendency at the end of the study, which indicated noticeable benefits of land use regulation and land protection policies directed towards land ecological value. This study aims to provide a scientific evaluation model for measuring ecological land fragmentation degree, and figure out the regional land use transition relationships to offer suggestions for decision-making and provide a practical case in a typical region.

1. Introduction

Rapid urbanization over the past 20 years in China has caused plenty of economic and social issues such as population explosion, built-up area expansion and environmental problems [1,2,3,4]. The interference of human activities has added more stress to natural habitats, which has directly affected the structure and function of the natural ecosystem and also caused ecological security problems in the form of environmental pollution, land degradation and a decrease in biodiversity [5,6,7].
Land use and land cover change (LUCC) has been an important research project of land science and sustainable development. As a land use category with considerable ecological functions, ecological land has become the basic carrier of the land ecosystem service in regions with a series of ecological functions, including water and soil conservation, wind prevention, sand fixation, climate regulation and biodiversity maintenance [8,9,10]. In addition, it also constitutes the matrix and connection among different land categories of the regional ecological landscape pattern and has direct impacts on social-economic-natural compound ecological system. The Quantitative measure of the ecological land use spatial pattern and land use changes is important to the comprehension of the regional land evolution and ecology security. However, limited by a land carrying capacity, irrational human production activities have occupied a large amount of ecological land and led to the increasing degree of land fragmentation, which will inevitably affect the regional-scale land use pattern [11]. Land fragmentation is a specific form to describe the landscape evolution and a significant feature representing ecological security. It deeply influences the landscape ecological processes, such as biological diversity, energy flow and material cycle, and also shows effect on land use mode and environmental sustainable development [12,13,14].
The traditional mode of studying ecological land mainly focused on analyzing landscape pattern succession and land cover change [15,16,17,18,19,20], measuring urban ecological land demand [21], building landscape ecological security pattern [22,23] and land use changes in ecologically fragile areas [24,25,26]. Lately, scholars have paid more attention to evaluating the landscape ecological security. In previous studies, Klijn presented a hierarchical approach to ecosystems classification and discussed the relation between the classification characteristics and spatio-temporal hierarchy of ecosystem components [27]. Meng studied the dynamic changes of landscape connectivity for ecological land based on the graph theory and determined the distance appropriate landscape threshold [28]. Zang constructed an ecological vulnerability assessment indicator system to conduct an empirical analysis of the changes in the spatio-temporal patterns, ecological vulnerability, and ecosystem services of typical landscape types [29]. Su quantitatively explored the fragmentation features of ecological land and the relationships with urbanization scale and spatial configuration in the Yangtze River Delta [30]. Peng reviewed the diverse connotations of ecological land from different perspectives and discussed the similarities and differences between ecological requirement and ecological land requirement. This study also proposed an ecological land requirement estimating system based on urban spatial and functional characteristics [21]. Zhou identified ecological land by building ecological security patterns of different ecological processes and made appropriate references for urban ecological programming and spatial layout planning [22].
The ecological significance of ecological land was well-know and has been widely discussed. However, the utilization value of ecological land for optimizing land use pattern and allocation has been ignored, and studies about land fragmentation were barely concerned to ecological land. A good understanding of ecological land fragmentation may not only help to figure out the ecological land use pattern but also provide basis information for policy making. In addition, further analysis of land use changes and internal transition relations can reflect the possible driving factors of land fragmentation. In view of the overall increasing land fragmentation, land policies such as land consolidation and the project of returning cultivated land to forest and grassland have been implemented to reduce the fragmentation. Along with the demanding requirement to land ecological protection, scientific measurement and analysis of driving factors for land fragmentation are the essential elements to make appropriate land use planning and policies. Black soil area is feasible for cultivation because of the fertile soil, nevertheless, the conflicts between land protection, ecological security and urban sprawl in this area has been increasing in recent decades. Ecological land in black soil area plays an important role in sustaining regional ecological environment and cultivated land quality. It is helpful to optimize land use pattern and maximize the use value of different land use types by understanding the ecological land fragmentation and land use changes.
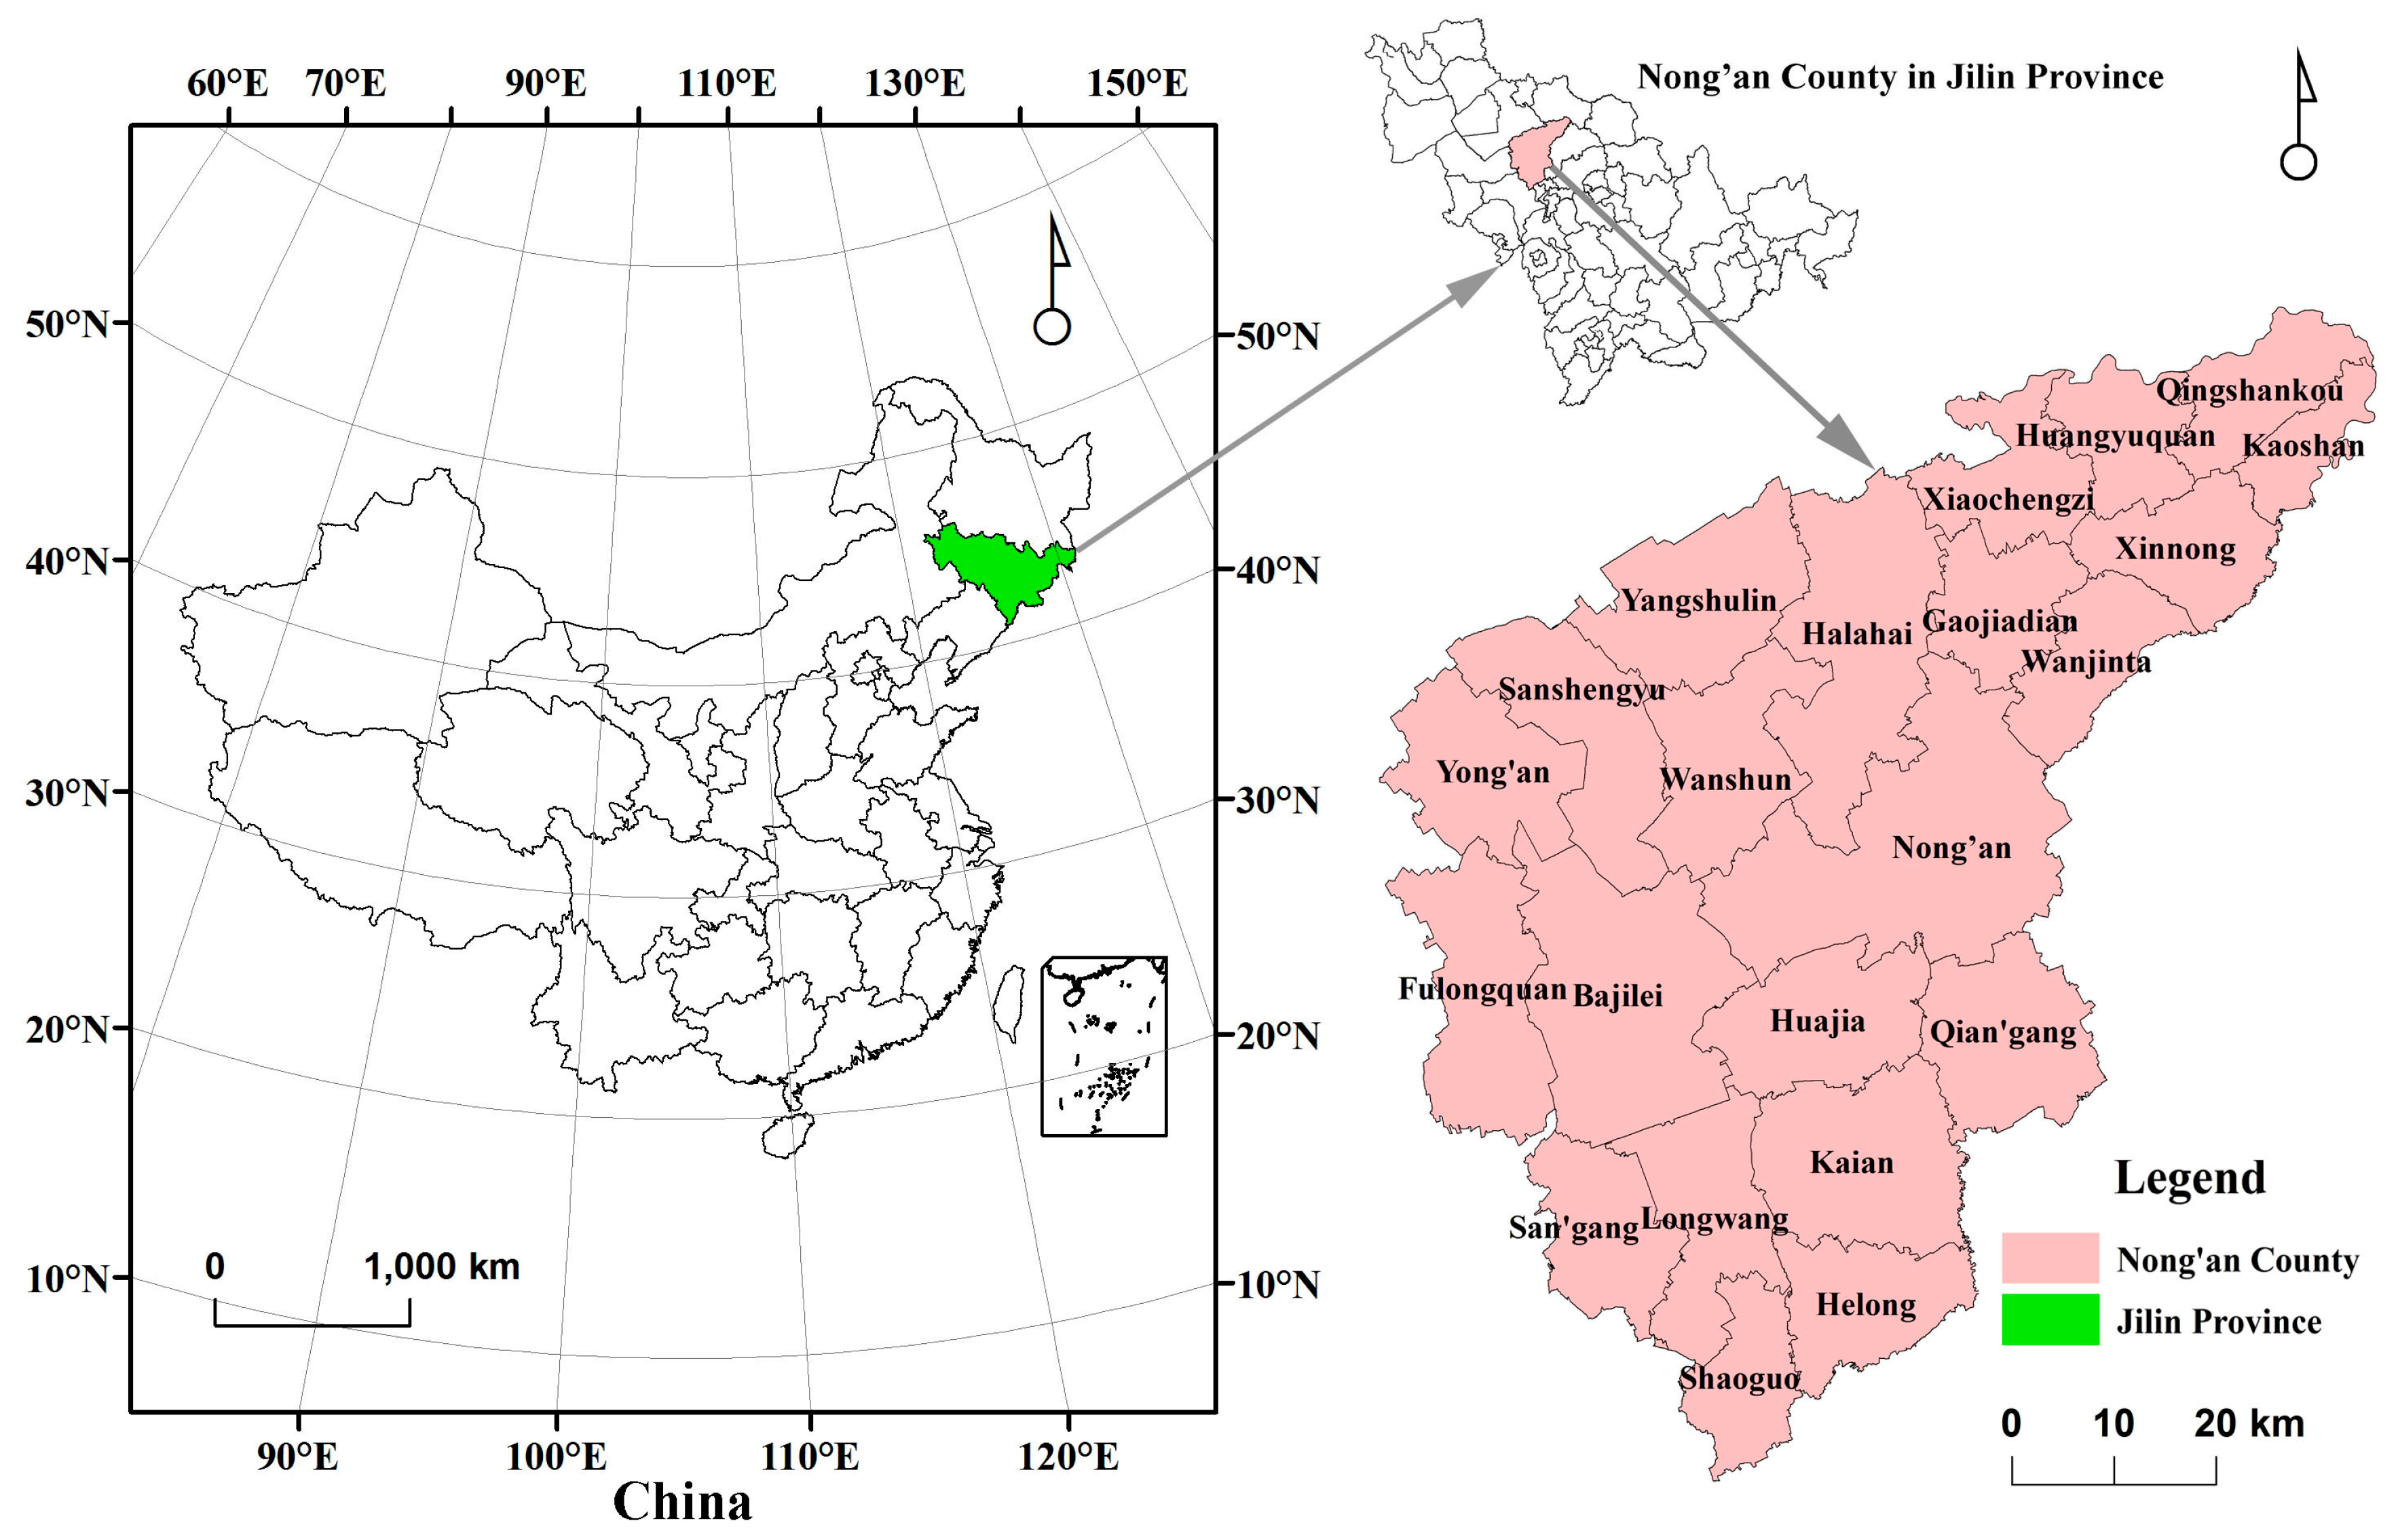
In this study, we use Nong’an County as a case, which is a black soil farming area located in northeast China, to propose a landscape fragmentation evaluation model by selecting appropriate landscape indices from the aspects of area, shape and aggregation at county scale. Integrated measuring methods were chosen to detect land use dynamic changes and transition relations among different land use categories. The objectives of this study are: (1) to depict the spatial-temporal variations of the ecological land fragmentation and reveal the landscape evolution process in Nong’an County during 18 years; (2) to analyze the land use changes quantitatively and trace land transition trajectories by the methods of measuring land use dynamic degree and land use trajectory analysis; (3) to explore the possible driving factors of ecological land fragmentation comprehensively and propose appropriate suggestions for formulating land management policies and sustainable development. This study aims to provide a scientific evaluation model for measuring ecological land fragmentation, and figure out the regional land use transition relationships to offer suggestions for land planning and provide a practical case in a typical region.

2. Materials and Methods

2.1. Study Area

Nong’an County (43°55′–44°55′N, 124°31′–125°45′E) is located in the middle of the Songliao plain, Northeast China, under the administration of Changchun City (Figure 1). It covers an area of 5400 km2 and encompasses 22 villages and towns. This region is located in the black soil area of northeast China, which belongs to one of the world’s three black soil zones, and it is also a significant commodity grain base. The geomorphologic characteristics of Nong’an County are platform and basin to the west and a fluvial-alluvial plain to the east, with an average elevation between 250 and 270 m. Climatically, Nong’an County belongs to a temperate continental monsoon climate with distinct seasons. The mean annual temperature is 4.7 °C. The zonal soil types are black soil and chernozem. Nong’an County consists of leymus chinensis meadow steppe, which is a typical farming-pastoral ecotone. Within this region, the western basin area is under low-lying terrain belongs to the inland noncontributing area, with small lakes and poor groundwater resource, which led to the emergency situation of soil salinization, desertification and decline of natural land productivity. This region was defined as an ecologically vulnerable zone.

2.2. Data Sources and Processing

Land use data were obtained from the first national land survey database in 1996, the second national land survey database in 2009 and a detailed land survey database in 2014. Considering the change of the classification criteria, land use categories were unified based on the “Current Land Use Classification” standard (the predominant land use classification system used in China for land use planning and policy-making issued by the Minister of Land and Resources of China in 2007 to define the land use type and meaning). Meanwhile, the study region was divided into 22 evaluation units by administrative boundary, containing villages and towns, to indicate land use changes at the villages and town’s class and be feasible to cooperate with other planning departments on decision-making. The vector data were converted to a unified projection and coordinate system in ArcGIS 10.2 software (ArcGIS, 10.2, Esri, Redland, CA, USA), and the grid cell size was set at 30 m × 30 m in view of the study area. Social and economic statistical data were derived from the Nong’an Statistical Yearbook and relevant statistical bulletins.

2.3. Ecological Land Definition and Land Use Classification System

The predominant “Current Land Use Classification” system in China does not include a defined ecological land category and the ecological value of land can rarely be reflected in the classification system [8,9,31]. Ecological land is not a specifically and uniformly defined land use category, diverse connotations could be given based on different research objectives. In the past researches, ecological land can be identified based on the land principal function by synthesizing different data sources, such as vegetation cover, terrain data and land use characteristics. Relevant technical means, such as remote sensing techniques, are used to extract spatial information and determine the spatial structure of ecological land [32]. Another method is to directly extract the land use/cover types with ecological attributes from existing land classification database or interpreted from satellite remote sensing images according to research objectives [9,30]. Based on landscape ecology theory, we can also delimit a boundary of ecological land in regional by identifying a landscape ecological pattern. Furthermore, there are studies of ecological land identification by calculating the ecosystem service value (ESV) of land use categories [23,32,33].
In this study, we defined ecological land as a land use category that embodies the ecological value as its primary utilization value and functions land ecosystem services (e.g., water and soil conservation, climate regulation and biodiversity maintenance) to maintain regional ecological security and sustainable development. Considering the land use conditions and the “Current Land Use Classification”, we classified the land use types into four main categories: ecological land, cultivated land, construction land and unutilized land, while ecological land was subdivided into four classes: forest land, grassland, water and saline-alkaline land (Table 1). As the expansion of saline-alkaline land has caused severe regional ecology conflicts in study area such as grassland degeneration, soil salinization and alkalization. We pointed it as a specific category of ecological land to measure the effect of saline-alkaline to regional ecological security.

2.4. Methods

2.4.1. Ecological Land Fragmentation Evaluation Model

Land fragmentation is the manifestation of regional landscape pattern to indicate the changing process of patches from simple to complex, and is caused by natural or human interference factors. The landscape pattern was broken from a single homogeneous and continuous patch to heterogeneous and discontinuous mosaic pattern patches [34,35]. The degree of land fragmentation can be reflected at the landscape level, and landscape ecology indices can be used to discuss ecological land fragmentation by building an evaluation model for quantitative analysis. The chosen indices should be proved to describe landscape fragmentation appropriately, with low redundancy. Furthermore, the indicative significance of the indices should cover comprehensive aspects of the landscape area, shape, aggregation. In this study, six indices (PD, ED, AWMSI, FS, AI and COHESION) were selected to describe the fragmentation characteristics of ecological land during the time intervals. The implications of each metric are detailed below [36,37,38,39].
(1)
PD (Patch Density) is the patch numbers per unit area. The higher the value is, the greater the fragmentation degree it shows. PD is calculated by Formula (1):
P D = N / A
where N is the number of patches in the landscape and A is the total area of landscape. PD > 0.
(2)
ED (Edge Density) is the total length of the boundary per unit area, which describes the shape characteristic of the patch. The higher the value is, the greater the fragmentation degree it shows. ED is calculated by Formula (2):
E D = E / A
where E is the total length of patch boundary and A is the total area of landscape. ED > 0.
(3)
AWMSI (Area-Weighted Mean Shape Index) is a metric to measure the complexity of the patch shape and landscape spatial pattern. The higher the value is, the more complexity the patch shape shows. It can be calculated by Formula (3).
A W M S I = i = 1 n [ ( 0.25 P i / a i ) ( a i / A ) ]
where n is the number of patches, P is the patch perimeter, a is the patch area and A is the total area of landscape. AWMSI ≥ 1.
(4)
FS (Patch Mean Shape Fragmentation Index). The higher the value is, the more complexity the patches show. It can be calculated by Formula (4):
F S = 1 1 / M S I
M S I = i = 1 n ( 0.25 P i / a i ) / N
where MSI is the Mean Shape Index, n is patch numbers, P is the patch perimeter and a is the patch area. 0 < FS < 1.
(5)
AI (Aggregation Index) is calculated based on the length of the pixel common boundary in the same class patch. When all of the pixels do not share a common boundary, the index shows the minimum degree. It presents the maximum degree with the largest common boundary, and can be calculated by Formula (6):
A I = [ g i i max g i i ] ( 100 )
where gii is the number of similar adjacent patches. 0 < AI ≤ 100.
(6)
COHESION (Patch Cohesion Index) is expressed as a percentage of the maximum possible connectivity in view of the number of patches. It can be calculated by Formula (7):
C O H E S I O N = [ 1 j = 1 n P i j / j = 1 n P i j a i j ] [ 1 1 / N ] 1 × 100
where Pij is the perimeter of class i, patch j. N is the total grid numbers. 0 ≤ COHESION ≤ 100.
The ecological land fragmentation (ELLF) evaluation model was constructed given the specific ecological significance of each index. Three layers were included in the evaluation model: the area-edge index layer, the shape index layer and the aggregation index layer [40,41], which could comprehensively describe the ecological land fragmentation. Generally, patch density and edge density were closely related to fragmentation degree, higher density indicated higher fragmentation degree. In addition, fragmentation degree is also related to patch shapes. Within the same land area, the more complex the patches were, the higher the fragmentation it showed. Moreover, patch distribution and aggregation degree affected land fragmentation as well. Scattered patches denoted high division degree of land, the higher the aggregation degree was, the higher fragmentation degree it showed.
The area-edge index layer consisted of PD and ED. PD measured the number of patches while ED represented the division pattern of patches. This layer was able to describe the landscape patch density and division degree intuitively from the aspect of land area. The shape index layer consisted of AWMSI and FS which both reflected the fragmentation in the aspect of land shape. AWMSI was chosen to indicate the complexity of patch shape, the more irregular the patches shape were, the larger junction area there was between ecological land and other land use categories, the smaller proportion of valuable ecological land took. AWMSI was chosen to cooperate with FS, which described land fragmentation degree based on mean shape index, to indicate land shape fragmentation. The aggregation index layer was consisted of AI and COHESION. The two indices both measured the connectivity and aggregation of patches to describe land distribution and fragmentation. Formulas are as follows:
A-EF = a P D + b E D
S F = c A W M S I + d F S
A g F = e A I + f C O H E S I O N
where A-EF is the area-edge fragmentation layer to describe the landscape patch density and division degree. SF is the shape index layer that indicates the complexity of the landscape. AgF is the aggregation index layer to measure the connectivity between patches. a, b, c, d, e and f are the weights of each layer. This study adopted the entropy weight method to determine the weights of each time node (1996, 2009, 2014) respectively using the results of landscape indices and consulting existing studies [42,43]. The results were shown in Table 2.
Using A-EF, SF and AgF as variables to synthesize the indices can directly denote the ecological land fragmentation characteristic. In this study, we put forward a comprehensive index ELLF (Ecological Land Fragmentation) to measure fragmentation. The specific formula is as follows:
E L L F = α ( A-EF ) + β S F + γ A g F
where ELLF is the ecological landscape fragmentation; α , β and γ are the weights of each layer, which were calculated as 0.16, 0.54 and 0.30, respectively, by AHP (Analytic Hierarchy Process).

2.4.2. Land Use Dynamic Degree

The land use dynamic degree is one of the main models for analyzing the change rate of land use area. It represents the speed and intensity of land use change during time intervals [44]. The formula is:
K = U b U a U b × 1 T × 100 %
where K is the dynamic degree of one land use category during the study period; U a and U b are the land areas of the initial year and final year, respectively; and T is the length of the study period.

2.4.3. Land Use Change Trajectories Analysis

Trajectories analysis is a method of portraying land temporal dynamic trajectory changes. It records the parcel states of each node during a time series into a new trajectory map by raster overlaying analysis. The temporal and spatial characteristics of land use changes can be determined via spatial statistical analysis. The trajectory changes are expressed by trajectory codes as a number or letter. Track codes identify the land change trajectory of the corresponding parcel during a time series [45,46,47,48]. This study used numeric codes to mark land categories; “1” stands for “Forest land”, “2” stands for “Grassland”, “3” stands for “Water”, “4” stands for “Saline-alkaline land”, “5” stands for “Cultivated land”, “6” stands for “Construction land” and “7” stands for “Unutilized land”. For example, code “256” represents for land category changes as a sequence of “Grassland-Cultivated land-Construction land” in one pixel of three time nodes (Figure 2).
When the land type is less than 10 categories, the trajectory codes in each parcel can be calculated using the follow formula, by “Raster Calculator” mode in ArcGIS:
T i j = ( G 1 ) i j × 10 n 1 + ( G 2 ) i j × 10 n 2 + + ( G n ) i j × 10 n n
where T i j is the trajectory code from raster i to j; n is the number of time nodes; and G 1 ,   G 2 , , G n are the codes of land categories in each time node. When the number of land categories is more than 10, a trajectory code is usually replaced by a letter.

3. Results

3.1. Analysis of the Ecological Land Fragmentation Results

Landscape indices were calculated using the Fragstats 4.2 software (Fragstats, 4.2, Oregon State University, Corvallis, OR, USA), and the results are shown in Table 3. It was found that the values of land fragmentation indices in most of the evaluation units increased significantly from 1996 to 2014, which indicated a high fragmentation characteristic. PD and ED were at relatively low levels in 1996, with good integrity and connectivity. PD and ED rose sharply from 1996 to 2009, and the homogeneity of the patches decreased along with intense fragmentation. During this period, human activities and urban expansion played important roles in ecological land fragmentation. The value of AWMSI and FS, which described the ecological land shape fragmentation, showed an increasing tendency in most of the evaluation units. The spatial pattern of the ecological land was decentralized and irregular. AI and COHESION decreased continually in 18 years. The connectivity between patches became weak and patches turned towards distributed and heterogeneous. The combination of the indices showed that the ecological landscape pattern gradually shrank from continuous and homogeneous land to discontinuous and decreased patches. From 2009 to 2014, the fragmentation process was relatively slow and fell after a rise. With the emphasis on ecological land protection and land management, the negative influences of human activities on ecological land had been weakened. The ecological land fragmentation recovered slightly, and the landscape security tended into a smooth state.

3.2. Spatial Evolution of Ecological Land Fragmentation

To calculate the ELLF, values of landscape indices were carried out by normalization processing and separate weights were assigned to different layers. The values were classified into four grades, from level I to level IV, considering the value range and the availability for land planning. A higher value corresponded to a higher level, which revealed a more intense fragmentation pattern. Level I represented for low fragmentation degree, level II represented for a slight fragmentation degree, level III showed a moderate fragmentation degree and level IV indicated a high fragmentation degree. Fewer grades could not reflect well-defined fragmentation degree while more grades would bring difficulties for land management and planning. The degree was classified in ArcGIS 10.2 software by consulting the “Jenks natural breaks classification method”. “Jenks natural breaks classification method” is a classification method that seeks to partition data into classes based on natural groups in the data distribution which assigned breakpoint in the order of the size of the valleys”. The classification consequence was shown in Figure 3. The fragmentation degree in Nong’an County increased rapidly from 1996 to 2014, and the number of higher level units grew significantly. Overall, the fragmentation degree was relatively low in 1996. There was no level IV region, while the areas of level I and level II were widely distributed within 18 units. Gradually, the regions of level II and level III increased in 2009 and showed a sustained growth momentum, especially in the western and northeast region. There were 11 level III units and 7 level IV units. Until 2014, fragmentation of the whole region increased and the level III units were 14 and have covered most of Nong’an County. The units of level IV decreased slightly and distributed in the western and northeast regions, which were similar to the locations of the level II and level III areas in 2009.

3.3. Land Use Change Dynamic Characteristics

In order to measure the dynamic characteristic of land use change and land use transition relationships clearly between ecological land and other land categories or the internal changes of ecological land, we calculated the land use changes by seven land use categories which consisted of the sub-classes land use categories of ecological land and the other three major land use categories. Land use dynamic degrees were calculated based on land use data during different time intervals to indicate the change rate of each land use categories, the results were shown in Table 4 while land use area changes were showed in Figure 4 and Table 4. Cultivated land was the primary land use category, with over 70% of the total area, while the area had a small reduction, with a −0.04% land use dynamic degree from 1996 to 2014. As the second largest land use category, construction land continuously expanded during 1996–2014, and the total dynamic degree was 1.26%. Grassland and water were the main categories of ecological land in 1996, and they accounted for 4.47% and 5.87% of the total area, respectively. Grassland reduced by 185.04 km2, and the proportion fell to 1.06%, with a drastic dynamic degree change of −21.47%, which was the most severe category of land use change in this stage. Water decreased by 73.70 km2 and the proportion declined to 4.51%, while the total dynamic degree was −2.00%. Due to the “reconverting cultivated land into forest” policy and shelterbelt construction, forest land rapidly increased from 1996–2009 and relatively fell from 2009 to 2014, while the total area increased by 60.55 km2. Along with the extensive land degradation, saline-alkali land became the largest category of ecological land, with a total increase of 129.37 km2, which rose sharply from 1996 to 2009 and declined slightly after 2009. Saline-alkali land became the second largest drastic category of land use change, with a dynamic degree of 3.43%.
Considering the internal ecological land, the total area of ecological land reduced by 47.18 km2 from 1996 to 2009, while the area was 21.64 km2 from 2009 to 2014. The internal changes were more drastic than the overall change, which showed more frequent interactions among the sub-classes of ecological land. The features of land use change were denoted as a drastic reduction of grassland and a substantial increase of saline-alkali land. The consequences of human activities, such as cultivated land reclamation and grassland overgrazing, appeared to be significant reasons that led to ecological land fragmentation and soil degradation in 18 years.

3.4. Transition Matrices of Land Use Changes

The land use transition matrix was used for summarizing the dynamic transition information of land categories in each time interval. The results were shown in Table 5. As the implementation of “reconverting cultivated land into forest” and “land reclamation” policies, portions of the cultivated land and construction land were developed into forest land to enrich the land ecological function. The increase of the forest land was mainly at the expense of cultivated land and construction land. However, there was another source of forest land, which came from the artificial protection forest for protecting basic farmland in Nong’an County. Grassland declined by a large amount of acreage, which was converted to saline-alkali land and cultivated land. From 1996 to 2014, grassland converted to saline-alkali land by 135.90 km2, which caused the decrease of natural land productivity. Furthermore, human activities also exacerbated environmental changes in this region. Some small areas water might be reclaimed to cultivated land due to their development suitability. The saline-alkali land changed from large amounts of grassland and a portion of cultivated land, which denoted increasingly serious issues of salinization and ecological fragmentation.

3.5. Trajectories of Land Use Change

3.5.1. Land Use Trajectories Changes

In 1996–2009, there were 49 land use trajectory codes in total in Nong’an County, including 42 changed land trajectory codes. In 2009–2014, there were 28 trajectory codes in total, including 21 changed land trajectory codes. To generalize the transition types, we summed up the trajectory codes into 3 types as “the main transition types”, “the secondary transition types” and “the minimal transition types” (Figure 5). The results showed that the conversion process in 1996–2009 was more frequent than in 2009–2014, which should be limited by the length of time. The total area of changed land in 1996–2009 was 717.99 km2, which contributed to a percentage of 13.22% of Nong’an County. The main transition types accounted for 76.78% of changed land with 8 trajectory codes, and the land categories mainly converted among cultivated land, construction land and ecological land. The secondary transition types accounted for 22.67% of changed land with 26 trajectory codes, while the minimal transition types accounted for 0.60% of changed land with 8 trajectory codes. From 2009 to 2014, there was 34.42 km2 of changed land, and the ratio was only 0.63% of the total area. The main transition types accounted for 92.31% of changed land, with 4 trajectory codes. The secondary transition types contributed to a percentage of 7.37% of changed land, with 8 trajectory codes. The minimal transition types accounted for 0.32% of changed land, with 9 trajectory codes.

3.5.2. Land Succession Types

The practical land transition trajectory codes from 1996 to 2014 were summed to a total of 119, and the results were shown in Table 6 and Figure 6. According to the affecting factors of the land type conversion, trajectory codes were concluded as three types: “unchanged land type”, “human interference type” and “natural succession type”. The “unchanged type” represented unchanged land categories in one pixel during each time interval (e.g., “111”, “222”, “333” and “444”). “Human interference type” represented land changes caused by man-made external factors (e.g., “155”, “256” and “566”), such as the built-up area expansion and land reclamation, which indicated the influence of human activities on land use change. “Natural succession” was spontaneous land change with little or no effects of human activity, such as code “277” and “233”.
From 1996 to 2014, unchanged land occupied 86.46% of the total study area and the predominant category was cultivated land, which illustrated that land use pattern in Nong’an County was relatively stable in 18 years. Human interference land change occurred across 511.44 km2 with 85 trajectory codes and occupied 9.42% of the total area. The results also denoted that the land categories were frequently changed by human interference, but the intensity was not high. The natural succession land change area was 224.00 km2 and occupied 4.12% of the total area with 27 trajectory codes. Natural land succession did not change significantly. However, they were limited by the time span.
Figure 6 indicated that the human interference land use transitions were concentrated around the basins of the Yitong River and Xinkai River in the eastern region and sporadically spread across Nong’an County. The natural succession changes were mainly distributed in the noncontributing area of Bolo Lake, Mobo Lake and Goose Lake in the central and western regions. This region was surrounded by a platform and formed closed-flow basins in low-lying terrain with poor drainage, and the degree of soil salinization and degradation have gradually increased in recent years.

3.5.3. Trajectory Changes between Ecological Land and Other Land Categories

To figure out the transition relations between ecological land and the other land categories, we summarized trajectory codes as five types: “constant ecological land”, “turned into ecological land”, “turned into non-ecological land”, “short-lived ecological land” and “constant non-ecological land” according to the land use types at the beginning and end of the study period (Table 7, Figure 7). Constant non-ecological land contributed to 82.42% of the total area, while the proportion of constant ecological land was 10.90%. The total constant land contributed to 90% of the total area, and the transition between ecological land and other land categories changed slightly during the study period. The short-lived ecological land area was only 5.61 km2, which denoted that the ecological land was somewhat unstable and tended to convert to other land types. The area of the other land categories that became ecological land was less than the area of ecological land that became non-ecological land. The loss of ecological land was more than supplement, which led to unstable factors for ecological protection.

4. Discussion

4.1. Spatial-Temporal Changes of Ecological Land Fragmentation and Land Use

4.1.1. Ecological Land Fragmentation Changes

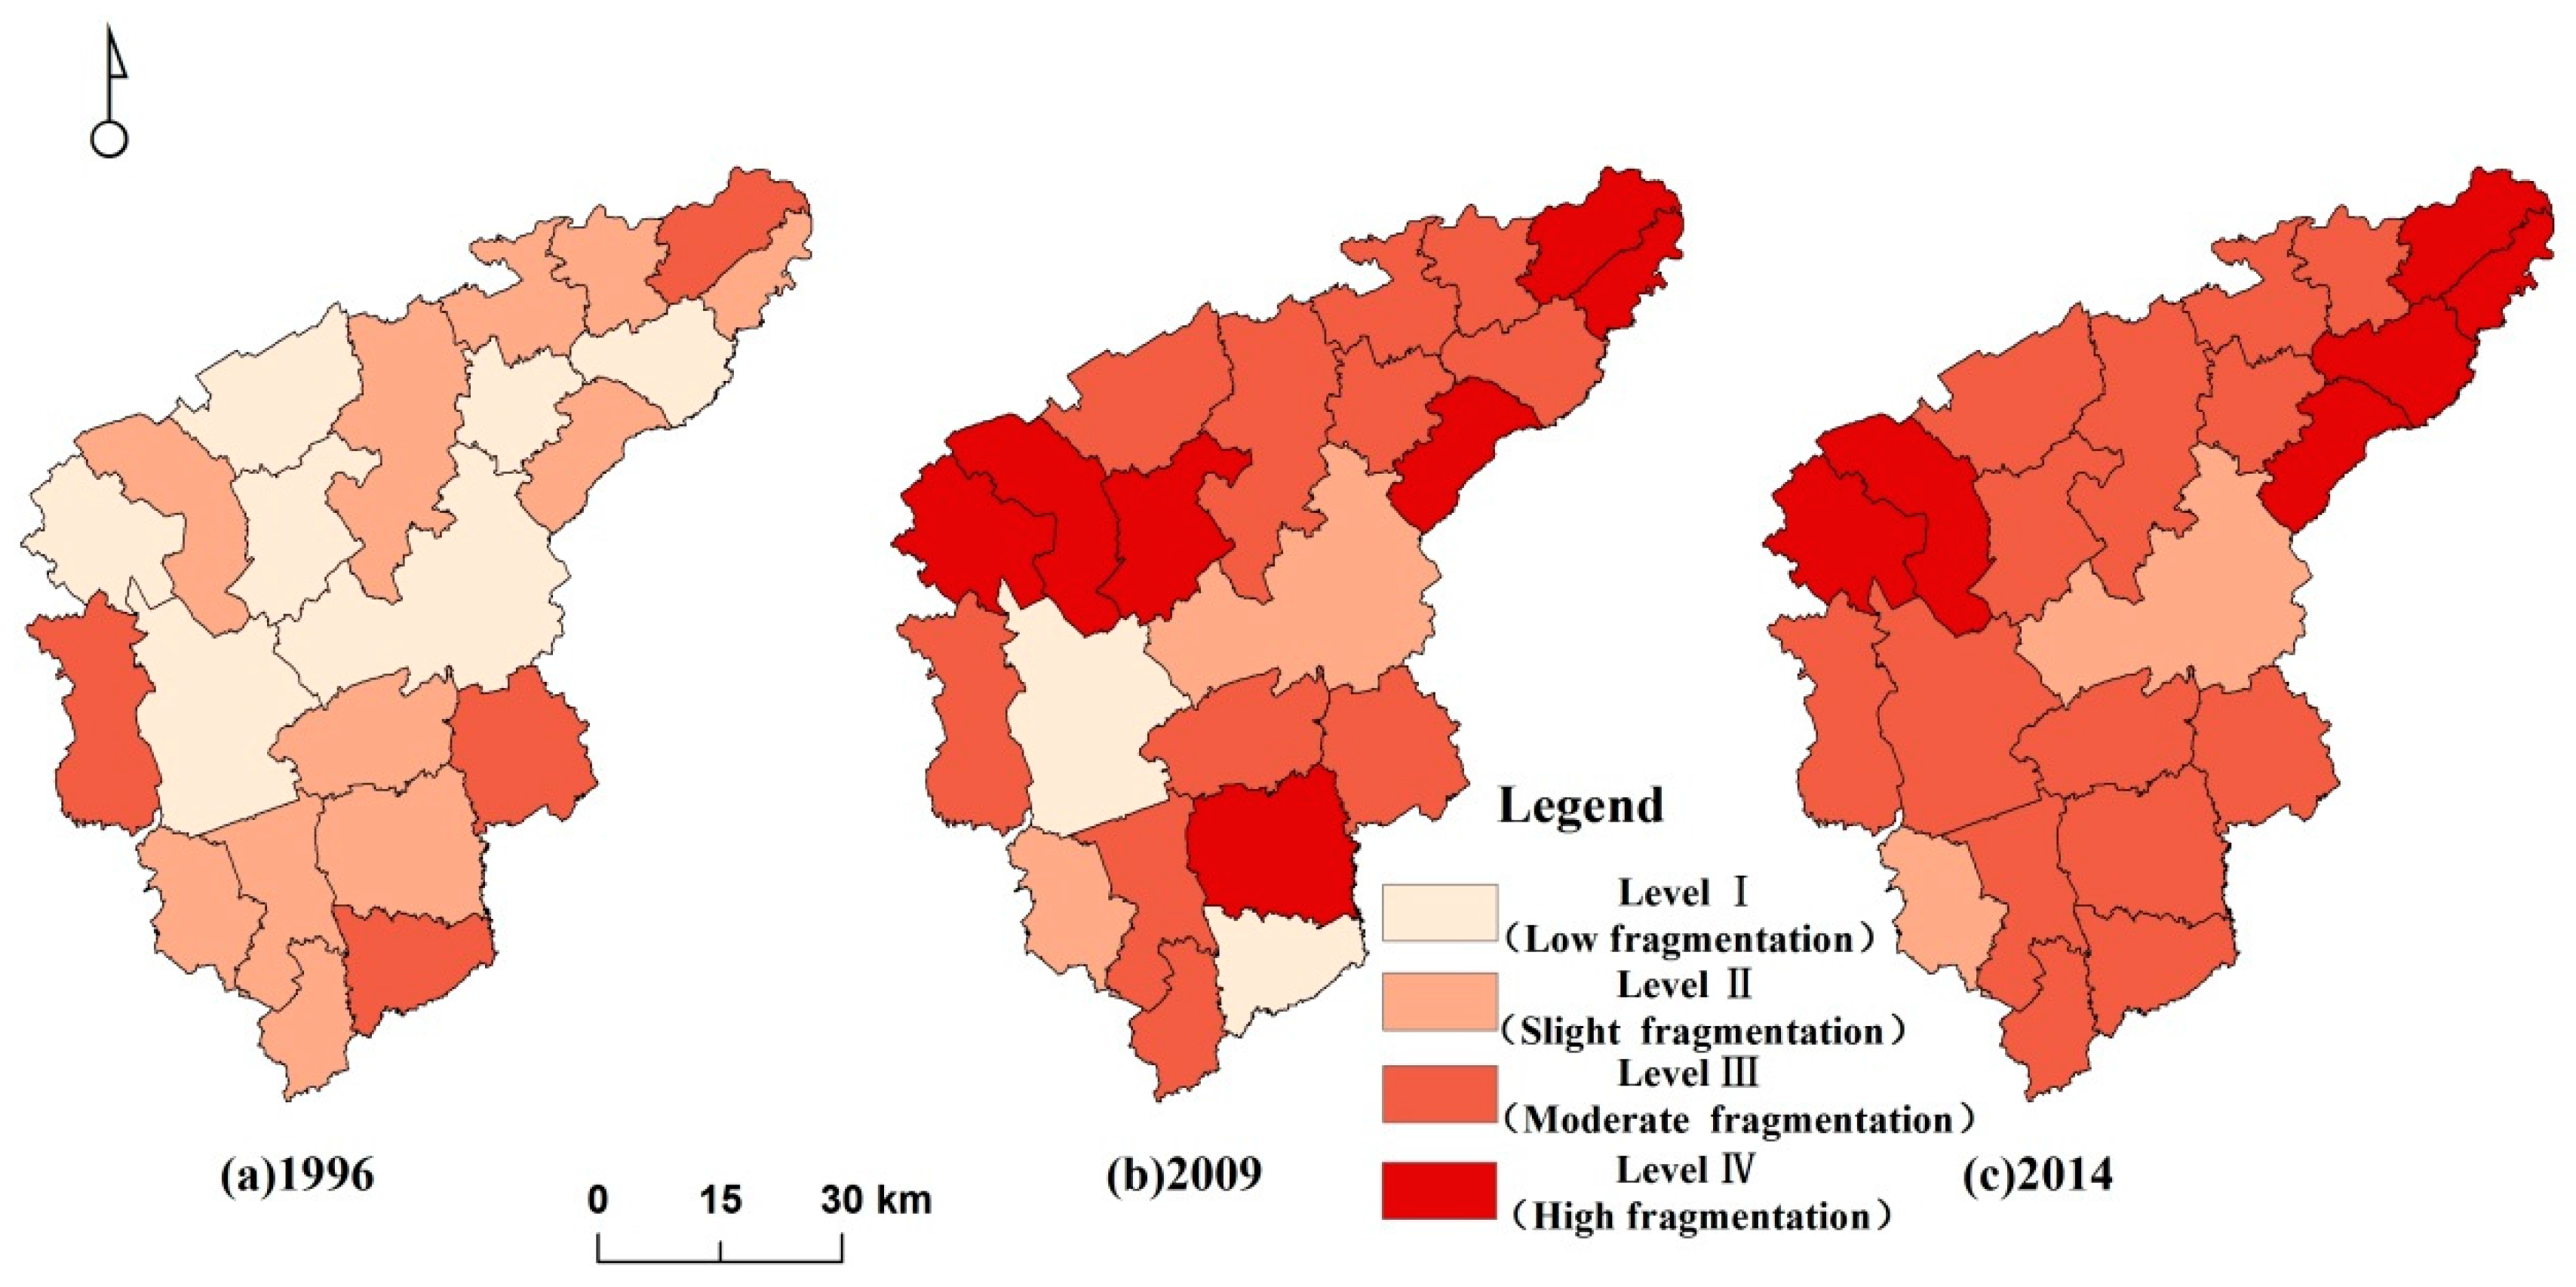
There is an intensifying trend of ecological land fragmentation in Nong'an County from 1996 to 2014. The general growth of indices’ value from 1996 to 2009 was more rapid than that from 2009 to 2014. Spatial distribution characteristics indicated that fragmented region for ecological land expanded significantly during the 18 years, in particular the high-level fragmentation area.

4.1.2. Land Use Dynamic Changes

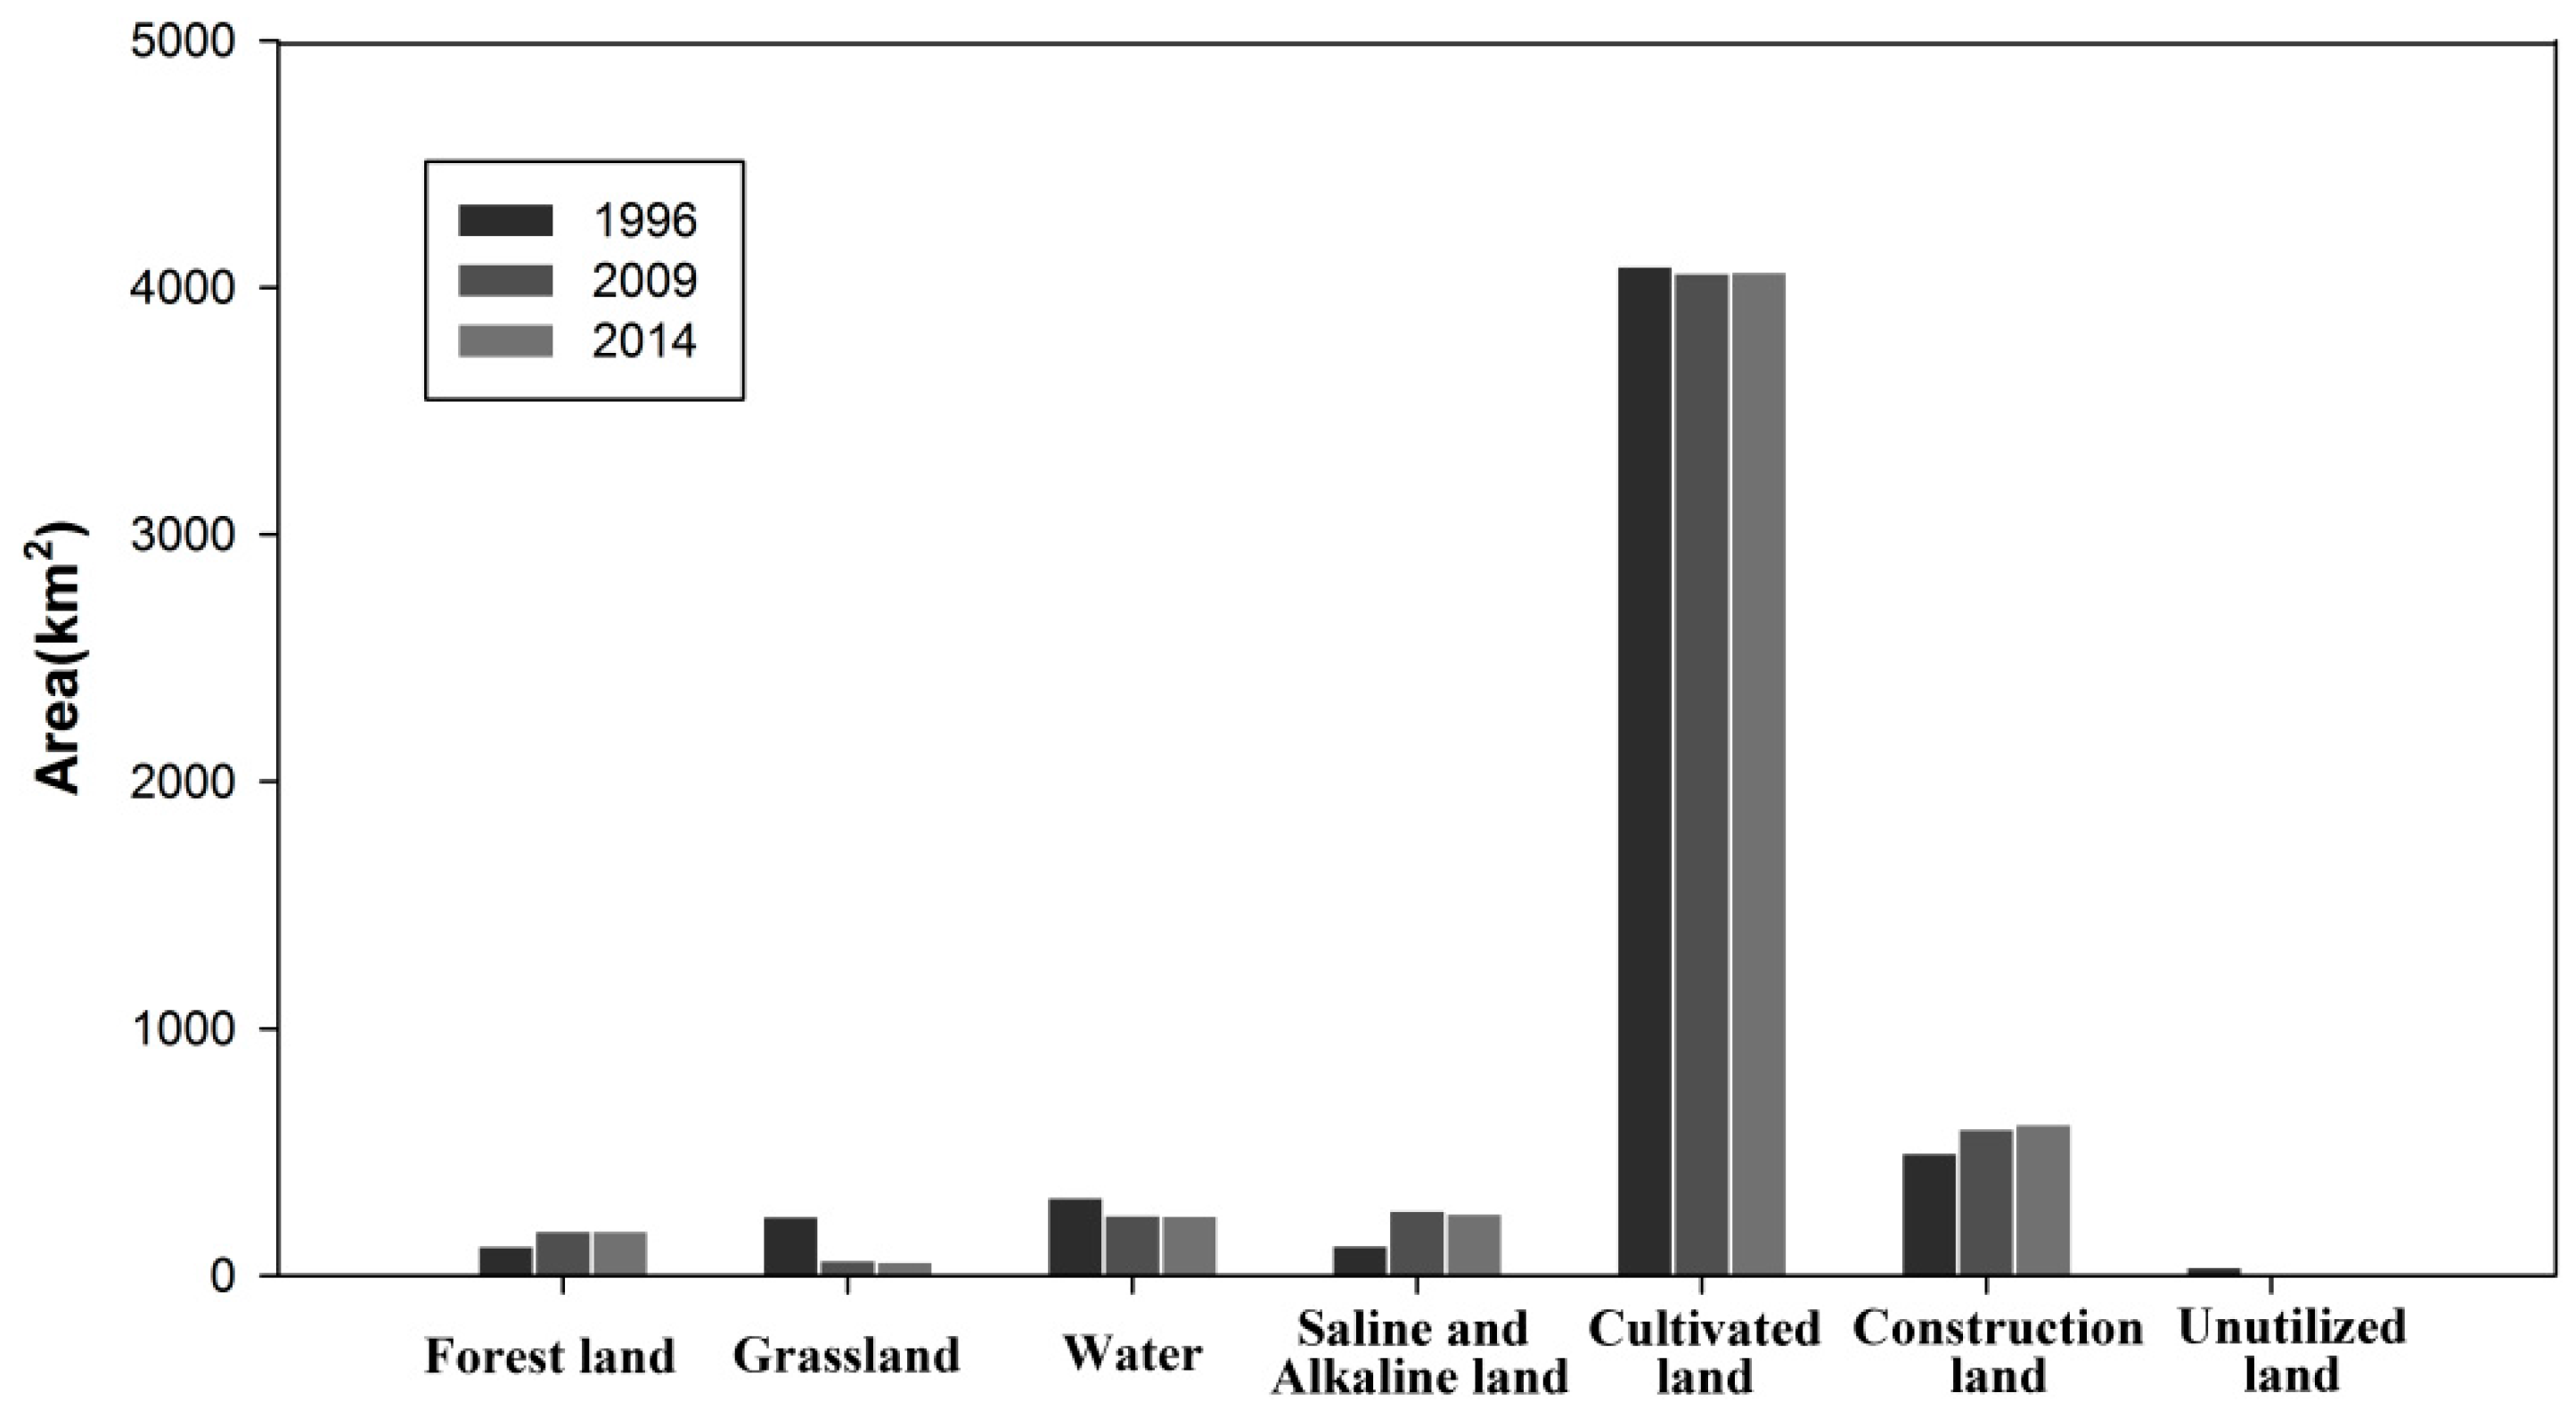
Ecological land consisted of four categories in this paper, which included forest land, grassland, water and saline-alkali land, to be analyzed with other land use categories. According to the results of the land use dynamic change degree and land use transition matrices, we could figure out that the ecological land decreased from 1996 to 2014 and that the internal categories changed more drastically than the ecological land itself. Grassland and saline-alkali land were the two major changed land use types during the study period, while grassland was mainly converted to saline-alkali land. Conversion between cultivated land, forest land and construction land also frequently occurred.

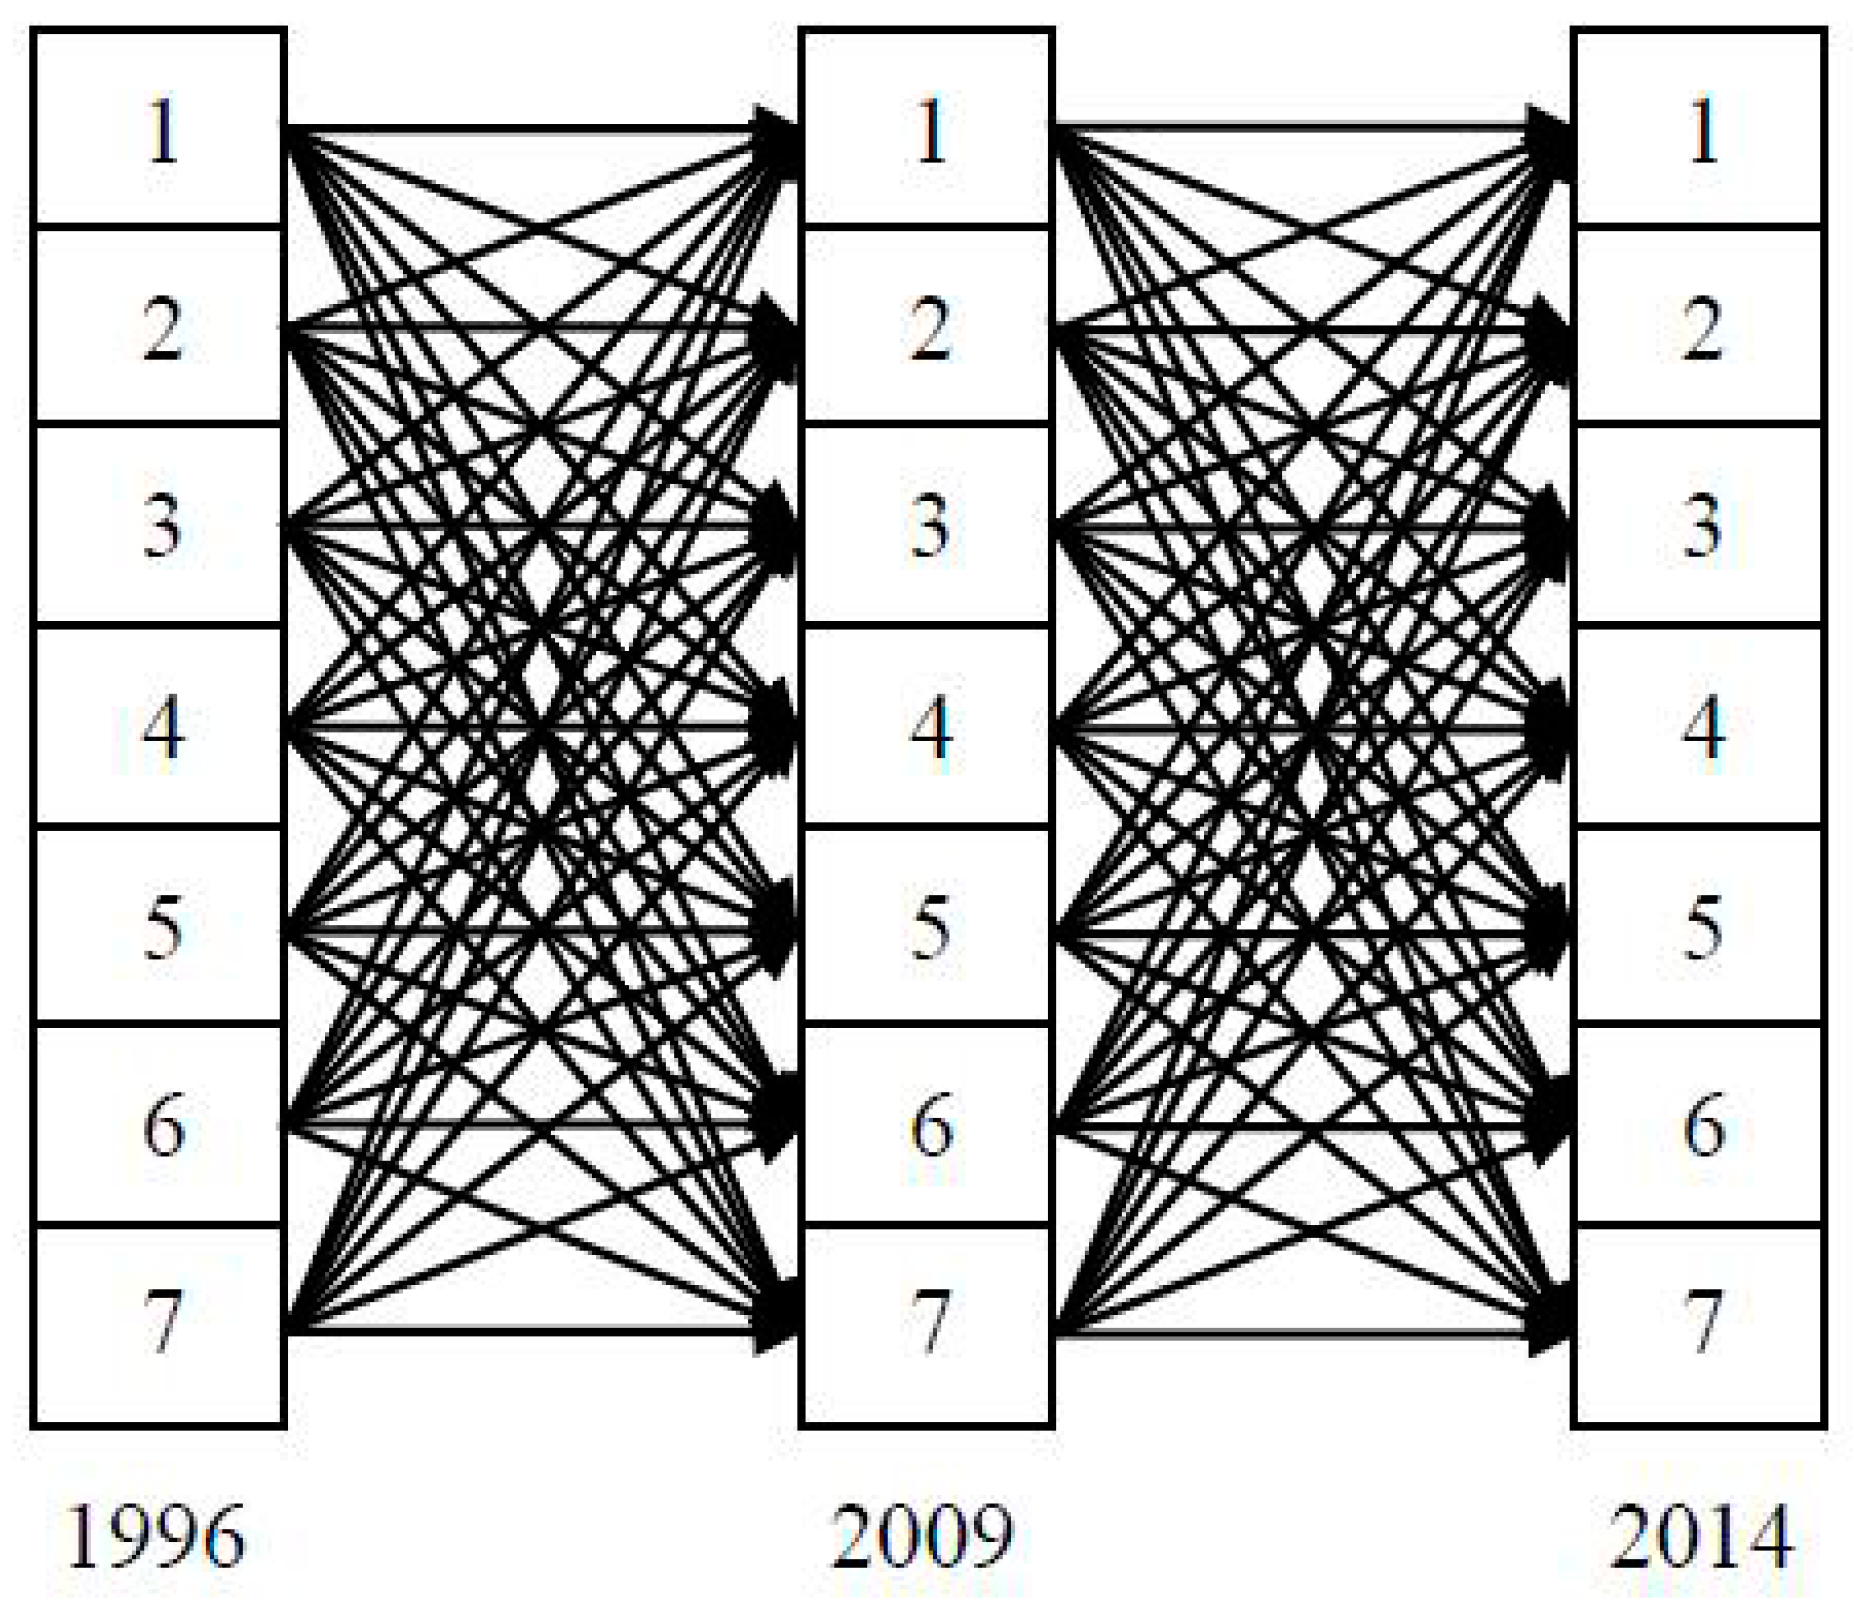
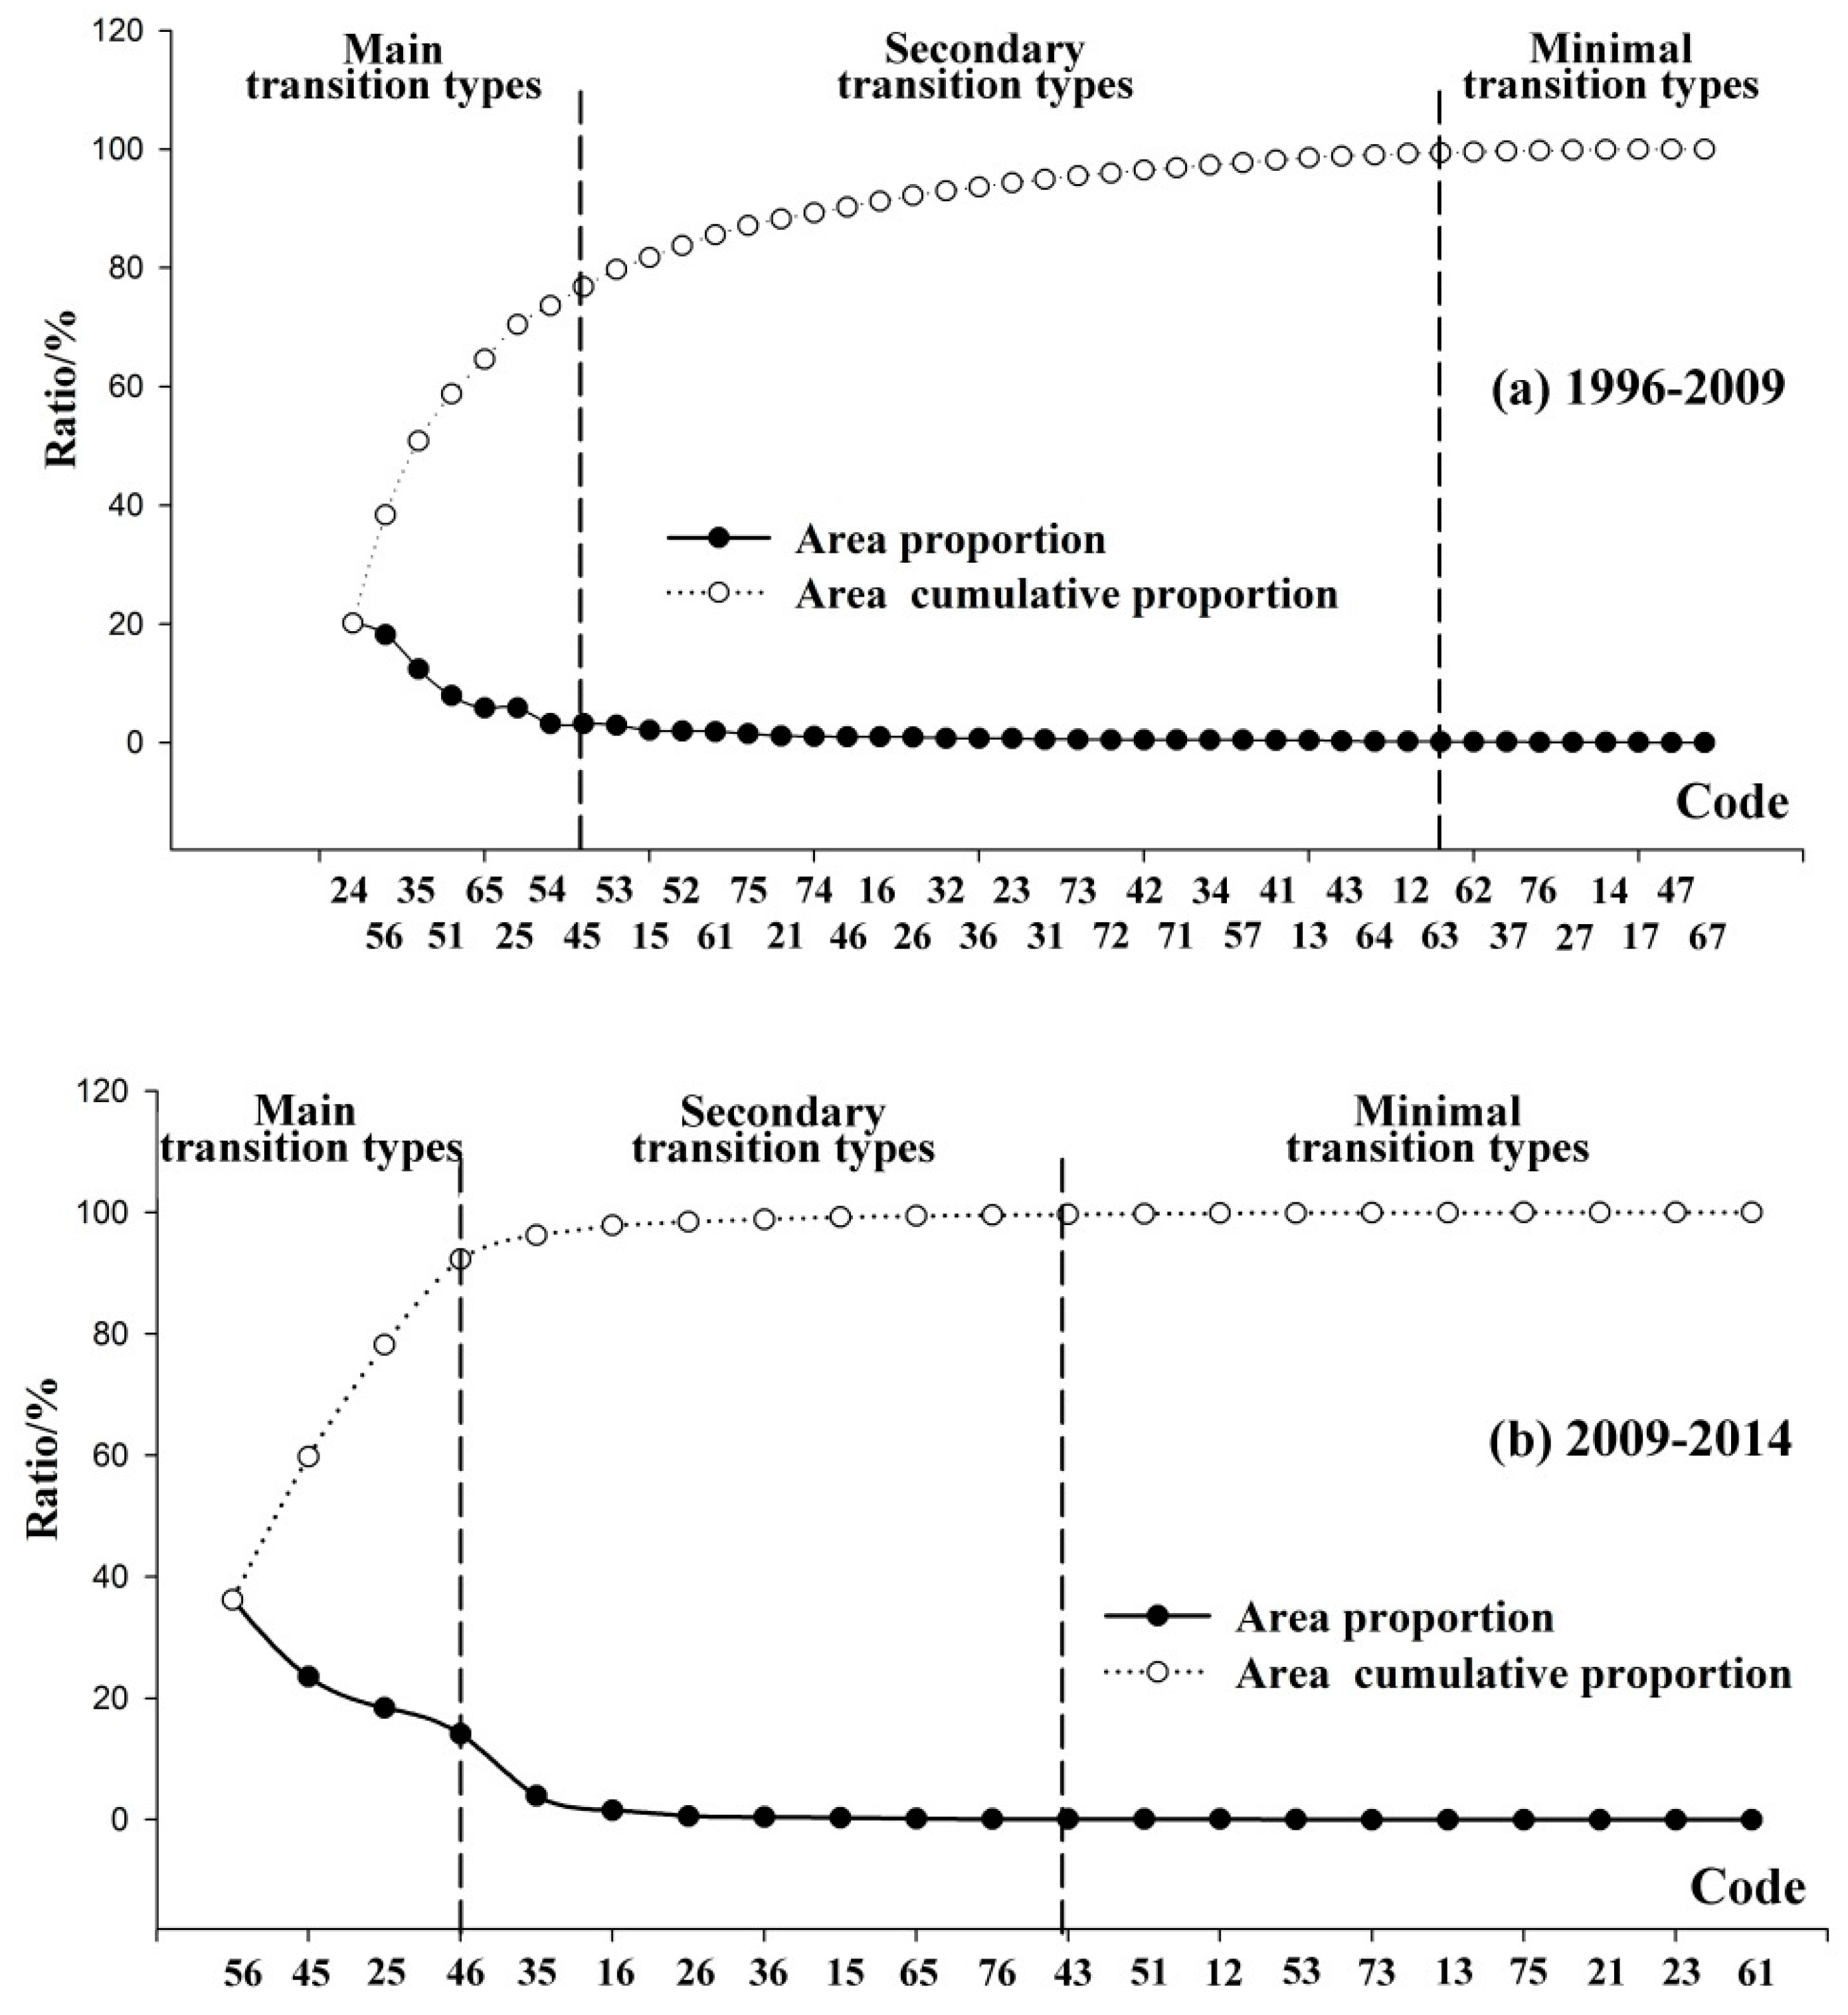
4.1.3. Land Transition Trajectories

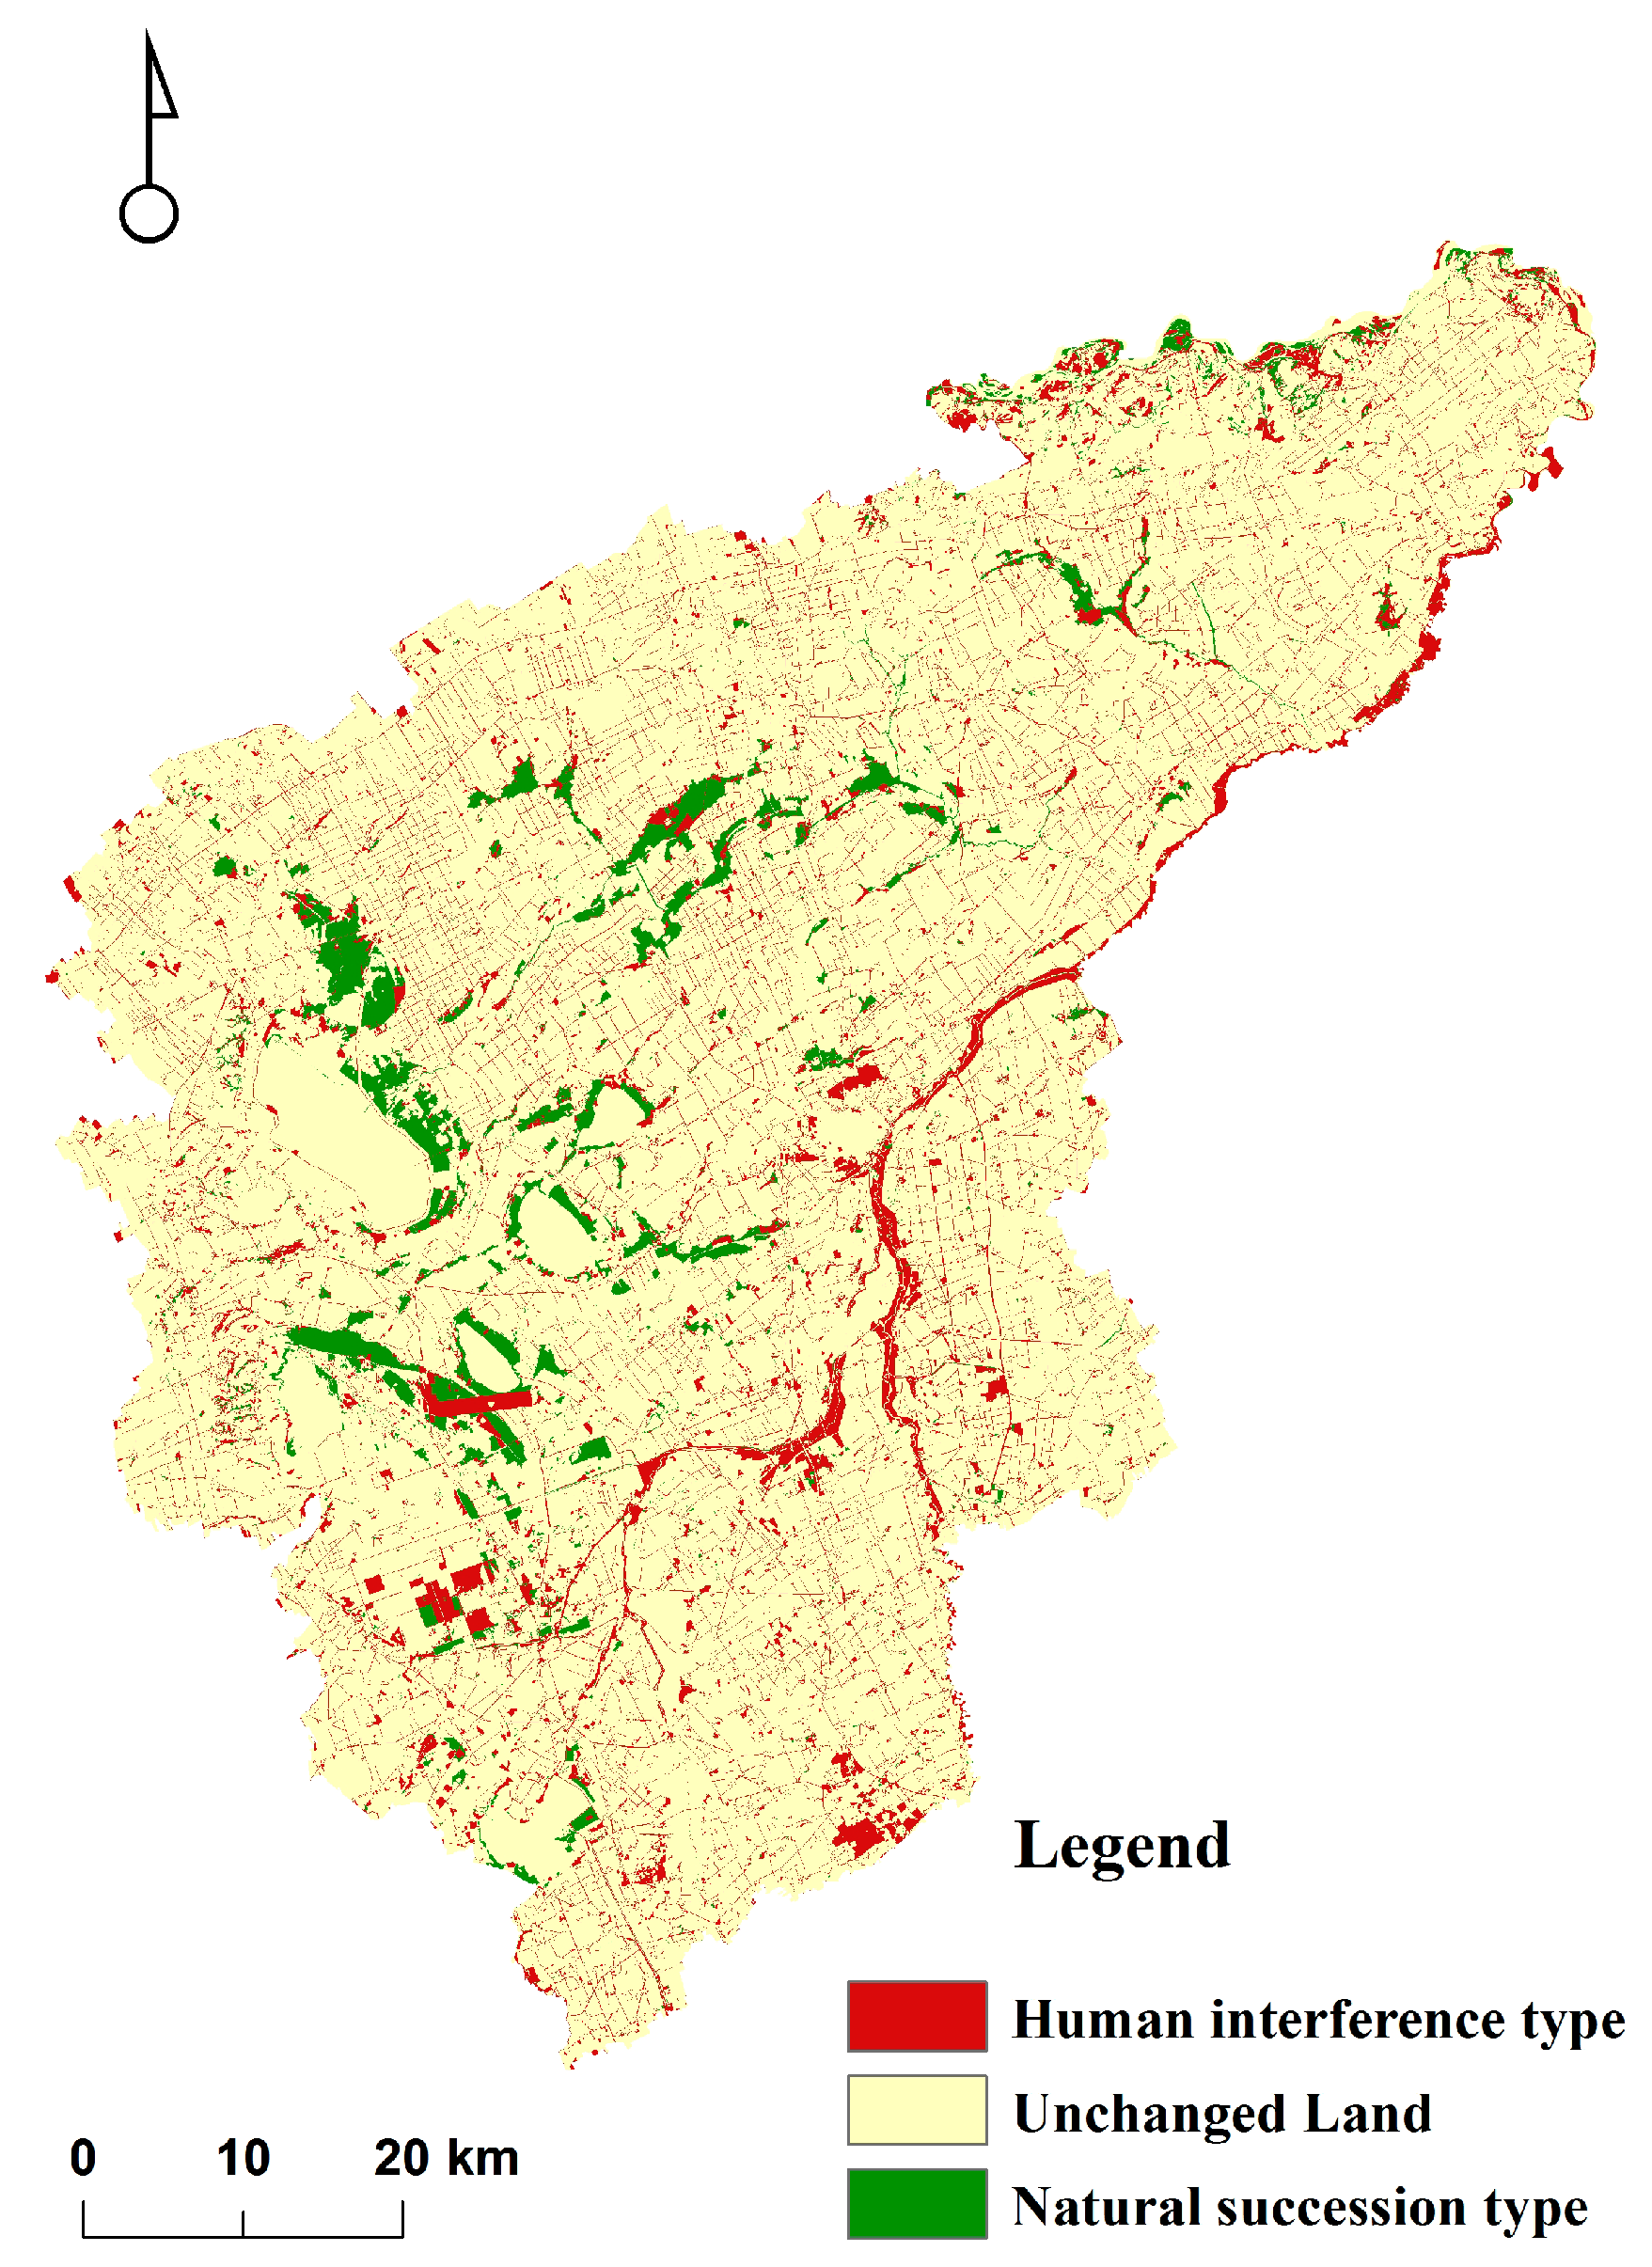
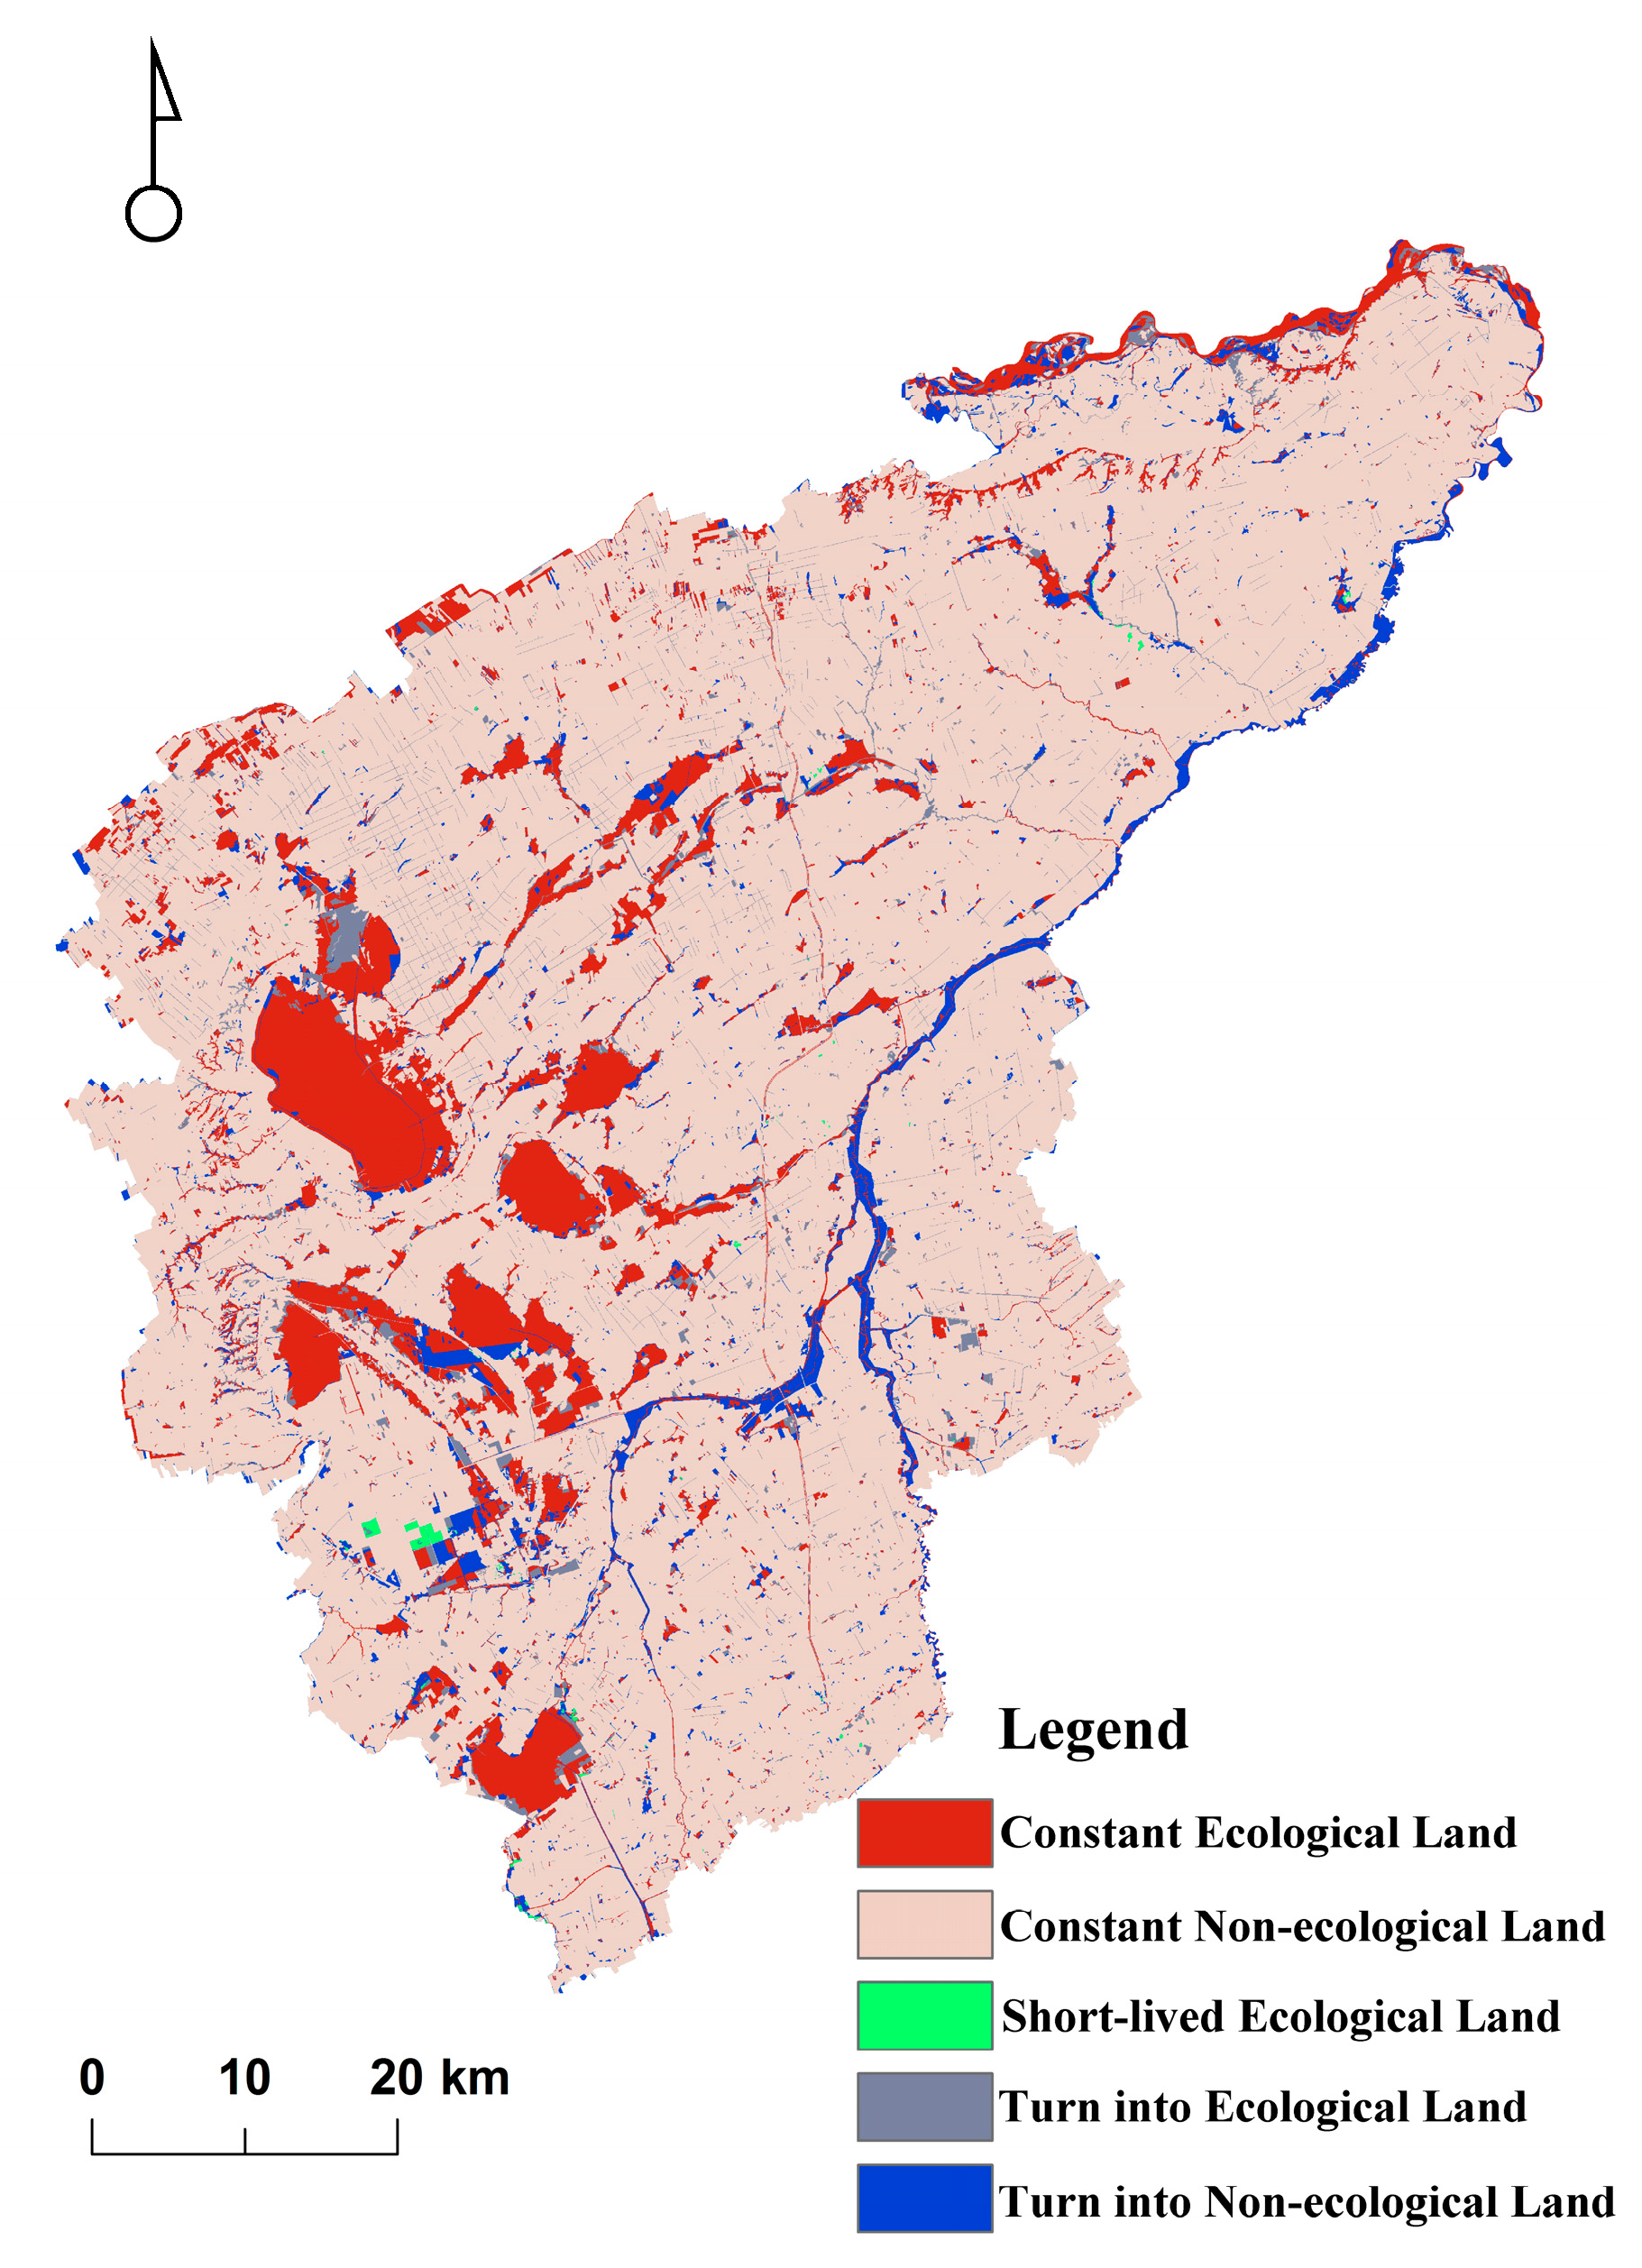
There were a total of 119 land transition trajectory codes during the study period, which indicated frequent conversion of land use categories. Among which, unchanged land took a proportion of 86.46%, which was relatively stable. Human interference land and natural succession land took proportions of 9.42% and 4.12%, respectively. In addition, constant ecological land contributed a massive proportion in the processing of ecological land transitions, while the area of other land categories that became ecological land was less than that of ecological land that became non-ecological land.

4.2. Driving Factors of Ecological Land Fragmentation

Land use pattern changes were results of the combined actions of multiple elements, such as natural, economic and social factors. With the acceleration of urbanization, Nong’an County is facing severe conflicts between urban sprawl, cultivated land protection and grassland degeneration, which were actually conflicts of urban development, food security and ecological environmental protection.

4.2.1. Human Interference and Rapid Urbanization

The analysis of the land use change trajectories indicated that human interferences, especially cultivated land reclamation and urban sprawl, has become the chief factors of ecological land fragmentation. Furthermore, with the improvement of agricultural technology and benefit-tending of farmers to plant cash crops, farmers would actively cultivate some available ecological land as cultivated land or as garden plots. However, this scattered individual behaviour could only reclaim limited and decentralized cultivated land. Furthermore, it broke the pattern of concentrated ecological land and led to severe fragmentation. In terms of population, the nonagricultural population of Nong’an County increased from 170,123 to 220,579 during 1996 to 2014, while the growth rate was 29.66%. Population urbanization is the core of urbanization, which demonstrated rapid growth in rural settlements, built-up areas and towns. Driven by economic development and technological progress, the expansion of industrial land and the secondary and tertiary industry lands were also important factors in breaking the ecological land continuity.

4.2.2. Grassland Degeneration and Environmental Issues

The western region of Nong’an County is located in a farming-pastoral ecotone. During the study period, a large amount of grassland had degenerated into saline-alkali land, and this region suffered from many environmental issues, such as soil fertility decline, vegetation cover reduction and serious water and soil erosion. According to the spatial heterogeneity characteristics of Nong’an ecological land, the fragmentation pattern in the western region rapidly increased during each interval. Large-scale degradation of grassland broke the contiguous ecological land use pattern, and the ecological vulnerability of the land surface was further enhanced. However, due to the lack of investment and human interference factors, such as irrational land use and man-made activities, it has been much more difficult to manage degraded land. Ecological land fragmentation still showed a rapid increasing trend.

4.2.3. Land Use Policies

Land use policies are also uncertain external factors that affect land use patterns. Nong’an County is one of China’s major grain-producing counties. In the 1980s, relevant management policies mainly focused on cultivated land protection, while the attention to ecological land protection was relatively weak. Numerous ecological lands were damaged and irrationally used. The improvement of land policies and establishment of basic farmland protection area enormously improved the cultivated land quality and proportion, which inhibited the destructions of land reclamation in some ways. In later years, specific protection measures for ecological land were gradually issued and made certain effects. The results showed that the fragmentation degree had fallen down in some regions. The ecological land pattern improved from fragmentation and decentralization to concentration gradually and formed corridor connections among land categories in space. The ecological landscape pattern of Nong’an County tended to be more secure.

4.3. Suggestions for Formulating Land Management Policies and Sustainable Development

Fragmentation characteristics of ecological land can provide important basis for regional land use allocation and ecological protection. The calculation results of ecological land fragmentation level are conducive to implement the land use development strategy especially in spatial pattern, and the strategies can be made distinctively according to different fragmentation grades. For example, in the regions of low fragmentation and slight fragmentation, land use conditions are relatively stable while human interference makes a great influence on land use changes. In this study, we suggest to develop extra ecological land and construct the corridor connected with the high fragmentation regions on the premise of protecting existing concentrated ecological land, which can maximize the ecological value of land use. In moderate fragmentation regions, ecological land has been divided in some ways under the common influences of human interference and land natural succession. It would be effective to identify the area of ecological land with higher ecological value and to reduce the interference of human construction activities, which can directly increase the aggregation of ecological land. In high fragmentation regions, we propose a redevelopment strategy to increase the area of ecological land by cutting down some construction land and returning cultivated land. Therefore, the ecological function and utilization structure of ecological land should be recovered and reconstructed gradually.
The study results showed that human activities were highly correlated to land use fragmentation, the interferences mainly consisted of built-up area expansion and cultivated land reclamation. Restricting urban expansion strictly is beneficial to release extra ecological land and improve the pattern of ecological land. Furthermore, planning and allocating ecological land rationally are not only significant to embody the ecological value and use value of ecological land but also provide an optimization path for urban sustainable development.

5. Conclusions

In conclusion, ecological land in Nong’an County showed increasing fragmentation characteristics in spatial during the past 18 years due to severe human interference and land degradation. According to the results, ecological land decreased from 1996 to 2014 and the transition among land use categories was quite frequent. The conversion among ecological land, cultivated land and construction land occurred frequently, and human activities were still the dominant factor influencing the land use pattern. Under the common interactions of natural conditions and human activities, soil salinization and alkalinisation had caused issues, such as large amounts of grassland degradation and wetland subtraction in the western region of Nong’an County. In the late 1990s, modified land policies played a significant role in protecting ecological land, with decelerating fragmentation and the improvement of ecological landscape pattern.
The construction of ELLF model could indicate spatio-temporal changes of regional ecological land fragmentation and land use pattern. Moreover, it provided a scientific evaluation method for measuring land use fragmentation and laid a good foundation for appropriate policy-making to improve land use structure and land optimizing allocation. Land use dynamic changes described land use area changes and transition relationships among different land categories. In addition, the analysis of influence factors on ecological land fragmentation would be significant for regional ecological security of land ecological system. This study was also meaningful to reconcile the conflicts between economic development and ecological protection, and offer suggestions for land use planning and regional sustainable development.

Acknowledgments

This work was supported by National Natural Science Foundation of China for Young Scholars (No. 41201158).

Author Contributions

Shuhan Liu and Dongyan Wang conceived and designed the research; Dongyan Wang, Hong Li and Qing Wang collected the data; Shuhan Liu and Hong Li processed and analyzed the data. All authors have read and approved the final manuscript.

Conflicts of Interest

The authors declare no conflict of interest.

References

  1. Lambin, E.F.; Meyfroidt, P. Global land use change, economic globalization, and the looming land scarcity. Proc. Natl. Acad. Sci. USA 2011, 108, 3465–3472. [Google Scholar] [CrossRef] [PubMed]
  2. Foley, J.A.; DeFries, R.; Asner, G.P.; Barford, C.; Bonan, G.; Carpenter, S.R.; Chapin, F.S.; Coe, M.T.; Daily, G.C.; Gibbs, H.K.; et al. Global consequences of land use. Science 2005, 309, 570–574. [Google Scholar] [CrossRef] [PubMed]
  3. Liu, Y.S.; LU, S.S.; Chen, Y.F. Spatio-temporal change of urban-rural equalized development patterns in China and its driving factors. J. Rural Stud. 2013, 32, 320–330. [Google Scholar] [CrossRef]
  4. Yao, S.M.; Zhang, P.Y.; Yu, C.; Li, G.Y.; Wang, C.X. The theory and practice of new urbanization in China. Sci. Geogr. Sin. 2014, 34, 641–647, (In Chinese with English Abstract). [Google Scholar]
  5. Turner, B.L.; Lambin, E.F.; Reenberg, A. The emergence of land change science for global environmental change and sustainability. Proc. Natl. Acad. Sci. USA 2007, 104, 20666–20671. [Google Scholar] [CrossRef] [PubMed]
  6. Yu, K.J.; Wang, S.S.; Li, D.H. The negative approach to urban growth planning of Beijing, China. J. Environ. Plan. Manag. 2011, 54, 1209–1236. [Google Scholar] [CrossRef]
  7. Yu, C.; Zhang, Y.; Claus, H.; Zeng, R.; Zhang, X.; Wang, J. Ecological and environmental issues faced by a developing Tibet. Environ. Sci. Technol. 2012, 46, 1979–1980. [Google Scholar] [CrossRef] [PubMed]
  8. Deng, X.W.; Sun, Y.C.; Han, S.J. General principles of urban ecological land classification and planning. Chin. J. Appl. Ecol. 2005, 16, 2003–2006, (In Chinese with English Abstract). [Google Scholar]
  9. Long, H.L.; Liu, Y.Q.; Li, T.T.; Wang, J.; Liu, A.X. A primary study on ecological land use classification. Ecol. Environ. Sci. 2015, 24, 1–7, (In Chinese with English Abstract). [Google Scholar]
  10. Cramb, A. Fragile Land: Scotland’s Environment; Polygon An Imprint of Birlinn Limited: Edinburgh, UK, 1999. [Google Scholar]
  11. Xie, H.L.; He, Y.F.; Xie, X. Exploring the factors influencing ecological land change for China’s Beijing–Tianjin–Hebei Region using big data. J. Clean. Prod. 2017, 142, 677–687. [Google Scholar] [CrossRef]
  12. Irwin, E.G.; Bockstael, N.E. The evolution of urban sprawl: Evidence of spatial heterogeneity and increasing land fragmentation. Proc. Natl. Acad. Sci. USA 2007, 104, 20672–20677. [Google Scholar] [CrossRef] [PubMed]
  13. Brabec, E.; Smith, C. Agricultural land fragmentation: The spatial effects of three land protection strategies in the eastern United States. Landsc. Urban Plan. 2002, 58, 255–268. [Google Scholar] [CrossRef]
  14. Shrestha, M.K.; York, A.M.; Boone, C.G.; Zhang, S. Land fragmentation due to rapid urbanization in the Phoenix Metropolitan Area: Analyzing the spatiotemporal patterns and drivers. Appl. Geogr. 2012, 32, 522–531. [Google Scholar] [CrossRef]
  15. Zhou, R.; Hu, Y.M.; Wang, X.J.; Su, H.L.; Wang, Y. Change characteristics of ecological land and its driving factors in rapidly urbanizing region. Res. Environ. Yangtze Basin 2015, 24, 1012–1020, (In Chinese with English Abstract). [Google Scholar]
  16. Meyer, W.B.; Turner, B.L. Changes in Land Use and Land Cover: A Global Perspective; Cambridge University Press: Cambridge, UK, 1994. [Google Scholar]
  17. Hintz, H.W. Grassland dynamics: Long-term ecological research in tallgrass prairie. Q. Rev. Biol. 1999, 4, 430–432. [Google Scholar] [CrossRef]
  18. Liu, F.; Zhang, H.Q. Ecological land use mapping and spatio-temporal dynamics in the Tarim Basin. Res. Sci. 2016, 38, 825–836, (In Chinese with English Abstract). [Google Scholar]
  19. Yang, Y.Y.; Zhang, S.W.; Wang, D.Y.; Yang, J.C.; Xing, X.S. Spatiotemporal changes of farming-pastoral ecotone in northern China, 1954–2005: A case study in Zhenlai County, Jilin Province. Sustainability 2014, 7, 1–22. [Google Scholar] [CrossRef]
  20. Coppedge, B.R.; Engle, D.M.; Masters, R.E.; Gregory, M.S. Landscape cover type and pattern dynamics in fragmented southern Great Plains grasslands, USA. Lands. Ecol. 2001, 16, 677–690. [Google Scholar] [CrossRef]
  21. Peng, J.; Wang, A.; Liu, Y.X.; Ma, J.; Wu, J.S. Research progress and prospect on measuring urban ecological land demand. Acta Geogr. Sin. 2015, 70, 333–346, (In Chinese with English Abstract). [Google Scholar]
  22. Zhou, R.; Su, H.L.; Qian, X.; Sun, B.; Wang, Y. Exploration of urban ecological land planning method based on ecological Security pattern. Urban Dev. Stud. 2014, 21, 21–27, (In Chinese with English Abstract). [Google Scholar]
  23. Yu, K.J.; Qiao, Q.; Li, D.H.; Yuan, H.; Wang, S.S. Ecological land use in three towns of eastern Beijing: A case study based on landscape security pattern analysis. Chin. J. Appl. Ecol. 2009, 20, 1932–1939, (In Chinese with English Abstract). [Google Scholar]
  24. Scherr, S.J.; Hazell, P.B.R. Sustainable Agricultural Development Strategies in Fragile Lands; Eptd Discussion Papers; International Food Policy Research Institute (IFPRI): Washington, DC, USA, 1994. [Google Scholar]
  25. Tian, Y.; Jim, C.Y.; Tao, Y.; Shi, T. Landscape ecological assessment of green space fragmentation in Hong Kong. Urban For. Urban Green. 2011, 10, 79–86. [Google Scholar] [CrossRef]
  26. Gautam, A.P.; Webb, E.L.; Shivakoti, G.P.; Zoebisch, M.Z. Land use dynamics and landscape change pattern in a mountain watershed in Nepal. Agric. Ecosyst. Environ. 2003, 99, 83–96. [Google Scholar] [CrossRef]
  27. Klijn, F.; Helias, A.; de Haes, U. A hierarchical approach to ecosystems and its implications for ecological land classification. Lands. Ecol. 1994, 9, 89–104. [Google Scholar] [CrossRef]
  28. Meng, J.J.; Wang, X.D.; You, N.S.; Zhu, L.K. Dynamic changes of landscape connectivity for ecological lands and distance thresholds in the middle reaches of the Heihe River, Northwest China. Chin. J. Appl. Ecol. 2016, 27, 1715–1726, (In Chinese with English Abstract). [Google Scholar]
  29. Zang, Z.; Zou, X.; Zuo, P.; Song, Q.C.; Wang, C.L.; Wang, J.J. Impact of landscape patterns on ecological vulnerability and ecosystem service values: An empirical analysis of Yancheng Nature Reserve in China. Ecol. Indic. 2017, 72, 142–152. [Google Scholar] [CrossRef]
  30. Su, W.Z.; Yang, G.S.; Zhen, F. Ecological land fragmentation and its connectivity with urbanization in the Yangtze River Delta. Acta Geogr. Sin. 2007, 62, 1309–1317, (In Chinese with English Abstract). [Google Scholar]
  31. Chen, J.; Shi, P.J. Discussion on functional land use classification system. J. Beijing Norm. Univ. (Nat. Sci.) 2005, 41, 536–540, (In Chinese with English Abstract). [Google Scholar]
  32. Xie, H.L.; Li, X.B. A method for identifying Spatial structure of regional critical ecological land based on GIS. Res. Sci. 2011, 33, 112–119, (In Chinese with English Abstract). [Google Scholar]
  33. Costanza, R.; D’Arge, R.; De Groot, R.; Farber, S.; Grasso, M.; Hannon, B.; Limburg, K.; Naeem, S.; O’Nelll, R.V.; Paruelo, J.; et al. The value of the world’s ecosystem service and natural capital. Nature 1997, 387, 253–260. [Google Scholar] [CrossRef]
  34. O’Neill, R.V.; Krummel, J.R.; Gardner, R.H.; Sugihara, G.; Jackson, B.; DeAngelis, D.L.; Milne, B.T.; Turner, M.G.; Zygmunt, B.; Christensen, S.W.; et al. Indices of landscape pattern. Landsc. Ecol. 1988, 1, 153–162. [Google Scholar] [CrossRef]
  35. Gustafson, E.J. Quantifying landscape spatial pattern: What is the state of the art? Ecosystems 1998, 1, 143–156. [Google Scholar] [CrossRef]
  36. Tischendorf, L. Can landscape indices predict ecological processes consistently? Landsc. Ecol. 2001, 16, 235–254. [Google Scholar] [CrossRef]
  37. Plexida, S.G.; Sfougaris, A.I.; Ispikoudis, I.P.; Papanastasis, V.P. Selecting landscape metrics as indicators of spatial heterogeneity—A comparison among Greek landscapes. Int. J. Appl. Earth Obs. Geoinf. 2014, 26, 26–35. [Google Scholar] [CrossRef]
  38. Lausch, A.; Herzog, F. Applicability of landscape metrics for the monitoring of landscape change: Issues of scale, resolution and interpretability. Ecol. Indic. 2002, 2, 3–15. [Google Scholar] [CrossRef]
  39. Hulshoff, R.M. Landscape indices describing a Dutch Landscape. Landsc. Ecol. 1995, 10, 101–111. [Google Scholar] [CrossRef]
  40. Kupfer, J.A. Landscape ecology and biogeography: Rethinking landscape metrics in a post-FRAGSTATS. Prog. Phys. Geogr. 2012, 36, 400. [Google Scholar] [CrossRef]
  41. Chen, W.S.; Feng, X.L.; Ma, R.F.; Hong, Q.N. Method of cultivated land fragmentation evaluation and empirical research: A case of ningbo city in Zhejiang province. China Land Sci. 2016, 30, 80–87, (In Chinese with English Abstract). [Google Scholar]
  42. Jia, Y.H.; Zhao, J.; Nan, Z.R.; Zhao, C.Y.; Wang, S.L. Ecological safety assessment of grassland based on entropy-right method: A case study of Gansu pastoral area. Chin. J. Ecol. 2006, 25, 1003–1008, (In Chinese with English Abstract). [Google Scholar]
  43. Mon, D.L. Evaluating weapon system using fuzzy analytic hierarchy process based on entropy weight. Fuzzy Sets. Syst. 1994, 62, 127–134. [Google Scholar] [CrossRef]
  44. Yang, J.; Shan, L.Z.; Xi, J.C.; Li, X.M.; Ge, Q.S. Land use pattern changes and ecological effects in Nansihu wetland. Res. Sci. 2014, 36, 856–864, (In Chinese with English Abstract). [Google Scholar]
  45. Mertens, B.; Lambin, E.F. Land-cover-change trajectories in southern Cameroon. Ann. Assoc. Am. Geogr. 2000, 90, 467–494. [Google Scholar] [CrossRef]
  46. Zhou, Q.; Li, B.; Kurban, A. Trajectory analysis of land cover change in arid environment of China. Int. J. Remote Sens. 2008, 29, 1093–1107. [Google Scholar] [CrossRef]
  47. Huang, Y.; Wang, F.Y.; Cai, T.J.; Wang, D.C.; Wang, Q.Q.; Chen, W.G. Landscape pattern dynamic analysis based on change trajectory method in Bohai rim area. J. Soil Water Conserv. 2015, 29, 314–319, (In Chinese with English Abstract). [Google Scholar]
  48. Hernández, A.; Miranda, M.D.; Arellano, E.C.; Dobbs, C. Landscape trajectories and their effect on fragmentation for a Mediterranean semi-arid ecosystem in Central Chile. J. Arid Environ. 2016, 127, 74–81. [Google Scholar] [CrossRef]
Figure 1. Location of the study area, Nong’an County.
Sustainability 09 00300 g001
Figure 2. All of the possible trajectories of land change.
Sustainability 09 00300 g002
Figure 3. (a) Grading map of ecological land fragmentation in 1996; (b) Grading map of ecological land fragmentation in 2009; (c) Grading map of ecological land fragmentation in 2014.
Sustainability 09 00300 g003
Figure 4. Area of land categories from 1996 to 2014.
Sustainability 09 00300 g004
Figure 5. (a) Land over trajectories and their corresponding area ratios from 1996-2009; (b) Land over trajectories and their corresponding area ratios from 2009 to 2014.
Sustainability 09 00300 g005
Figure 6. Land succession types in 1996–2014.
Sustainability 09 00300 g006
Figure 7. Trajectory changes between ecological land and other land categories.
Sustainability 09 00300 g007
Table 1. Ecological land Classification based on “Current Land Use Classification” in China.
Land Use TypeFirst-ClassSecondary-Class
Ecological LandForest LandWoodland, Shrubwood Land, Other Forest Land
GrasslandNatural Meadow, Artificial Meadow, Other Grassland
WaterRiver, Lake, Reservoir, Pond, Tidal Flat, Marshland
Saline-alkaline LandSaline-alkaline Land
Note: The secondary-class land categories were all contained in the “Current Land Use Classification”.
Table 2. Index weights of ELLF.
LayerMetricWeight
199620092014
A-EFPD0.49490.49650.4464
ED0.50510.50350.5536
SFAWMSI0.64580.52840.5736
FS0.35420.47160.4264
AgFAI0.49750.48880.4550
COHESION0.50250.51120.5450
Table 3. Fragmentation index values of the evaluation units in 1996, 2009 and 2014.
UnitPDEDAWMSIFSAICOHESION
199620092014199620092014199620092014199620092014199620092014199620092014
Nong’an0.7061.7351.73312.37019.56019.5724.2944.8144.8870.3610.3640.36391.90385.09684.96398.16796.97396.994
Fulongquan1.2081.9141.92124.15527.67927.6964.6874.5884.5860.4150.3760.37683.49281.23581.22596.58696.02596.022
Halahai0.8823.0423.05513.84226.98127.0042.6454.2674.2080.4010.3320.33387.15978.91978.56895.16095.16095.007
Kaoshan0.9412.9402.95013.11719.54419.5444.0895.2765.2750.3650.3440.34387.48259.80259.78497.05192.63292.628
Kaian1.2492.8762.88515.47421.02520.9563.1872.4682.4500.3700.3620.36182.71866.70466.52594.64686.81386.649
Shaoguo2.0242.3532.36720.68720.18919.5674.9133.7753.5250.3300.3410.34977.69874.96770.04895.60693.50091.653
Gaojiadian0.5782.1172.1357.03016.01015.7432.8262.8222.7500.3660.3490.34786.20673.10970.38195.02190.58589.388
Huajia0.9312.5282.53617.33929.16629.2835.1593.7673.8770.3790.4160.41592.25683.38783.11898.61495.70395.756
Sanshengyu0.6364.6904.69018.92941.56641.7246.0236.2766.3400.4250.3760.37792.81684.94884.86398.92997.73597.747
Bajilei0.6591.0840.39917.94322.44822.4484.5414.48514.7770.3790.3540.31996.52795.69197.15999.32899.13399.937
Qian’gang1.1262.8882.89215.84822.88622.9156.1193.0183.0330.3830.3430.34381.23471.66071.57897.04090.79390.800
Long’wang1.3350.3510.32925.12426.89626.2564.00011.88511.5660.3670.3760.38293.09497.04397.14498.39099.93099.932
San’gang1.0721.1831.28917.21718.38417.8523.2953.4463.7670.3760.3950.38688.40889.11185.92596.54996.91596.347
Wanshun0.6202.0902.11115.43128.77028.6393.2695.9335.6110.4050.4530.45292.93586.93986.42997.90597.92997.710
Yangshulin1.0713.3433.35013.69826.48726.5043.6513.8053.8120.3540.3730.37387.91278.95578.92096.74494.58594.587
Yong’an1.0641.8921.90918.91332.48332.4762.9633.6393.6270.3880.5190.51892.04289.01089.00297.37897.09197.080
Qingshankou1.1070.2072.08020.76627.79427.7948.0569.41710.9490.3430.5170.39088.72097.42086.75298.76599.93498.980
Huangyuquan1.1011.8201.82020.39623.54723.5474.9096.5476.5470.3650.3630.36387.03885.07285.07297.48897.88497.884
Xinnong0.6673.0763.1257.92417.70716.7774.4663.3632.7920.2910.3280.32891.12965.34555.89398.08089.89484.587
Wanjinta0.6072.1892.17710.39818.56218.1237.0963.3993.4500.3510.4350.43487.64861.26160.41298.39288.85588.781
Xiaochengzi1.1751.9271.94324.56229.33829.2315.0886.2286.2260.3950.3580.35788.63685.19285.16497.90297.78097.775
Helong1.5840.1291.85315.50514.79314.3242.7937.1092.5410.3760.2820.35370.98998.61666.02889.78199.99086.888
Average1.0152.1082.25216.66724.17323.9994.4585.0155.3000.3720.3800.37587.63881.34078.40796.97895.26594.233
Table 4. Area changes and land use dynamic degree during the time intervals.
Categories1996200920141996–20092009–20141996–2014
Area (km2)%Area (km2)%Area (km2)%
Forest land121.372.24182.583.36181.923.353.35 −0.07 2.22
Grassland242.504.4763.981.1857.461.06−27.90 −2.27 −21.47
Water318.815.87246.554.54245.114.51−2.93 −0.12 −2.00
Saline-alkaline land122.382.25264.784.88251.764.645.38 −1.03 3.43
Cultivated land4088.8775.304062.1474.814065.6374.87−0.07 0.02 −0.04
Construction land498.489.18596.9510.99615.1511.331.65 0.59 1.26
Unutilized land37.590.6913.020.2412.970.24−18.86 −0.08 −12.65
Table 5. Land use transition matrices during 1996–2014 (km2).
CategoriesForest LandGrasslandWaterSaline-Alkaline LandCultivated LandConstruction LandUnutilized LandTotal
Forest land94.06 8.20 4.03 2.83 56.51 13.13 3.16 181.92
Grassland1.52 33.464.193.2710.560.993.4757.46
Water2.82 5.05209.481.8720.851.034.01245.11
Saline-alkaline land0.57 135.902.9781.8621.421.507.54251.76
Cultivated land14.97 48.1991.8424.503833.5241.8310.784065.63
Construction land7.12 11.115.367.97142.92439.940.73615.15
Unutilized land0.31 0.590.940.083.090.067.9012.97
Total121.37 242.50 318.81 122.38 4088.87 498.48 37.59 5430.00
Table 6. Land succession types during 1996–2014.
TypeArea (km2)Count%
Unchanged4694.57786.46
Human interference511.44859.42
Natural succession224.00274.12
Total5430.00119100.00
Table 7. Trajectory changes between ecological land and other land categories.
TypeArea (km2)%
Constant ecological land592.0910.90
Turn into ecological land144.232.66
Turn into non-ecological land212.963.92
Short-lived ecological land5.610.10
Constant non-ecological land4475.1182.42
Total5430.00100.00

