1. Introduction
The Taihu Basin, located in the estuary of the Yangtze River Delta, is the core economic area in East China. As it is experiencing rapid economic development and industrialization, rivers are overloaded with pollutants, resulting in deterioration of water quality and potential threats to the safety of functional water zones, especially for drinking water sources [
1,
2,
3]. As such, efficient pollution control in this complex river network area is the key to water environment management of the Taihu Basin.
Total emission control (TEC), firstly proposed in the 1970s, has been applied in basins all over the world as an effective method for water quality management [
4,
5,
6]. In Article 18 of the 2008 Law on the Prevention and Control of Water Pollution promulgated by the National People’s Congress of China, the TEC system was established as an important mechanism to shift the incentives of subnational authorities. Total emissions of regulated pollutants are allocated by the national government in order to achieve desired water environment quality, and the TEC system authorizes the imposition of significant penalties to discipline authorities who discharge higher levels than the allocated amount [
7]. While the overall goal of TEC is to maintain a healthy water environment, the controlling objectives and techniques of TEC vary differently according to the target management areas. A large number of research studies have examined TEC in the Taihu Basin. Generally, water quality in either all river segments or several cross-sections of the river networks were identified as the control factors for TEC [
8,
9,
10]. However, the control based on all river segments was fairly strict and the implementation was quite difficult. Oppositely, it was comparably difficult to ensure a sufficiently high level of water quality in important functional or environmentally sensitive river segments if only very limited or unrepresentative sections were identified. In addition, the effectiveness of local TEC has rarely been evaluated in previous studies. The effect from the reduction of local emissions on water quality improvement may be limited in many circumstances when non-local sources contribute most of the pollutants in study area. If so, the estimated local emission reduction rate may fail to achieve the relevant water quality standards.
The concept of environmentally sensitive areas (ESAs) was first proposed in 2008. According to the “Environmental Impact Assessment of Construction Project and Classification Management List” [
11], ESAs include many different types of natural and cultural protection areas, as well as some important functional areas, which are particularly sensitive to some types of contaminants or ecological impacts. In recent research of the Taihu Basin river networks, water environmentally sensitive areas (WESAs) refer to special river areas, including all of the river protection zones proposed by officials and key river segments with important ecological and water quality functions.
In this study, a new method of TEC based on the WESAs in Wujiang District was proposed. The overall objective is to estimate the local pollution reduction rate in order to reach desired water quality standards in the study area. Specifically, the research focused on the following objectives: (i) validate the 1-D river network model for the study area; (ii) explore the effectiveness of the TEC for Wujiang; and (iii) estimate the feasibility of the potential pollution control plans in the research area. It is expected that this method can provide much information and guidance for the government in environmental management.
2. Materials and Methods
2.1. Study Area
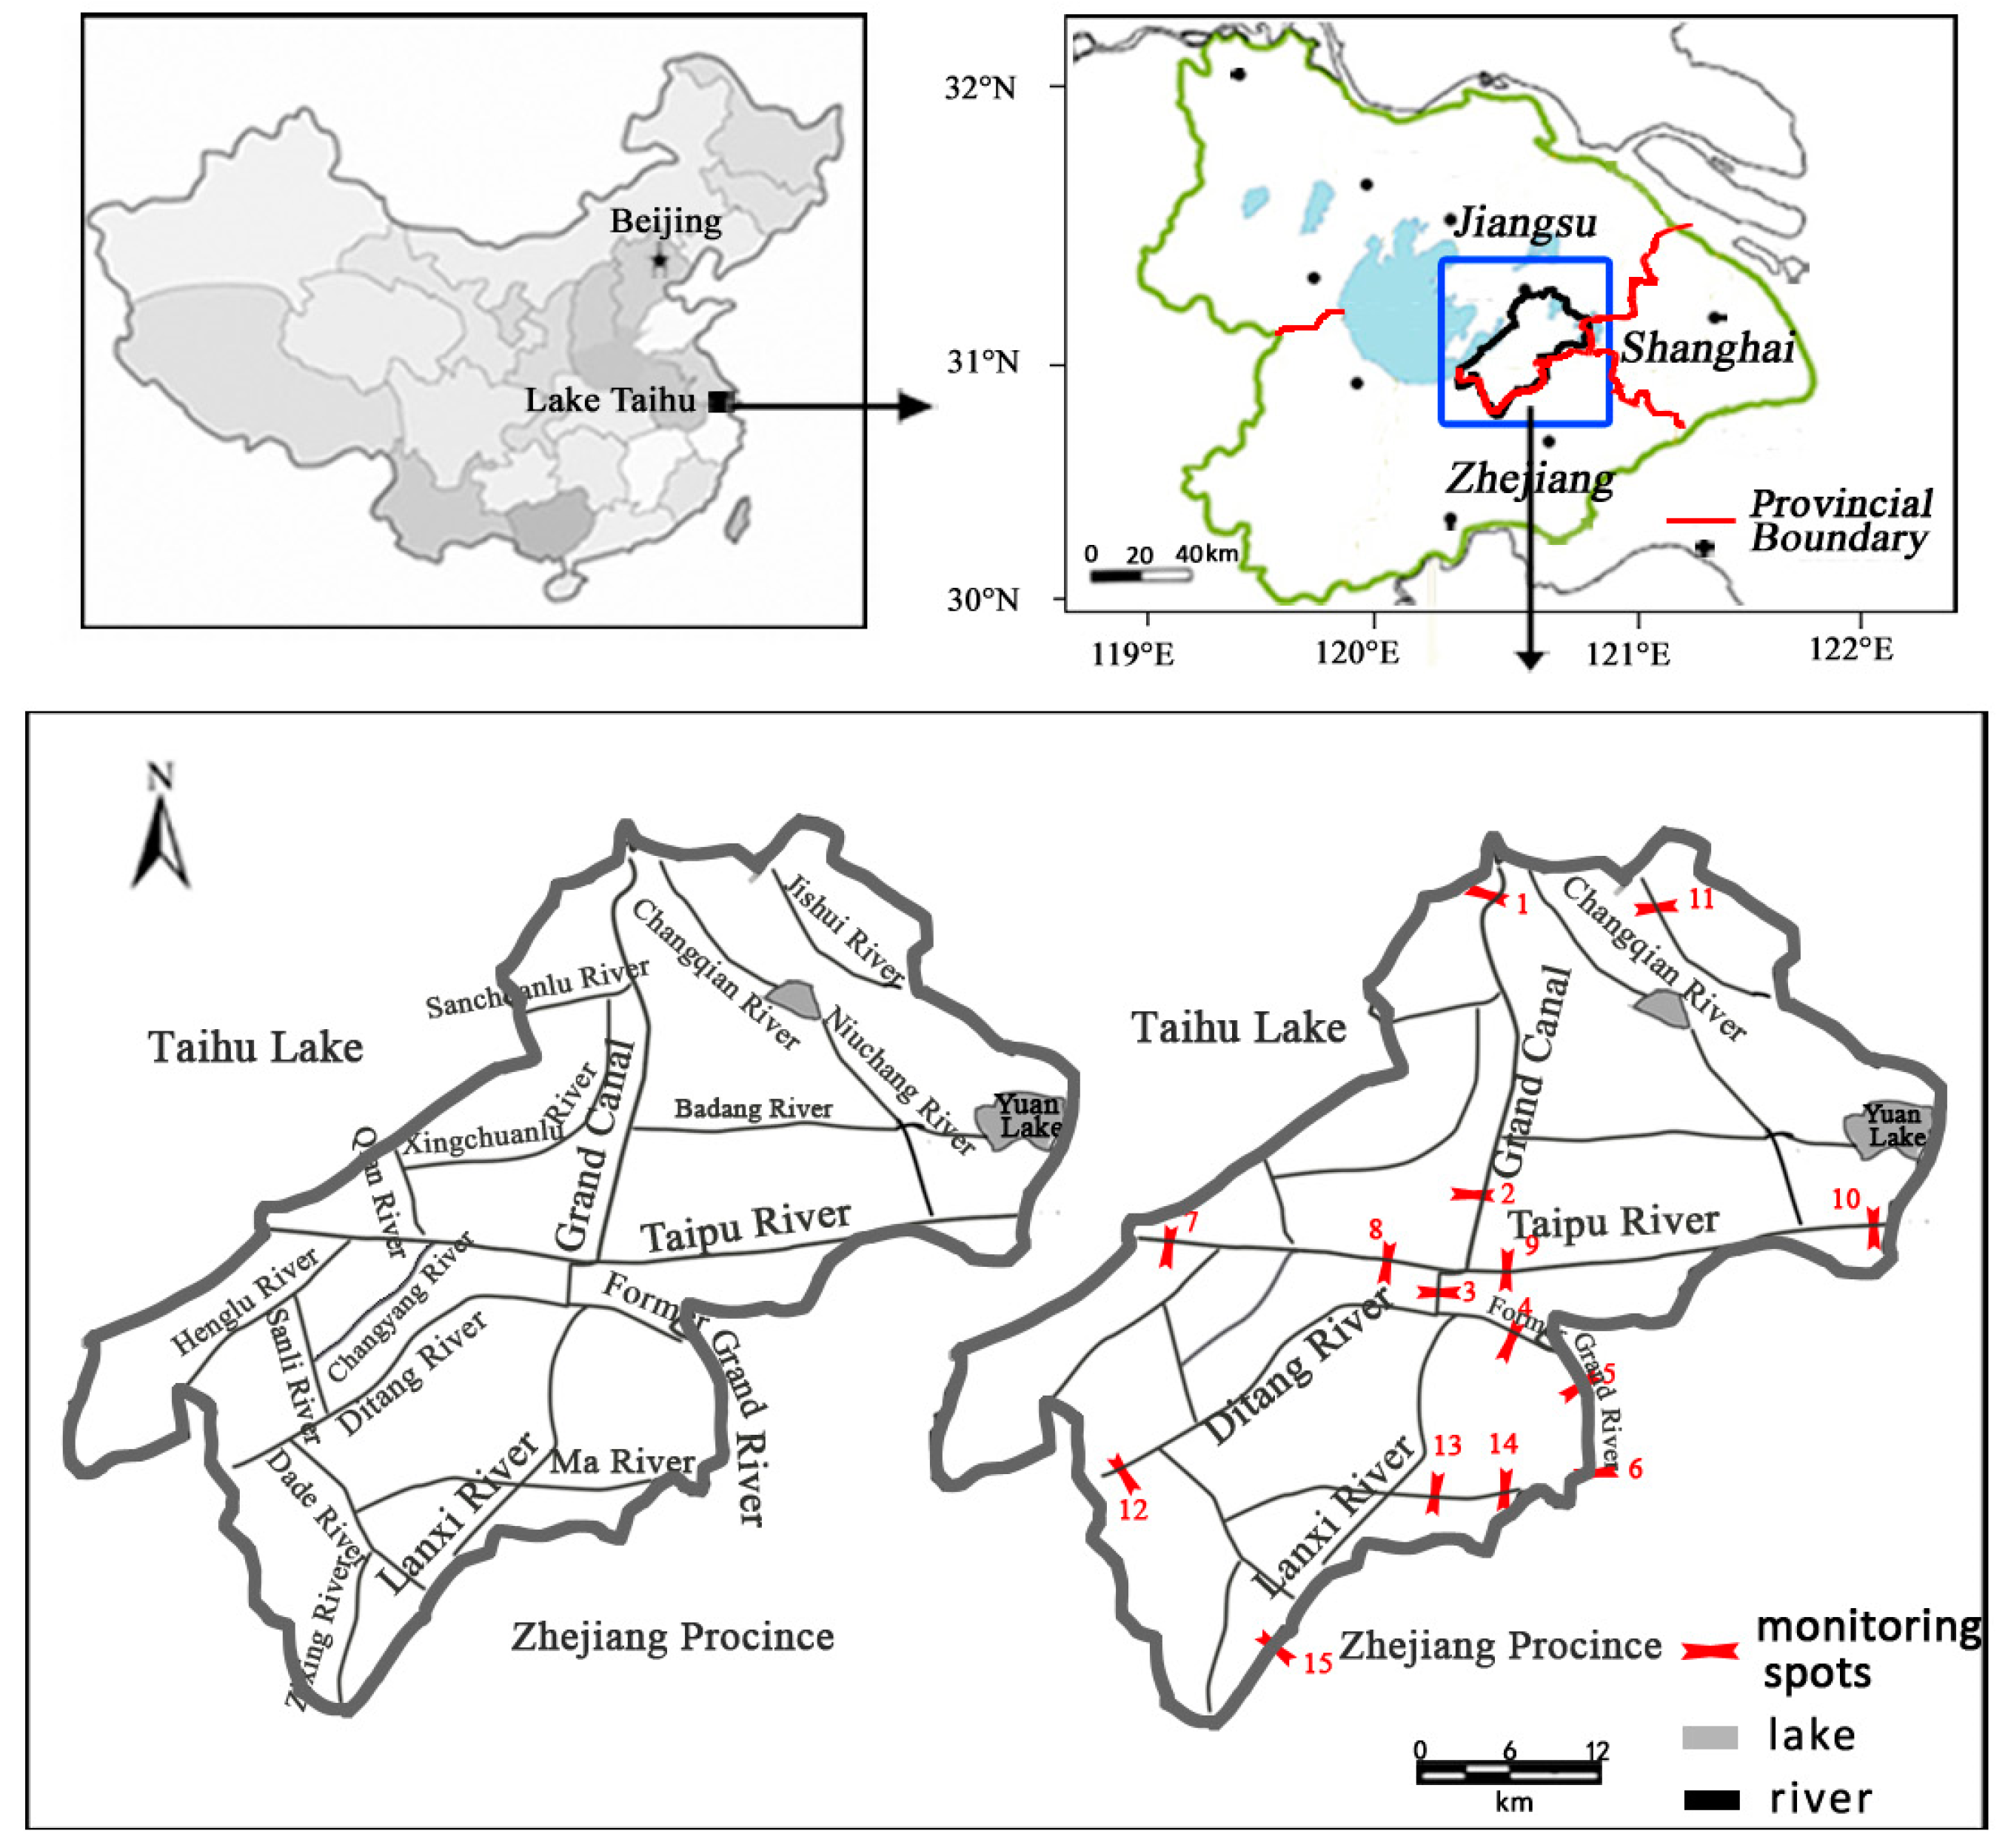
Wujiang District is located in the south of Jiangsu Province. It also neighbors two other highly developed areas, Zhejiang province and Shanghai Municipality (
Figure 1). The total population for this district is over 1.2 million. Wujiang currently ranks as one of the most economically successful cities in China and the major industries include electronics, printing and dyeing, and textile manufacturing, which produce large amounts of sewage. The surface water area of Wujiang District is approximately 267.1 km
2, accounting for 22.7% of the total area. The river networks in this district are mainly composed by three rivers: Taipu River, Grand River, and Lanxi River (
Figure 1). The Taipu river flows easterly into Shanghai and the other two rivers flow southward into Zhejiang province [
12,
13].
2.2. Data Collection
To investigate the status of the river networks, 15 cross-sections at the major rivers were selected for field measurement (
Figure 1). Hydrology and water chemistry measurement were conducted twice in both March 2013 and April 2014, with three days for each field measurement. Hydrological parameters included cross-section discharge, water depth, and velocity. Water chemistry parameters included chemical oxygen demand (COD
Cr) and ammonia-nitrogen (NH
3-N), which are both typical parameters to reflect water quality in the Taihu Basin, as guided in the Jiangsu provincial “Twelve-Five” comprehensive program of energy conservation and emission reduction [
14]. Sampling and measurement techniques for hydrology/water chemistry were based on the “Technical Specification Requirements for Monitoring of Surface Water” (HJ/T91-2002) [
15]. Specifically, water depth was evenly recorded at five points of each cross-section and the horizontal velocity was measured with a flow meter from surface to bottom at each point. Discharge at the cross-section was derived as a product of velocity and cross-section area. Water samples were collected with a 2 L plastic water sampler at the surface and bottom for chemical analysis. Samples were immediately delivered to Wujiang Environment Monitoring Center for Measurement.
According to Environmental Water Quality Standards for Surface Water, promulgated in 2002 [
16], water quality conditions can be classified as six grades, from best to worst: grade I, II, III, IV, V and V-. The corresponding criteria for each grade are presented in
Table 1.
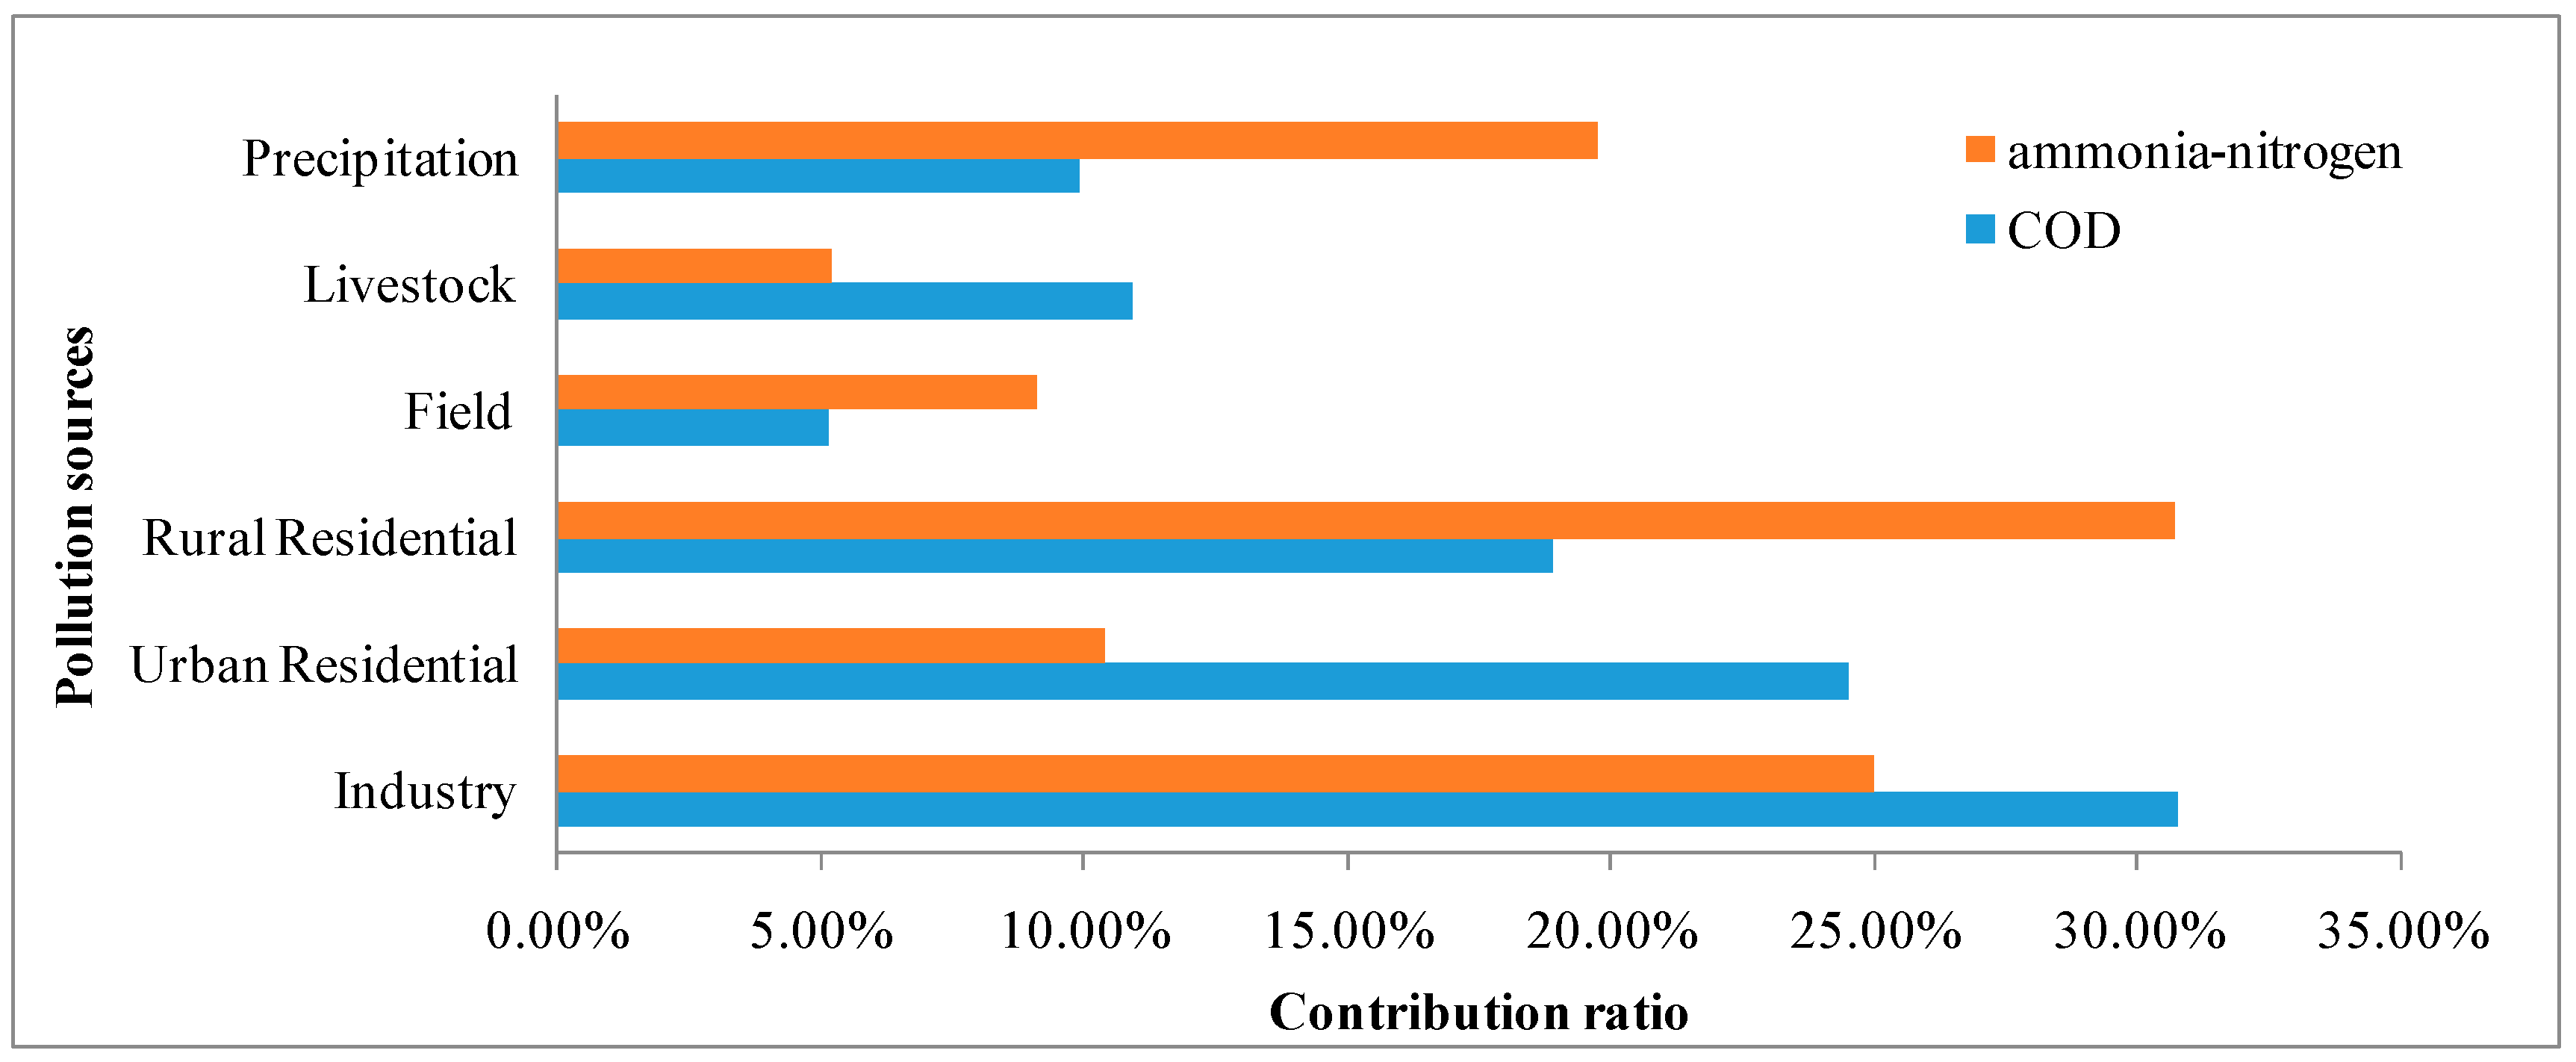
Pollutants to the river networks of the Taihu Basin are mainly from the discharge of industrial, residential, livestock, and farming sewage. According to the statistics of emission investigation from thousands of sites from the Jiangsu Provincial Environmental Monitoring Center in 2013, the total pollutants discharge from these sources, mainly including COD
Cr and NH
3-N, can be roughly estimated. The average annual emissions of COD
Cr and NH
3-N from all the pollution source types were up to 26,791.4 t/a and 1684.2 t/a, respectively. The contribution proportion from different sources are displayed in
Figure 2. The results illustrated that industry and urban residential sewage were dominant in the contributions of COD
Cr emissions, and industry and rural residential sewage were the main sources for NH
3-N.
2.3. 1-D Mathematical River Network Model
Mathematical models have become important tools in water environmental research. Currently, a sizeable number of models, such as MIKE developed by DHI [
17], the QUAL series model developed by US EPA [
18], and EFDC developed by VIMS [
19], have been widely used for water environment simulation. Among them, MIKE has shown favorable functionality and strong applicability in a number of river network studies. For example, Zeng et al. used MIKE11 to simulate water quality trends in the Wenrui river networks [
20]. Lian et al. also applied this model to predict the hydrology and water quality of the river networks in Fuzhou City [
21]. In our study, the MIKE11 model was applied to simulate the hydrodynamic status and transport of contaminants in Wujiang District.
In MIKE11, the Saint-Venant equation was used to simulate the hydrology of the river networks:
where,
q is the discharge of a tributary;
Q is the discharge of the main stream;
A,
B, and
Z represent cross-sectional area, width, and depth, respectively;
VX is the flow velocity along the river in
x direction;
K is the volume correction coefficient; and
α is the momentum correction coefficient.
The equations above were discretized with the four-point linear implicit scheme. The linear water elevation and velocity were calculated based on the matrix mark method.
Water quality was predicted under the mass balance equation as below:
where,
C is the concentration of the substance, u is the average stream velocity,
Ex is convective diffusion coefficient, and
K is the attenuation coefficient.
The convective diffusion coefficient can be estimated through the empirical formula:
where,
V is the velocity predicted from the hydrodynamic component of the model, and
a and
b are empirical parameters.
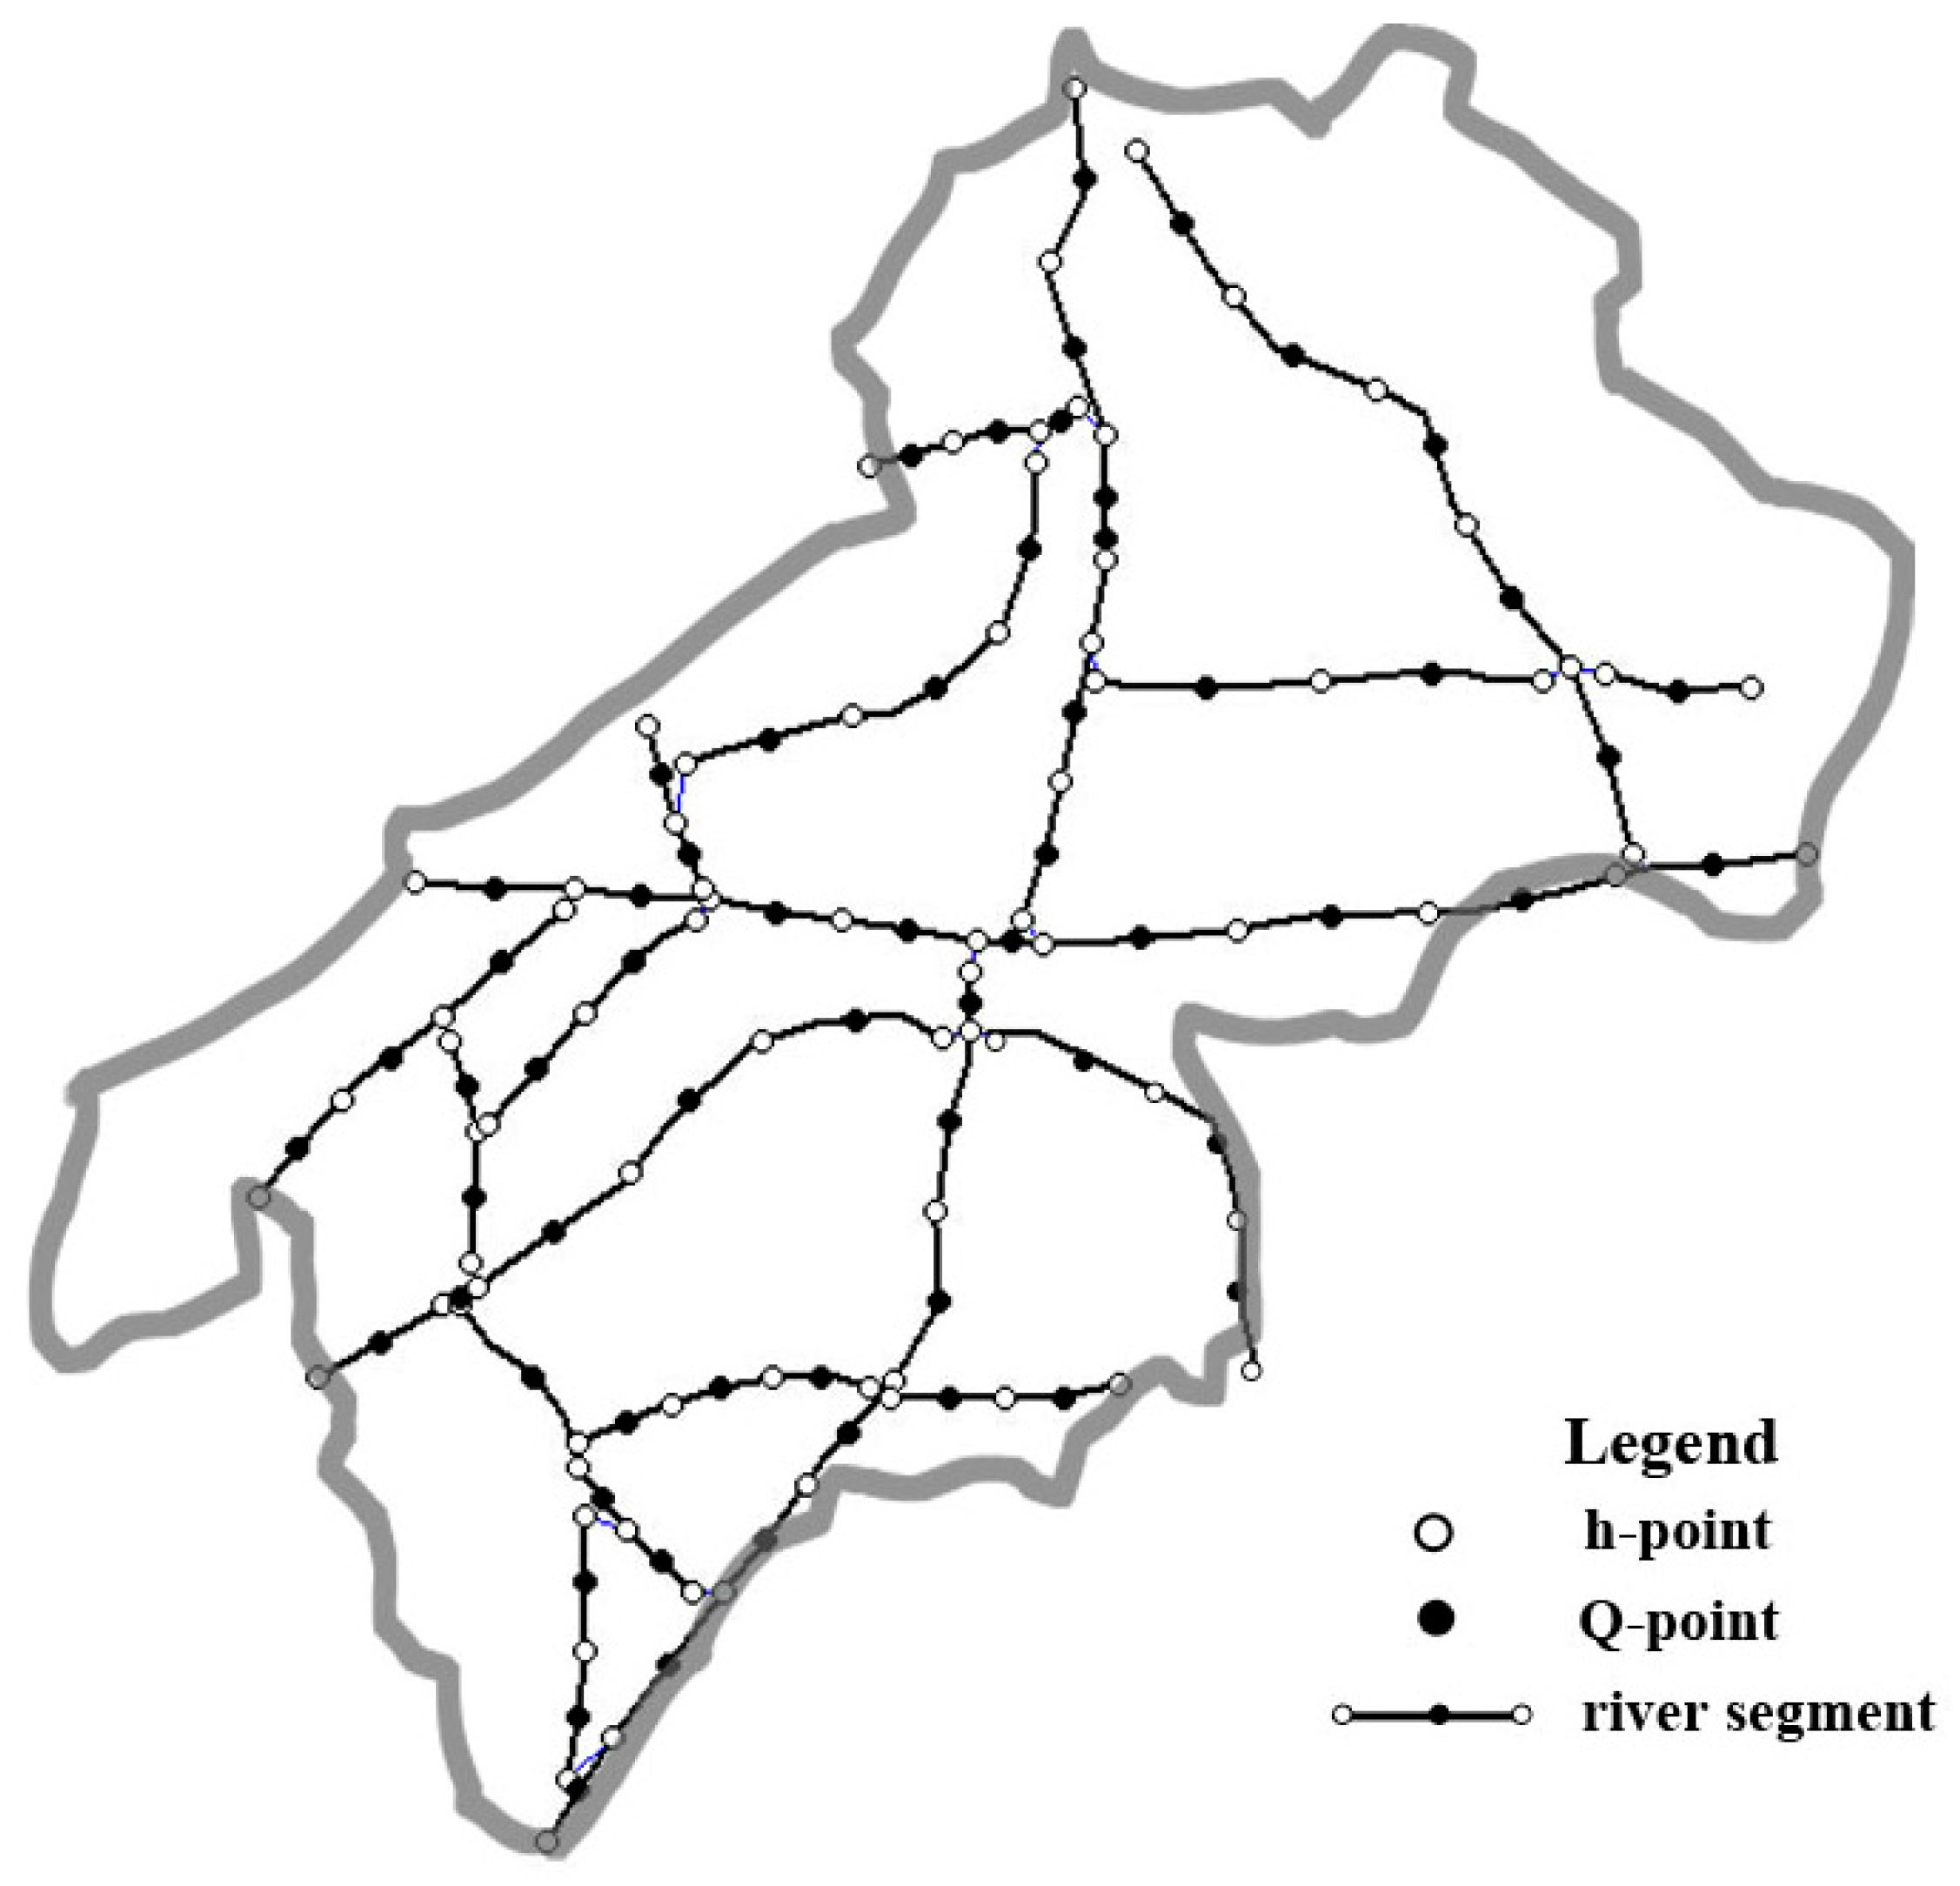
The 1-D plain river network model for Wujiang District included 19 river segments in total, with a length from 8.2 km to 39.6 km. The dimensions for each segment was obtained from Wujiang Environmental Monitoring Center and were correctly implemented into the model as geometry data. The model consisted of 104 h-points and 65 Q-points (
Figure 3). Surface elevation and water quality (e.g., COD
Cr and NH
3-N) parameters were predicted on h-points while river discharge was simulated on Q-points. The model time step was set as 60 s, considering the model stability and calculation efficiency. Measured river discharge data at the boundary node was used to drive the model. An emission source in the study area was added at the nearest node point as external nutrient loading. Model calibration was conducted with field data in March 2013, while the validation of the model was done through comparing with the field measurement in April 2014.
2.4. Weighting Coefficient
All of the emission sources that influence water quality in WESAs can be divided into two sections based on the scope of TEC: local and non-local pollution sources. Non-local pollution sources contribute major pollutants from outside of the study area, and local pollution sources directly emit contaminants into rivers within the study area. In general, only local pollution sources are chosen as control targets in environmental management.
To guarantee the effectiveness of TEC on the water quality improvement for WESAs, it is crucial to evaluate the effect of local pollution sources on target water bodies. The effectiveness of local emission control in the study area can be quantified by calculating the weighting coefficient for local pollution sources. The weighting coefficient of local pollution sources was first proposed by Zhu et al. [
10] in the study of the Hangjiahu River networks, and it is mainly to evaluate whether the TEC in the scope of the control area had effective influence on water quality improvement of WESAs. The equation can be expressed as follows:
where,
is the weighting coefficient of local pollution sources;
is the average water concentration of the target water body, under the condition that local pollutants were considered;
is the average water concentration of the target water body, under the condition that local pollutants were ignored.
and
were derived from the validated 1-D river network model.
3. Results
Field water quality measurement at selected sites in March 2013 displayed little temporal variation. Averaged monitoring data is presented in
Table 2. Generally, according to Environmental Water Quality Standards for Surface Water, promulgated in 2002 [
14], water quality conditions for the study river segments were between grade III and IV. Poor water quality sites (grade IV or worse) occupied a portion up to 47% and most of these sites are located in south of the study area. Water quality deterioration from upstream (e.g., site 1, site 7) to downstream (e.g., site 6, site 10) was clearly noted due to the transport of pollutants. As presented in the table for the field measurement of the Grand Canal, COD
Cr concentrations along the Grand Canal have increased by 55%, and NH
3-N has increased by 94%. Water quality for Taipu River was comparably good since its upstream directly connects to the west Lake Taihu where the water quality condition was fairly good. Particularly, NH
3-N concentration of upstream sites 7 and 8 were of very low values. However, a five-fold increase of NH
3-N concentration was noted from sites 8 to 9 after being mixed with the water from the Grand Canal.
3.1. Model Calibration and Validation
To build the mathematical hydrodynamic model for Wujiang District, model parameters were calibrated using a trial and error method through which the parameters were continually adjusted until appropriate numerical results were derived. This can efficiently ensure a stable calculation process and good agreement between measured and simulated results. In our study for the plain river networks, the bottom roughness and degradation coefficient were determined through calibrating the hydrodynamic and water quality models, respectively.
Field hydrology data were obtained from 17 to 19 March 2013 in Wujiang District. The canal roughness of the river networks in Wujiang District was calibrated in a range of 0.023–0.032. According to the study of the river networks in the lower reach of the Yangtze River of China by Han et al. the bottom roughness for this area was estimated between 0.019 and 0.031 [
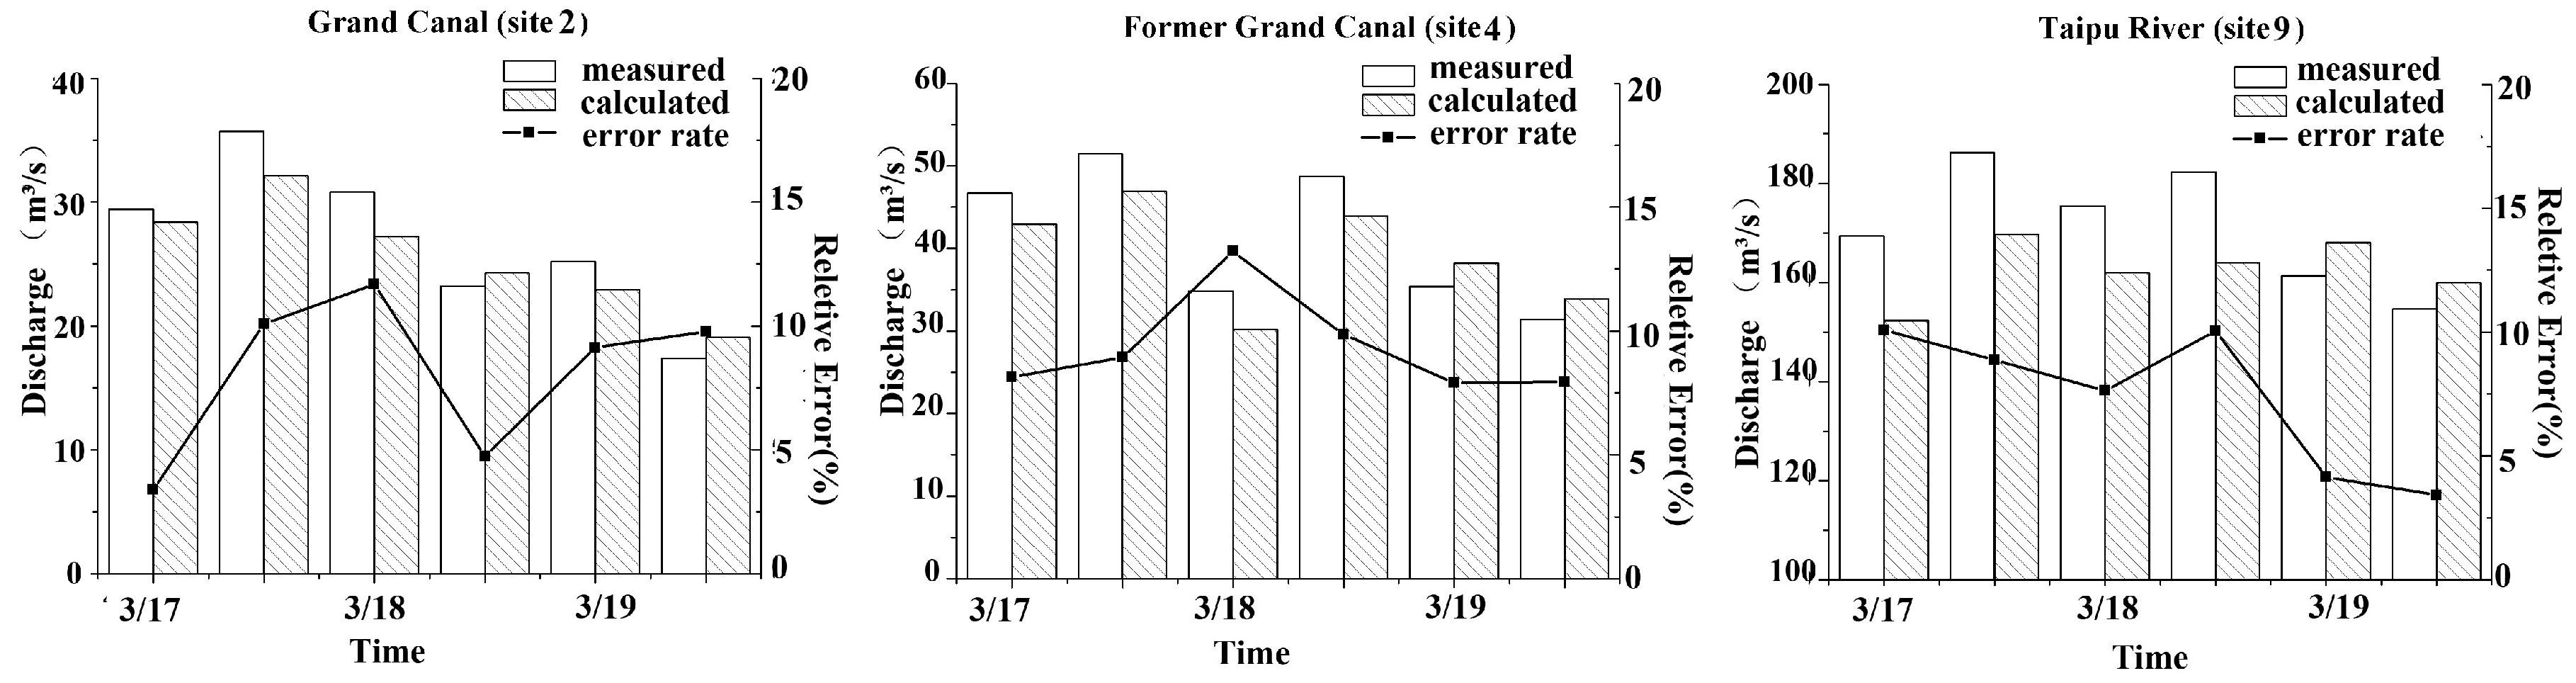
22] and, hence, our calibrated roughness was completely reasonable. As is shown in
Figure 4, the simulated values were close to the measured ones at river segment 2, 4, and 9. Relative errors for discharge at these three sites were between 3.9% and 18.2%. Average errors for the entire river networks was 12%.
Based on the field water quality measurement (28–30 March 2013), the degradation parameters (COD
Cr and NH
3-N) in the model were calibrated in a range of 0.09–0.15 d
−1 and 0.07–0.13 d
−1, respectively. These values were close to the results (0.09–0.11 d
−1 and 0.05–0.07 d
−1) derived in the study of north Lake Taihu by Wang et al. [
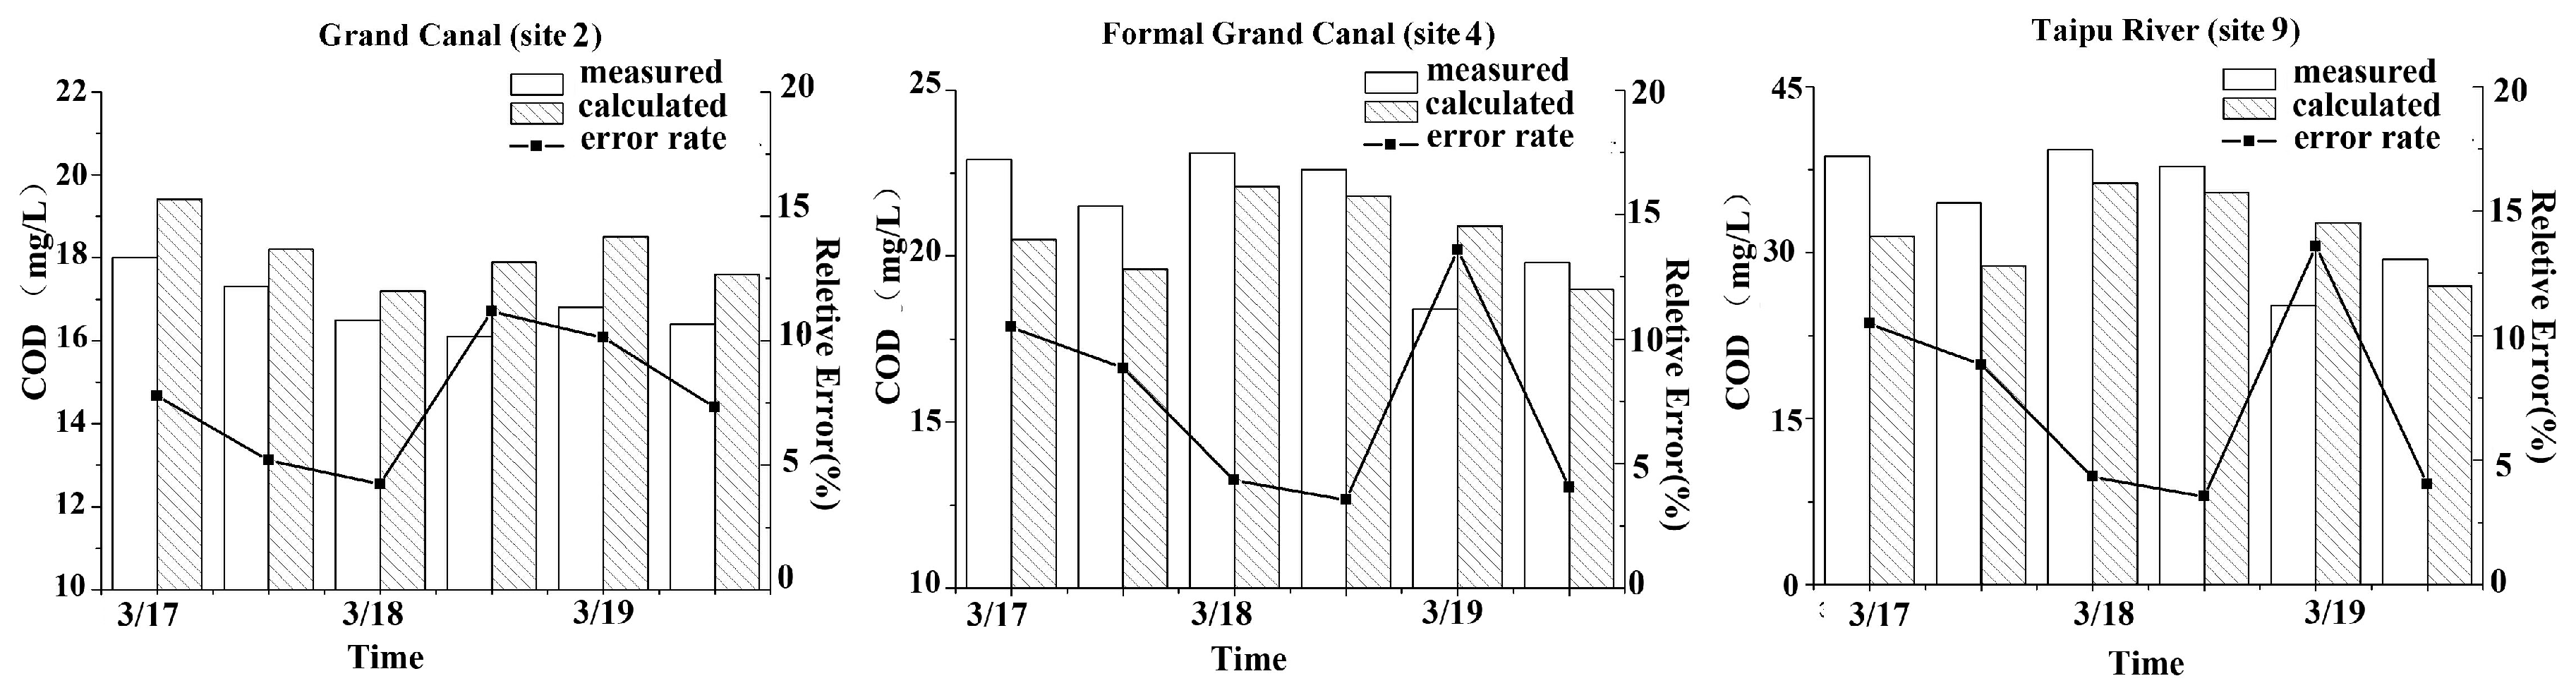
23]. As is illustrated in
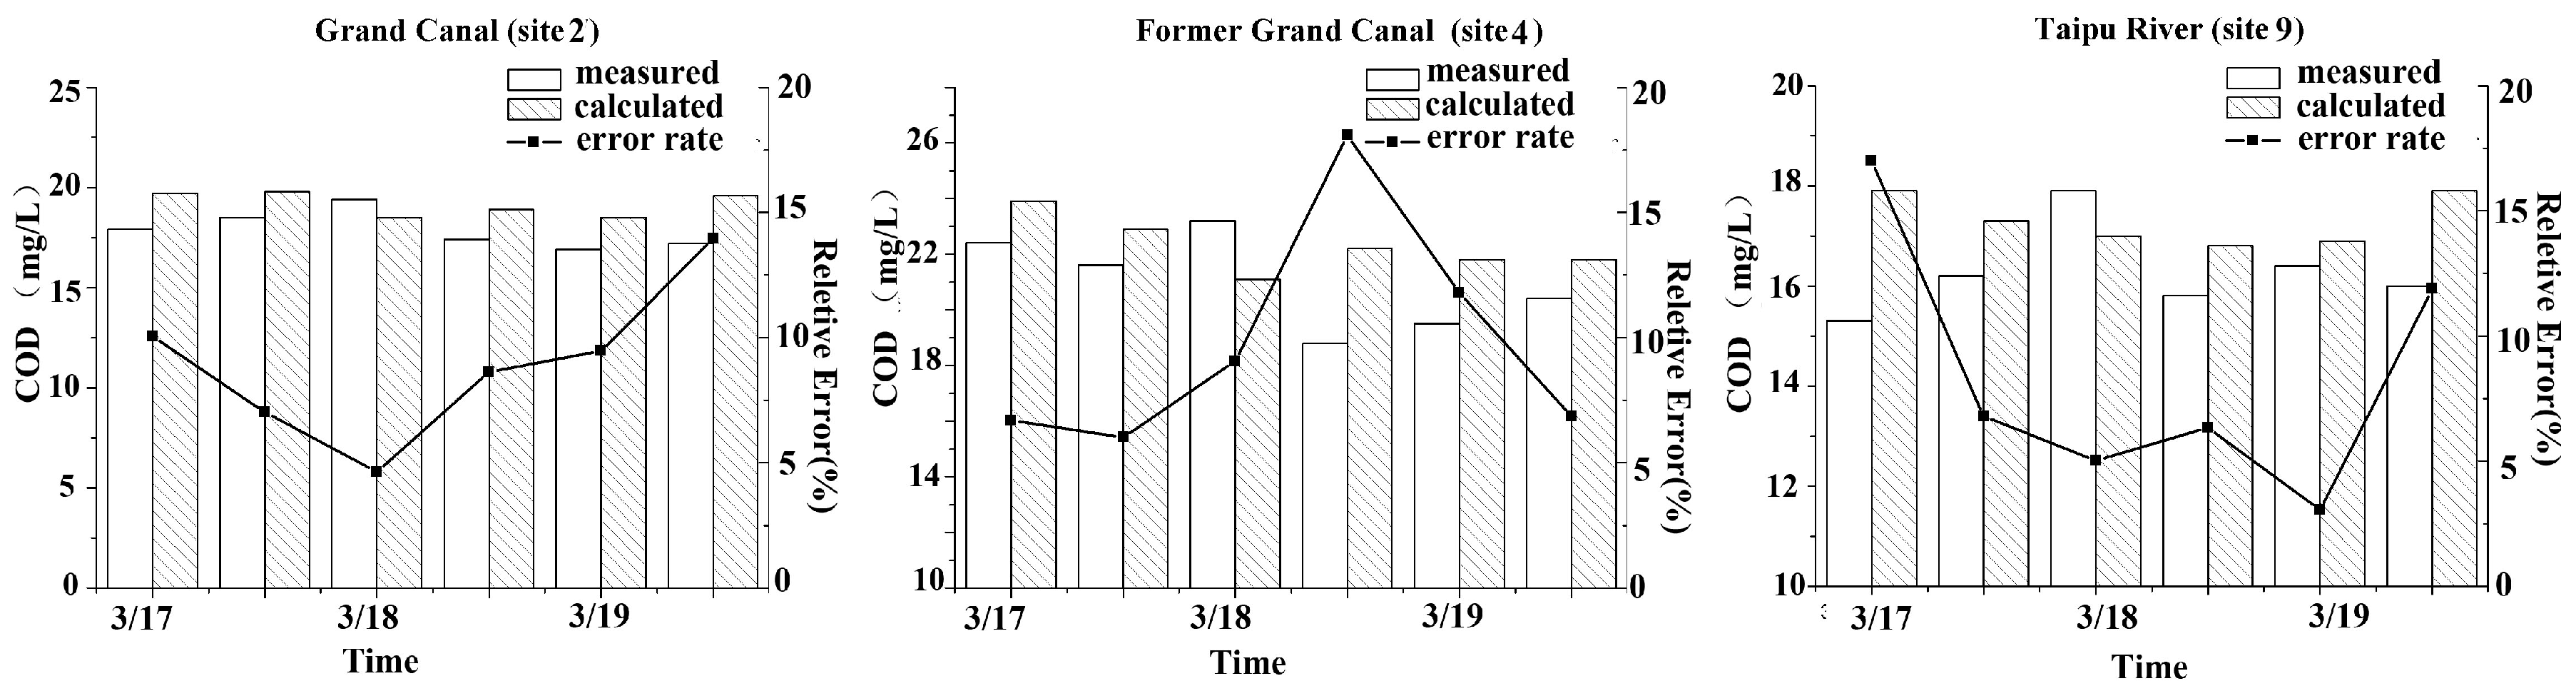
Figure 5 and
Figure 6, the relative errors for COD
Cr were between 3.8% and 14.6%, while the results for NH
3-N were between 5.2% and 25%. Average errors for the study area was 10.3% for COD
Cr and 18.4% for NH
3-N.
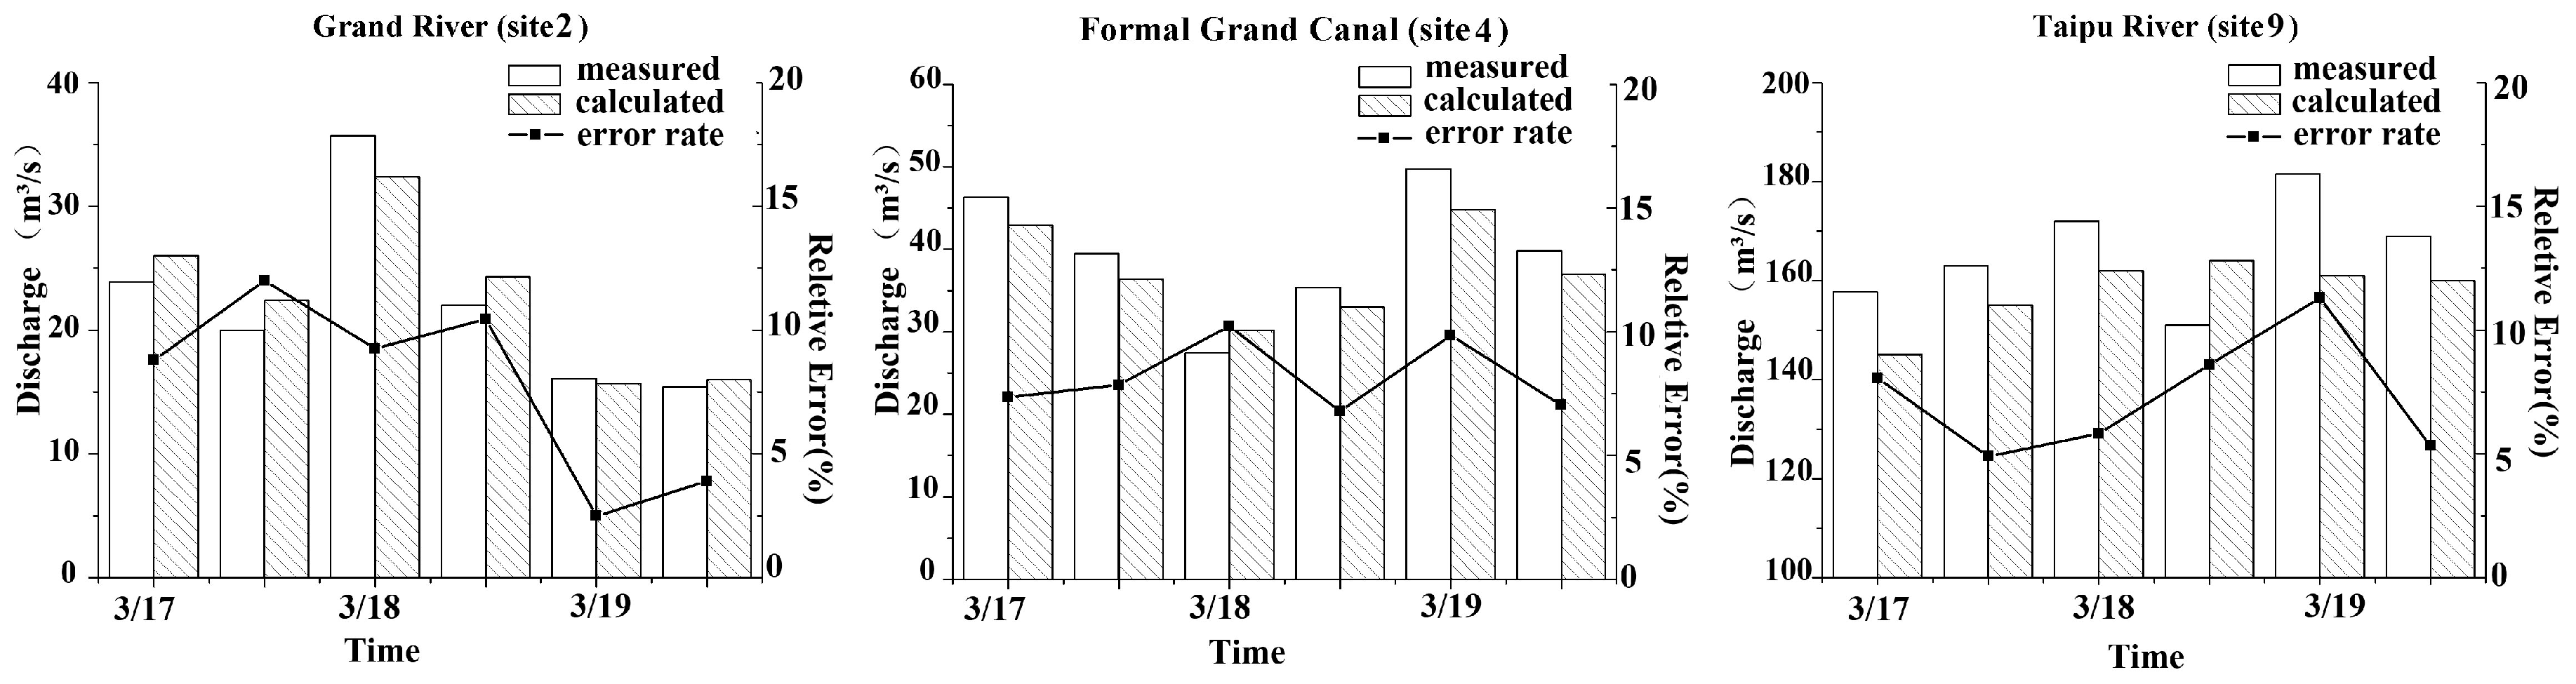
The parameters of the model were further validated with field measurement data during April 2014 in order to guarantee the stability and precision of the model. The validation results for the river discharge are shown in
Figure 7. The results from the model was in good agreement with the measured values, with relative errors between 3.0% and 14.8% at the three major sites. An average error of 8% for the whole river networks suggested a confident validity of the model performance in hydrology predictions.
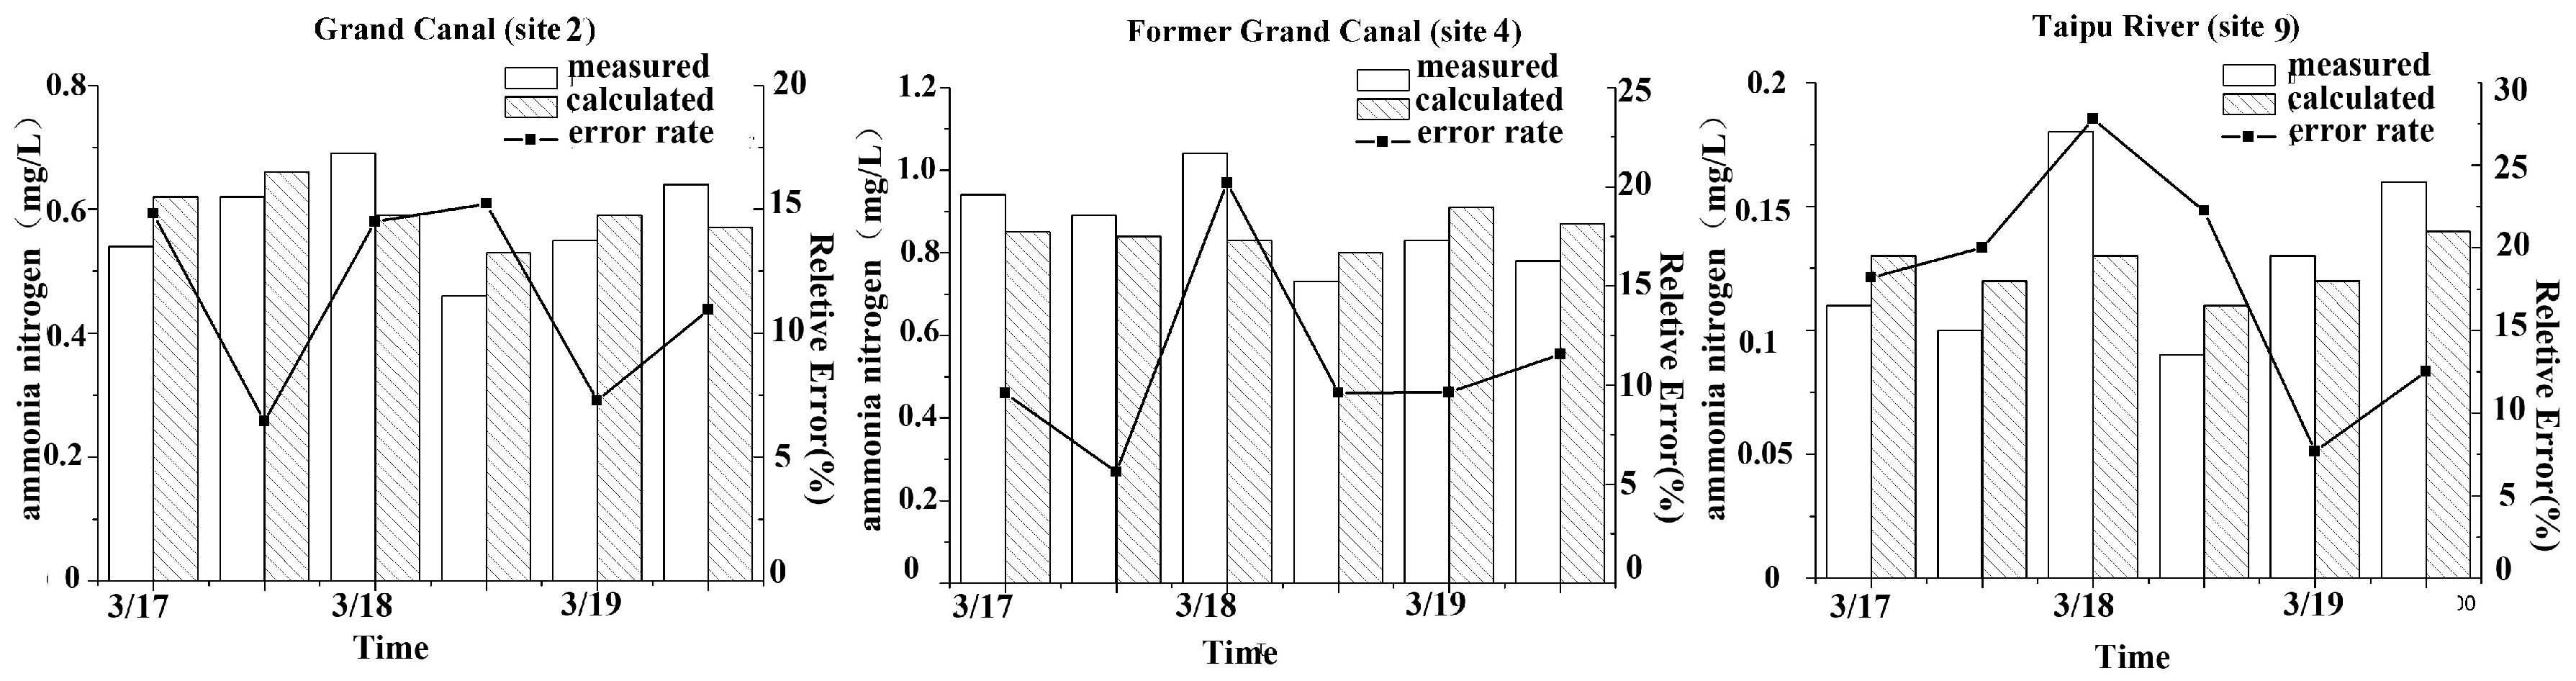
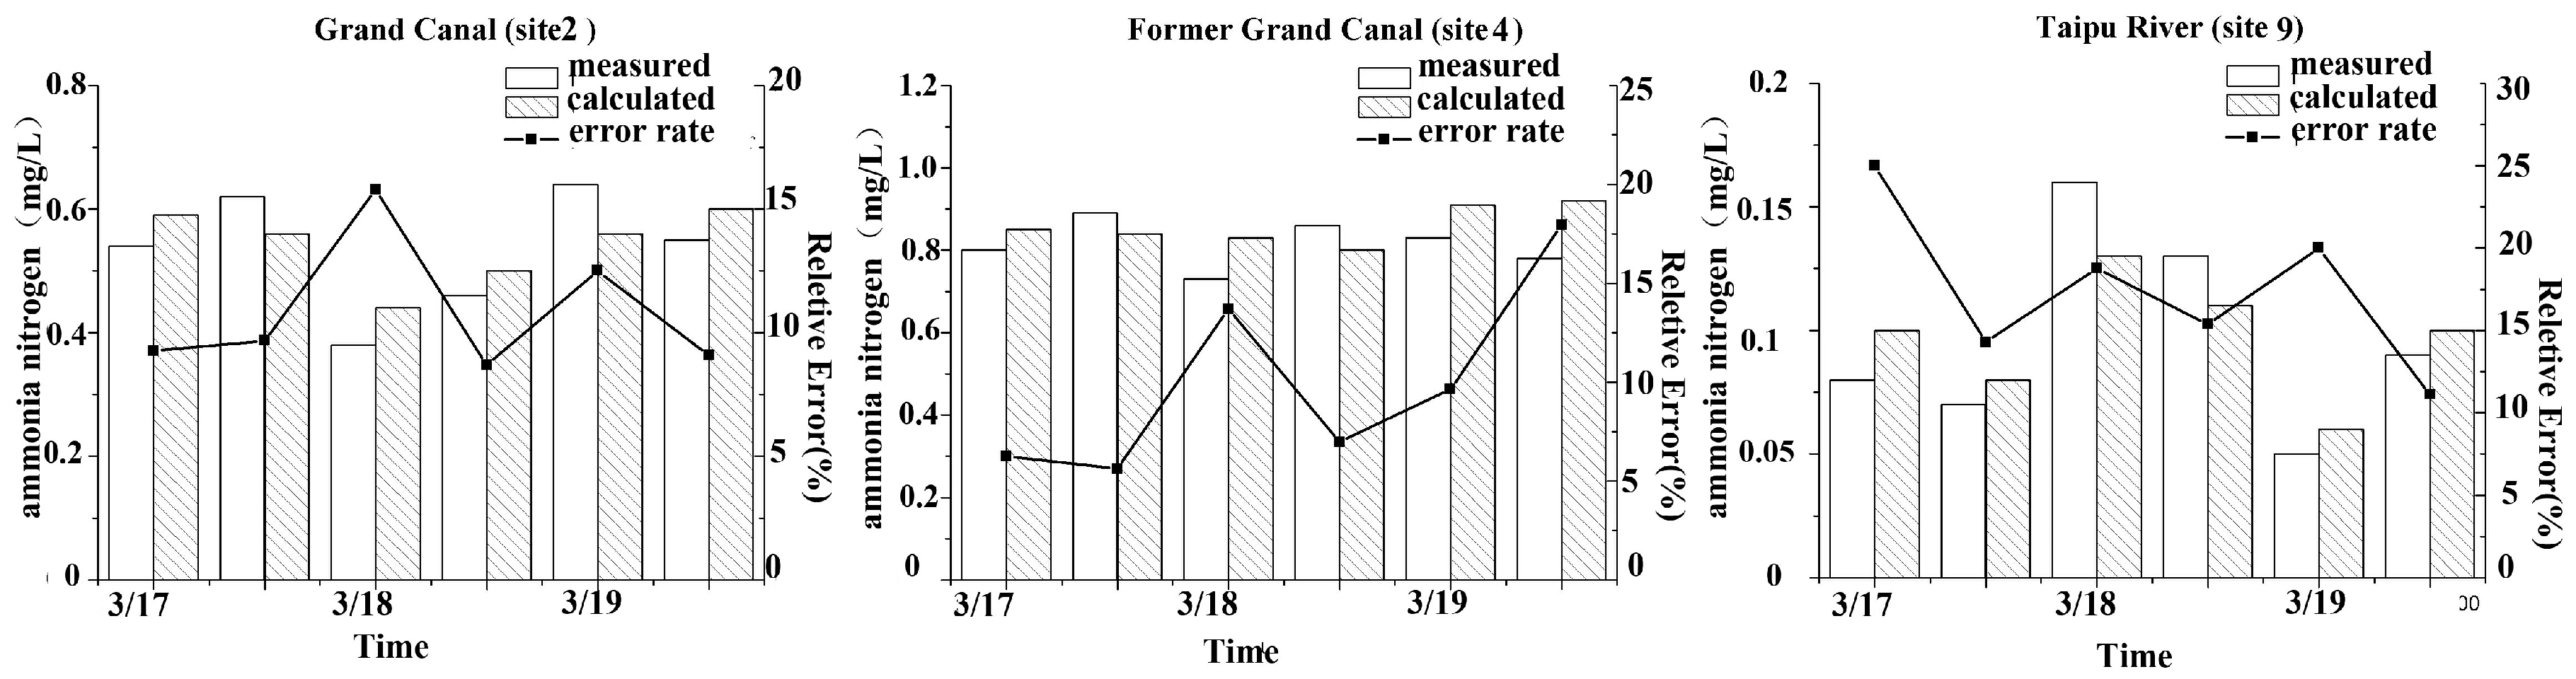
The water quality results between the model and field observations are shown in
Figure 8 and
Figure 9. It was noted that the model-predicted results matched well with the measured ones, with relative errors between 3.2% and 16%. The average relative error for the entire river networks was 9.2%, which indicated that the transport process of pollution could be well represented by our model as well.
3.2. Effectiveness Analysis
“Taihu Lake Basin Water Environmental Function Zoning” approved by the State Council of China and “Regional planning of protection ecological red line in Jiangsu Province” approved by the Peoples’ Government of Jiangsu Province [
24,
25] have both made regulations about functional and sensitive river segments in study area. According to the regulations by government, four river segments with important functions or sensitive properties (
Table 3) in Wujiang District were identified as WESAs. The control factors for TEC were established based on achieving water quality standards in these four WESAs. The locations of the WESAs are shown in
Figure 10.
WESA1 and WESA4 belong to drinking water protection areas on the Taipu River, and the water quality at these two areas is required to reach grade II–III standard according to “Taihu Lake Basin Water Environmental Function Zoning”. WESA 2 belongs to an interregional buffer area of the Former Grand Canal and WESA3 is part of the interregional buffer area of the Lanxi River. Both WSEA 2 and 3 are required to reach grade III water quality standards. Details of these WESAs are shown in
Table 3.
It is important to explore the feasibility of TEC in the scope of Wujiang District by comparing the pollution contributions from local and non-local sources before the control rate is estimated. A low local weighting coefficient suggested local TEC might not work to achieve better water quality and an alternate method in improving water environmental condition was desired. The model was simulated in two scenarios: with and without local emission sources. The weighting coefficient was then calculated following Equation (4). The coefficient results for 4 WESAs are shown in
Table 4.
The average CODCr weighting coefficients of local pollution sources on the four WESAs was over 60.7%, which implies the local pollution source for CODCr has a relatively stronger influence compared to non-local sources for Wujiang District.
Similar to CODCr, local pollution sources also showed a dominant impact when it comes to NH3-N. However, it seems NH3-N was much more sensitive than CODCr with a local weighting coefficient of 72.5%, which was almost 12% larger than the value of CODCr.
For all four WSEAs, it was clearly noted that our model estimated a high weighting coefficient for both CODCr and NH3-N (60%–70%) which indicated an evident impact of local sewage discharge on water quality for the study area. In other words, discharge control for Wujiang District was expected to improve water quality and local TEC was potentially effective.
3.3. Emission Control Plans for the Study Area
Based on the official management plan “Comprehensive Planning of Water Resources in Wujiang City” [
26] and the “Water Environmental Capacity Calculation Report of Water Function Zones in Jiangsu Province” [
27], three corresponding pollution control plans were proposed. The details of the plans are shown in
Table 5.
According to The Code of Practice for Computation on Allowable Permitted Assimilative Capacity of Water Bodies (GB/T 25173-2010) [
28], the hydraulic condition for pollution control plans was set as the discharge of the driest month with a recurrence interval of 10 years (P = 90%). In the Comprehensive Planning of Water Resources in Wujiang City, February 1971 was proposed as the driest month under a 90% guarantee rate under the analysis of precipitation frequency. Attached is the hydraulic condition for main rivers in study area (
Table 6).
Unlike the hydraulic condition, the water quality calculation condition was not especially defined in the relevant regulation by the government. It is important to explore how emission reduction would affect the existing water quality even in the unfavorable hydraulic condition. As for that, field water quality measurement data in March, 2013 was directly applied as the initial condition for model simulation. The model was run separately under the three proposed pollution control plans.
Since the length of river reaches in the WESAs varied from 4.2 km to 17.5 km, water quality changes along the reaches under the effect of emissions from both riversides. Based on the water environmental capacity calculation method [
29], the average water quality at the computational nodes in the WESAs was used to evaluate the status of the WESAs.
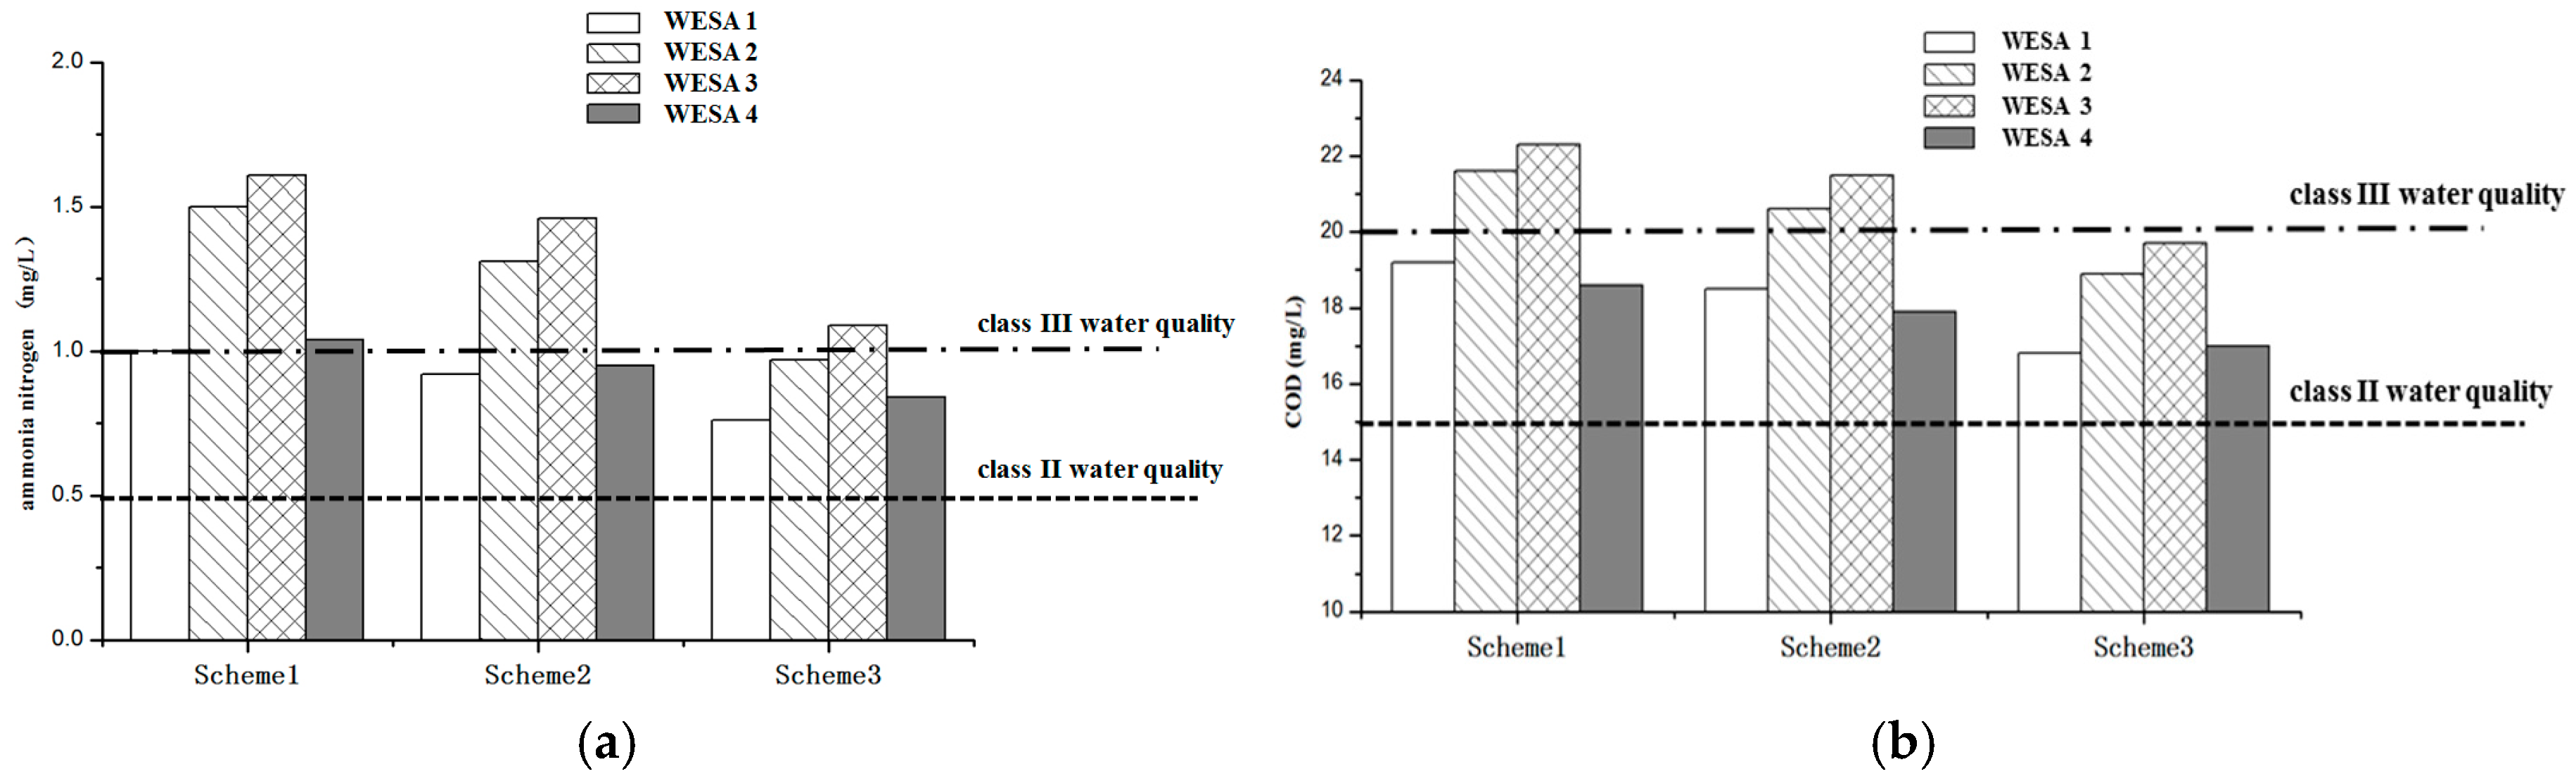
Different water quality results for the WESAs under relevant emission control conditions are presented in
Figure 11a,b:
The bar chart indicates the changes in water quality for different WESAs. After analysis, the results were as follows:
- (1)
Scheme I: under the fixed hydrological conditions of a P = 90% guarantee rate, maintaining the current emission status without any reduction, WESA1, WESA2, and WESA3 all exceeded the corresponding standards of water quality; therefore, the current total emission amounts should be immediately reduced;
- (2)
Scheme II: according to regional water management planning, it has been recommended that local CODCr and NH3-N pollution load should be reduced by 5.4% and 12.7%, respectively. After the implementation of this reduction planning, water quality for these four WESAs was improved to some extent. However, water quality of WESA2 and WESA3, especially in terms of NH3-N, still cannot meet the requirements. A further reduction would be necessary on the basis of integrated water resource planning in Wujiang District;
- (3)
Scheme III: the total emissions of CODCr and NH3-N in Wujiang District were required to be reduced by 14.6% and 31.1%. The reduction result showed all the water quality in environmentally sensitive areas reached the corresponding requirements, except for NH3-N in WESA3. However, a 9.4% exceedance in WESA3 appears to be in an acceptable range. This scheme can basically reach the requirements of TEC in Wujiang District.
4. Discussion
In our study, WESAs were, for the first time, selected as control targets in the new TEC method which not only efficiently guarantee water quality conditions of important river segments, but also reasonably suggested an emission reduction rate and potentially maintained economic development. Moreover, effectiveness analysis was conducted as a pre-condition of the new method and a high weighting coefficient for Wujiang District was derived. Hence, our results indicated that, with a similar density of pollution emission sources, the new method could be sufficiently applied for an area larger than Wujiang (10,000 km2) in the Taihu Basin.
The established 1-D model displayed good performance in reproducing hydrodynamics and water quality conditions of the study river networks. Relative errors between the model simulations and field measurements were comparably small for the model validation. However, it should be noted that river sediment in the study area was not directly considered in the model, given that little field data for sediment nutrient content was available. During the past several decades with high economic development, nutrients were significantly accumulated in the bottom sediment and it was found that internal sediment release can contribute as high as 25% of the nutrients in water bodies under certain hydrodynamic conditions [
30]. Even though calibration on the degradation coefficient for our model can reflect the role of sediment as sink or source to some extent, it is still desired to incorporate the sediment module into the model, especially for long-term simulations with highly varied hydrodynamic conditions.
5. Conclusions
As pollution of river networks is a serious environmental problem all over the world, total emission control has become the preferred choice for management of water quality by many governments, and achieved a great deal of success in environmental water management. To maintain the health status of important functional areas of rivers, strict restrictions and regulations should be applied in pollution emissions control. In addition, a reasonable reduction rate should be carefully determined.
In this paper, four WESAs in Wujiang District were identified to be the control factors of TEC. Based on weighting coefficient analysis methods for local pollution sources, the average weighting coefficient of local emissions (CODCr) was determined as 60.7%, and the corresponding value for NH3-N reached 72.5%, proving that TEC of local pollution sources in Wujiang is effective. Finally, simulations of the water environment in Wujiang District were conducted using a 1-D model under different pollution conditions, according to proposed pollution control plans. Analysis showed that to meet the water quality requirements of the WESAs, the total amount of NH3-N should be reduced by 14.6% and the total amount of CODCr should be reduced by 31.1%.
The new method provided a practical way to plan a both effective and reasonable pollution reduction program in a river network of the Taihu Basin. This method, potentially applicable in other river networks, can be of great value in helping governments design water management policies.
Acknowledgments
Part of this work was supported by the National Water Special Project of China (2012ZX07506-007).
Author Contributions
Xiao Wang carried out the analysis and drafted the manuscript. Hua Wang and Chunqi Shen participated in the manuscript modification. Xue Wang made the contributions on calculation. Yong Pang carried out the design of outline. All authors have read and approved the final manuscript.
Conflicts of Interest
The authors declare no conflict of interest.
References
- Yao, H.; Li, W.; Qian, X. Identification of Major Risk Sources for Surface Water Pollution by Risk Indexes (RI) in the Multi-Provincial Boundary Region of the Taihu Basin, China. Int. J. Environ. Res. Public Health 2015, 12, 10150–10170. [Google Scholar] [CrossRef] [PubMed]
- Su, W.; Ye, G.; Yao, S.; Yang, G. Urban Land Pattern Impacts on Floods in a New District of China. Sustainability 2014, 6, 6488–6508. [Google Scholar] [CrossRef]
- Wu, L.; Gao, J.E.; Ma, X.Y.; Li, D. Application of modified export coefficient method on the load estimation of non-point source nitrogen and phosphorus pollution of soil and water loss in semiarid regions. Environ. Sci. Pollut. Res. 2015, 22, 10647–10660. [Google Scholar] [CrossRef] [PubMed]
- Yin, Y.; Xu, Y.; Chen, Y. Relationship between changes of river-lake networks and water levels in typical regions of Taihu Lake Basin, China. Chin. Geogr. Sci. 2012, 22, 673–682. [Google Scholar] [CrossRef]
- Munasinghe, M. Water Supply and Environmental Management: Developing World Applications; Westview Press: Boulder, CO, USA, 1992. [Google Scholar]
- Hu, H.; Jin, Q.; Kavan, P. A Study of Heavy Metal Pollution in China: Current Status, Pollution-Control Policies and Countermeasures. Sustainability 2014, 6, 5820–5838. [Google Scholar] [CrossRef]
- Lan, H.; Livermore, M.; Wenner, C. Water pollution and regulatory cooperation in China. Cornell Int. Law J. 2011, 44, 349. [Google Scholar]
- Han, K.; Noh, J.; Kim, J.S.; Lee, C. Application of stochastic optimization algorithm for waste load allocation in the Nakdong River basin, Korea. KSCE J. Civ. Eng. 2012, 16, 650–659. [Google Scholar] [CrossRef]
- Xie, R.; Pang, Y.; Bao, K. Spatiotemporal distribution of water environmental capacity—A case study on the western areas of Taihu Lake in Jiangsu Province, China. Environ. Sci. Pollut. Res. 2014, 21, 5465–5473. [Google Scholar] [CrossRef] [PubMed]
- Zhu, M.M.; Pang, Y.; Xie, R.R. Up-to-standard analysis of water quality based on Hangjiahua plain river network model: A case study of Jiashan waterworks section. Water Resour. Prot. 2013, 29, 34–38. [Google Scholar]
- Ministry of Environmental Protection in the Peoples’ Republic of China. Environmental Impact Assessment of Construction Project and Classification Management List. 2009. Available online: http://www.zhb.gov.cn/gkml/hbb/bl/201504/W020150420522354957849.pdf (accessed on 7 February 2017). [Google Scholar]
- Pan, T. Study on the planning of water pollution control in Wujiang. Pollut. Control Technol. 2009, 22, 46–50. [Google Scholar]
- Zhang, Y.; Chen, S.; Peng, L. Relationships between Land Use Pattern and Surface Water Quality in the Plain RIver Network Area. Resour. Sci. 2009, 31, 7. [Google Scholar]
- People’s Government of Jiangsu Province. Jiangsu Provincial “Twelve-Five” Comprehensive Programme of Energy Conservation and Emission Reduction Circulated by the Jiangsu Government. 2013. Available online: http://www.jiangsu.gov.cn/jsgov/tj/bgt/201311/t20131104_405401.html (accessed on 7 February 2017). [Google Scholar]
- Ministry of Environmental Protection of the People’s Republic of China. Technical Specifications Requirements for Monitoring of Surface Water and Waste Water. 2002. Available online: http://www.sepa.gov.cn/image20010518/3589.pdf (accessed on 7 February 2017). [Google Scholar]
- Ministry of Environmental Protection of People’s Republic of China. Environmental Quality Standard for Surface Water (GB3838-2002); China Environmental Science Press: Beijing, China, 2002.
- Doulgeris, C.; Georgiou, P.; Papadimos, D.; Papamichail, D. Ecosystem approach to water resources management using the MIKE 11 modeling system in the Strymonas River and Lake Kerkini. J. Environ. Manag. 2012, 94, 132–143. [Google Scholar] [CrossRef] [PubMed]
- Zouabi-Aloui, B.; Adelana, S.M.; Gueddari, M. Effects of selective withdrawal on hydrodynamics and water quality of a thermally stratified reservoir in the southern side of the Mediterranean Sea: Asimulation approach. Environ. Monit. Assess. 2015, 187, 292. [Google Scholar] [CrossRef] [PubMed]
- Choi, H.G.; Han, K.Y. Development and Applicability Assessment of 1-D Water Quality Model in Nakdong River. KSCE J. Civil Eng. 2014, 18, 2234–2243. [Google Scholar] [CrossRef]
- Zeng, J.; Lou, Y.; Cheng, H. Research on water quality model of Wenruitang River Network. Zhejiang Hydrotech. 2006, 1, 41–43. [Google Scholar]
- Lian, J.J.; Xu, K.; Ma, C. Joint impact of rainfall and tidal level on flood risk in a coastal city with a compex river network: A case study of Fuzhou City, China. Hydrol. Earth Syst. Sci. 2013, 17, 679–689. [Google Scholar] [CrossRef]
- Han, L.X. Parameter estimation in channel network flow simulation. Water Sci. Eng. 2008, 1, 10–17. [Google Scholar]
- Wang, H.; Ji, F.Q.; Xia, K. Water Environment Numerical Simulation for a Complicated River-Lake System. Adv. Mater. Res. 2014, 1010, 403–408. [Google Scholar] [CrossRef]
- People’s Government of Jiangsu Province. Regional Planning of Protection Ecological Red Line in Jiangsu Province. 2013. Available online: http://www.jiangsu.gov.cn/jsgov/tj/bgt/201309/t20130923_400467.html (accessed on 7 February 2017). [Google Scholar]
- The State Council of People’s Republic of China. Water Functional Regionalization in Taihu Lake Basin. 2010. Available online: http://www.tba.gov.cn/tba/content/TBA/xwzx/thyw/JCMS000000029891.html (accessed on 7 February 2017). [Google Scholar]
- Municipal Water Conservancy Bureau of Wujiang District. Comprehensive Planning of Water Resources in Wujiang City; Wujiang Water Conservancy Bureau Press: Wujiang, China, 2011.
- Provincial Water Conservancy Bureau of Jiangsu Province. Water Environmental Capacity Calculation Report of Water Function Zones in Jiangsu Province; Jiangsu Provincial Water Conservancy Bureau Press: Nanjing, China, 2014.
- Water Conservancy Bureau of People’s Republic of China. The Code of Practice for Computation of Allowable Permitted Assimilative Capacity of Water; Standard Press of China: Beijing, China, 2010.
- Pang, Y.; Lu, G.H.; Wu, Z.Y. Theory and Application of Water Environmental Capacity Calculation; Chinese Science Press: Beijing, China, 2010. [Google Scholar]
- Liu, Y.; Yi, T.Q.; Chen, Q.W.; Huang, W.; Zhang, T. The spatial distribution of nitrogen species in surface sediment in the west river networks of the Taihu Lake Basin, China. Acta Sci. Circ. 2015, 32, 3890–3897. [Google Scholar]
© 2017 by the authors. Licensee MDPI, Basel, Switzerland. This article is an open access article distributed under the terms and conditions of the Creative Commons Attribution (CC BY) license ( http://creativecommons.org/licenses/by/4.0/).


