Article

Monitoring Environmental Quality by Sniffing Social Media

1
International School of Software, Wuhan University, Wuhan 430079, China
2
School of Software, East China University of Technology, Nanchang 330013, China
*
Author to whom correspondence should be addressed.
Sustainability 2017, 9(2), 85; https://doi.org/10.3390/su9020085
Submission received: 9 November 2016 / Revised: 22 December 2016 / Accepted: 5 January 2017 / Published: 10 February 2017
(This article belongs to the Special Issue Sustainable Ecosystems and Society in the Context of Big and New Data)

Abstract

:
Nowadays, the environmental pollution and degradation in China has become a serious problem with the rapid development of Chinese heavy industry and increased energy generation. With sustainable development being the key to solving these problems, it is necessary to develop proper techniques for monitoring environmental quality. Compared to traditional environment monitoring methods utilizing expensive and complex instruments, we recognized that social media analysis is an efficient and feasible alternative to achieve this goal with the phenomenon that a growing number of people post their comments and feelings about their living environment on social media, such as blogs and personal websites. In this paper, we self-defined a term called the Environmental Quality Index (EQI) to measure and represent people’s overall attitude and sentiment towards an area’s environmental quality at a specific time; it includes not only metrics for water and food quality but also people’s feelings about air pollution. In the experiment, a high sentiment analysis and classification precision of 85.67% was obtained utilizing the support vector machine algorithm, and we calculated and analyzed the EQI for 27 provinces in China using the text data related to the environment from the Chinese Sina micro-blog and Baidu Tieba collected from January 2015 to June 2016. By comparing our results to with the data from the Chinese Academy of Sciences (CAS), we showed that the environment evaluation model we constructed and the method we proposed are feasible and effective.

1. Introduction

With the popularity and development of the internet, social media, such as blogs and personal websites, etc., have greatly changed peoples’ lives. These social media propel the spread of social news, public opinion, and personal daily information in society and play an important role in current information dissemination and life sharing [1,2]. For example, in China, according to the survey of the China Internet Network Information Center (CNNIC) (as shown in Figure 1), people are spending more and more time on the internet, and that internet time will keep increasing in the future [3].
Since people spend so much time on social media, it is worthwhile to utilize them to uncover and collect various kinds of environmental information. Considering the environment field, we checked the previous related works that attempted to gather environment pollution information based on different methods. In 2008, Honicky et al. [4] suggested collecting pollution information by sensors attached to mobile phones. In 2009, Aoki et al. [5] used vehicles to monitor air quality by deploying mobile air quality sensing platforms on street sweeping trucks in San Francisco. In 2012, the work by Xu et al. [6] monitored spatial-temporal signals from social media. In 2014, Zheng et al. [7] and Chen et al. [8] estimated the air quality in big cities by fusing monitoring station data with social media data, and Mei et al. [9] focused on predicting air pollution in 108 cities in China from the text content in the Chinese Sina micro-blog. More recently, in 2015, Kay et al. [10] researched how Chinese social media influenced the air quality. In 2016, Sammarco M et al. [11] used a geographical search about air pollution related posts on social networks as an effective air-impurities measurement and utilized it to predict pollution values, and Tse et al. [12] verified the feasibility of sensing air pollution from social networks and of integrating such information with real sensor feeds. To the best of our knowledge, there has been very little research done on comprehensive environmental quality through mining Chinese social media.
This paper aims to monitor environmental quality in regions of different provinces in China by collecting large amount of text data from two of China’s major social medias: Sina micro-blog (http://weibo.com) and Baidu TieBa (http://tieba.baidu.com). Sina micro-blog is a popular micro-blogging service platform like Twitter, and Baidu Tieba is known as the world’s largest Chinese community, which has 1.5 billion registered users and 64.6 billion total messages. We further analyzed and classified people’s attitude and sentiment to the environment using the support vector machine algorithm with 85.67% precision on average. In addition, we constructed a new environment evaluation model and achieved the goal of environment monitoring in specific regions effectively by calculating and analyzing the Environmental Quality Index (EQI), which represents people’s overall attitude and sentiment towards an area’s environmental quality at a specific time. Finally, by utilizing the environment evaluation model, we monitored the environmental quality for parts of major cities or provinces in China and compared the difference in environmental quality for 27 provinces in China in 2015. The experimental results we obtained are very closed to the “China livable city report” published by the Chinese Academy of Sciences (CAS) in 2015, which illustrates that the environment evaluation model we constructed is feasible.
This work is an important and innovative step in monitoring environmental quality based on Chinese social media. It explores the process of classification according to short texts and constructs an environment evaluation model to calculate EQI. By combining support vector machine algorithms and experiment results we show that the model is a feasible and efficient way to analyze and compare the environmental quality in different regions in China. Besides, it can provide a foundation for monitoring environmental quality by analyzing social media information for some researchers.

2. Methods

2.1. Formal Definition

In this paper, we wanted to establish a model that can be used to evaluate the environmental quality of different places in China at different times. Given enough text data related to the environment for a specific region in the required time period, we should be able to determine the status of the environment by analyzing the writers’ emotional attitudes. In order to make this problem clearer, the first step we took was to define the vocabulary of region and emotion (Definitions 1–3).
Definition 1 (Text words w ).
The words in the text may be related to emotional attitudes toward the environment. Applying statistics to every word in the text is the key point in processing raw data. Using the tuple to represent: w = {t, a}, where t stands for the text value of the word, and a stands for the frequency of w in this text.
Definition 2 (Emotional dictionary D).
For each emotional tendency, we can build a more significant thesaurus to represent it, namely, an emotional thesaurus. An emotional thesaurus depends on the analysis of the attitude toward the environment. We use tuples to represent the emotional word: D = {d, v}, where d is the lexicon of each word, and v is the vector measuring emotional tendency. In this way, if the v is close to the central vector, the text content is more likely to have emotional tendency. The words in the lexicon can also be represented as tuples: d = {t, c}, where t is the text representation of the word d, and c is the correlation for the word d with the emotional tendency.
Definition 3 (Regional dictionary R).
For each region or city, we need large amount of its text data, T, as the basis for the analysis of the region’s environmental quality.
After we made the three definitions above, the problem was formalized as follows: Use the data on social media to build dictionary D, Regional dictionary R, and large amounts of text data T, then process the data and forecast the environmental quality.

2.2. Establishing the Emotional and Regional Dictionary

Currently, we have both a geographical thesaurus and an emotional thesaurus. The “Sogou thesaurus” (http://pinyin.sogou.com/dict) provided the geographical thesaurus and the Dalian University of Technology Laboratory of Information Retrieval provided the emotional thesaurus [13]. However, the accuracy of each thesaurus has a crucial impact on the experiment, so verifying the emotional and regional thesaurus was necessary. This paper utilized a CHI (Chi-square) prescribing test and TFIDF (Term Frequency Inverse Document Frequency) algorithms and a certain degree of manual inspection to check the thesauruses. By comparing the keyword set related to environment and sentiment obtained by the two methods with the above thesauruses, we found many words exist in both thesauruses. At the same time, some words that are irrelevant with the emotional tendency and environment were also found, such as “expert” and “people”. Since the total number of words is just less than 120, we can obtain a more accurate result using artificial selection. As shown in Table 1, the average appearance rate for the “Sogou thesaurus” is 92.41% and the average appearance rate for another thesaurus is 94.38%. From this result, we can determine that the two thesauruses are accurate and reliable. Also, we manually added some keywords from the keywords set we obtained as a supplement, if they were relevant but not contained in the thesauruses.

2.3. Filtering the Irrelevant Text Content

It was very important to find a method to determine whether a text is related to environmental quality so that we could establish the environment evaluation model. The model was resolved by the “TextRank” method mentioned in Section 3. The formula for calculating the relation is:
R ( T ) = ( w ( T ( w ) D ( w ) ) ( f ( w ) + f ( w ) × F ( w ) ) / ( F ( w ) + 1 ) + w ( T ( w ) D ( w ) ) f ( w ) ) / L ( T )
In the formula, R ( T ) represents the environmental relation value for a piece of text data, T represents a whole text content. f ( w ) is the value of the word w defined in the word frequency table we set up, f ( w ) is the “TextRank” method’s value of the word, and F ( w ) is the word occurrences time in the frequency table. L ( T ) is number of words and w is each word that makes up the whole text. T ( w ) is the word set that constitutes the sentence, and D ( w ) is the word set of the whole word frequency table. There are more specific definitions for the “TextRank” method and the word frequency table in Section 3.2 of this paper.

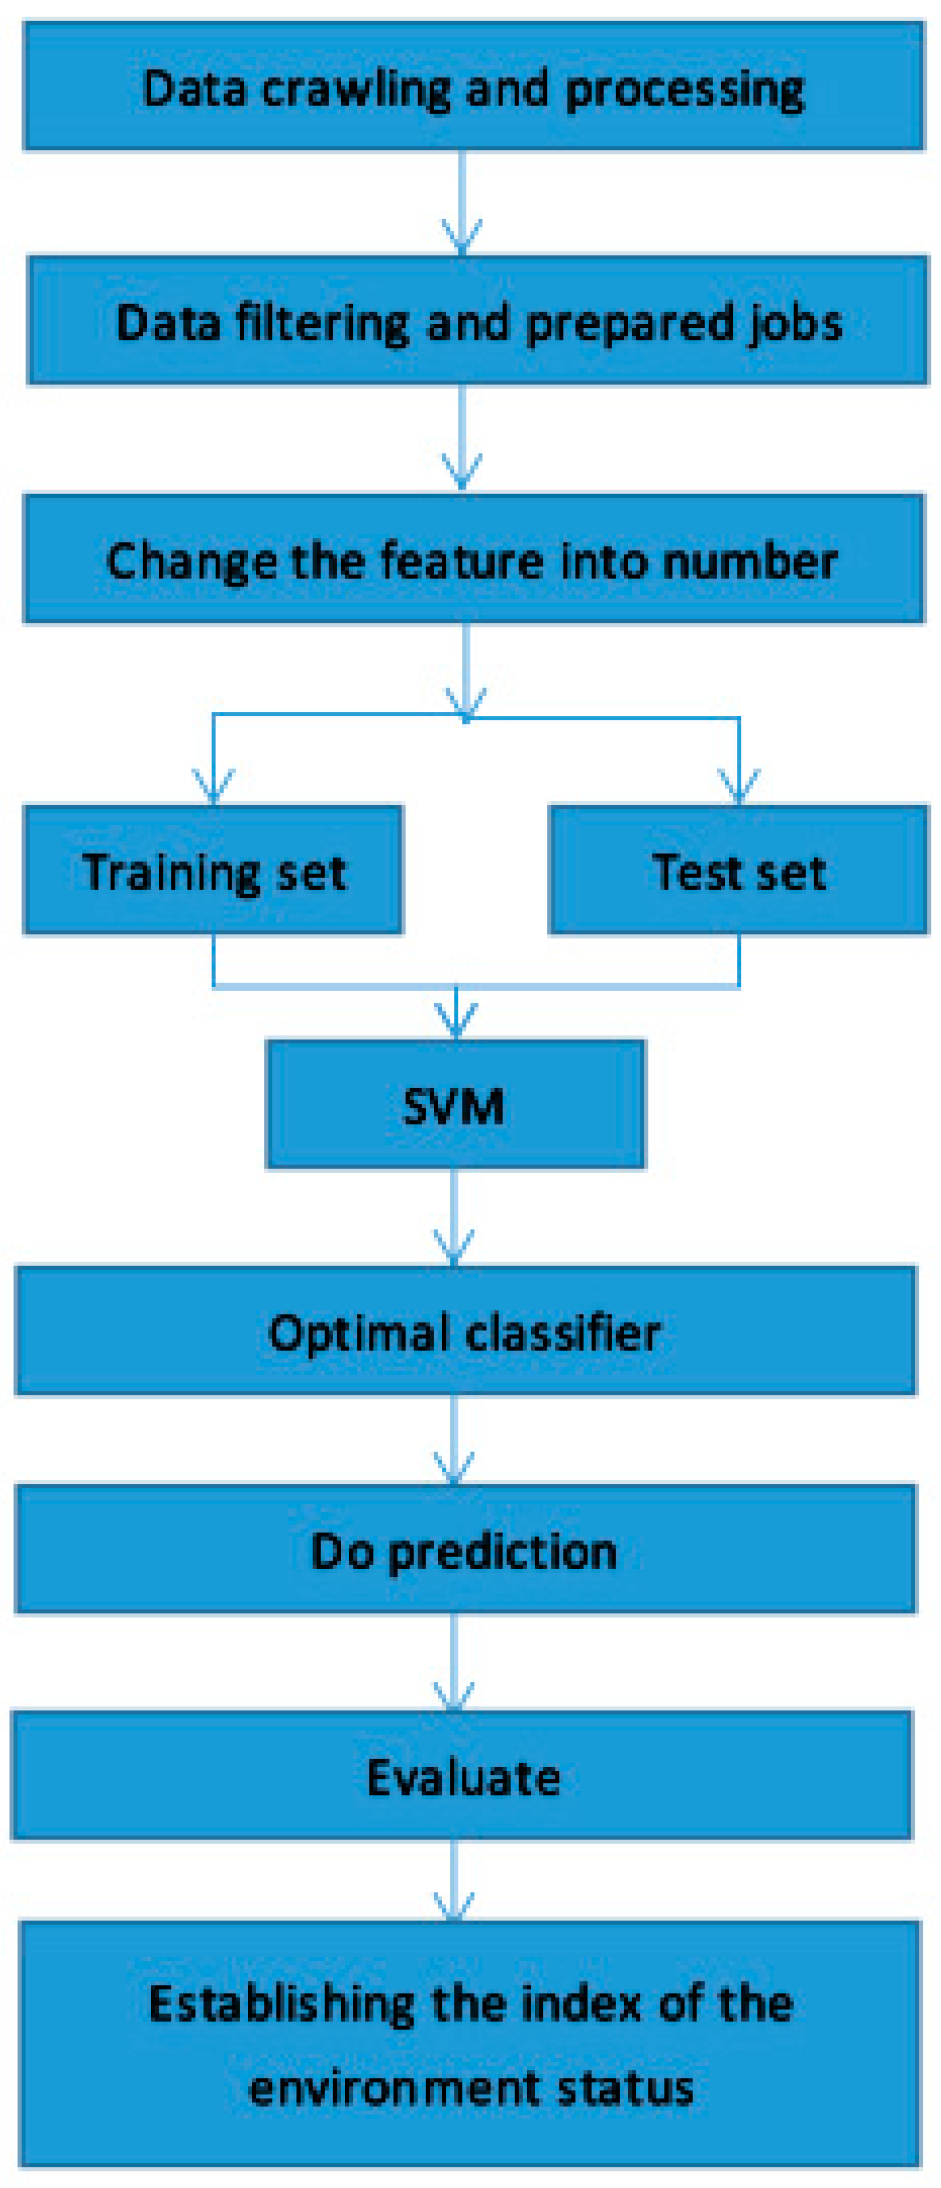
2.4. Environmental Quality Analysis Method Combining Support Vector Machine

For the classification, machine learning was widely used. In this paper, we utilized the Support Vector Machine (SVM) for classifying [14]. The Support Vector Machine is currently one of the best algorithms in data mining [15]. It is just a hyper plane used to divide data into different groups [16,17,18]. When we enter the processed data into it, the data are distributed in both sides of the hyper plane. Ultimately, we get the label data that have no label and do prediction [19]. The detailed process for constructing the support vector machine model is in Section 3.3.
Algorithm: Environmental quality analysis using the support vector machine and utilizing Sequential Minimal Optimization (SMO):
  • Input content:
    dataMatInTrain: processed data which has the characteristic about environment in Training set
    classLabelsTrain: the label for the Corresponding data in Training set
    C: threshold
    toler: fault tolerant rate
    maxIter: iterator number
    kTup: kernel function
    dataMatInTest: processed data which has the characteristic about environment in test set
  • Output content:
    w: the normal vector for hyper plane
    b: the constant for hyper plane
    label: predicted label for data
  • Pseudo code:
    • Data = process data and get the characteristic toward environment
    • Get data matrix:
      • dataMatInTrain, classLabelsTrain = loadData (Data)
    • Get key parameter:
      • w, b = SMO (dataMatIn, classLabels, C, toler ,maxIter, kTup)
    • Test the correct rate of this hyper plane:
      • Rate = judgeData (w, data, classLabel, b)
    • If Rate > n:
      • Use this hyper plane to do the prediction:
      • Label = Predict (w, data, b)
      Else:
      • Change some input parameter or training data to increase the correct rate
      • Do step 5
    • Draw conclusions
In the pseudo code above, the most important step is function SMO (Sequential Minimal Optimization), which breaks the large quadratic programming (QP) problem into a series of the smallest possible QP problems in training support vector machines, and we wrote our own SMO function code based on the pseudo-code mentioned in the research paper of John C. Platt [20].

2.5. Establishing the Environmental Quality Index

By analyzing thousands of sentiment analyses of text data on social networks associated with the environment in a region within a certain time period, utilizing the Support Vector Machine model, we can artificially create a representative of environmental quality in that area which we call the EQI (Environmental Quality Index) F ( c , t ) :
F ( c , t ) = T S ( c , t ) E ( T )
where t stands for the time period, and c stands for the region of a text content. T represents a text, E ( T ) is the emotional evaluation value towards the environment status which is obtained from the SVM model we constructed in Section 3.3, and S ( c , t ) is the whole text data set we have at time period t in region c . The EQI can be used to measure the environmental quality in a specific region at a specific period. The practical operation of it will be discussed in detail in Section 3.4.

3. Experiment

In this part, we followed the steps in Figure 2 to do the predictions. Firstly, we used the crawler to get data about environment from the Sina micro-blog and Baidu TieBa. When we got enough data from users, we tried to eliminate the irrelevant data and use text model to express the content. Secondly, we input the training data into the SVM to get the most suitable hyper plane. Then, we predicated the emotional tendency toward the environment based on this hyper plane. Finally, we constructed the environment evaluation model and obtained the environment monitoring result for some major cities in China every month from January 2015 to June 2016 and environmental quality ranking for 27 provinces in China in 2015.

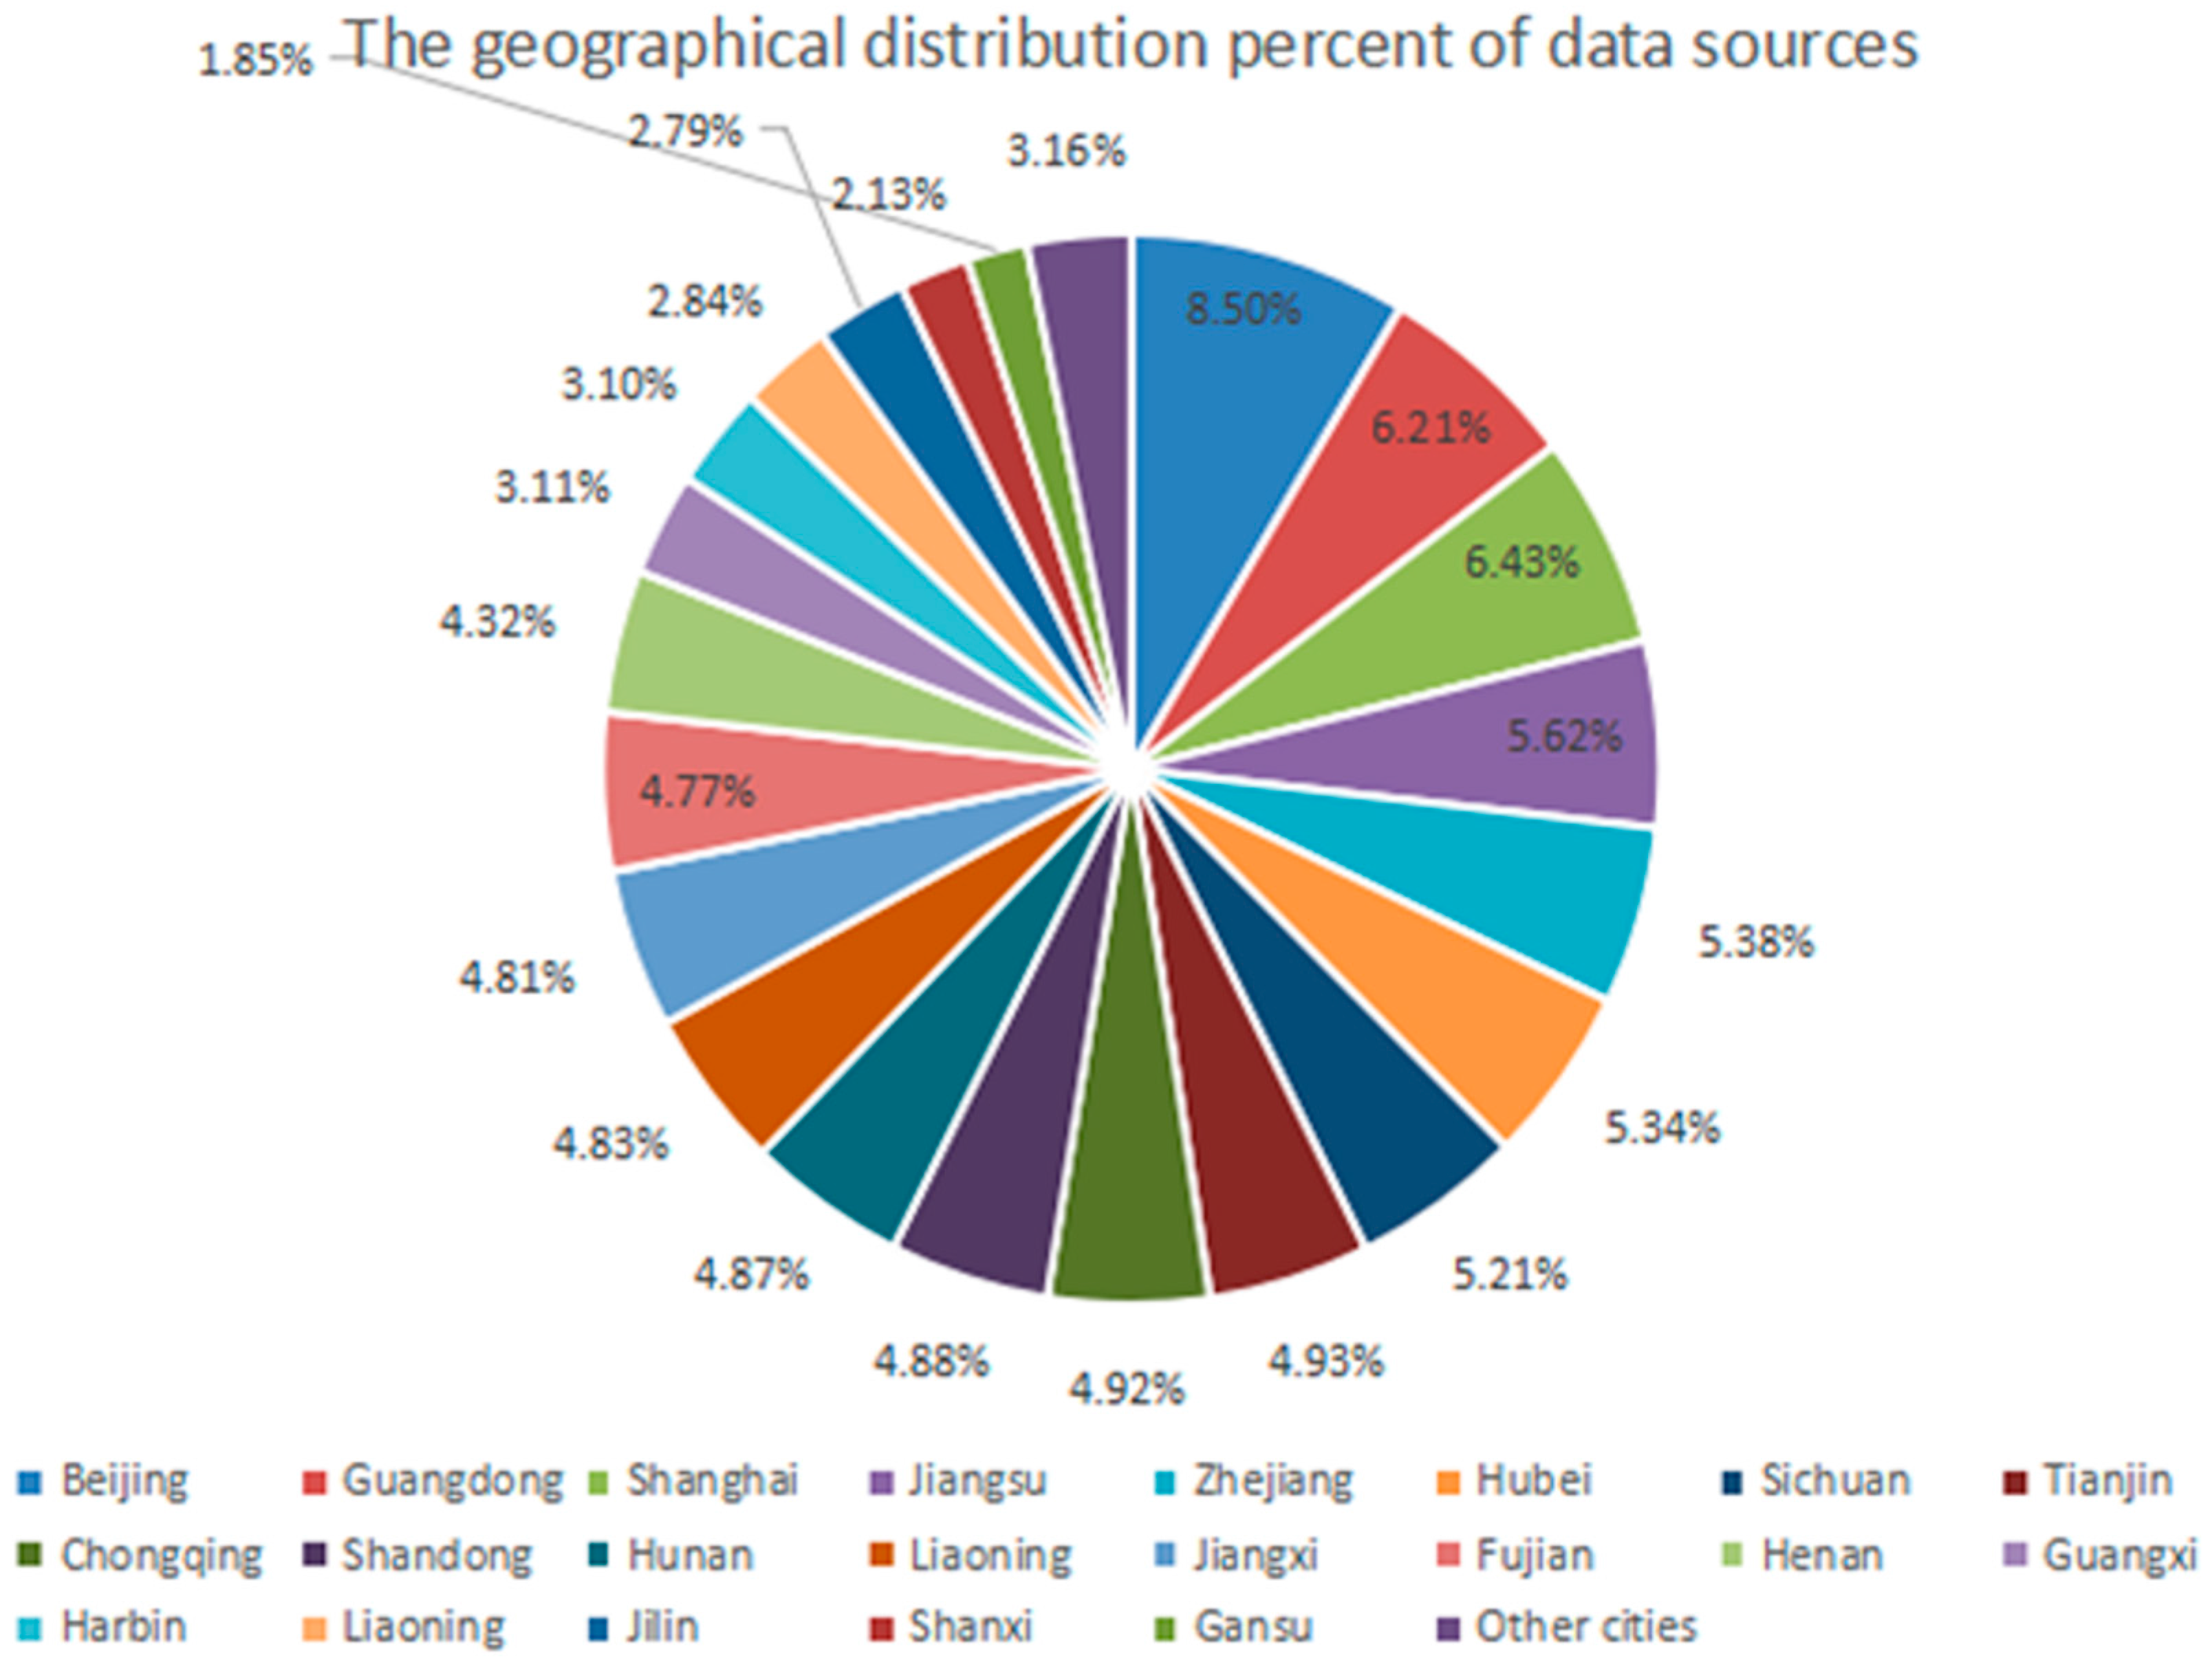
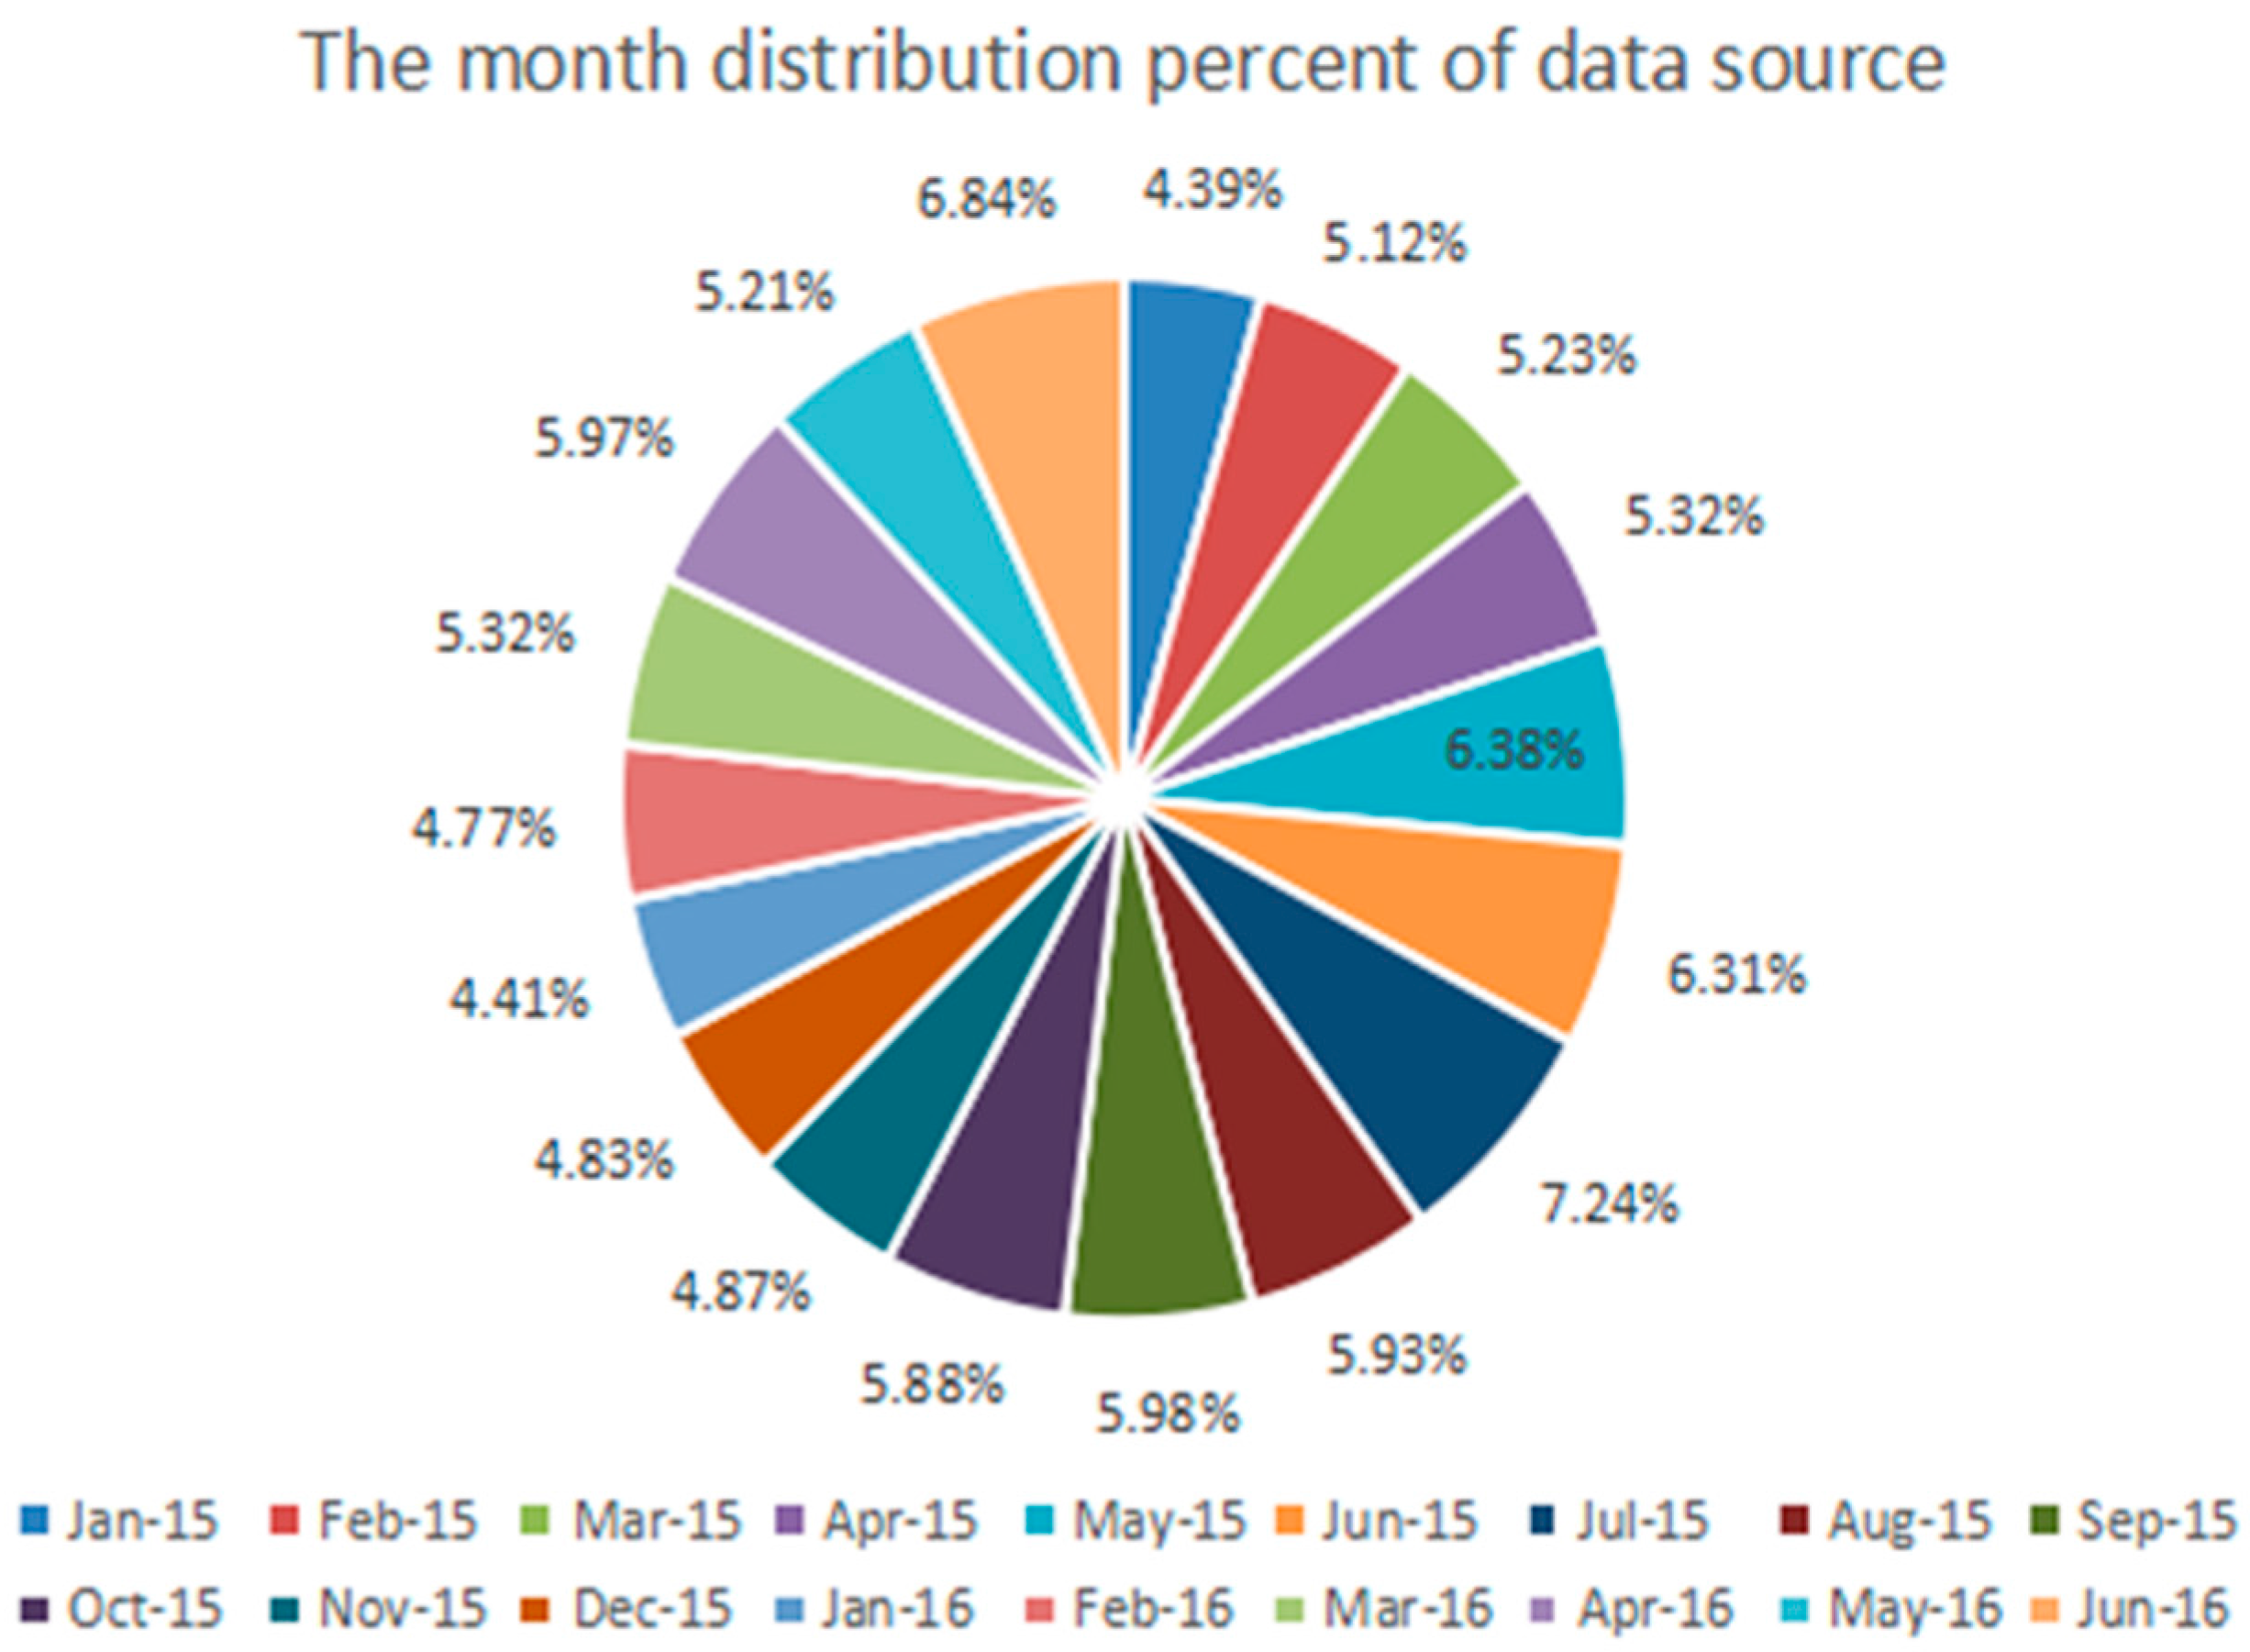
3.1. The Collection and Preprocessing of the Data

We collected the data from Baidu TieBa and the Sina micro-blog by using the Web Spider. The Baidu TieBa Spider works as follow: Firstly, the Baidu Tieba Spider got access to the home of the related Baidu TieBa and analyzed the page elements in order to get the link of all the posts. Then, we collected content and the post time of each post. Next, we used Jieba (https://pypi.python.org/pypi/jieba), which is an open source and popular python package and provides functions for Chinese word segmentation, to split the text information and match each word with the keywords about environment we set in advance for the text filtering. After that, Jieba found the most probable combination based on the word frequency using dynamic programming. If there were unknown words, we used the Viterbi algorithm [21] which is a HMM (Hidden Markov Model)-based model to build a directed acyclic graph (DAG) for all possible word combinations. Then, it was written into the database if the matching process was successful. The Sina micro-blog Spider was slightly modified from a GitHub user Liu’s “Sina_spider1” (https://github.com/LiuXingMing /SinaSpider). This spider has the advantages of simple authentication and fast accessing speed of the micro-blogging mobile version so that it can collect the data with the pre-set account and save the data into the Mongo database. However, the account cannot login if it is verified, so that we modified the login source code and used the cookies for login through the browser directly. In addition, the text filtering process was the same as Baidu TieBa information filtering.
We collected a total of 3,500,210 pieces of text by using the Sina micro-blog Spider and Baidu TieBa Spider from January 2015 to June 2016. These included about 2,500,000 pieces of text from Sina micro-blog and the other 1,000,000 pieces of text from Baidu TieBa. Then, we did the data preprocessing after the collection of data. First, we noticed that Micro-blog users produce a lot of interactive information in the interaction process, which have no emotion tendencies. Therefore, we utilized regular expressions to make the filtering rules, and filter the information. However, some of the text data that we collected still had little relationship to the environment although we used the keywords about environment to filter the texts. So we filtered the text content again by using the TextRank algorithm, which is a kind of graph based on a ranking algorithm and a way of deciding on the importance of a vertex within a graph by taking into account global information recursively computed from the entire graph, rather than relying only on local vertex-specific information [22].

3.2. Further Filtering and Classification of Data

In this section, we manually selected about 8329 texts from the high environment-related crawling data. We utilized the python package Jieba, which has a module function for keyword extraction based on TextRank algorithm, to help us determine if a text was related to environmental quality and the relevant calculation formula for this method is introduced in Section 3.3 of the paper. The module function in Jieba:
jieba.analyse.textrank (raw_text)
where the parameter raw_text is the text content needed to be extracted, and the output of the program is composed of the words which make up these text and their corresponding value which indicate the importance of each word to the environment. Each keyword and its corresponding value is stored in a word frequency table. For example, words such as “pollution”, “air”, and some other words which have a higher frequency, which means they repeatedly appeared, correspond to a larger value, while the words that are irrelevant to the environment correspond to a small value.
Further, we used the method to build a word frequency table which contains the words most associated with the environment and record their corresponding value. The following procedure was used for each new Chinese text for input: Firstly, Jieba completed Chinese word segmentation by splitting these texts into a series of words, and then from the word frequency table we set up before, we obtained the corresponding value for each word. Finally, we calculated the sum of all the values corresponding to each word, and we got the correlation data for the input text. As for the result, the high correlation value meant this text hd a greater degree of association with the environment, and conversely, it meant this text was irrelevant to the environment, as shown in Figure 3 and Figure 4.
After filtering the collected data, a total of 1,500,000 remaining texts with a high degree of correlation with the environment remained. In this paper, we classified these texts geographically according to Chinese provinces and months by the utilization of the geographical information and time information in the data. However, some provinces, such as “Tibet” and “Xinjiang”, did not have enough texts, so we do not take those provinces into account. Upon completing the work of geographic and temporal classification of the data, we obtained the geographic and period distribution of the data source, which is shown in Figure 5 and Figure 6.

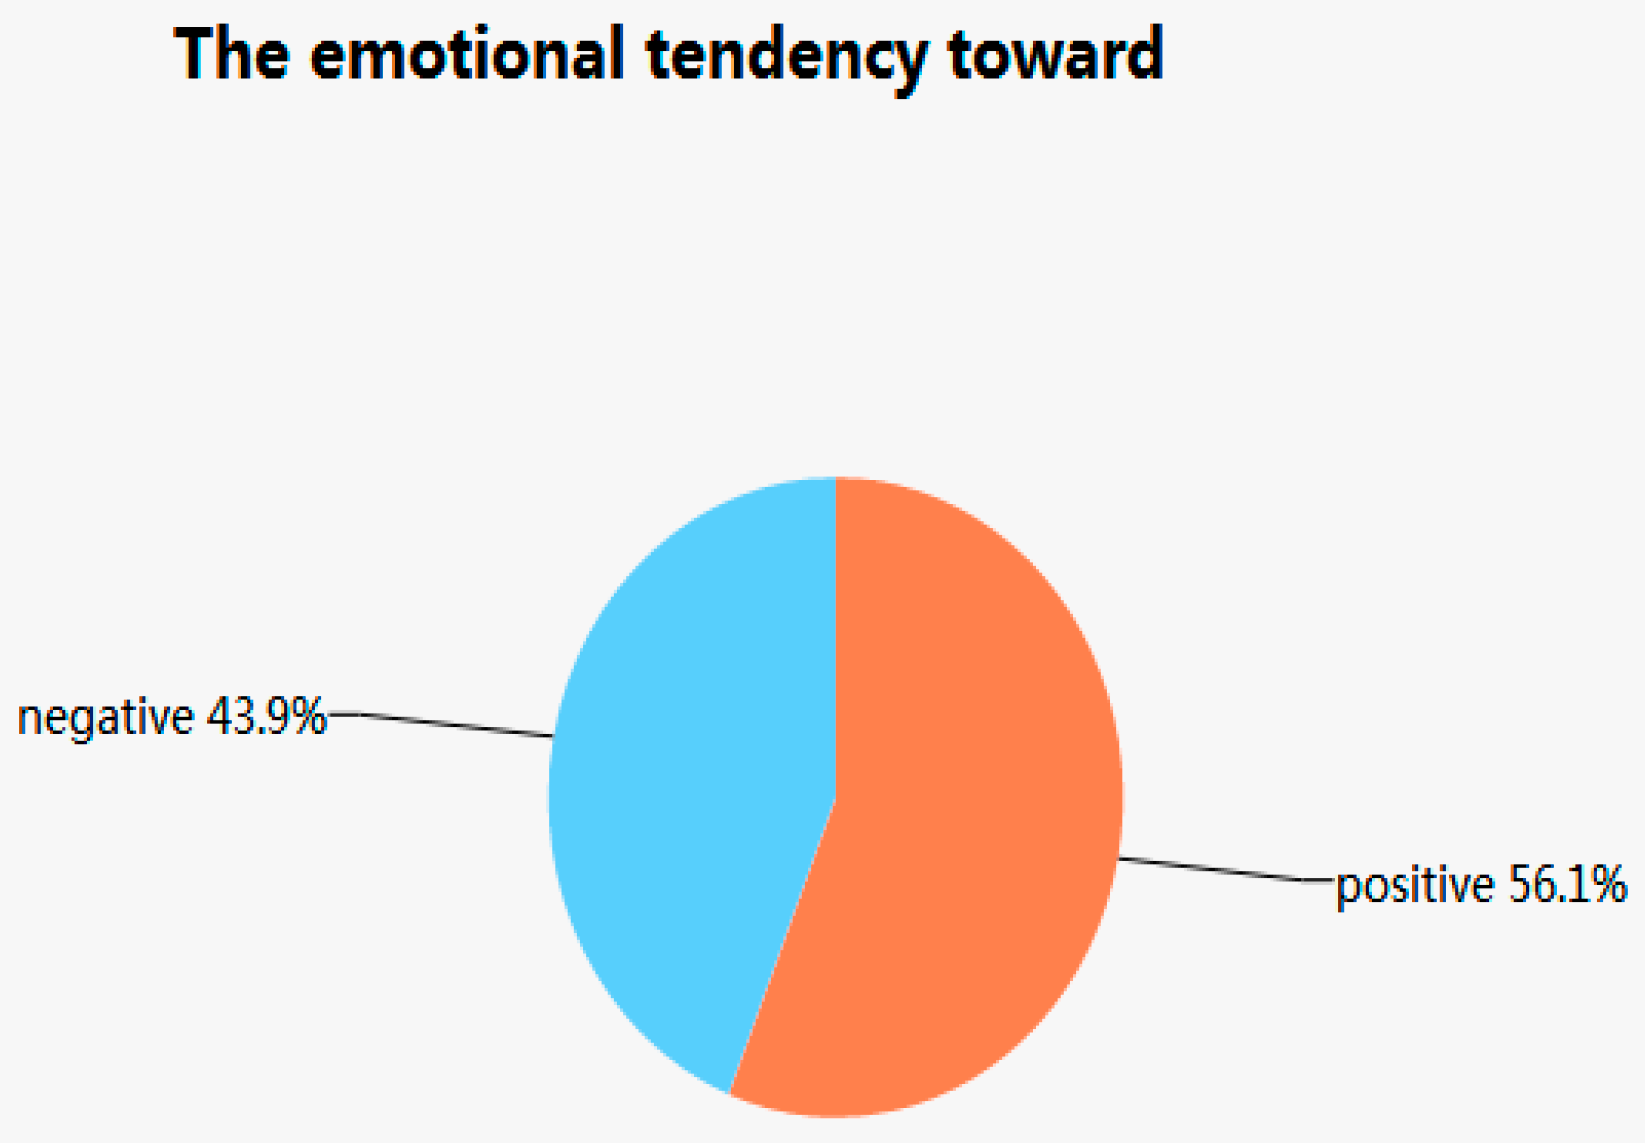
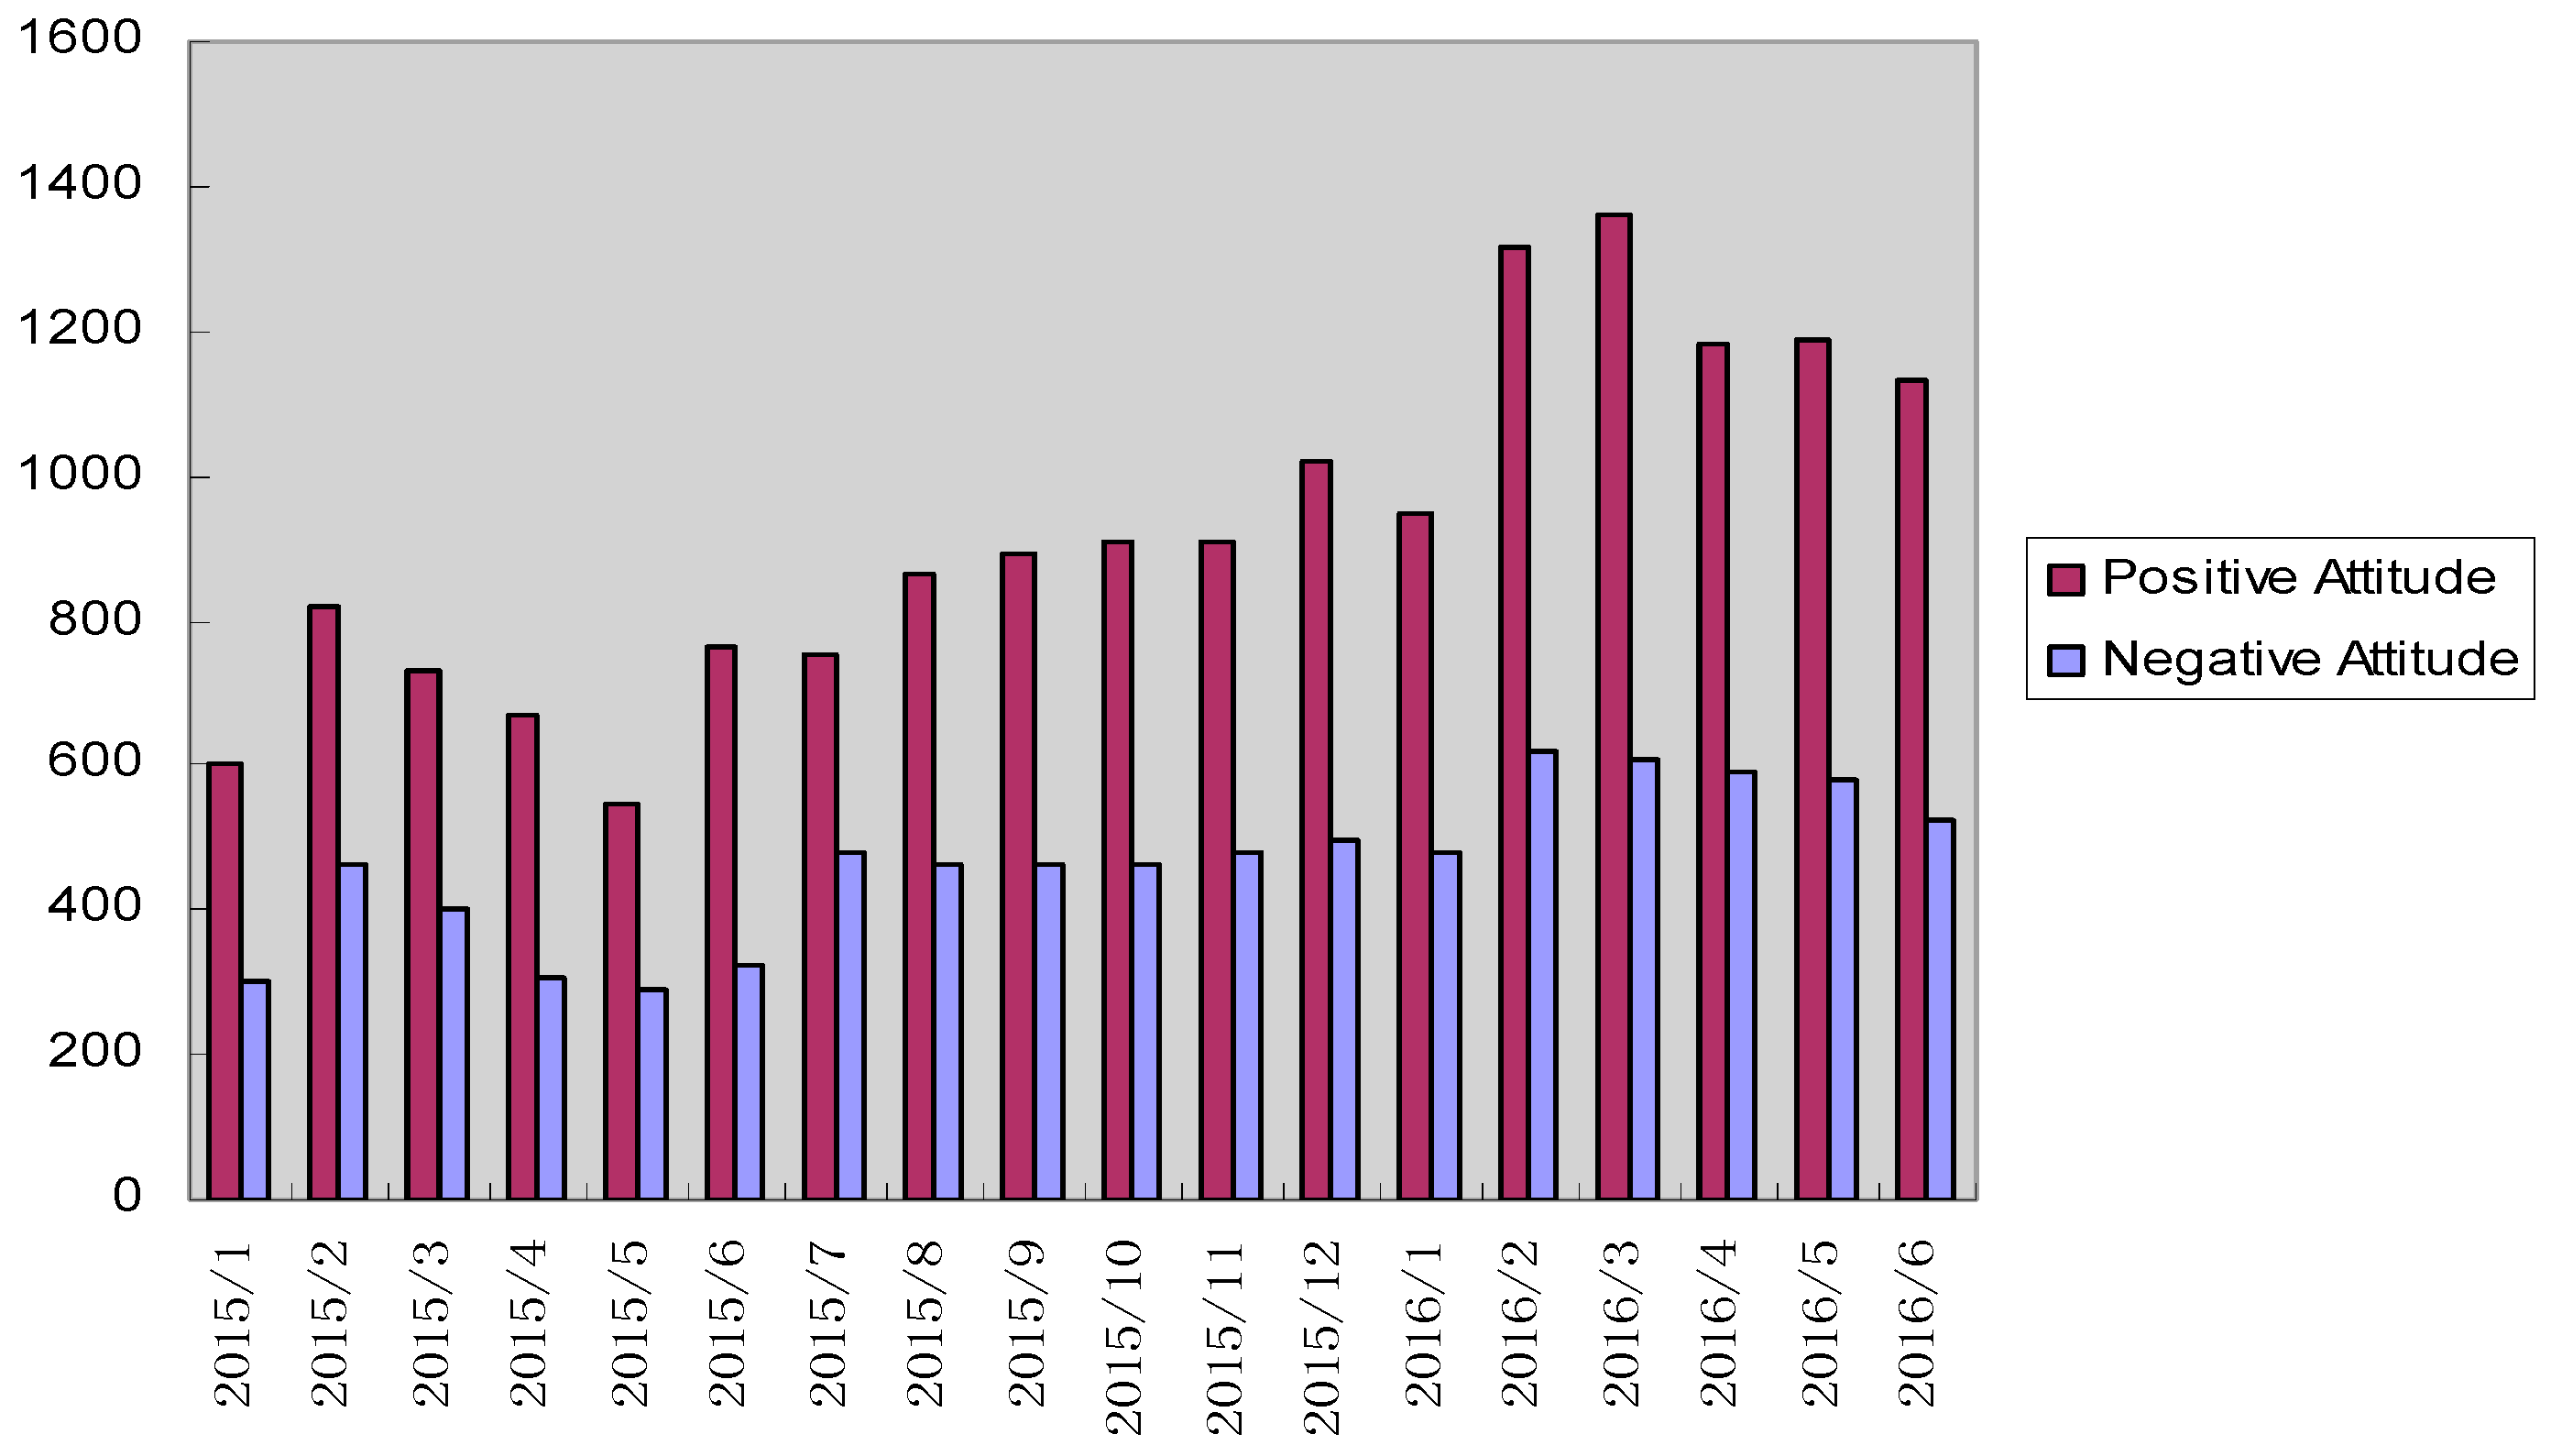
3.3. Using Support Vector Machine to Determine Emotional Attitudes toward Environment

Before we used the Support Vector Machine to determine emotional attitudes toward the environment, what we needed to do was feature classification, referring to the feature classification methods in a paper about the construction of ontological emotional vocabulary [23]. To determine feature vectors of the data, we divided the attitude characteristics into four aspects, which included view, emotion, evaluation, and degree. For each feature thesaurus, it was subdivided into positive and negative parts. For each piece of text data, we made the Chinese word segmentation by invoking the Jieba method in a python program to split the text and compare it with the thesaurus for four characteristics to check if it was a match. If there was a match between positive words then the corresponding characteristic value was plus 1, if a match existed in negative words, then the corresponding characteristic value wasvminus 1. Through the accumulated score of each feature, we obtained the final result of it, which was used as a measurement value for the character feature value in the passage below. In brief, after we got enough data from the Sina micro-blog and Baidu TieBa, we processed the raw data before we could use it as input for the SVM. The four aspects above are four features for these data and we accumulated the score of each feature and marked the label for each text to create the training set. Since the purpose of this paper was to determine emotional attitudes toward the local environment for a Chinese text, we simply divided emotional attitude tendency into positive and negative, represented by 1 and −1.
We selected 7500 pieces of text data randomly, 5000 from Sina micro-blog and 2500 from the Baidu Tieba, to construct the training set. For each piece of data, we marked its emotional attitude tendency artificially according to the previously mentioned category. We utilized the python procedures to obtain the text feature value mentioned above and to construct a corresponding CSV (Comma-Separated Values) format file for the whole training set. Data format is shown in Table 2, the value for column classification represents the emotional attitude tendency and characteristic values for view, emotion, evaluation, and degree are the feature extraction results for each text content.
After the data pretreatment, which was one of the most important steps, we started our key step: training the support vector machine model. We first wrote a class in python to realize the SMO algorithm [18,24]. We used the LoadTestData method in the python package to obtain the data matrix and run the SMOP method to get the hyper plane:
SMOP (dataMatIn, classLabels, C, toler, maxIter, kTup)
In this function, we needed six parameters: dataMatIn is the input data matrix, classLabels is the classifications which the corresponding input data belong to, C is a constant which you can set yourself to decrease error rate, toler is the fault tolerant rate which you can set to what you want, maxIter is the iteration number for the whole loop, and kTup is the kind of kernel function you use to process the input data.
The SMOP method includes two main steps: the constructor of OptStruct and the innerL method:
OptStruct (mat (dataMatIn), mat (classLabels).transpose (), C, toler, kTup)
innerL (i, oS)
The function above is used to construct a special struct to store the processed data matrix, classLabel matrix, the parameter C, toler, and the kind of kernel function kTup. The kTup can be set as “rbf” which stands for Gaussian kernel function and “lk” which stands for Laplacian kernel function. The innerL is used to change the value of key parameter we need. After we fixed all the parameters, we called the function calcWs to calculate the hyper plane:
calcWs (alphas, dataArr, classLabels)
In this function, the input parameters are output in last step. Then, we checked the accuracy by using the judgeData function:
judgeData (w, data, classLabel, b)
The w is from calcWs, and other parameters are prepared.
After we constructed the support vector machine model, we verified the accuracy of the model by selecting 5000 pieces of text data randomly as the test set. Also, we gave each piece of data an emotional tendency value manually in advance to compare with the classification result produced by the support vector machine algorithm. After the comparison and calculation, the accuracy for SVM was 85.67%.
We input all the data set as a whole to make emotional classification. The classification process was predicted according to the characteristics of the input data set, using the following method:
Predict (w, data, b)
In this function, the input parameter was the same as the judgeData function, but the data was from the prediction set which had no class labels. The prediction set can be divide into two parts. One part represents a good emotion toward the environment and the other part represents a bad emotion to the environment.
Classifications generated by the resulting data were stored in the array, merging the input data and output results to get a clear classification on social media text data and emotional tendency results towards environment, which is shown Table 3.
Further, we made an emotional tendency classification for the whole data source, the statistical result is shown in Figure 7, from which we found that 43.9% of the texts expressed negative attitudes towards the local environment and 56.1% expressed a positive emotional tendency. Also, we made a more detailed statistical analysis for Hubei Province from January 2015 to June 2016 shown in Figure 8; there are 80,100 pieces of text and the majority of texts also express a negative sentiment towards the environment.

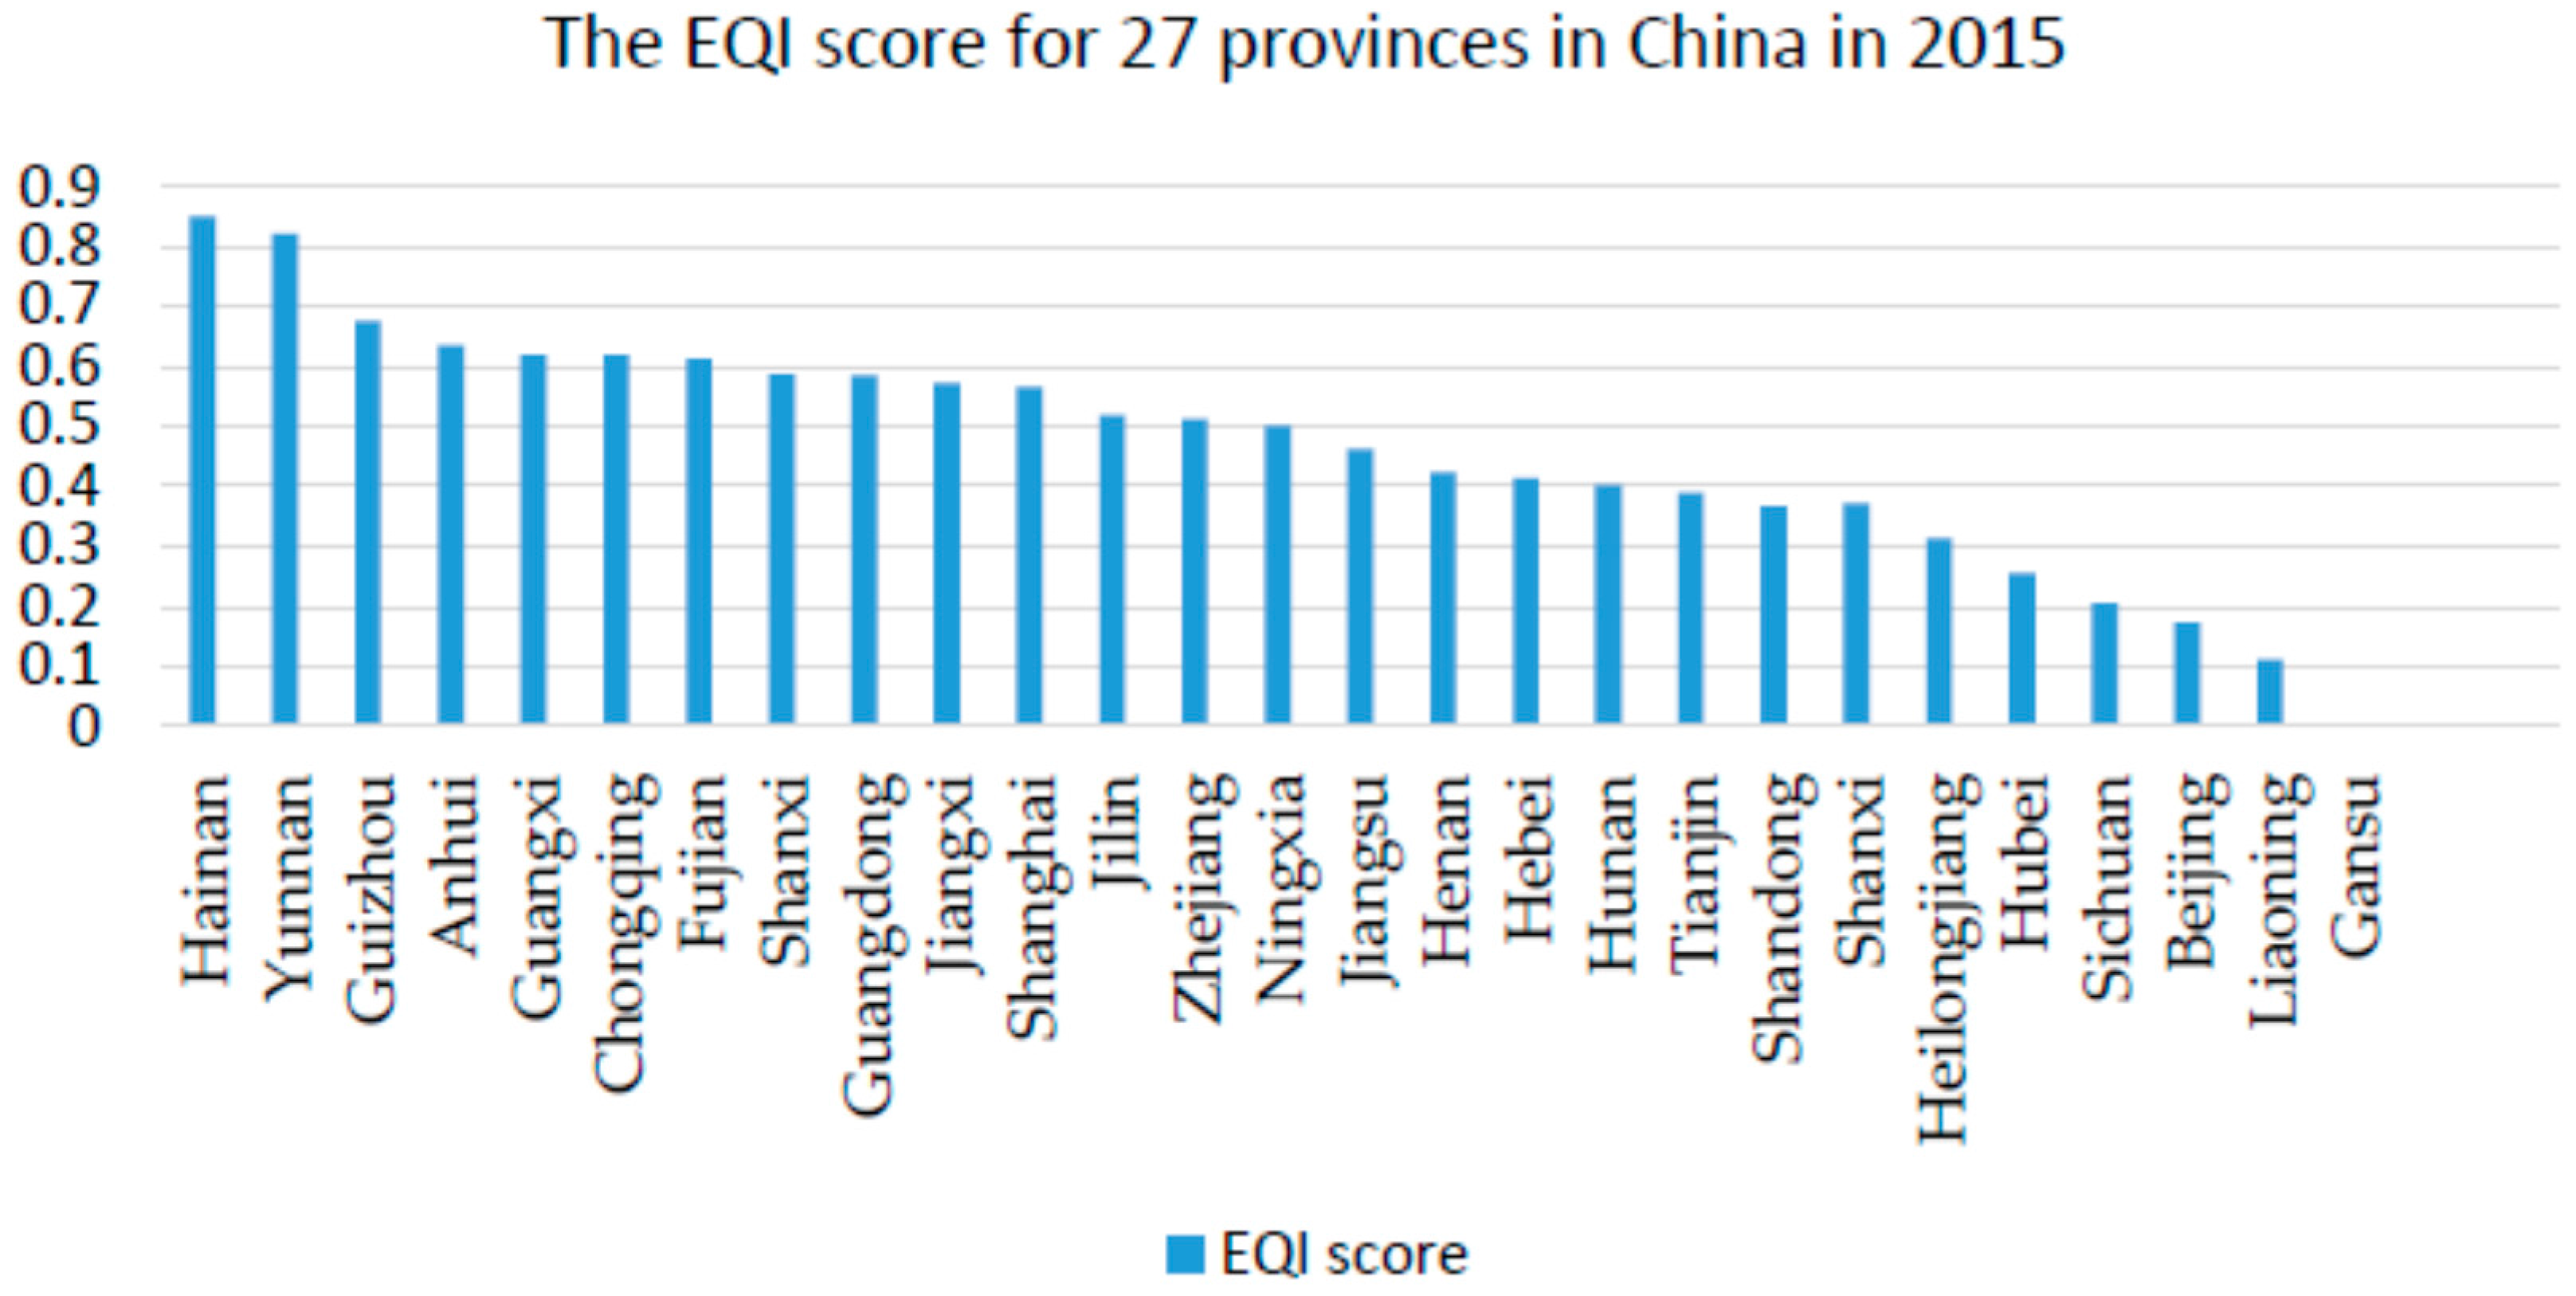
3.4. Calculating the EQI Score

By using the support vector machine (SVM), we manually created a representative environmental indicator of environmental quality in that area, which we call the Environmental Quality Index. This index has the ability to monitor and forecast the environmental quality in a specific region at a specific period. Also, it can be used to compare environmental quality for different Chinese regions. We calculated the EQI for three large regions in China from January 2015 to June 2016 according to the formula defined in Section 2.5, and as the Figure 9 proved, the environmental quality was best in summer and deteriorated with the approach of winter. In Table 4 and Figure 10, we compared the environmental quality for 28 provinces in China in 2015 using the EQI score. The EQI score s is defined as:
s = 1 F ( t ) / max { F ( t ) , t C }
where F ( t ) is the EQI for a specific province defined in Section 2.5 and C is the whole province set for 27 Chinese provinces. The lager EQI score represents a better performance in comprehensive environmental quality, which ranges from 0 to 1. The result we got for the rank of environmental quality evaluation is veryclose to the “China livable city report” published by the Chinese Academy of Sciences (CAS) in 2015. However, we regret that this report contained only a small number of cities in China.

4. Conclusions

This paper proposed a new method to evaluate a region’s environmental quality by using Chinese social media. We made a sentiment analysis and classification by utilizing the support vector machine algorithm, which had an accuracy rate of 85.67%. We self-defined a term called Environmental Quality Index (EQI) and constructed an environment evaluation model to monitor and forecast a local area’s environmental quality successfully. The result of environmental quality comparison between different provinces in China is also very close to the air pollution ranking information which is published by the Ministry of Environmental Protection (MEP) of the People’s Republic of China. We think that our method can also be used in other related fields to process Chinese social media data for Chinese big data analysis.
The alternative we used is innovative and feasible compared to the traditional environment monitoring methods that use expensive and complex instruments. The useful and available text data related to the environment and stored in the large repository of social networks will grow as more and more people post their comments and feelings about water, food quality, and air pollution in a local environment on social media in the future; this will make our method and evaluation model more accurate and reliable.
For the sustainable development of the environment in the future, we need to take into consideration social media data from more sources, not only from Sina micro-blog and Baidu TieBa, and expand the amount of text data for more time spans. Also, we can further study and analyze some of the change phenomenon and laws for EQI we obtained, such as why the EQI for different provinces in China reached its highest point in March, and try to understand the pattern of human activities in social media which may help in predicting the EQI.

Acknowledgments

This research is supported in part by the National Nature Science Foundation of China No. 61440054, Nature Science Foundation of Hubei, China No. 2014CFA048, and Fundamental Research Funds for the Central Universities of China No. 216274213. Outstanding Academic Talents Startup Funds of Wuhan University, No. 216-410100003. Youth Funds of Science and Technology in Jiangxi Province Department of Education (No. GJJ150572). National Natural Science Foundation of China (No. 61462004). Natural Science Foundation of Jiangxi Province (No. 20151BAB207042).

Author Contributions

Zhibo Wang and Xiaohui Cui conceived and designed the experiments; Lei Ke performed the experiments; Qi Yin and Longfei Liao analyzed the data; Lu Gao and Zhenyu Wang contributed materials and analysis tools; Lei Ke and Zhibo Wang wrote the paper together.

Conflicts of Interest

The authors declare no conflict of interest.

References

  1. Cui, X.; Yang, N.; Wang, Z.; Hu, C.; Zhu, W.; Li, H.; Ji, Y.; Liu, C. Chinese social media analysis for disease surveillance. Pers. Ubiquitous Comput. 2015, 19, 1125–1132. [Google Scholar] [CrossRef]
  2. Wang, Z.; Cui, X.; Gao, L.; Yin, Q.; Ke, L.; Zhang, S. A hybrid model of sentimental entity recognition on mobile social media. EURASIP J. Wirel. Commun. Netw. 2016. [Google Scholar] [CrossRef]
  3. The Growing Impact of Social Media. Available online: http://www.sociallyawareblog.com/2012/11/21/time-americans-spendper-month-on-social-media-sites/ (accessed on 22 December 2016).
  4. Honicky, R.J.; Brewer, E.A.; Paulos, E.; White, R.M. N-Smarts: Networked Suite of Mobile Atmospheric Real-Time Sensors. In Proceedings of the Second ACM SIGCOMM Workshop on Networked Systems for Developing Regions, Seattle, WA, USA, 17–22 August 2008.
  5. Aoki, P.M.; Honicky, R.J.; Mainwaring, A.; Myers, C.; Paulos, E.; Subramanian, S.; Woodruff, A. A Vehicle for Research: Using Street Sweepers to Explore the Landscape of Environmental Community Action. In Proceedings of the SIGCHI Conference on Human Factors in Computing Systems, Boston, MA, USA, 4–9 April 2009.
  6. Xu, J.M.; Bhargava, A.; Nowak, R.; Zhu, X. Socioscope: Spatio-Temporal Signal Recovery from Social Media. In Proceedings of the Joint European Conference on Machine Learning and Knowledge Discovery in Databases, Bristol, UK, 24–28 September 2012.
  7. Zheng, Y.; Liu, F.; Hsieh, H.P. U-Air: When Urban Air Quality Inference Meets Big Data. In Proceedings of the 19th ACM SIGKDD International Conference on Knowledge Discovery and Data Mining, Chicago, IL, USA, 11–14 August 2013.
  8. Chen, J.; Chen, H.; Zheng, G.; Pan, J.Z.; Wu, H.; Zhang, N. Big Smog Meets Web Science: Smog Disaster Analysis Based on Social Media and Device Data on the Web. In Proceedings of the 23rd International Conference on World Wide Web, Seoul, Korea, 7–11 April 2014.
  9. Mei, S.; Li, H.; Fan, J.; Zhu, X.; Dyer, C.R. Inferring Air Pollution by Sniffing Social Media. In Proceedings of the 2014 IEEE/ACM International Conference on Advances in Social Networks Analysis and Mining (ASONAM), Beijing, China, 17–20 August 2014.
  10. Kay, S.; Zhao, B.; Sui, D. Can social media clear the air? A case study of the air pollution problem in Chinese cities. Prof. Geogr. 2015, 67, 351–363. [Google Scholar] [CrossRef]
  11. Sammarco, M.; Tse, R.; Pau, G.; Marfia, G. Using geosocial search for urban air pollution monitoring. Pervasive Mob. Comput. 2016. [Google Scholar] [CrossRef]
  12. Tse, R.; Xiao, Y.; Pau, G.; Fdida, S.; Roccetti, M.; Marfia, G. Sensing pollution on online social networks: A transportation perspective. Mob. Netw. Appl. 2016, 21, 688–707. [Google Scholar] [CrossRef]
  13. Xu, L.; Lin, H.; Pan, Y.; Ren, H.; Chen, J. Constructing the affective lexicon ontology. J. China Soc. Sci. Tech. Inf. 2008, 2, 6. [Google Scholar]
  14. Cortes, C.; Vapnik, V. Support-vector networks. Mach. Learn. 1995, 20, 273–297. [Google Scholar] [CrossRef]
  15. Burges, C.J.C. A tutorial on support vector machines for pattern recognition. Data Min. Knowl. Discov. 1998, 2, 121–167. [Google Scholar] [CrossRef]
  16. Platt, J.C. Fast training of support vector machines using sequential minimal optimization. In Advances in Kernel Methods; MIT Press: Cambridge, MA, USA, 1999; pp. 185–208. [Google Scholar]
  17. Schuldt, C.; Laptev, I.; Caputo, B. Recognizing Human Actions: A Local SVM Approach. In Proceedings of the 17th International Conference on Pattern Recognition, ICPR 2004, Cambridge, UK, 23–26 August 2004.
  18. Rakotomamonjy, A. Variable selection using SVM-based criteria. J. Mach. Learn. Res. 2003, 3, 1357–1370. [Google Scholar]
  19. Duan, K.; Keerthi, S.S.; Poo, A.N. Evaluation of simple performance measures for tuning SVM hyperparameters. Neurocomputing 2003, 51, 41–59. [Google Scholar] [CrossRef]
  20. Platt, J. Sequential Minimal Optimization: A Fast Algorithm for Training Support Vector Machines. Available online: https://www.microsoft.com/en-us/research/publication/sequential-minimal-optimization-a-fast-algorithm-for-training-support-vector-machines/ (accessed on 22 December 2016).
  21. Forney, G.D. The Viterbi Algorithm. Available online: http://www.systems.caltech.edu/EE/Courses/EE127/EE127A/handout/ForneyViterbi.pdf (accessed on 22 December 2016).
  22. Mihalcea, R.; Tarau, P. TextRank: Bringing Order into Texts. In Proceedings of the 42nd Annual Meeting of the Association for Computational Linguistics, Bacelona, Spain, 21–26 July 2004.
  23. Xu, L.; Lin, H.; Pan, Y. Construction of ontology emotional vocabulary. J. China Soc. Sci. Tech. Inf. 2008, 27, 180–185. [Google Scholar]
  24. Joachims, T. Making large scale SVM learning practical. In Advances in Kernel Methods; MIT Press: Cambridge, MA, USA, 1999. [Google Scholar]
Figure 1. Time spent on online (per week) by Chinese internet users.
Sustainability 09 00085 g001
Figure 2. Experiment flowchart.
Sustainability 09 00085 g002
Figure 3. Text data related to the environment corresponding to a high relation value.
Sustainability 09 00085 g003
Figure 4. Text data related to the environment corresponding to a low relation value.
Sustainability 09 00085 g004
Figure 5. The geographical distribution of data sources.
Sustainability 09 00085 g005
Figure 6. The month distribution of data sources.
Sustainability 09 00085 g006
Figure 7. The emotional tendency distribution.
Sustainability 09 00085 g007
Figure 8. Sentiment distribution for text data in Hubei province.
Sustainability 09 00085 g008
Figure 9. The Environmental Quality Index (EQI) change for three large provinces in China.
Sustainability 09 00085 g009
Figure 10. The EQI score for 27 provinces in China in 2015.
Sustainability 09 00085 g010
Table 1. The appearance rate for the two thesauruses under CHI prescribing and TFIDF.
AlgorithmAppearance Rate (%)
CHI PrescribingTFIDF
geographical thesaurus90.01%94.81%
emotional thesaurus92.63%96.13%
CHI: Chi-square; TFIDF: Term Frequency Inverse Document Frequency.
Table 2. Text sentiment feature value in CSV format file.
ClassificationViewEmotionEvaluationDegree
−148−410
−136−420
154010
078260
−190−644
Table 3. Emotional tendency classification for some text content.
Text Serial NumberCorresponding Feature Set (View, Emotion, Evaluation, Degree)Output ResultsEmotional Tendency
1(15, 4, 1, 2)1Positive
2(33, −4, −1, 0)−1Negative
3(45, −3, −3, 0)−1Negative
4(21, 2, 3, 1)1Positive
Table 4. The rank of environmental quality evaluation results for 27 provinces in China in 2015.
RankProvinceScoreRankProvinceScoreRankProvinceScore
1Hainan0.850110Jiangxi0.572321Tianjin0.3894
2Yunnan0.820911Shanghai0.565022Shandong0.3671
3Guizhou0.675312Jilin0.519221Shanxi0.3721
4Anhui0.635513Zhejiang0.511822Heilongjiang0.3142
5Guangxi0.620114Ningxia0.501423Hubei0.2561
6Chongqing0.619115Jiangsu0.462524Sichuan0.2054
7Fujian0.612116Henan0.424125Beijing0.1732
8Shanxi0.586417Hebei0.413826Liaoning0.1121
9Guangdong0.585218Hunan0.403127Gansu0

