Article

High Biodiversity of Green Infrastructure Does Not Contribute to Recreational Ecosystem Services

by
Daria Sikorska
1,*,
Piotr Sikorski
2 and
Richard James Hopkins
3
1
Faculty of Civil and Environmental Engineering, Warsaw University of Life Sciences—SGGW, 02-776 Warsaw, Poland
2
Faculty of Horticulture, Biotechnology and Landscape Architecture, Department of Environment Protection, Warsaw University of Life Sciences—SGGW, 02-787 Warsaw, Poland
3
Natural Resources Institute—University of Greenwich, Chatham Maritime ME4 4TB, UK
*
Author to whom correspondence should be addressed.
Sustainability 2017, 9(3), 334; https://doi.org/10.3390/su9030334
Submission received: 31 December 2016 / Revised: 17 February 2017 / Accepted: 20 February 2017 / Published: 24 February 2017
(This article belongs to the Special Issue Maintaining Ecosystem Services to Support Urban Needs)

Abstract

:
Urban lakes, especially those of natural origin, provide ecosystem services, recreation being one of the most important and highly valued by city dwellers. Fulfilling the needs of city residents to relax and have contact with nature has become a priority in urbanized areas and has been proven to positively affect people’s health and well-being. The recreational potential of water bodies was identified to be the most important aspect of ecosystem services to the residents of the neighboring areas. An assessment of recreational ecosystem services (RES) provisioning to society based on the real time spent by the citizens and housing values in the urban–rural gradient revealed that the economic benefits of lakes differ in urbanized, suburban and rural landscapes. The growth of cities has led to an increased population density in the surroundings of ecologically valuable areas, resulting in higher pressure from visitors seeking recreational areas. Along with urbanization, the impoverishment of ecosystem functions takes place, limiting their capability to provide ecosystem services. In this work, the provisioning of recreational ecosystem services of 28 floodplain lakes located along the urban–rural gradient of the Warsaw agglomeration was assessed. The relationship between the ecological value of the water bodies, measured using naturalness indices, and the recreational ecosystem services they can provide was assessed. The results showed that the floodplain lakes located along the urban–rural gradient are of great importance to the citizens due to their recreational potential. The provisioning of recreational ecosystem services is poorly connected with the ecological characteristics of the floodplain lakes. Only hemeroby was significantly correlated with provisioning, and there was no relationship with factors such as naturalness of vegetation or water quality, demonstrating that public preference was not generally influenced by high ecological quality. These data should be available to potential buyers and be integrated in spatial planning management plans in order to shape future housing policy.

1. Introduction

Parallel to the increasing population of cities worldwide and anxiety due to the life quality of residents, a general interest in potential and real benefits derived from the city’s green infrastructure has arisen [1,2,3,4,5,6,7,8,9]. These benefits are classified as ecosystem services (ES) [10], the most important in urban areas being the cultural ES which are essential for the well-being and health of the citizens [11,12,13,14,15,16], while at the same time being commonly underestimated due to difficulties in quantification [17]. Potential benefits from green infrastructure and the possibility of outdoor recreational activities are limited in many cities due to the low occurrence of good quality green space [18,19] and variations in people′s preferences [20]. Studies on recreational ecosystem services (RES) have focused on recognizing components of habitats that people want to experience [21] or habitat components that could be enhanced to improve recreation [9,22,23]. In this paper, we focus on RES associated with urban lakes and their neighborhood. Urban lakes can be part of the formal parks of a city, but are also areas commonly excluded from the spatial management plans of the city and referred to as informal greenspaces [24,25].
In contrast to other ecosystem services, it is important that green infrastructure can provide RES which are experienced by the users directly. The degradation of ecosystems which are part of the green infrastructure will lead to a real loss of the benefits people can derive, including the possibility of recreational activities [17,26,27]. The benefits from green infrastructure are revealed, for example, in the dependence of property values on the distance from green infrastructure [28,29,30,31]. Some results even indicate that the RES provided by components of the green infrastructure in cities can exceed those derived from most natural biotopes due to the direct and frequent use of these services by people, which equates to a higher demand [32].
Whilst management plans for green areas are unquestionably of benefit, and such plans are widely used for instance in the Netherlands [33], they are unfortunately absent in Warsaw, and indeed in much of Poland. Implementing an ecosystem services framework within such documents has become an increasingly popular tool used in the context of the sustainable management of natural resources, as a support for both ecosystem quality and human well-being, thus generating a comprehensive information base for policy makers in their decision-making processes [34].

1.1. Does High Biodiversity Enhance Provisioning of Cultural Ecosystem Services?

It is generally accepted that high biodiversity increases the value of urban ecosystems and their neighboring areas [17], but this relationship is poorly investigated. The human perception of biodiversity is influenced by numerous variables such as age, sex or professional experience [35,36,37], attitude towards nature conservation or appreciation of rural landscapes [38,39,40,41], and general knowledge about the immediately surrounding nature [42]. City dwellers declare a desire for direct contact with nature, but at the same time seek areas which are easily accessible [42,43,44]. The objects of the demand by residents, however, include areas of various types, such as semi-natural areas, but even ecosystems associated with typical rural landscapes which provide peace and a sense of wilderness [17], but are not necessarily of a high absolute ecological value. Results indicating that the level of a particular biotope’s naturalness induces the value of RES provided by these systems are hard to find. Based on Qiu et al. [42], one could conclude that the correlation between user preferences and biodiversity will not always be positive.

1.2. Actual and Potential Benefits from Green Infrastructure

Most RES assessments are based on estimating the flow of various benefits: ecological benefits, human health and well-being benefits, social and cultural benefits and marketed economic benefits [21,32,45,46]. It is, however, assumed that the usage of resources by people is spatially evenly distributed [45]. Generalization at the regional scale might allow an assessment to reflect the real usage well, whilst at the scale of the city, where the population density varies [47], the assessment can be strongly biased and the RES will be unevenly distributed in space. Property values increase along the urban–rural gradient (the closer to the city centre, the more expensive) [48,49,50,51,52,53], and a similar pattern should be revealed as property nears RES provisioning of cities’ green infrastructure. While the benefits derived from potential ES resources of green infrastructure—such as CO2 and noise reduction—or a positive influence on microclimate affect all the citizens in the neighbourhood, benefits associated with recreation or choice of an aesthetic neighbourhood to live in are subject to the general laws of demand and supply. When valuing those benefits it is crucial to differentiate between potential and real values. Benefits derived from green infrastructure of the same potential, but located in different areas, can have different real value.
The aim of this study was to answer the following research questions: (1) How do the benefits derived from urban lakes, as reflected in property values and real time spent in green areas, vary along the urban—rural gradient within the city? (2) Are the RES from urban lakes related to their biodiversity?

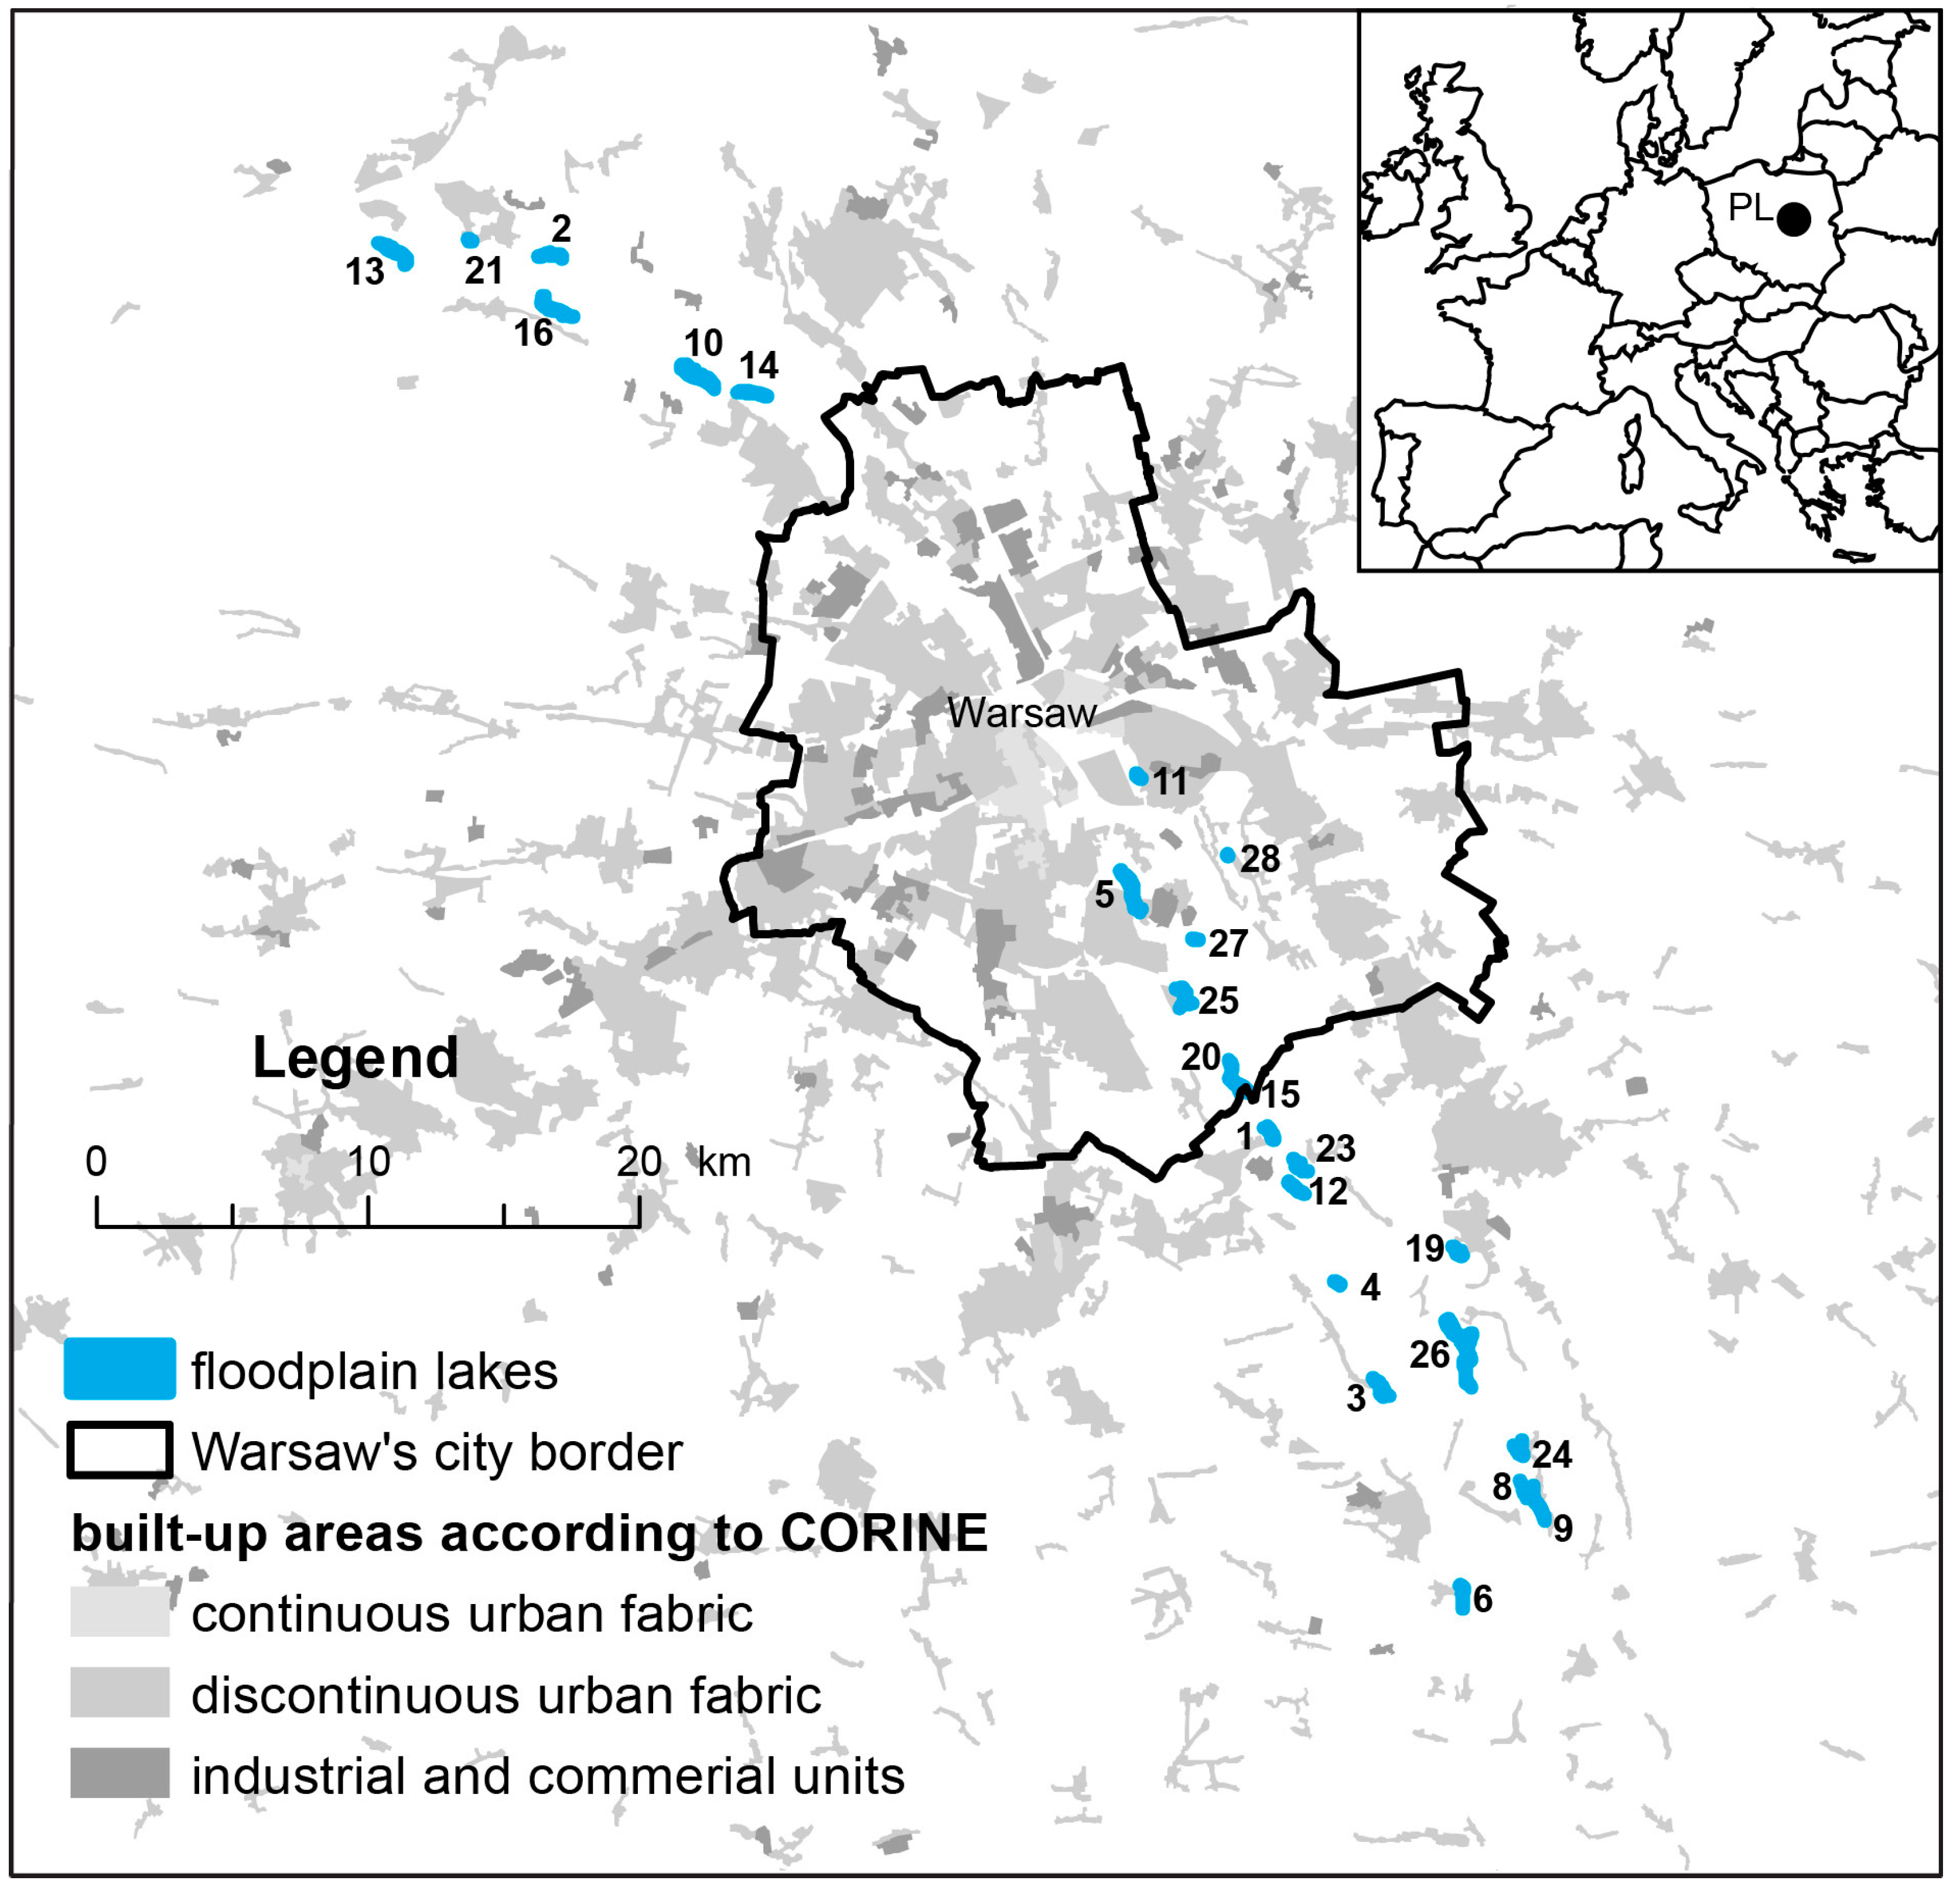
2. Materials and Methods

Urban lakes are a component of the city’s green infrastructure, which are highly valued by the citizens for the recreational opportunities they provide [54]. Due to their spatial distinctiveness from the surroundings, they represent a good object of study. In total, 28 urban lakes were selected for this study. We chose a homogenous group of lakes in Warsaw, Poland. All the objects selected are floodplain lakes originating from the former Vistula riverbed. The Vistula in Warsaw was formerly a braided river, but after regulation and construction of embankments during the 19th and 20th centuries, the channels were cut off from the main river, forming elongated floodplain lakes permanently separated from the Vistula River and subjected to strong urbanization pressure from the expansion of Warsaw [55]. The selected lakes are located along an urban—rural gradient up to 30 km from the city centre and are important elements of the green infrastructure of Warsaw (Figure 1). All lakes are open to the public and have an important recreational function, although most lack permanent recreational infrastructure. The floodplain lakes studied are characterized by a high level of naturalness and act as refuges for rare plant taxa, such as Salvinia natans, Wolffia arrhiza, Nymphaea alba [56]. The habitats are subjected to a range of urbanization pressure, being surrounded by various land-use types such as built-up areas or different population densities in the neighborhood (Figure 1). The vegetation of the lake shores is well developed, the banks are natural, with slopes <30°.
The benefits from urban lakes and their neighborhood, which are provided to city residents, were assessed on the basis of (1) housing value and (2) real time spent at the lakes by the inhabitants, which are commonly used and easy-to-apply indicators to estimate the value of nature associated with settlements [31].
Housing value—mean property transaction prices of housing in the primary and secondary market in Warsaw. Price of housing per m2 was calculated according to http://www.mapa.um.warszawa.pl/ (synthetic map information about property values in the area in 2015 according to the city’s registry). If no data were available, we calculated medium market price in the area in 2015 using the portal https://rynekpierwotny.pl (commercial website containing current advertisements on the primary market properties).
Real time spent in nature—average people/day and hours spent/day per lake. The number of visitors to the lakes per day was recorded at all entrances of the examined area by researchers recording over three days in total during 2014 and 2015, for one day of the weekend and two days of weekdays per lake in July and September, selected to be representative of high and low visitation days during the vegetative season [57]. Total time spent by the visitors during three days was averaged per day. The number of visitors during two combined weekdays is approximately 1/3 of the number of visitors during the weekend, which is supported by our observations taken in other areas, such as the Vistula River Valley. The person recording was moving through a series of waypoints, using a GPS, and was counting the number of visitors inside the 50 m buffer zone and recording the time spent by visitors with a hidden stopwatch. The routes of probable trespassing places, resting places and potential observation points were selected. People using public roads or bridges were excluded from the count.
The characteristics of the neighborhood which might benefit local residents were assessed based on a spatial analyses. To perform the spatial analysis, a 500 m buffer zone from the shore of each lake was used for a detailed vector land-cover map on the basis of orthophotomaps, aerial images and verification in the field. Units distinguished included: built-up areas, other impermeable surfaces, agriculture, orchards, meadows and pastures, abandoned unmanaged areas, managed urban green areas, rushes, forests and woodlands. The urbanization gradient was expressed as a distance from the centre of the lake to the city centre [58].
The ecological value assessment of the lakes and their surroundings was based on a detailed vegetation survey in 2014 and 2015 and water quality sampling. All plant species and their abundance were recorded in representative transects in each of the lakes, in 2 × 2 m sample plots, separately in each vegetation zone—aquatic vegetation, rushes, and shore terrestrial vegetation (Figure 2). The number of transects depended on the size of the lake, and was approximately every 100 m, but in the case of more diverse vegetation, was performed more frequently. In total, 321 sample vegetation plots were collected. In summer 2014, water samples were collected from the centre of each lake (0.5 m deep and 0.5 m above the bottom) for quality assessment. In the case of ditches connected to the lakes, additional samples were taken at the inflow and data was averaged. Eutrophication state was assessed on the basis of dissolved nutrients concentration. Dissolved nitrogen compounds: nitrite, nitrate and ammonium concentration in water samples was measured by ICS-1000 DIONEX Co ion chromatograph (Dionex Ltd., Camberley, UK) after samples filtering using PTFE filters (0.45 mikrone). Phosphate concentration was determined spectrophotometrically with ammonium molybdate blue method, according to norm PN-EN ISO 6878. Samples were filtered using cellulose mixed-esters filters (0.45 mikrone). Chemical analyses were performed in the Laboratory—Water Centre of Warsaw University of Life Sciences.
Analyses of the urban lakes biodiversity included indices calculated separately for each lake. The ecological value of the lakes was expressed as the number of plant species taxa, Shannon–Wiener index of plant species [59], the degree of naturalness was expressed by using hemeroby index share of plant species associated with humans [60], and data was averaged from all transects for each lake. The relationships between RES expressed as property values and real time spend and ecological parameters concerning the lakes quality were calculated as Spearman’s correlations at p < 0.05 using STATISTICA 10.0 for Windows software (StatSoft Inc., Tulsa, OK, USA).

3. Results

The investigated urban lakes along with their neighborhood occupy in total 180.7 ha (Table 1) and are an important component of the green infrastructure of Warsaw where, on average, 837 people spend their leisure time daily (average value for the days measured at all 28 lakes), devoting in total 126.5 h/day (Table 1) (total time combined for all the lakes monitored). Taking into account how scattered the lake areas are, they nevertheless play a role as important as formal green areas of similar size. The mean value of analyzed property prices in the neighborhood of the lakes was €2485 per m2 (Table 1), a value similar to the average price of property outside the defined city centre (www.mapa.um.warszawa.pl/m). Distance to the city centre and, at the same time, better access to workplaces and socio-cultural infrastructure, is revealed in the property prices of the neighbourhood of the lakes increasing significantly when approaching the city centre. However, at the same time, despite much higher population density in the city centre, the total time spent by the citizens in these areas increases when moving away from the centre (Table 2).
No correlation between biodiversity (based on number of plant species in the aquatic zone, rushes, at the shores, hemeroby or Shannon–Wiener diversity index) and the property values in the neighborhood nor the duration of real time spent by the citizens at the urban lakes was found (Table 2). Only the terrestrial zone of the shores, adjacent to existing informal walking trails (which was most easily accessed by the visitors), was related to a high hemeroby index. The higher the naturalness of this zone, the higher the property values and longer time spent by the users at the shores of the lake. In general, no relationship was found between the water quality parameters and property values, nor leisure time duration. Only the hypertrophic water bodies, characterized by high NO3 load, were subjected to lower pressure from the visitors.

4. Discussion

The results of this study indicate that the general value and quality of the ecosystems examined do not correspond to the visiting frequencies or duration of the public. However, some clear relationships were found showing that the value of properties are in general higher in the close vicinity of the floodplain lakes considered in the analysis. Well-selected representative sampling areas can supply examples of a positive relationship between the biodiversity of urban green spaces and the preferences of individuals visiting them [61,62]. In reality, the users do not necessarily prefer places characterized by unique biological diversity. They do recognize the most common types of ecosystems, which can indirectly indicate biodiversity, but in many cases this recognition depends strongly on the general education level and knowledge about nature of the individual [42,63,64]. For the homogenous habitats, the measured ecological indices reflecting diversity of these ecosystems and the landscape associated with them were not at all correlated to the benefits perceived by the public. Thus, basing the management and maintenance of city green infrastructure on social judgment and preferences may be misguided. Moreover, this research on urban lakes indicated that if the habitats are less accessible the users will base their judgments on the accessible zone only. The naturalness of these urban lakes is not perceived in terms of the number of species or vegetation diversity, but as a share of plant species associated with humans. The time spent by the user at the lakes is negatively correlated with the hemeroby of the vegetation occurring on the lakes edges, but no such relationship was observed with aquatic vegetation and rushes at all. The quality of the areas visited is known to be assessed on the basis of the most accessible zones [42].
The urban–rural gradient should influence the RES of green infrastructure, the RES rising progressively as the distance from the rural aspect increases. Consequently, the management and planning of green infrastructure should take this into account. The distribution of benefits from RES should include demand and other social considerations. The extremities of the lakes were commonly overgrown with invasive plant species such as Solidago canadensis and S. gigantea, though in such cases the aquatic vegetation and the rushes did not necessarily reveal low floristical richness and diversity—invasive species in one zone did not contribute to biodiversity loss of other zones. The explanation for the lower interest by the visitors should rather be sought in the monotony of views regarded as lacking in diversity [42], rather than through lower diversity or the presence of invasive species. Invasive species may be perceived by the public in a neutral or even positive way [65], and it must be accepted that people may not know that a plant is invasive and may judge it on aesthetic rather than biological grounds [66].
Psychological studies highlight that direct contact with nature is crucial for human well-being and psycho-physical development in a long-term perspective. It is even accepted that the presence of green areas affects life expectancy [11,13,14,16]. Thus, green infrastructure can become the infrastructure of a healthy life, and is most needed in the city centres, densely built-up areas or highly populated areas. In such places, the demand for RES is the highest, and over half of the green infrastructure users are people seeking direct contact with nature [43]. The possibilities to develop and expand formal green areas, such as forests or natural urban parks close to the city centres, are usually spatially limited. Thus, integrating informal green spaces, such as urban lakes and their neighboring unmanaged areas, into existing green infrastructure can provide high benefits to both nature [67] and city dwellers [25]. The higher the share of such areas, the higher the real possibilities of recreation provided (Table 2). In the neighborhood surrounding the floodplain lakes in this study, which are Warsaw’s most valuable natural ecosystems, on average 9.5 people/ha per day utilized the space; these values are similar to those obtained for urban parks. Areas at the city’s lakes are quite frequently visited—on average 837 people visit the urban lakes studied each day, but spent little over 9 minutes per visit, indicating that they were highly transient. Comparing these values to those obtained for one of the most attractive big urban parks of Warsaw, the latter is visited by far less people per day, but the people spend much more time there, with the majority of visits exceeding 1 h [68].
The difference between property market value and the perception of a neighborhood by the inhabitants can be complex. A certain dissonance between the effect of the neighborhood on property prices and the perception of the surroundings after already inhabiting the area by the citizens can be observed. When choosing a place to live, the parameters exhibiting high RES of the surroundings (share of managed green areas, share of unmanaged abandoned areas, share of impermeable surfaces) which can be treated as a general measure of available infrastructure in the area are not taken into account. These factors do, however, play a significant role to the local community actually using the space (Table 2). This difference in perception of the surroundings by the citizens is enhanced by the lack of spatial planning documents that would promote high provisioning of RES for the housing estates and further influenced by the low ecological awareness of the citizens. These differences result undoubtedly to some extent from the fact that the group actually visiting the informal green areas, such as urban lakes, is rather small—less than 30% of citizens [25], which can affect the perception of biodiversity [63,64]. These results can also be influenced by the fact that the average number of apartments per 1000 inhabitants is much lower than the average for other European Union (EU) countries [69]. This tendency has been changing drastically lately. Only a couple of years ago, the purchase of an apartment was most influenced by the building interior (56%), low rent (48%) or safety (33%); now they tend to become less important [66]. During recent years, the number of citizens declaring a will to live in a neighborhood characterized by abundant green areas has increased from 12% to 27% [70]. The indications from this study are that the quality of the green area per se is of little importance, as long as the green area exists.
Taking into account that psychological studies reveal that the benefits from a vital natural infrastructure in a neighborhood are only revealed after many years, we should conclude that multiple data about RES from residential areas and their surroundings should be collected. This is of particular importance in a high-density urban environment such as Warsaw, where general anxiety and protests due to too poor information provision to the citizens on nature conservation issues are common [71]. Collecting such data, and making it easily accessed by the community, is a best practice in many EU countries [33]. Green infrastructure systems require constant verification due to insufficient recognition of RES, together with changing social conditions, property prices, and changes in land use. Multidisciplinary research, new methods and frameworks followed by on-site investigations are required to assess RES in urban areas and provide adequate management and planning strategies to optimize RES for the urban community [72]. Our findings show that the lack of sufficient information prior to the purchase of property can lead to a conflict once the buyers become the users of the green spaces—the housing prices are not related to the characteristics of the green infrastructure while the time spent there by visitors is.
Acceptance of biodiversity by those using urban green areas is simplified down to plant forms—the more diversified, the better perceived—which, in reality, does not overlap with the naturalness of an environment [42]. This is true for both indigenous vegetation and invasive species [65]. Our research shows that the perception of the quality of green areas by those using them is much simplified (Table 2). This justifies the need to use simple measures in spatial planning parameters of green areas ratio, which are commonly applied in Warsaw as well as in other cities [73,74]. However, our study shows that the share of green areas within the examined objects does not contribute directly to property values (Table 2). This is contradictory to many other studies [31,75,76,77]. And this may be an effect of the research areas used in other studies exhibiting greater heterogeneity than the relatively homogeneous components of the Vistula lakes, which were all formed by the same change in management of the river. Making information on green areas fully accessible to the public could change the perception and ecological awareness of green infrastructure users [65,78]. In the long term, the promotion of and education about green areas to residents, can form the basis for an increase in their use, with associated benefits for the health and well-being of the individual city dwellers.

Acknowledgments

The authors would like to thank Tomasz Okruszko and Mateusz Grygoruk, for critically reviewing the manuscript and for their kind suggestions and Agnieszka Bańkowska, for her valuable help in the laboratory measurements.

Author Contributions

S.D. conceived and designed the experiments; S.D., S.P. performed the experiments; S.P., H.R.J. analyzed the data. All authors participated in writing the manuscript.

Conflicts of Interest

The authors declare no conflict of interest.

References

  1. Benedict, M.A.; McMahon, E.T. Green Infrastructure Linking Landscapes and Communities; Island Press: Washington, DC, USA; Covelo, CA, USA; London, UK, 2006. [Google Scholar]
  2. Tzoulas, K.; Korpela, K.; Venn, S.; Yli-Pelkonen, V.; Kazmierczak, A.; Niemela, J.; James, P. Promoting Ecosystem and Human Health in Urban Areas using Green Infrastructure: A Literature Review. Landsc. Urban Plan. 2007, 81, 167–178. [Google Scholar] [CrossRef]
  3. Breuste, J.; Niemela, J.; Snep, R.P.H. Applying Landscape Ecological Principles in Urban Environments. Landsc. Ecol. 2008, 23, 1139–1142. [Google Scholar] [CrossRef]
  4. Vandermeulen, V.; Verspecht, A.; Vermeire, B.; Van Huylenbroeck, G.; Gellynck, X. The Use of Economic Valuation to Create Public Support for Green Infrastructure Investments in Urban Areas. Landsc. Urban Plan. 2011, 103, 198–206. [Google Scholar] [CrossRef]
  5. Gómez-Baggethun, E.; Barton, D.N. Classifying and Valuing Ecosystem Services for Urban Planning. Ecol. Econ. 2013, 86, 235–245. [Google Scholar] [CrossRef]
  6. Schäffler, A.; Swilling, M. Valuing Green Infrastructure in an Urban Environment under Pressure—The Johannesburg Case. Ecol. Econ. 2013, 86, 246–257. [Google Scholar] [CrossRef]
  7. Netusil, N.R.; Levin, Z.; Shandas, V.; Hart, T. Valuing Green Infrastructure in Portland, Oregon. Landsc. Urban Plan. 2014, 124, 14–21. [Google Scholar] [CrossRef]
  8. Breuste, J.; Rahimi, A. Many Public Urban Parks, but Who Profits from Them? The Example of Tabriz, Iran. Ecol. Process. 2015, 4, 1–15. [Google Scholar]
  9. Richards, D.R.; Warren, P.H.; Moggridge, H.L.; Maltby, L. Spatial Variation in the Impact of Dragonflies and Debris on Recreational Ecosystem Services in a Floodplain Wetland. Ecosyst. Serv. 2015, 15, 113–121. [Google Scholar] [CrossRef]
  10. Millenium Ecosystem Assessment. Ecosystems and Human Well-Being: Synthesis; Island Press: Washington, DC, USA, 2005. [Google Scholar]
  11. Suding, K.N. Toward and Area of Restoration in Ecology: Successes, Failures and Opportunities ahead. Annu. Rev. Ecol. Evol. Syst. 2011, 42, 465–487. [Google Scholar] [CrossRef]
  12. Lachowycz, K.; Jones, A.P. Towards a Better Understanding of the Relationship Between Greenspace and Health: Development of a Theoretical Framework. Landsc. Urban Plan. 2013, 118, 62–69. [Google Scholar] [CrossRef]
  13. White, M.P.; Alcock, I.; Wheeler, B.W.; Depledge, M.H. Would you be happier living in a greener urban area? A Fixed-effects Analysis of Panel Data. Psychol. Sci. 2013, 24, 920–928. [Google Scholar] [CrossRef] [PubMed]
  14. Alcock, I.; White, M.P.; Wheeler, B.W.; Fleming, L.E.; Depledge, M.H. Longitudinal Effects on Mental Health of Moving to Greener and Less Green Urban Areas. Environ. Sci. Technol. 2014, 48, 1247–1255. [Google Scholar] [CrossRef] [PubMed] [Green Version]
  15. Gascon, M.; Triguero-Mas, M.; Martínez, D. Residential Green Spaces and Mortality: A Systematic Review. Environ. Int. 2016, 86, 60–67. [Google Scholar] [CrossRef] [PubMed] [Green Version]
  16. Gascon, M.; Triguero-Mas, M.; Martinez, D.; Dadvand, P.; Forns, J.; Plasencia, A. Mental Health Benefits of Long-term Exposure to Residential Green and Blue Spaces: A Systematic Review. Int. J. Environ. Res. Public Health 2015, 12, 4354–4379. [Google Scholar] [CrossRef] [PubMed]
  17. Fitter, A.; Elmqvist, T.; Haines-Young, R.; Potschin, M.; Rinaldo, A.; Setälaä, H.; Stoll-Kleemann, S.; Zobel, M.; Murlis, J. An Assessment of Ecosystem Services and Biodiversity in Europe. Environ. Sci. Technol. 2010, 30, 1–28. [Google Scholar]
  18. Bolund, P.; Hunhammar, S. Ecosystem Services in Urban Areas. Ecol. Econ. 1999, 29, 293–301. [Google Scholar] [CrossRef]
  19. Daniel, T.C.; Muhar, A.; Arnberger, A.; Aznar, O.; Boyd, J.W.; Chan, K.M.A. Contributions of Cultural Services to the Ecosystem Services Agenda. Proc. Natl. Acad. Sci. USA 2012, 109, 8812–8819. [Google Scholar] [CrossRef] [PubMed]
  20. Cord, A.F.; Roeßiger, F.; Schwarz, N. Geocaching Data as an Indicator for Recreational Ecosystem Services in Urban Areas: Exploring Spatial Gradients, Preferences and Motivations. Landsc. Urban Plan. 2015, 144, 151–162. [Google Scholar] [CrossRef]
  21. Westerberg, V.H.; Lifran, R.; Olsen, S.B. To Restore or Not? A Valuation of Social and Ecological Functions of the Marais des Baux wetland in Southern France. Ecol. Econ. 2010, 69, 2383–2393. [Google Scholar] [CrossRef]
  22. Bullock, C.H.; Elston, D.A.; Chalmers, N.A. An Application of Economic Choice Experiments to a Traditional Land Use—Deer Hunting and Landscape Change in the Scottish Highlands. J. Environ. Manag. 1998, 52, 335–351. [Google Scholar] [CrossRef]
  23. Smyth, R.L.; Watzin, M.C.; Manning, R.E. Investigating Public Preferences for Managing Lake Champlain Using a Choice Experiment. J. Environ. Manag. 2009, 90, 615–623. [Google Scholar] [CrossRef] [PubMed]
  24. Rupprecht, C.D.D.; Byrne, J.A. Informal Urban Greenspace: A Typology and Trilingual Systematic Review of its Role for Urban Residents and Trends in the Literature. Urban For. Urban Green. 2014, 13, 597–611. [Google Scholar] [CrossRef]
  25. Rupprecht, C.D.D.; Byrne, J.A.; Uedac, H.; Lo, A.Y. ‘It’s Real, not Fake Like a Park’: Residents’ Perception and Use of Informal Urban Green-space in Brisbane, Australia and Sapporo, Japan. Landsc. Urban Plan. 2015, 143, 205–218. [Google Scholar] [CrossRef] [Green Version]
  26. Costanza, R.; D’Arge, R.; De Groot, R.; Farberk, S.; Grasso, M.; Hannon, B.; Limburg, K.; Naeem, S.; O’Neill, R.V.; Paruelo, J.; et al. The Value of the World’s Ecosystem Services and Natural Capital. Nature 1997, 387, 253–260. [Google Scholar] [CrossRef]
  27. Riechers, M.; Barkmann, J.; Tscharntke, T. Perceptions of Cultural Ecosystem Services from Urban Green. Ecosyst. Serv. 2016, 17, 33–39. [Google Scholar] [CrossRef]
  28. Tyrväinen, L. The Amenity Value of the Urban Forest: An Application of the Hedonic Pricing Method. Landsc. Urban Plan. 1997, 37, 211–222. [Google Scholar] [CrossRef]
  29. Benson, E.D.; Hansen, J.L.; Schwartz, A.L.; Smersh, G.T. Pricing Residential Amenities: The Value of a View. J. R. Estate Financ. Econ. 1998, 16, 55–73. [Google Scholar] [CrossRef]
  30. Morancho, A.B. A Hedonic Valuation of Urban Green Areas. Landsc. Urban Plan. 2003, 66, 35–41. [Google Scholar] [CrossRef]
  31. Jim, C.Y.; Chen, W.Y. External Effects of Neighborhood Parks and Landscape Elements on High-rise Residential Value. Land Use Policy 2010, 27, 662–670. [Google Scholar] [CrossRef]
  32. Sutton, P.C.; Anderson, S.J. Holistic Valuation of Urban Ecosystem Services in New York City’s Central Park. Ecosyst. Serv. 2016, 19, 87–91. [Google Scholar] [CrossRef]
  33. Mabelis, A.A.; Maksymiuk, G. Public Participation in Green Urban Policy: Two Strategies Compared. Int. J. Biodivers. Sci. Manag. 2009, 5, 63–75. [Google Scholar] [CrossRef]
  34. Turner, R.K.; Paavola, J.; Cooper, P.; Farber, S.; Jessamy, V.; Georgiou, S. Valuing Nature: Lessons Learned and Future Research Directions. Ecol. Econ. 2003, 46, 493–510. [Google Scholar] [CrossRef]
  35. Lyons, E. Demographic Correlates of Landscape Preference. Environ. Behav. 1983, 15, 487–511. [Google Scholar] [CrossRef]
  36. Strumse, E. Demographic Differences in the Visual Preferences for Agrarian Landscapes in Western Norway. J. Environ. Psychol. 1996, 16, 17–31. [Google Scholar] [CrossRef]
  37. Dramstad, W.E.; Tveit, M.S.; Fjellstad, W.J.; Fry, G.L.A. Relationships between Visual Landscape Preferences and Map-based Indicators of Landscape Structure. Landsc. Urban Plan. 2006, 78, 465–474. [Google Scholar] [CrossRef]
  38. Kaltenborn, B.P.; Bjerke, T. Associations between Environmental Value Orientations and Landscape Preferences. Landsc. Urban Plan. 2002, 59, 1–11. [Google Scholar] [CrossRef]
  39. Van der Berg, A.E.; Koole, S.L. New Wilderness in the Netherlands: An Investigation of Visual Preferences for Nature Development Landscapes. Landsc. Urban Plan. 2006, 78, 362–372. [Google Scholar] [CrossRef]
  40. Stilma, E.S.C.; Smit, A.B.; Geerling-Eiff, F.A.; Struik, P.C.; Vosman, B.; Korevaar, H. Perception of Biodiversity in Arable Production Systems in the Netherlands. NJAS Wagening. J. Life Sci. 2009, 56, 391–404. [Google Scholar] [CrossRef]
  41. Grygoruk, M.; Rannow, S. Mind the Gap! Lessons from Science-based Stakeholder Dialogue in Climate-adapted Management of Wetlands. J. Environ. Manag. 2017, 186, 108–119. [Google Scholar] [CrossRef] [PubMed]
  42. Qiu, L.; Lindberg, S.; Nielsen, A.B. Is Biodiversity Attractive?—On-site Perception of Recreational and Biodiversity Values in Urban Green Space. Landsc. Urban Plan. 2013, 119, 136–146. [Google Scholar] [CrossRef]
  43. Chiesura, A. The Role of Urban Parks for the Sustainable City. Landsc. Urban Plan. 2004, 68, 129–138. [Google Scholar] [CrossRef]
  44. Faizi, M. The Role of Urban Parks in a Metropolitan City. Environ. Sci. 2006, 12, 29–34. [Google Scholar]
  45. Rasmussen, L.V.; Mertz, O.; Christensen, A.E.; Danielsen, F.; Dawson, N.; Xaydongvanh, P. A Combination of Methods Needed to Assess the Actual Use of Provisioning Ecosystem Services. Ecosyst. Serv. 2016, 17, 75–86. [Google Scholar] [CrossRef] [Green Version]
  46. Beier, C.M.; Caputo, J.; Lawrence, G.B.; Sullivan, T.J. Loss of Ecosystem Services due to Chronic Pollution of Forests and Surface Waters in the Adirondack Region (USA). J. Environ. Manag. 2017, 191, 19–27. [Google Scholar] [CrossRef] [PubMed]
  47. Bertaud, A.; Malpezzi, S. The Spatial Distribution of Population in 48 World Cities: Implications for Economies in Transition, Research Working Paper; University of Wisconsin, Center for Urban Economics: Madison, WI, USA, 2003. [Google Scholar]
  48. Thrane, C. Examining the Determinants of Room Rates for Hotels in Capital Cities: The Oslo Experience. J. Revenue Pricing Manag. 2006, 5, 315–323. [Google Scholar] [CrossRef]
  49. Andersson, D.E. Hotel Attributes and Hedonic Prices: An Analysis of Internet-based Transactions in Singapore’s Market for Hotel Rooms. Ann. Reg. Sci. 2010, 44, 229–240. [Google Scholar] [CrossRef]
  50. Chen, C.; Rothschild, R. An Application of Hedonic Pricing Analysis to the Case of Hotel Rooms in Taipei. Tour Econ. 2010, 16, 685–694. [Google Scholar] [CrossRef]
  51. Schamel, G. Weekend vs. Midweek Stays: Modelling Hotel Room Rates in a Small Market. Int. J. Hosp. Manag. 2012, 31, 1113–1118. [Google Scholar] [CrossRef]
  52. Balaguer, J.; Pernias, J.C. Relationship between Spatial Agglomeration and Hotel Prices: Evidence from Business and Tourism Consumers. Tour. Manag. 2013, 36, 391–400. [Google Scholar] [CrossRef]
  53. Becerra, M.; Santaló, J.; Silva, R. Being Better vs. Being Different: Differentiation, Competition, and Pricing Strategies in the Spanish Hotel Industry. Tour. Manag. 2013, 34, 71–79. [Google Scholar] [CrossRef]
  54. Mansor, M.; Said, I.; Mohamad, I. Experiential Contacts with Green Infrastructure’s Diversity and Well-being of Urban Community. Procedia Soc. Behav. Sci. 2012, 49, 257–267. [Google Scholar] [CrossRef]
  55. Sudnik-Wójcikowska, B.; Galera, H. Warsaw. In Plants and Habitats in European Cities; Kelcey, J.G., Müller, N., Eds.; Springer: New York, NY, USA, 2011; pp. 499–545. [Google Scholar]
  56. Sikorska, D. The Former Vistula River Beds near Warsaw: Vegetational Diversity and Change. Ph.D. Thesis, Warsaw University of Life Science, Warsaw, Poland, 17 December 2014; pp. 1–130. [Google Scholar]
  57. Arnberger, A.; Brandenburg, C. Visitor Structure of a Heavily Used Conservation Area: The Danube Floodplains National Park, Lower Austria. Available online: http://mmv.boku.ac.at/refbase/files/arnberger_arne_bra-2002-visitor_structure_of.pdf (accessed on 20 December 2016).
  58. Hahs, A.K.; McDonnell, M.J. Selecting Independent Measures to Quantify Melbourne’s Urban-rural Gradient. Landsc. Urban Plan. 2006, 78, 435–448. [Google Scholar] [CrossRef]
  59. Magurran, A.E. Measuring Biological Diversity; Whiley & Sons: Oxford, UK, 2004. [Google Scholar]
  60. Fanelli, G.; Tescarollo, P.; Testi, A. Ecological Indicators Applied to Urban and Suburban Floras. Ecol. Indic. 2006, 6, 444–457. [Google Scholar] [CrossRef]
  61. Fuller, R.A.; Irvine, K.N.; Devine-Wright, P.; Warren, P.H.; Gaston, K.J. Psychological Benefits of Greenspace Increase with Biodiversity. Biol. Lett. 2007, 3, 390–394. [Google Scholar] [CrossRef] [PubMed]
  62. Carrus, G.; Scopelliti, M.; Lafortezza, R.; Colangelo, G.; Ferrini, F.; Salbitano, F.; Sanesi, G. Go Greener, Feel Better? The Positive Effects of Biodiversity on the Well-being of Individuals Visiting Urban and Peri-urban Green areas. Landsc. Urban Plan. 2015, 134, 221–228. [Google Scholar] [CrossRef]
  63. Lin, B.B.; Fuller, R.A.; Bush, R.; Gaston, K.J.; Shanahan, D.F. Opportunity or Orientation? Who Uses Urban Parks and Why. PLoS ONE 2014, 9, e87422. [Google Scholar] [CrossRef] [PubMed]
  64. Murateta, A.; Pellegrini, P.; Dufourc, A.B.; Arrif, T.; Chiron, F. Perception and Knowledge of Plant Diversity among Urban Park Users. Landsc. Urban Plan. 2015, 137, 95–106. [Google Scholar] [CrossRef]
  65. Lindemann-Matthies, P. Beasts or Beauties? Laypersons’ Perception of Invasive Alien Plant Species in Switzerland and Attitudes towards their Management. NeoBiota 2016, 29, 15–33. [Google Scholar] [CrossRef]
  66. Hand, K.L.; Freeman, C.; Seddon, P.J.; Stein, A.; Van Heezik, Y. A Novel Method for Fine-scale Biodiversity Assessment and Prediction across Diverse Urban Landscapes Reveals Social Deprivation-related Inequalities in Private, not Public Spaces. Landsc. Urban Plan. 2016, 151, 33–44. [Google Scholar] [CrossRef]
  67. Kowarik, I. Novel Urban Ecosystems, Biodiversity, and Conservation. Environ. Pollut. 2011, 159, 1974–1983. [Google Scholar] [CrossRef] [PubMed]
  68. Cieszewska, A.; Kowalczyk, M.; Szumacher, I. Skaryszewski Park Uers in Years 2009–2015. In Skaryszewski Park in Warsaw—Nature and Use; Romanowski, J., Ed.; UKSW Press: Warszaw, Poland, 2015; pp. 37–48. (In Polish) [Google Scholar]
  69. Pittini, A.; Ghekière, L.; Dijol, J.; Kiss, I. Housing in Europe, the European Federation for Public, Cooperative and Social Housing Brussels. 2015. Available online: http://www.housingeurope.eu/file/306/download (accessed on 20 December 2016).
  70. Pankowski, K. How Do Poles Live, or How They Would Like to Be Living. Fundacja Centrum Badania Opinii Społecznej, 2010. Available online: www.cbos.pl/spiskom.pol/2010/k_120_10.PDF (accessed on 20 December 2016). (In Polish)
  71. Pawłowska, K. Public Participation in Decision Making on Urban Nature. 2012. Available online: http://www.sendzimir.org.pl/images/zrz_3_en/03_public_participation_in_decision_making_on_urban_nature.pdf (accessed on 20 December 2016).
  72. Wang, Y.F.; Bakker, F.; De Groot, R.; Wortche, H. Effect of Ecosystem Services Provided by Urban Green Infrastructure on Indoor Environment: A Literature Review. Build. Environ. 2014, 77, 88–100. [Google Scholar] [CrossRef]
  73. Keeley, M. The Green Area Ratio: An Urban Site Sustainability Metric. J. Environ. Plan. Manag. 2011, 54, 937–958. [Google Scholar] [CrossRef]
  74. Szulczewska, B.; Giedych, R.; Borowski, J.; Kuchcik, M.; Sikorski, P.; Mazurkiewicz, A.; Stańczyk, T. How much is Needed for a Vital Neighbourhood? Land Use Policy 2014, 38, 330–345. [Google Scholar] [CrossRef]
  75. Lutzenhiser, M.; Netusil, N.R. The Effect of Open Spaces on a Home’s Sale Price. Contemp. Econ. Policy 2001, 19, 291–298. [Google Scholar] [CrossRef]
  76. Geoghegan, J. The Value of Open Spaces in Residential Land Use. Land Use Policy 2002, 19, 91–98. [Google Scholar] [CrossRef]
  77. Thorsnes, P. The Value of a Suburban Forest Preserve: Estimates from Sales of Vacant Residential Building Lots. Land Econ. 2002, 78, 426–441. [Google Scholar] [CrossRef]
  78. Helfand, G.E.; Park, J.S.; Nassauer, J.I.; Kosek, S. The Economics of Native Plants in Residential Landscape Designs. Landsc. Urban Plan. 2006, 78, 229–240. [Google Scholar] [CrossRef]
Figure 1. Location of investigated urban lakes and the strongly built-up areas of Warsaw according to Corine Land Cover from 2012, lake numbers according to Table 1.
Sustainability 09 00334 g001
Figure 2. Research area (dotted line) and vegetation sampling plots scheme within transects; white circles: (a)—aquatic vegetation; (b)—vegetation of the rushes; (c)—terrestrial vegetation of the shores. Signs based on the Powsinkowskie Lake example.
Sustainability 09 00334 g002
Table 1. Characteristics of investigated urban lakes and distance from centre, mean property value within 500 m buffer area, mean number of visitors, total time spent of people per day.
No.Lake Name (ID)Area [ha]Lake Perimeter [m]X Coordinates of the Lake Centroid (Projected Coordinate System PUWG 1992)Y Coordinates of the Lake Centroid (Projected Coordinate System PUWG 1992)Distance from City Centre [km]Mean Property Value within 500 m Buffer Zone [€]Mean Number of Visitors [People/Day]Total Time Spent of People Per Day [h]
1Bielawa6.11487646,648.21473,915.9016.11327.235.25.25
2Boża Wola5.62250620,133.09506,266.2025.31350.224.43.4
3Brześce5.82748650,661.15464,613.4026.51405.522.13.3
4Ciecieszewskie1.6682649,102.31468,396.8022.11390.626.23.6
5Czerniakowskie17.74096641,505.59482,874.006.71359.412612.9
6Czerskie4.02049653,719.46456,946.4034.21621.018.12.7
7Kosumce0.7706656,008.69460,641.7032.3816.415.32.7
8Dziecinów N1.41222655,950.97460,908.4032.1816.411.61.65
9Dziecinów S6.82943656,491.89460,255.5033.51277.28.11.2
10Dziekanowskie26.54030625,488.97501,856.8018.71084.1487.2
11Gocławskie1.8957641,756.84487,071.305.21716.680.212
12Habdzin3.91687647,538.26471,911.9018.11621.0203.5
13Nowy Kazuń14.43132614,401.37506,377.5030.51371.018.32.7
14Kiełpińskie6.92400627,508.07501,195.0017.41084.117.12.8
15Lisowskie7.42310645,454.90475,668.4014.01621.038.75.7
16Łomna E3.21471620,663.38504,106.4024.2910.114.12.1
17Łomna M5.21438620,128.68504,304.6024.3910.119.22.85
18Łomna W2.8810619,849.01504,630.1025.1910.1182.7
19Karczew2.91878653,560.34469,533.6024.8816.442.46.3
20Pod Morgami2.31047645,189.90476,406.1013.31954.831.24.4
21Nowy Dwór1.1456617,152.18506,811.1028.4910.144.6
22Opacz E1.11189647,804.97472,562.5018.41390.623.13.45
23Opacz W0.7859647,579.48472,894.3018.11390.625.13.75
24Piotrowice5.22120655,828.61462,257.2031.7816.425.33.2
25Powsinkowskie10.92720643,462.43478,953.3010.41762.754.58.1
26Otwockie33.18007653,635.42466,188.9027.5816.461.15.15
27Syta1.3627643,889.49481,052.709.21589.94.84.2
28Żabie0.3279645,057.90484,160.709.11992.94.65.1
Mean Value 29.94.5
Sum 836.7126.5
Table 2. Spearman’s correlation coefficients between the ecological characteristics of investigated urban lakes and their surroundings and recreational ecosystem services provided by these ecosystems, expressed as mean property values in the neighborhood and real time spent by the citizens at the lakes at p < 0.05.
Property Value in the 500 m Buffer Zone [€/m2]Duration of Time Spent by the Users [h/Day]
R Squarep-ValueR Squarep-Value
Distance from centre−0.4300.023−0.7200.000
Land use in the 500 m buffer zone
Built-up areas [%] 0.4680.0120.4980.007
Managed green areas [%]0.2820.1470.4890.008
Abandoned unmanaged areas [%]0.1790.3620.5640.002
Impermeable surfaces [%]0.2700.1640.5420.003
Rushes and wetlands [%]0.0420.8340.0320.872
Forests and woodlands [%]−0.3300.0900.0690.729
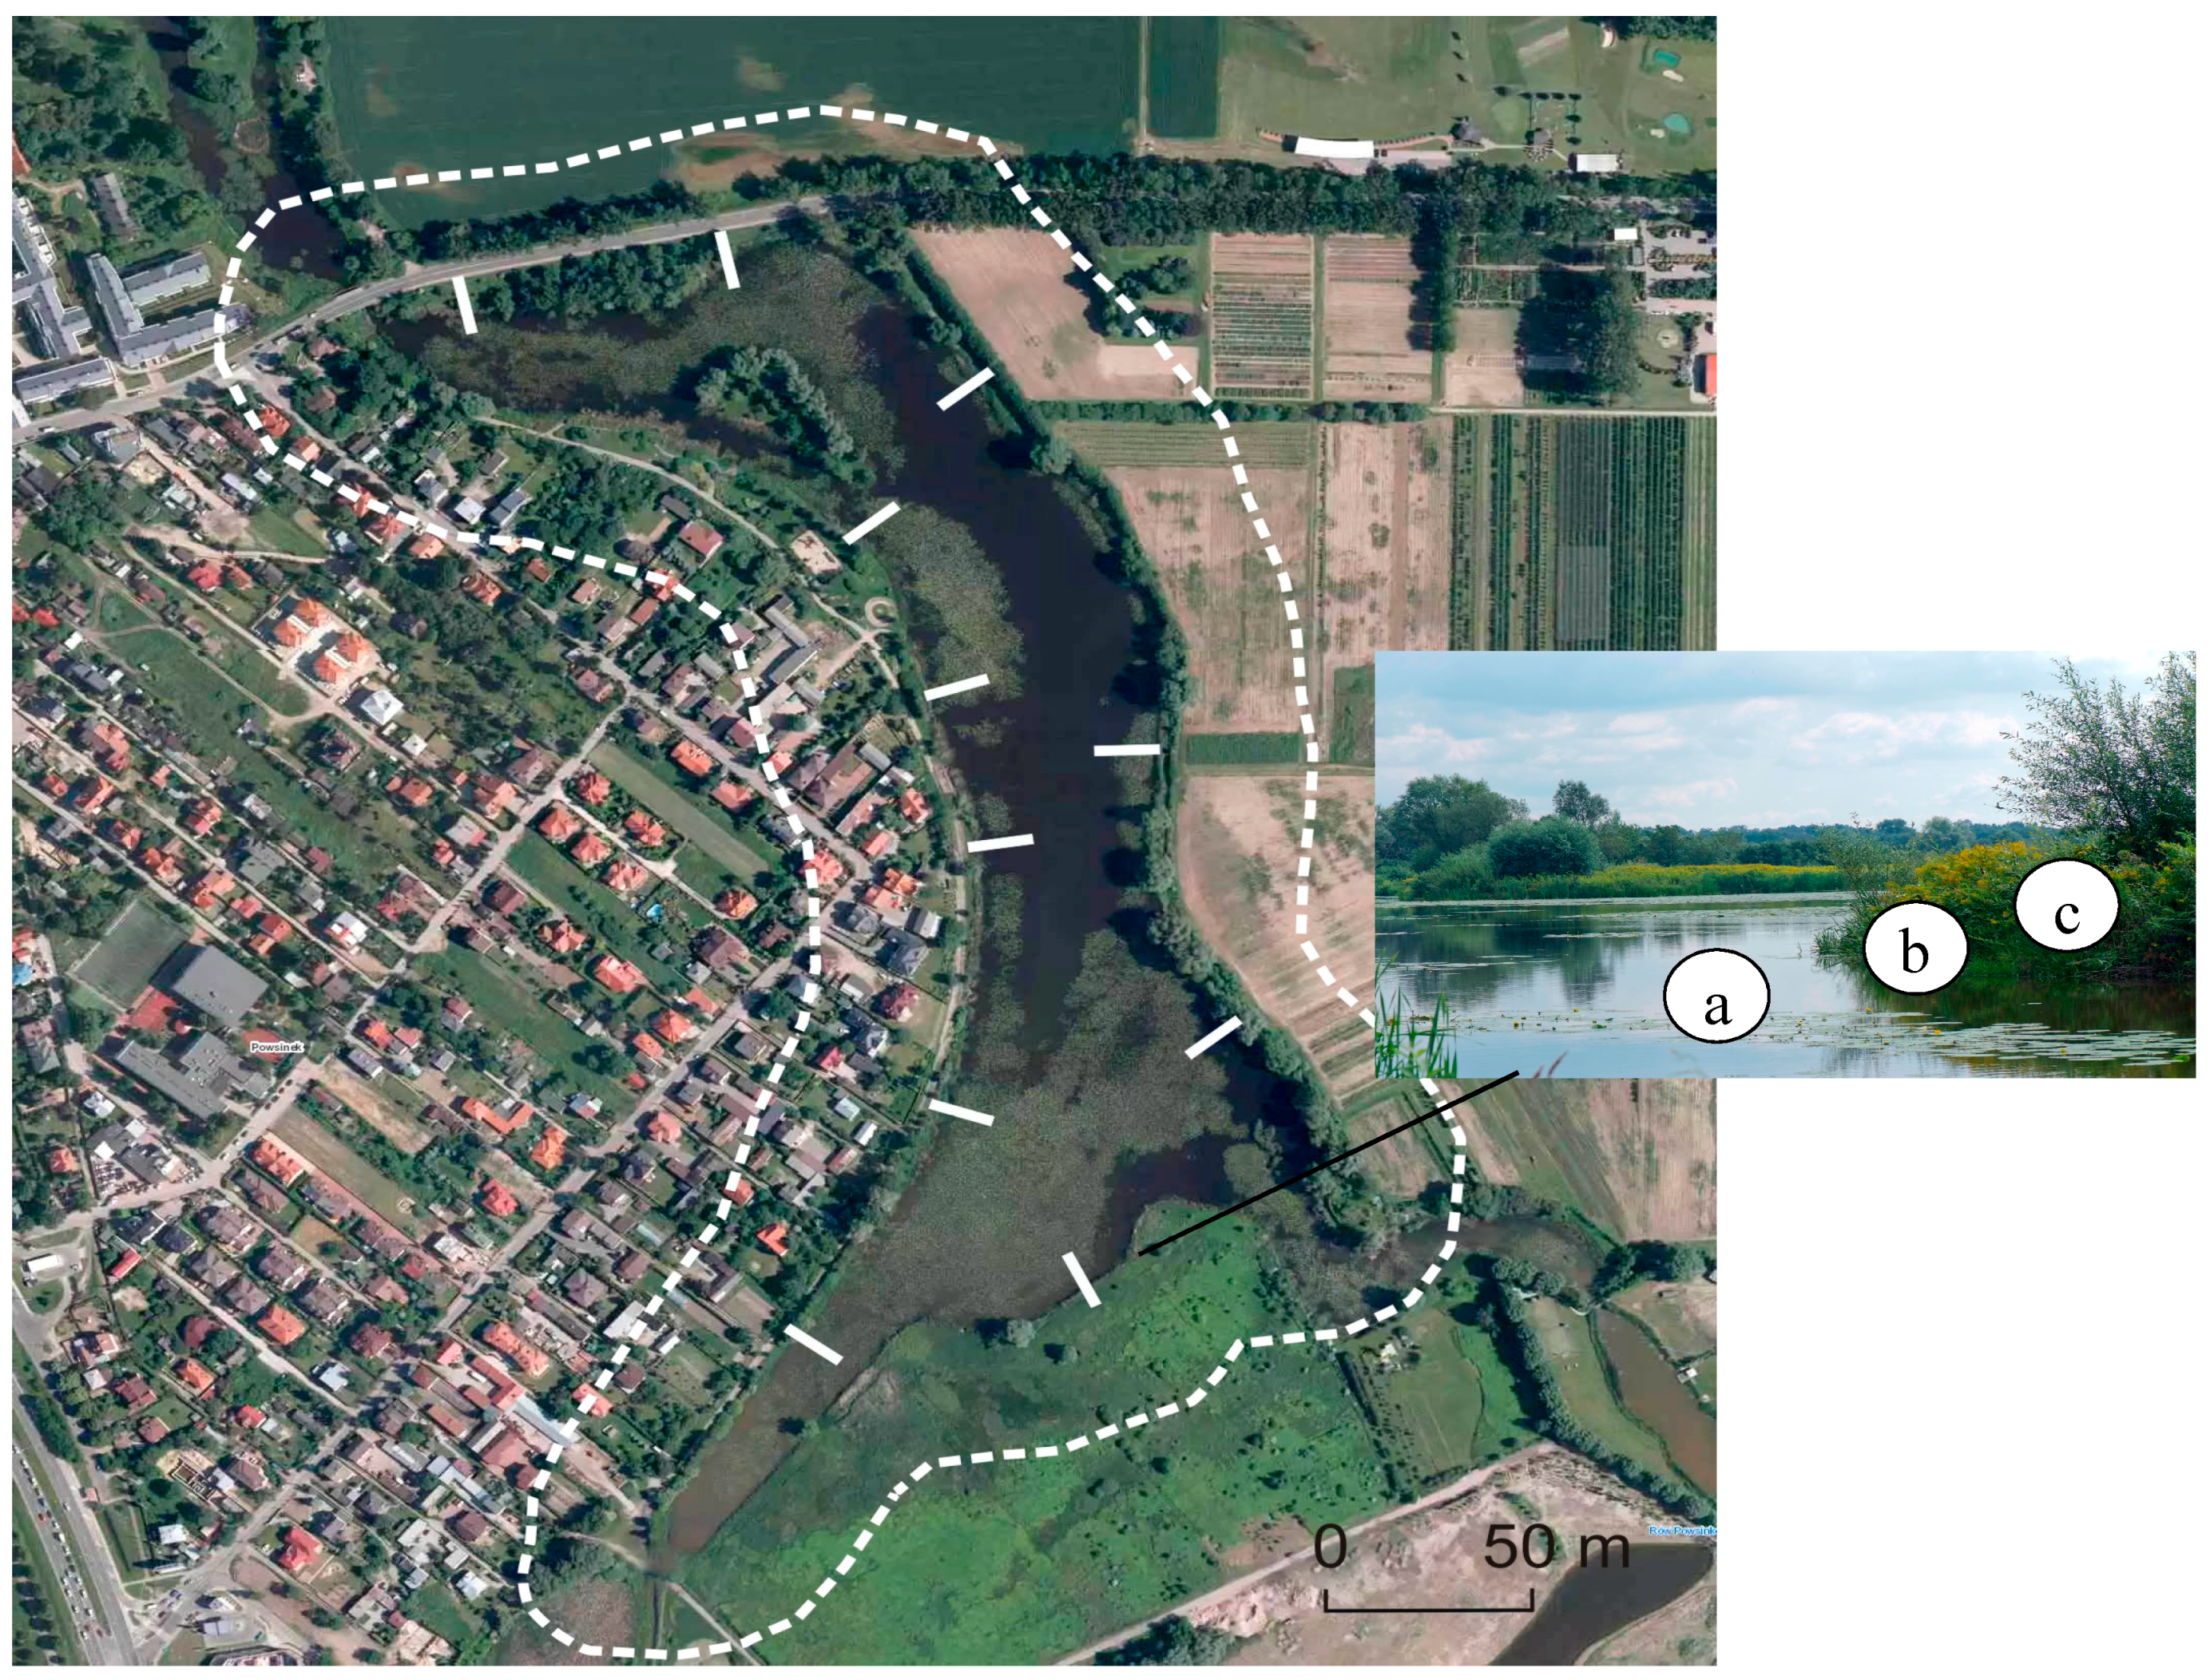
Aquatic vegetation (zone a)
Number of species0.2900.135−0.0400.838
Shannon–Wiener Index0.2780.152−0.1100.583
Hemeroby0.0850.6670.1390.481
Vegetation of the rushes (zone b)
Number of species−0.3500.072−0.4000.036
Shannon–Wiener Index−0.2000.317−0.2100.277
Hemeroby−0.1700.391−0.1800.37
Vegetation of the shores (zone c)
Number of species−0.2600.1870.1070.588
Shannon–Wiener Index−0.4200.0260.1630.409
Hemeroby−0.4200.026−0.3900.040
Waterquality parameters
P-PO43−0.0350.861−0.2200.260
N-NO20.2340.2300.1490.449
N-NO3−0.0300.880−0.380 *0.046
N-NH4−0.1400.475−0.0400.854

