
A Triple Bottom Line Analysis of Hong Kong’s Logistics Sector


1
School of Business, Macao Polytechnic Institute, Macao, China
2
Department of Logistics and Maritime Studies, The Hong Kong Polytechnic University, Hong Kong, China
*
Author to whom correspondence should be addressed.
Sustainability 2017, 9(3), 388; https://doi.org/10.3390/su9030388
Submission received: 25 January 2017
/
Accepted: 2 March 2017
/
Published: 6 March 2017
Abstract
:Logistics play a crucial role in the development of the world economy as globalization continues. Because international trade is a driver of the gross domestic product (GDP), it impacts the economies of cities and countries. However, all transport modes consume energy and produce air pollutants including greenhouse gases (GHGs) either directly or indirectly. This paper uses a triple bottom line approach to examine the environmental, economic, and social performance of Hong Kong’s logistics sector. The data, including annual cargo movements between Hong Kong and other places by different transport modes (container ships, aircraft, heavy trucks, and freight trains), the respective values added, and the number of workers employed in this sector, were collected from the Hong Kong government. Results showed that the total cargo weight had increased by 40% between 2000 and 2014. During the same period of time, the logistics sector contributed an average of 4.2% to Hong Kong’s total GDP, provided an average of 5.6% of total employment, but produced an average of 37.4% of Hong Kong’s total GHG emission.
1. Introduction
The logistics sector has been generally recognized as one of the key pillars of economic development [1,2]. Many countries across the globe view seamless logistics as a way to integrate with global value chains and to bring economic and social benefits. However, the logistics sector also consumes a significant amount of energy and produces air pollutants including greenhouse gases (GHGs), as it involves land, sea, and air transport. Sustainable logistics, therefore, has become a hot topic in recent years [3,4,5,6]. As noted by Zachary [7], a triplet-based environmental, economic, and social model has been widely used to characterize the sustainability of human activities over the past three decades. The triplet model is also known as a triple bottom line analysis in literature [8,9,10,11,12].
As a major international trading hub, Hong Kong has a significant amount of logistics-related transport. According to the World Bank’s statistics on transport, the world’s air freight transport amounted to 184,315 million ton-km in 2014, in which Hong Kong’s air freight transport was ranked the fifth in the world, with 10,826 million ton-km (about 5.9% of the world’s air freight transport) [13]. The World Bank’s statistics on transport also indicate that the world’s container port traffic amounted to 679 million twenty-foot equivalent units (TEU) in 2014, with Hong Kong being ranked the seventh in the world, with 22.3 million TEU (about 3.3% of the world’s container port traffic) [13]. As a single port, Hong Kong International Airport was ranked the busiest airport for international air cargo [14] while Hong Kong’s container port was ranked the fifth busiest port in the world in 2014 [15]. In terms of cargo weight, Hong Kong’s air freight cargo throughput amounted to 4.38 million tons while the sea freight cargo throughput was 297.74 million tons in 2014. Further, the land freight cargo throughput by trucks was 24.21 million tons. Hence, understanding how Hong Kong’s logistic sector performs in terms of its environmental influence, economic contribution, and social benefit should shed light on the triple bottom line analysis of the logistics sector as a whole. The findings from this study can contribute to the continued development of sustainable logistics.
2. Materials and Methods
Although the triple bottom line approach to measure sustainability has been widely adopted in industries and governments [16,17,18], and different sets of indicators and metrics have been proposed to measure the sustainability of business activities, organizations, industrial sectors, cities, and countries [19,20,21], the choice of sustainability indicators should be dependent on the case in a specific context. For instance, Sikdar suggested that environmental indictors include resource consumption such as energy use, material use, water use and land use, and environmental impacts such as global warming, acidification, ozone depletion, human health and ecological health [16]. As this study focused on Hong Kong’s logistics sector in which a significant amount of energy was consumed, GHG emissions due to the consumption of fossil fuels was chosen as the environmental indicator [22]. Rodger and George also suggested GHG emissions to be a good environmental indicator in a triple bottom line analysis [12]. Regarding the economic indicators, two typical indicators, namely value-added values and R&D expenditures, were adopted [12,16,23]. Note that the value-added measures are in the form of value added by sector, as suggested by Clift and Wright [23]. Finally, the social indicators include education, health, housing, public safety, employment, and income [24]. Specifically, the number of employment is considered as a key social benefit of a sector [24,25] so it was selected as one of the social indicators in the study.
2.1. Data Collection
Data were collected from the Hong Kong Census and Statistics Department for the period 2000–2014. The Hong Kong Census and Statistics Department publishes the Hong Kong Annual Digest of Statistics in which detailed transport data including freight transport in terms of tonnage and destination/country of origin are given [26]. At the turn of the millennium, the Hong Kong Government identified four key industries, namely, financial services, logistics and trading, professional services, and tourism. Since then, the Hong Kong Government has published an annual report on these four key industries, focusing on direct economic contributions and social benefits that these industries had brought about [27]. In the annual report, the economic contribution of each industry is characterized by the value added, i.e., the magnitude of gross revenue minus the value of goods and services used up in the course of service delivery while the social benefit of each industry is determined by the number of people employed in each industry [27].
2.2. Normalized Sustainability Indicators
After obtaining freight transport data in terms of tonnage and destination/country of origin for all transport modes including sea, air, and land, the total direct GHG emission was determined by summing the amounts of GHG emission due to a particular type of freight transport from Hong Kong to each destination (or vice versa). The distance between Hong Kong to a destination was obtained from a liner operator, an airfreight operator, or a trucking company while emission factors were 0.0121 kg CO2–eq per ton-km for sea freight, 0.95 kg CO2–eq per ton-km for air freight, 0.1197 kg CO2–eq per ton-km for land transport by truck, and 0.0227 kg CO2–eq per ton-km for land transport by rail [28]. The construction of a carrier, such as a container ship, aircraft, truck, and train also consumes vast amounts of resources and energy. In the present study, the consumption of resources and indirect GHG emission due to the construction of carriers were not accounted for as these were considered outside the spatial and time boundaries of Hong Kong’s logistics sector which is the focus here.
Indirect economic contribution by the logistics sector occurs when buyers and suppliers of logistics companies produce added value through upstream and downstream business activities in supply chains. For example, Hong Kong’s trading firms and retailers work closely with logistics companies and bring forth economic benefits to the society. Besides, trading firms and retailers provide employment opportunities. Thus, the logistics sector offers both indirect economic contributions and social benefits. These can be further extended when buyers and suppliers of trading firms and retailers are considered too. However, this paper includes only the direct economic contributions and social benefits provided by logistics sector were included in the present study, so as to be consistent with the environmental influence arising from direct GHG emission as stated above.
Three normalized indicators were calculated to determine the environmental, economic, and social performance of the logistics sector. The first, environmental performance (EnvPerf) is defined as follows:
where the numerator () is the total GHG emission attributable to the consumption of fossil fuels, including oil products, natural gas, and coal in Hong Kong (EFk stands for emission factor of the kth fuel according to the 2006 IPCC Guidelines for National Greenhouse Gas Inventories [28]; the denominator is the total GHG emission due to cargo freights from Hong Kong to different destinations (and vice versa) by different transport modes (Wj is the weight of cargo in tons, Distj is the distance between Hong Kong and a destination/country of origin in km, and EFdue to transport mode i is the emission factor of the transport mode i). Thus, EnvPerf is the inverse of the percentage of GHG emission due to the logistics sector in a particular year. A larger EnvPerf points to a better performance of the logistics sector.
The second normalized indicator, economic performance (EcoPerf) is determined by the following equation.
where the numerator is the value added by the logistics sector and the denominator is the gross domestic product (GDP) of Hong Kong.
The third normalized indicator, social performance (SocPerf) is determined by the following equation.
where the numerator is the employment in the logistics sector and the denominator is the total employment in Hong Kong.
3. Results
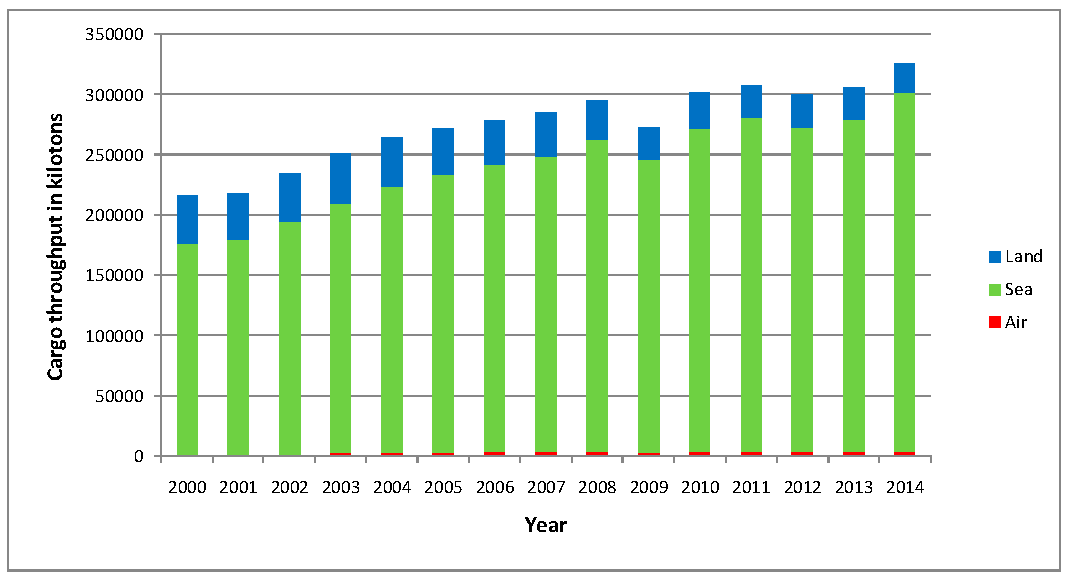
The total cargo throughput of Hong Kong amounted to 217.26 million tons in 2000. It increased fairly steadily to 326.32 million tons in 2014, except that there was a contraction in the demand for Chinese exports in 2009 and 2012 as a result of the financial crisis (see Figure 1). Among different modes of freight transport, the air freight cargo throughput increased from 2.24 million tons in 2000 to 4.38 million tons in 2014, the sea freight cargo throughput increased from 174.64 million tons in 2000 to 297.74 million tons in 2014, while the land freight cargo throughput decreased from 39.93 to 24.21 million tons by trucks and from 0.45 to 0 million tons by trains. It should be noted that there has been no freight train between Hong Kong and mainland China since 2011.
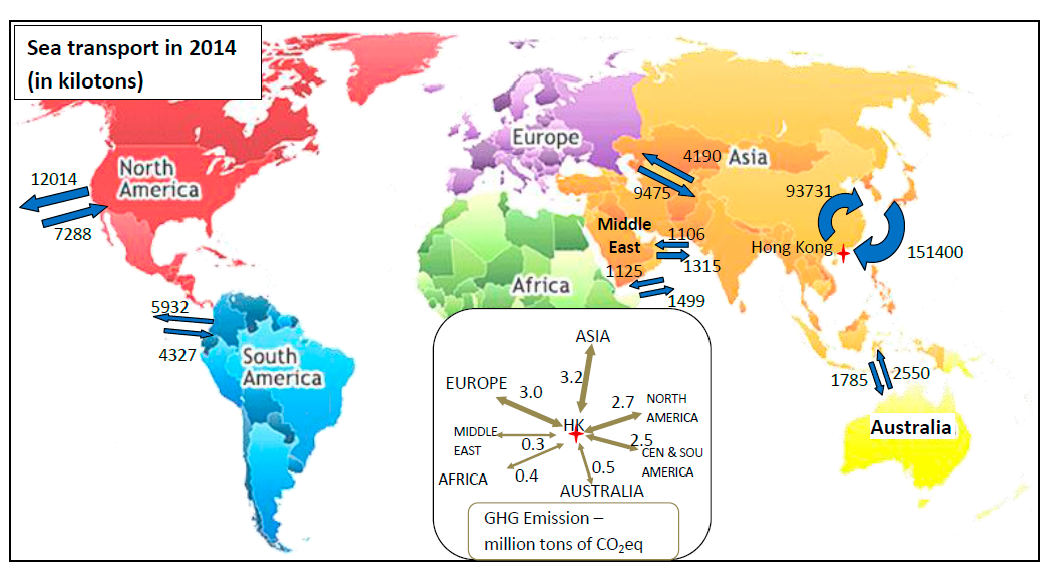
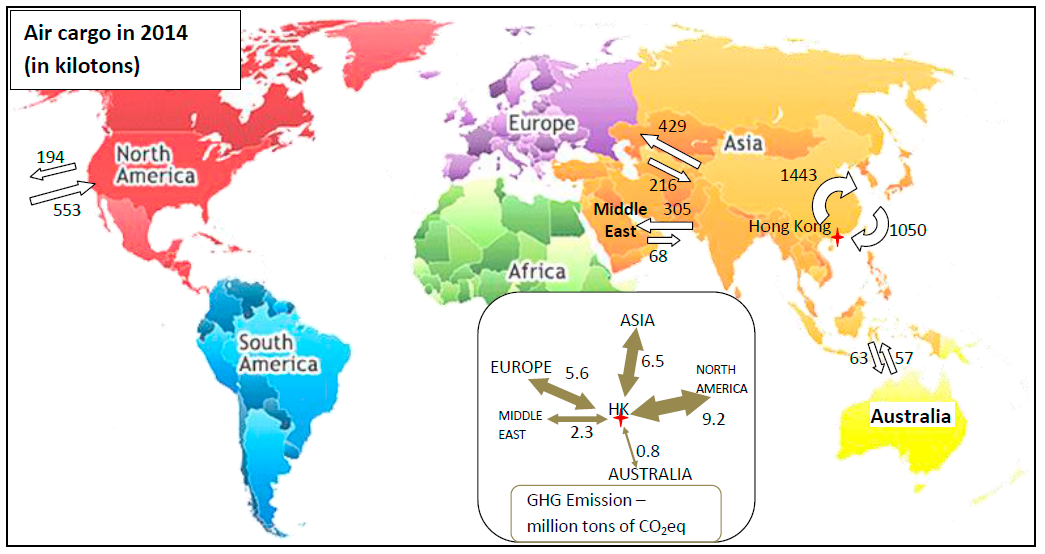
Table 1, Table 2 and Table 3 show the cargo throughput of Hong Kong by different modes of transport in 2014. The total cargo throughput of Hong Kong was 326.32 million tons and the total GHG emissions due to different transport modes in the logistics sector were 37.32 CO2–eq million tons. Sea freight cargo and air freight cargo were 91.2% and 1.4% of the total cargo throughput in weight, respectively. However, GHG emissions from sea freight contributed 33.4% of the total GHG emissions while GHG emissions from air freight accounted for 65.5% of the total GHG emission. The land freight cargo was 7.4% and emitted 1.1% of the total GHGs.
Figure 2 and Figure 3 show sea freight cargoes and air freight cargoes between Hong Kong and other regions and the associated GHG emissions, respectively. These figures indicate that the air freight cargo between Hong Kong and North America (mainly the US) produced the greatest amount of GHGs, followed by air freight cargo between Hong Kong and other Asian countries, and then between Hong Kong and European countries.
Table 4 shows the consumption of fossil fuels in Hong Kong and the associated GHG emissions in 2014. As the total GHG emissions due to the consumption of fossil fuels were 90.76 CO2–eq million tons, the logistics sector alone contributed to 41.1% of the total GHG emissions in Hong Kong. From 2000 to 2014, it was found that the logistics sector contributed between 32.0% and 41.1% (mean: 37.4%; standard deviation: 2.7%) of the total GHG emissions in Hong Kong. In terms of environmental performance (EnvPerf), the figures ranged between 2.43% and 3.13% (mean: 2.69%; standard deviation: 0.20%).
In 2014, the value added by the logistics sector amounted to HK$ 74.8 billion while Hong Kong’s GDP was HK$ 2204 billion. Hence, the economic performance of the logistics sector (EcoPerf) was 3.39% as calculated by Equation (2). From 2000 to 2014, the values of EcoPerf ranged between 3.24% and 5.25%. The mean value was 4.20% and the standard deviation 0.68%.
The employment in the logistics sector was 186.1 thousand while the total employment was 3.75 million in 2014. Hence, the social performance of the logistics sector (SocPerf) was 4.96%, as shown in Equation (3). In the period of 2000 to 2014, the values of SocPerf ranged from 4.96% to 6.02%. The mean value was 5.57% and the standard deviation 0.34%.
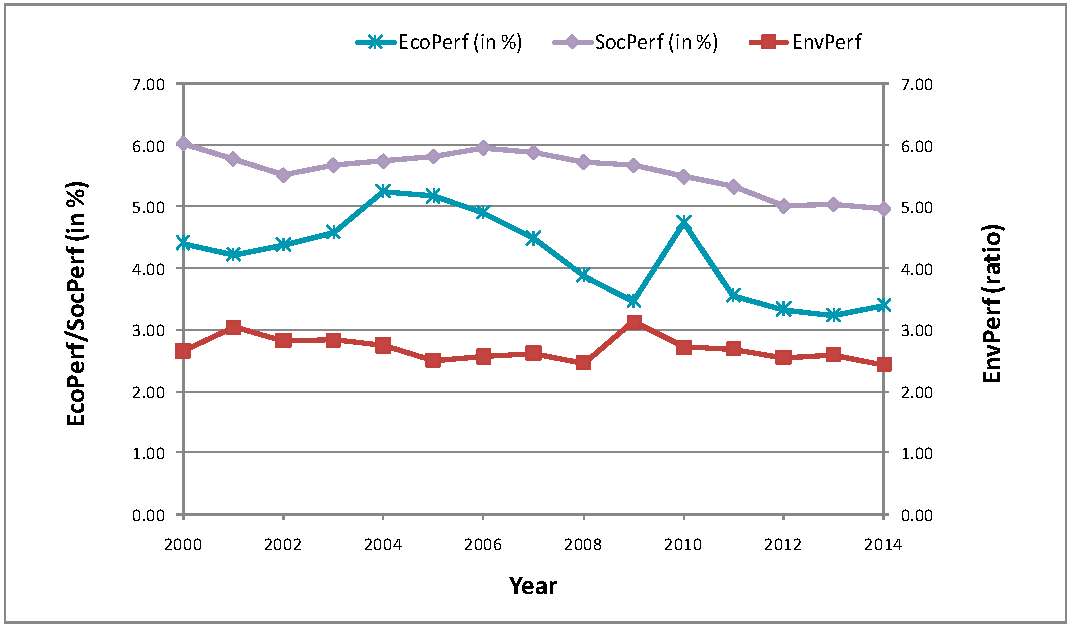
Figure 4 shows the environmental, economic, and social performance figures for the logistics sector for the period 2000–2014. There was no significant change in the environmental performance during this period of time. Nevertheless, the economic performance dropped from 4.42% in 2000 to 3.39% in 2014 while the social performance dropped from 6.02% to 4.96%. A linear regression analysis was performed by using EnvPerf as the dependent variable and Year as the independent variable. The results showed that there was a weak, insignificant trend (slope: −0.018 per year; p > 0.05), implying that no significant change in EnvPerf had occurred during the period 2000–2014. A second linear regression was performed to examine the trend of EcoPerf. The results showed that there was a small significant trend in EcoPerf (slope: −0.101 %/per year; p < 0.01). Finally, a linear regression was performed to examine the trend of SocPerf. The results showed that there was a small significant trend in SocPerf (slope: −0.061 %/per year; p < 0.001). These results suggest that EcoPerf and SocPerf have generally deteriorated since 2000. There was, however, a short-term rebound in EcoPerf in 2010. It was because of the sudden increase in air-to-air transhipment cargos in 2010, which led to a significant gain in the added value generated by the increased activities in the cargo terminals [27].
4. Discussion
Table 1, Table 2 and Table 3 and Figure 2 and Figure 3 show that air freight transport was the key contributor to GHG emissions. A further detailed analysis has shown that, in 2014, there were 553 kilotons of air cargo transported from Hong Kong to North America (mainly the US) and 194 kilotons of air cargo from North America (mainly from the US) to Hong Kong. However, they produced 9.2 million tons of CO2–eq—the most significant contributor. The second and third significant contributors were GHG emissions due to air freight cargo between Hong Kong and Asia—mostly mainland China [29]—and air freight cargo between Hong Kong and Europe. If most of the air freight cargoes between Hong Kong and mainland China (about one million tons) had been transported by container ships rather than by air freight, it would have saved 2.6 million tons of CO2–eq, representing a 6.9% reduction of the total GHG emissions from the logistics sector. Besides, it could have freed airport capacity for more passenger flights, reducing the need to build the third runway which may eventually degrade Hong Kong’s air quality in the long run [30]. Aircraft taxing at the airport also produces a significant amount of air pollutants that affect human health [31].
China announced the One Belt-One Road Initiative with an aim to facilitate more efficient international trade and better economic integration between countries along the Belt and the Road in late 2013 [32]. Although most of the works are in progress, it is believed that this initiative will encourage different countries and logistics firms to rethink how they import and export goods and services. With a much more efficient infrastructure for container terminals and high-speed freight trains between countries, as well as improved information sharing in global supply chains [33], some freight cargoes could switch to sea and land transports from air transport, thus reducing GHG emissions from the logistics sector.
5. Conclusions
Although the triple bottom line view of sustainability is widely accepted, there is scant literature exploring the triple bottom line analysis of an activity quantitatively using objective data [7], let alone the analysis of any industry, either locally or globally. This paper has presented a triple bottom line analysis of Hong Kong’s logistics sector because Hong Kong is one of the busiest ports in the world, handling about 5.9% of the world’s airfreight transport and 3.3% of the world’s container port traffic in 2014. Based on the data for the period 2000 to 2014, it has been found that the sector’s economic contribution (i.e., EcoPerf) was about 4.2% of Hong Kong’s total GDP and had a social benefit (i.e., SocPerf) of about 5.6% of Hong Kong’s total employment. However, the sector produced an average of 37.4% of Hong Kong’s total GHG emissions. When the values of EnvPerf were determined, the corresponding mean value was found to be 2.69. A linear regression analyses showed that there was no significant change in EnvPerf during the period of 2000–2014, while there were weak but significant downward trends in EcoPerf and SocPerf. This suggests that the government should work with logistics firms, container terminal operators, and air cargo terminal operators to improve their efficiency, effectiveness, and productivity. For instance, a fuzzy-induced linguistic approach as suggested by Rodger and George could be applied by the organizations concerned for determining triple bottom line supply chain solutions [12]. In this way, the logistics sector can produce more economic value and simultaneously reduce GHG emissions.
Acknowledgments
This study was supported in part by The Hong Kong Polytechnic University (Project Code: G-YBHF).
Author Contributions
Wai-Ming To and Peter Ka-Chun Lee conceived the study; Wai-Ming To performed the data collection and analyzed the data; Wai-Ming To and Peter Ka-Chun Lee wrote the paper. Both authors read and approved the final version of the manuscript.
Conflicts of Interest
The authors declare no conflict of interest.
References
- Arvis, J.; Saslavsky, D.; Ojala, L.; Shepherd, B.; Busch, C.; Raj, A. Connecting to Compete 2014: Trade Logistics in the Global Economy; The World Bank: Washington, DC, USA, 2014; pp. 1–3. [Google Scholar]
- Dai, Y.; Gao, H.O. Energy consumption in China’s logistics industry: A decomposition analysis using the LMDI approach. Transp. Res. Part D Trans. Environ. 2016, 46, 69–80. [Google Scholar] [CrossRef]
- Grant, D.B.; Trautrims, A.; Wong, C.Y. Sustainable Logistics and Supply Chain Management; KoganPage: London, UK, 2015; pp. 16–27. [Google Scholar]
- Faccio, M.; Gamberi, M. New city logistics paradigm: From the “last mile” to the “last 50 miles” sustainable distribution. Sustainability 2015, 7, 14873–14894. [Google Scholar] [CrossRef]
- Klumpp, M. To green or not to green: A political, economic and social analysis for the past failure of green logistics. Sustainability 2016, 8, 441. [Google Scholar] [CrossRef]
- Abbasi, M.; Nilsson, F. Developing environmentally sustainable logistics: Exploring themes and challenges from a logistics service providers’ perspective. Transp. Res. Part D Transp. Environ. 2016, 46, 273–283. [Google Scholar] [CrossRef]
- Zachary, D.S. On the sustainability of an activity. Sci. Rep. 2014, 4, 5215. [Google Scholar] [CrossRef] [PubMed]
- Fauzi, H.; Svensson, G.; Rahman, A.A. “Triple bottom line” as “sustainable corporate performance”: A proposition for the future. Sustainability 2010, 2, 1345–1360. [Google Scholar] [CrossRef]
- Kuhlman, T.; Farrington, J. What is sustainability? Sustainability 2010, 2, 3436–3448. [Google Scholar] [CrossRef]
- Miller, P.; de Barros, A.G.; Kattan, L.; Wirasinghe, S.C. Analyzing the sustainability performance of public transit. Transp. Res. Part D Transp. Environ. 2016, 44, 177–198. [Google Scholar] [CrossRef]
- Lee, J.S.; Kim, S.K.; Lee, S.Y. Sustainable supply chain capabilities: Accumulation, strategic types and performance. Sustainability 2016, 8, 503. [Google Scholar] [CrossRef]
- Rodger, J.A.; George, J.A. Triple bottom line accounting for optimizing natural gas sustainability: A statistical linear programming fuzzy ILOWA optimized sustainment model approach to reducing supply chain global cybersecurity vulnerability through information and communications technology. J. Clean. Prod. 2017, 142, 1931–1949. [Google Scholar]
- The World Bank. Transport; The World Bank: Washington, DC, USA, 2016; Available online: http://www.worldbank.org/en/topic/transport (accessed on 1 December 2016).
- Hong Kong International Airport. Air Cargo; Hong Kong International Airport: Hong Kong, China, 2016; Available online: http://www.hongkongairport.com/eng/business/about-the-airport/air-cargo/air-cargo-intro.html (accessed on 1 December 2016).
- Hong Kong Marine Department. Ranking of Container Ports of the World; Hong Kong Marine Department: Hong Kong, China, 2016. Available online: http://www.mardep.gov.hk/en/publication/pdf/portstat_2_y_b5.pdf (accessed on 1 December 2016).
- Sikdar, S.K. Sustainable development and sustainability metrics. AIChE J. 2003, 49, 1928–1932. [Google Scholar] [CrossRef]
- Graubner, C.A.; Pelzeter, A.; Pohl, S. A new approach to measure sustainability in German facility management. Facilities 2016, 34, 28–42. [Google Scholar] [CrossRef]
- Landerretche, O.; Leiva, B.; Vivanco, D.; López, I. Welcoming uncertainty: A probabilistic approach to measure sustainability. Ecol. Indic. 2017, 72, 586–596. [Google Scholar] [CrossRef]
- Mickwitz, P.; Melanen, M. The role of co-operation between academia and policymakers for the development and use of sustainability indicators–a case from the Finnish Kymenlaakso Region. J. Clean. Prod. 2009, 17, 1086–1100. [Google Scholar] [CrossRef]
- Finkbeiner, M.; Schau, E.M.; Lehmann, A.; Traverso, M. Towards life cycle sustainability assessment. Sustainability 2010, 2, 3309–3322. [Google Scholar] [CrossRef]
- Beames, A.; Broekx, S.; Lookman, R.; Touchant, K.; Seuntjens, P. Sustainability appraisal tools for soil and groundwater remediation: How is the choice of remediation alternative influenced by different sets of sustainability indicators and tool structures? Sci. Total Environ. 2014, 470–471, 954–966. [Google Scholar] [CrossRef] [PubMed]
- To, W.M. Greenhouse gases emissions from the logistics sector: The case of Hong Kong, China. J. Clean. Prod. 2015, 103, 658–664. [Google Scholar] [CrossRef]
- Clift, R.; Wright, L. Relationships between environmental impacts and added value along the supply chain. Technol. Forecast. Soc. Chang. 2000, 65, 281–295. [Google Scholar] [CrossRef]
- US. Department of Commerce. Social Indicators 1973; U.S. Department of Commerce: Washington, DC, USA, 1973.
- Noll, H.H. Social indicators and Quality of Life research: Background, achievements and current trends. In Advances in Sociological Knowledge; Genov, N., Ed.; Springer Fachmedien Wiesbaden GmbH: Wiesbaden, Germany, 2004; pp. 151–181. [Google Scholar]
- Hong Kong Census and Statistics Department. The Hong Kong Annual Digest of Statistics; Hong Kong Census and Statistics Department: Hong Kong, China, 2016.
- Hong Kong Census and Statistics Department. The Four Key Industries and Other Selected Industries in the Hong Kong Economy; Hong Kong Census and Statistics Department: Hong Kong, China, 2016.
- Eggleston, S.; Buendia, L.; Miwa, K.; Ngara, T.; Tanabe, K. (Eds.) 2006 IPCC Guidelines for National Greenhouse Gas Inventories, Volume 2—Energy; Institute for Global Environmental Strategies for the Intergovernmental Panel on Climate Change: Kanagawa, Japan, 2006; pp. 8–68. Available online http://www.ipcc-nggip.iges.or.jp/public/2006gl/vol2.html (accessed on 1 December 2016).
- HKTDC Research. Air Transport Industry in Hong Kong; HKTDC Research: Hong Kong, China, 2016; Available online: http://hong-kong-economy-research.hktdc.com/business-news/article/Hong-Kong-Industry-Profiles/Air-Transport-Industry-in-Hong-Kong/hkip/en/1/1X000000/1X0018JT.htm (accessed on 1 December 2016).
- To, W.M. Association between energy use and poor visibility in Hong Kong SAR, China. Energy 2014, 68, 2–20. [Google Scholar] [CrossRef]
- Levine, B.S.; Gao, H.O. Aircraft taxi-out emissions at congested hub airports and implications for aviation emissions reduction in the United States. In Proceedings of the Transportation Research Board 86th Annual Meeting, Washington, DC, USA, 21–25 January 2007.
- Chia, S.Y. ASEAN economic integration and physical connectivity. Asian Econ. Pap. 2016, 15, 198–215. [Google Scholar] [CrossRef]
- Koliba, C.; Wiltshire, S.; Scheinert, S.; Turner, D.; Zia, A.; Campbell, E. The critical role of information sharing to the value proposition of a food systems network. Public Manag. Rev. 2017, 19, 284–304. [Google Scholar] [CrossRef]
Figure 1.
Hong Kong’s annual cargo throughput from 2000 to 2014.

Figure 2.
Sea freight cargo via Hong Kong in 2014 (in kilotons) and the associated GHG emissions in million tons of CO2–eq.
Figure 2.
Sea freight cargo via Hong Kong in 2014 (in kilotons) and the associated GHG emissions in million tons of CO2–eq.

Figure 3.
Air freight cargo via Hong Kong in 2014 (in kilotons) and the associated GHG emissions in million tons of CO2–eq.
Figure 3.
Air freight cargo via Hong Kong in 2014 (in kilotons) and the associated GHG emissions in million tons of CO2–eq.

Figure 4.
Environmental, economic, and social performance of the logistics sector from 2000 to 2014.
Figure 4.
Environmental, economic, and social performance of the logistics sector from 2000 to 2014.

| Cargo from (kT) | Cargo to (kT) | Dist. (km) | CO2–eq (kT) | |||
|---|---|---|---|---|---|---|
| Asia | 151,400 | 93731 | ||||
| Shanghai | 40,753 | 9922 | 1461 | 896 | ||
| Guangzhou | 53,517 | 45,064 | 152 | 181 | ||
| Taiwan | 7188 | 4172 | 872 | 120 | ||
| Japan | 10,129 | 5033 | 2961 | 543 | ||
| Singapore | 7991 | 2385 | 2630 | 330 | ||
| Korea | 5459 | 2425 | 2271 | 217 | ||
| others | 26,363 | 24,730 | 1461 | 903 | ||
| North America | 12,014 | 7288 | ||||
| Canada | 1986 | 1277 | 10,673 | 421 | ||
| USA | 10,028 | 6011 | 11,747 | 2280 | ||
| Europe | 8610 | 3894 | ||||
| Germany | 1818 | 907 | 18,390 | 606 | ||
| Netherlands | 1108 | 833 | 18,103 | 425 | ||
| UK | 1055 | 563 | 17,564 | 344 | ||
| others | 4629 | 1591 | 18,390 | 1384 | ||
| Cent. and South Am. | 5932 | 4327 | 19,878 | 2468 | ||
| Australia | 2550 | 1785 | 8943 | 469 | ||
| Africa | 1499 | 1125 | 12,014 | 382 | ||
| Mid East | 1315 | 1106 | 9303 | 273 | ||
| East Europe | 865 | 296 | 14,829 | 208 | ||
| Total: | 184,185 | 113,552 | 12,450 | |||
| Cargo from (kT) | Cargo to (kT) | Dist. (km) | CO2–eq (kT) | |
|---|---|---|---|---|
| Asia | 1050 | 1443 | 2763 | 6544 |
| North America | 194 | 553 | 12,993 | 9220 |
| Europe | 216 | 429 | 9116 | 5586 |
| Mid East | 68 | 305 | 6358 | 2253 |
| Australia | 57 | 63 | 7349 | 838 |
| Total: | 1585 | 2793 | 24,441 |
| Cargo from (kT) | Cargo to (kT) | Dist. (km) | CO2–eq (kT) | |
|---|---|---|---|---|
| Shenzhen | 8471 | 4991 | 100 | 161 |
| Dongguan | 4025 | 2546 | 180 | 142 |
| Guangzhou | 811 | 441 | 250 | 37 |
| Huizhou | 766 | 634 | 250 | 42 |
| others | 946 | 579 | 250 | 46 |
| 15,019 | 9191 | 428 |
| Fuel | Consumption | Calorific Value | Emission Factor CO2–eq (kT/TJ) | CO2–eq (kT) |
|---|---|---|---|---|
| Aviation gasoline | 6,959,479 kl | 0.0330 TJ/kl | 0.0715 | 16,421 |
| Motor gasoline | 497,730 kl | 0.0342 TJ/kl | 0.0693 | 1180 |
| Gas oil, diesel oil | 4,090,929 kl | 0.0386 TJ/kl | 0.0741 | 11,701 |
| Fuel oil | 6,309,426 kl | 0.0397 TJ/kl | 0.0774 | 19,387 |
| Liquefied petroleum gas | 398,240 T | 0.0496 TJ/T | 0.0631 | 1246 |
| Natural gas | 1,872,188 T | 0.0544 TJ/T | 0.0561 | 5714 |
| Coal | 13,795,832 T | 0.0264 TJ/T | 0.0964 | 35,110 |
| Total: | 90,759 |
© 2017 by the authors. Licensee MDPI, Basel, Switzerland. This article is an open access article distributed under the terms and conditions of the Creative Commons Attribution (CC BY) license ( http://creativecommons.org/licenses/by/4.0/).
Share and Cite
MDPI and ACS Style
To, W.-M.; Lee, P.K.C. A Triple Bottom Line Analysis of Hong Kong’s Logistics Sector. Sustainability 2017, 9, 388. https://doi.org/10.3390/su9030388
AMA Style
To W-M, Lee PKC. A Triple Bottom Line Analysis of Hong Kong’s Logistics Sector. Sustainability. 2017; 9(3):388. https://doi.org/10.3390/su9030388
Chicago/Turabian StyleTo, Wai-Ming, and Peter K. C. Lee. 2017. "A Triple Bottom Line Analysis of Hong Kong’s Logistics Sector" Sustainability 9, no. 3: 388. https://doi.org/10.3390/su9030388
Note that from the first issue of 2016, this journal uses article numbers instead of page numbers. See further details here.