
Competitive Intelligence Analysis of Augmented Reality Technology Using Patent Information


Department of Industrial Engineering, Konkuk University, 120 Neungdong-ro, Gwangjin-gu, Seoul 05029, Korea
*
Author to whom correspondence should be addressed.
Sustainability 2017, 9(4), 497; https://doi.org/10.3390/su9040497
Submission received: 4 January 2017
/
Revised: 20 March 2017
/
Accepted: 23 March 2017
/
Published: 25 March 2017
(This article belongs to the Special Issue Big Data and Predictive Analytics for Sustainability)
Abstract
:Augmented reality has recently achieved a rapid growth through its applications in various industries, including education and entertainment. Despite the growing attraction of augmented reality, trend analyses in this emerging technology have relied on qualitative literature review, failing to provide comprehensive competitive intelligence analysis using objective data. Therefore, tracing industrial competition trends in augmented reality will provide technology experts with a better understanding of evolving competition trends and insights for further technology and sustainable business planning. In this paper, we apply a topic modeling approach to 3595 patents related to augmented reality technology to identify technology subjects and their knowledge stocks, thereby analyzing industrial competitive intelligence in light of technology subject and firm levels. As a result, we were able to obtain some findings from an inventional viewpoint: technological development of augmented reality will soon enter a mature stage, technologies of infrastructural requirements have been a focal subject since 2001, and several software firms and camera manufacturing firms have dominated the recent development of augmented reality.
1. Introduction
Augmented reality is a live direct or indirect view of a real environment where objects are augmented by computer-generated sensory input, such as sound, graphics or GPS data [1]. Therefore, augmented reality technology, which combines a real-world environment with a virtual object to extend human senses, can provide information that cannot be obtained in the real environment. In its early days, augmented reality received scant attention compared to virtual reality because technologies that can be used for augmented reality were mostly intended for virtual reality applications, including military or aeronautical simulation. However, the recent advancement of information and communication technology (ICT) and the increased popularity of smartphones has increased the attention paid to augmented reality [2,3]. The global market of augmented reality in 2014 was valued at USD 1.72 Billion and is expected to reach USD 56.8 Billion by 2020; many global firms, including Microsoft, Google, and Samsung, have shown interest in releasing various augmented reality products and services [4]. Therefore, regarding this emerging technology in the area of displays and human-computer interface that would make a mark in the near future, tracing the changing industrial competition up to the present will provide researchers and technology planners with decisive insights for further R&D.
Despite the attraction of augmented reality and its recent growth, research so far has paid little attention to identifying industrial competition information based on objective data; trend analyses in this technology have used research papers and have mostly relied on taxonomies and examined technical issues [2,5,6,7] and surveys for specific applications [8,9,10,11]. For these reasons, comprehensive views in terms of industrial competition could not addressed successfully in the prior studies, although competition trends in industry are closely related to firms’ sustainability [12]. Therefore, the aim of this study is to carry out bibliometric analyses on augmented reality technology using patents as the data source for analysis. A patent is known to provide all the available knowledge of an invention in its description and claims sections to protect the invention under the patent system [13]. In addition, patents are considered to be the most prolific technology source that contains recent technical information because most patent applications are published within 18 months after their first filing [14]. Therefore, patents have been widely used to identify recent technology trends of high-technologies [14], forecast emerging technologies [15,16], discover new technology opportunities [13,17], design technology roadmaps [18] and identify firms’ R&D strategies and strategic changes [19,20].
In the present study, we suggest a patent-based competitive intelligence analysis framework and its application. Specifically, we apply a semantic topic modeling approach, or Latent Dirichlet Allocation (LDA) [21], to massive patents to identify technology subjects from text data contained in augmented reality patents. Subsequently, we analyze industrial competition intelligence using the semantic quantity of technological knowledge from the two perspectives: (1) technology subject level; and (2) firm level. Technology subject-level analysis determines industrial competition based on the measurement of technological knowledge stocks (TKSs) on the technology subjects identified; this paper observes the subjects’ changing TKSs and their concentration, then illuminates the historical and current technical focuses over time. The firm-level analysis measures the TKSs of firms to produce visual maps to identify the dynamic patenting trends among the firms. We expect that this study will provide a comprehensive understanding of augmented reality’s evolving panorama and that it will assist technology experts in academia and industry as they determine R&D directions in the near future. In addition, our research with some indices and visuals can be implemented to obtain massive technical data, so it can be used as a monitoring tool for rapidly evolving high-technologies.
The organization of this paper is as follows: we present an overview of augmented reality, followed by an overview of patent data, a description of our research methodology, the results from industrial competition intelligence analysis, and conclusions with further research topics.
2. Augmented Reality: Technical Overview and the Potential as a Sustainable Business Solution
Augmented reality technology extends human sensory experiences in various ways by blurring the distinction between objects or environments in the real world and computer generated virtual objects. Augmented reality can be implemented by connecting computer systems to human senses, such as sight, hearing, touch, and smell; recently, the application areas of this technology has been extended from the laboratory to industrial sectors. Augmented reality smart glasses, including Google glass and Microsoft Holo-lens, are one of the applications that are receiving great attention, although they have not yet released in the commercial market [22]. Another application is “Pokemon Go” which is a well-known mobile game all of ages can enjoy [23]. In addition, some studies consider augmented reality technology as a marketing tool to support enterprises’ sustaining growth [24].
According to the reality–virtuality continuum [25], augmented reality belongs to part of mixed reality (Figure 1); virtual objects are used in both augmented reality and virtual reality, while they differ in that virtual reality replaces the whole real environment with a simulated environment and augmented reality supplements the real environment by adding virtual objects. Therefore, augmented reality is defined as any system that has the following three characteristics: (1) combines real and virtual; (2) interactive in real time; and (3) registered in three dimensions [26].
Since Ivan Sutherland created the head-mounted display (HMD) system, named “the Sword of Damocles” in 1968, augmented reality has been researched under projects related to wearable computing technology by leading research institutes, including National Aeronautics and Space Administration and Massachusetts Institute of Technology, during the 1970s and 1980s. In the 1990s, Boeing researcher Tom Caudell first coined the term “augmented reality” to describe a digital display that blended virtual graphics onto a physical reality. Since then, researchers from the United States and Japan finally invented new technologies that track the movement and position of objects using markers and that combine 3D graphics with real images. These technologies acted as an excellent catalyst for research and interest in augmented reality.
According to the general classification, major technology subjects of augmented reality are classified into four groups: (1) displays; (2) tracking sensors and approaches; (3) user interface and interaction; and (4) other requirements of augmented reality [7]. First, display technology can be head-worn, hand-held, and spatial according to the positioning. Second, tracking sensors and approaches become the basis for modeling environments and tracking the movements of users and objects. Third, the user interface and its interaction are used to recognize user motions and voices and represent them. Finally, other requirements include infrastructural technologies, such as computational framework, wireless networking, data storage, and access technology and content.
Augmented reality has been finding their way in various application areas, so it is considered as a business solution for firms’ sustainable development and growth. In fact, augmented reality technologies are now innovatively changing various industries, with applications in education [27,28], entertainment [29], medical [30], and military [31]. In particular, augmented reality can be used effectively in engineering projects, testing new ideas and eliminating those which cannot work properly in specific environments. In architecture, augmented reality is receiving attraction as a contemporary way of thinking about both environmental sustainability and architecture [32], and integration of building information modeling and augmented reality for architectural visualization allows designers to explore alternative designs and technologies [33] and owners and property sellers to gain interactive experiences [34]. Some augmented reality applications are also finding their way into the supply chain management [35]; for example, SAP’s warehouse operation system adopted smart glasses to provide real-time data about products and materials.
Despite technical and economic challenges, augmented reality is believed to be a promising technology that will have a more profound effect on the way in which we develop and interact with future computers in connection with artificial intelligence and cybernetics [11]. Currently, many firms are actively applying for patents with economic value and their competing patents increasingly tend to converge with technologies in other fields; for these reasons, patent analysis studies have been used to forecast technology success [36], monitor emerging technologies [37] and identify the relationship between innovation-orientation and industry growth [38]. Therefore, our patent-based competitive intelligence would help technology planners monitor competition trends in augmented reality and understand the technology strategies of competing firms.
3. Patent Collection and Preprocessing
The collection of augmented reality patents is the prerequisite for our study. To this end, we follow a patent collection process consisting of three steps: (1) defining technology keywords; (2) collecting initial patents from a patent database using a patent retrieval query; and (3) obtaining valid patents by eliminating irrelevant patents.
Building on our literature survey, we defined the keywords of sub-technologies that constitute augmented reality, including displays, tracking sensors, user interface, and other infrastructural requirements. We then construct a patent retrieval query (Table 1). In the present work, we located initial patents in the United States Patent and Trademark Office (USPTO) database via WIPSON (http://wipson.com), a commercial patent database web service, during the period between 1974 and 2014. We then stored the patents in the electronic file formats of Microsoft Excel and text file. The initial patent set contains various bibliographic data, including application numbers, application dates, and patent classification codes, as well as textual data, including titles, abstracts, specifications and claims. Some of the initial patents matched with our retrieval query might be irrelevant to augmented reality technology. These irrelevant patents, called noise patents, should be filtered out for patent preparation. Two of the authors who have researched augmented reality carried out this filtering process. As a result, the elimination of noise patents yielded a total of 3595 valid patents from the initial 7726 patents returned by our query.
Textual sections were then prepared for our LDA-based semantic topic modeling analysis. Some studies suggested that the human generated titles and abstracts are the most significant and concise textual information in a patent [39], while others use claim information which states the technical components that applicants want to protect legally [40]. Therefore, patent titles, abstracts, and claims of the valid patents were used in the present study. Although the textual sections of each patent are collected, they might include irrelevant terms, called stop-words, such as “invention”, “method”, “said”, and “thereof”. Technology subject extraction by our methodology can be impeded by such irrelevant terms; a list of English stop-words (http://www.ranks.nl/stopwords) were thus referenced in this study and the list was updated by adding irrelevant terms and terms that are too general. By eliminating irrelevant terms from the textual sections, the patent text was finally prepared for our semantic topic modeling analysis.
4. Methodology
This section explains the specific methods used for our research goal of identifying technology subjects and analyzing industrial competition intelligence in augmented reality. As stated previously, knowledge in augmented reality is being increasingly invented and its resulting patents are also being filed into patent databases; it has therefore become more difficult to classify and monitor industrial trends by human effort alone. Therefore, the present work employs topic modeling techniques to identify technology subjects from the text of massive patents and measure the semantic quantity of technological knowledge assigned to each of the technology subjects.
4.1. Topic Modeling to Identify Technology Subjects
To identify technology subjects from text corpora of patent documents, we utilize Latent Dirichlet Allocation (LDA), one of the topic modeling approaches. LDA was developed to model text corpora and other collections of discrete data [21]. LDA is able to find short descriptions of the members of a collection that enable efficient processing of large collections while preserving the essential statistical relationships that are useful for basic tasks such as classification, summarization, and similarity measurement. The basic idea behind LDA is that each document is a mixture of a small number of latent topics and that each word’s creation is attributable to one of the document’s topics [41].
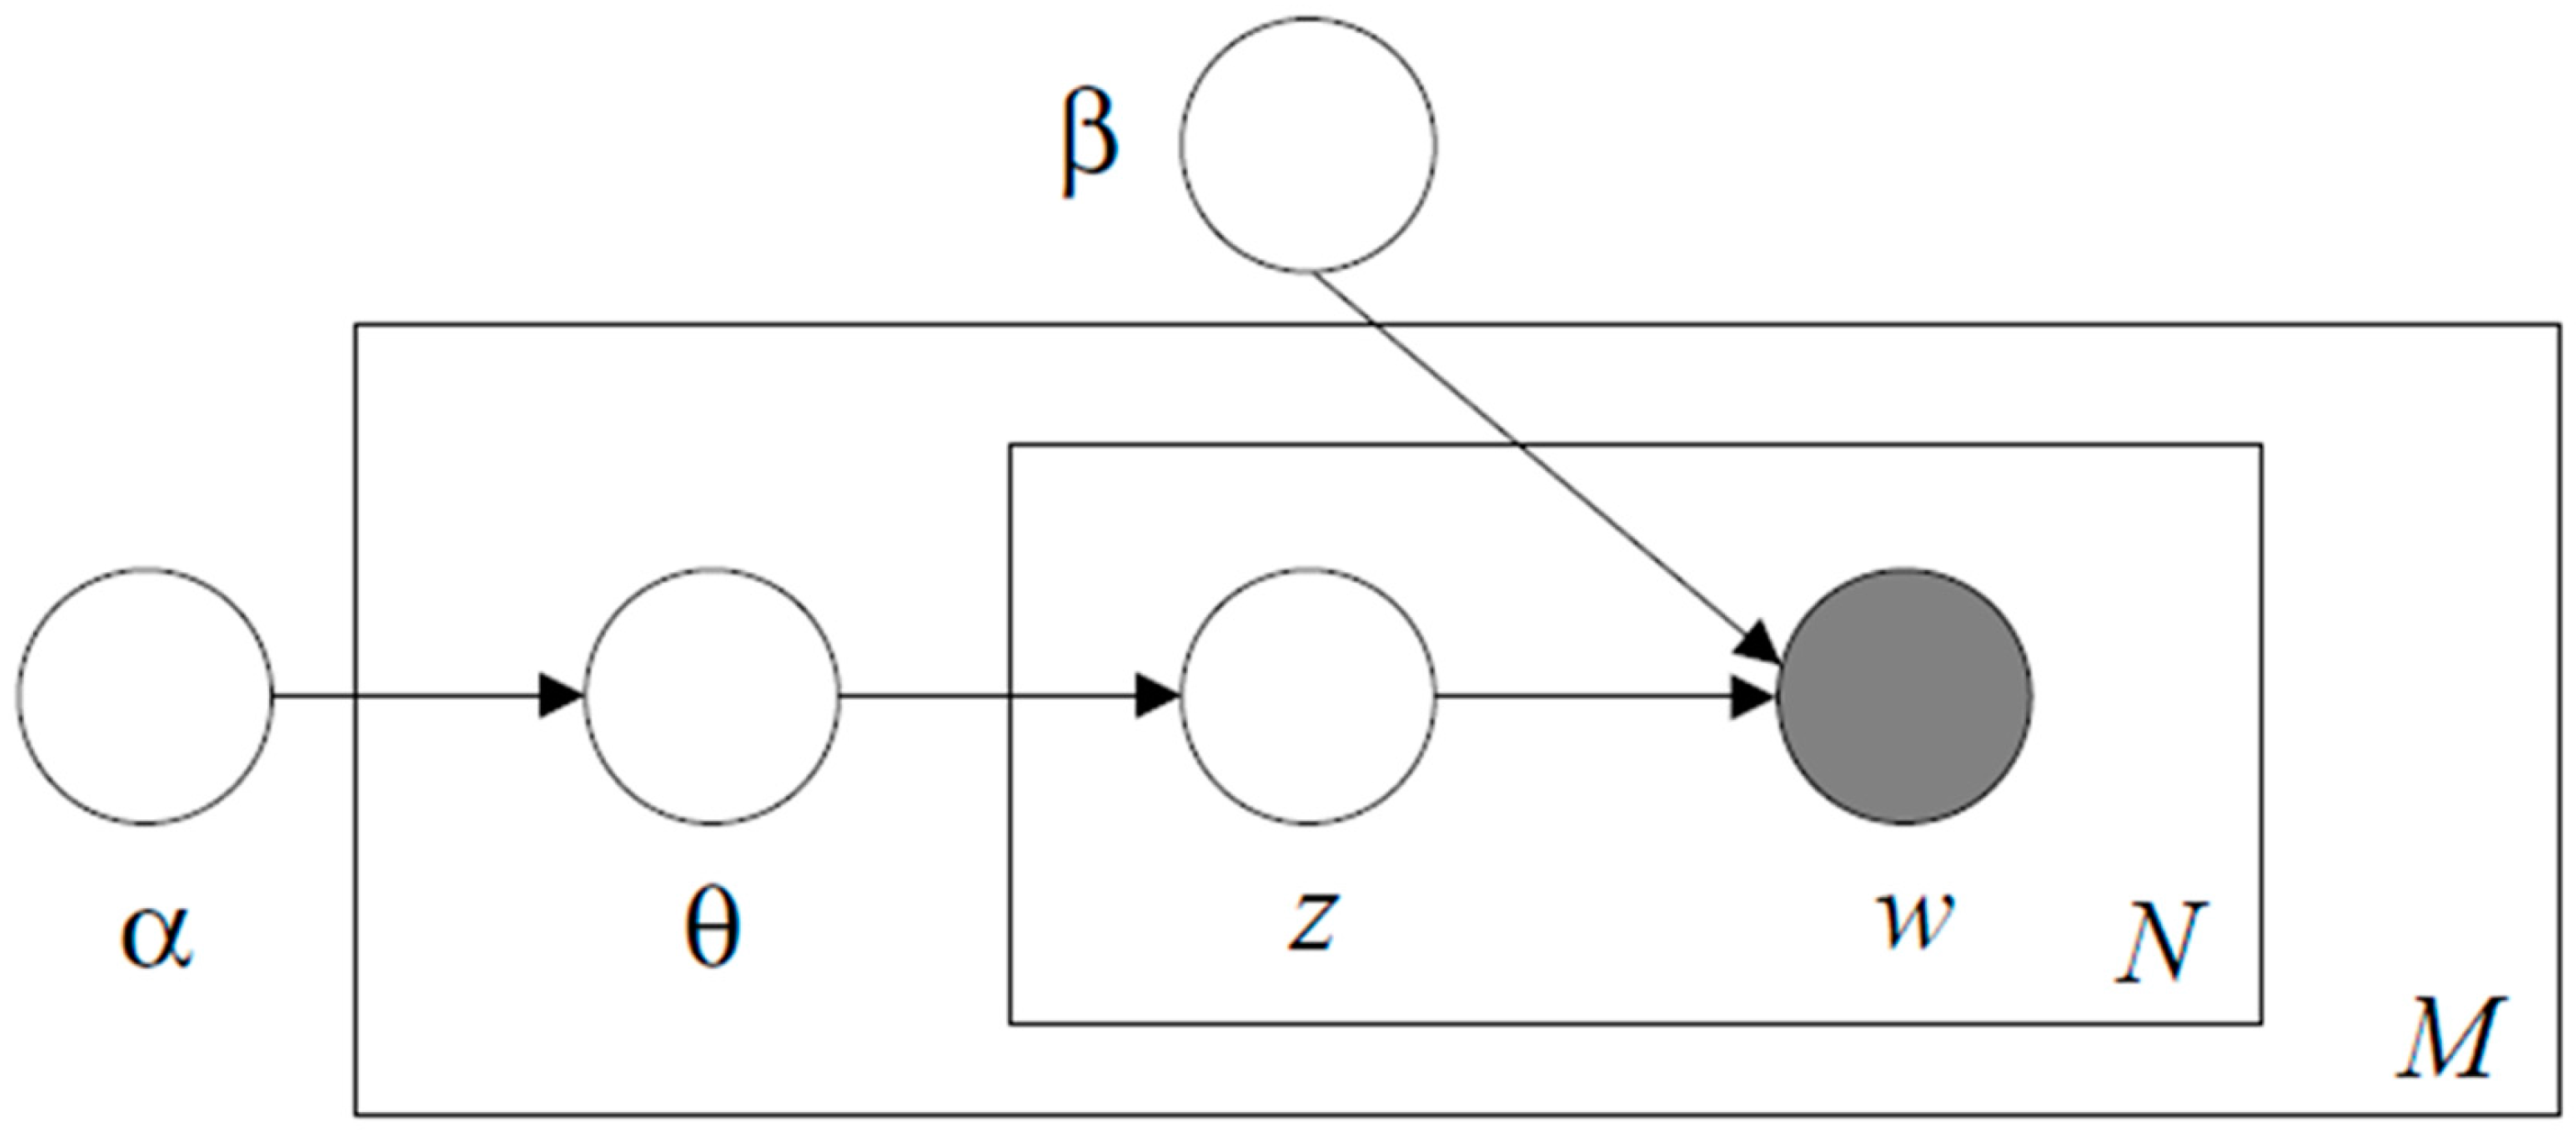
LDA follows a generative process for a corpus consisting of topics and documents, each of length (Figure 2) [21]. is the parameter of the Dirichlet prior on the per-document topic distribution, is the parameter of the Dirichlet prior on the per-topic word distribution, is the topic distribution for document (the sum of is 1.0), is the word distribution for topic , is the topic for the jth word in document , and is the specific word.
- -
- Choose , where
- -
- Choose , where
- -
- For each word position i, j, where , and
- ■
- Choose a topic
- ■
- Choose a word
Due to the usability of LDA, it has been widely applied in application studies for the analysis of large-scale corpus. LDA has been used for historical news topic identification [42], web spam filtering [43], web site and scientific article recommendation [41,44], fraud detection in telecommunications [45] and human action recognition [46]. Moreover, LDA has been applied in a number of patent-based studies to analyze technology trends in greenhouse gas reduction technology [47] and Long-Term Evolution technology [48].
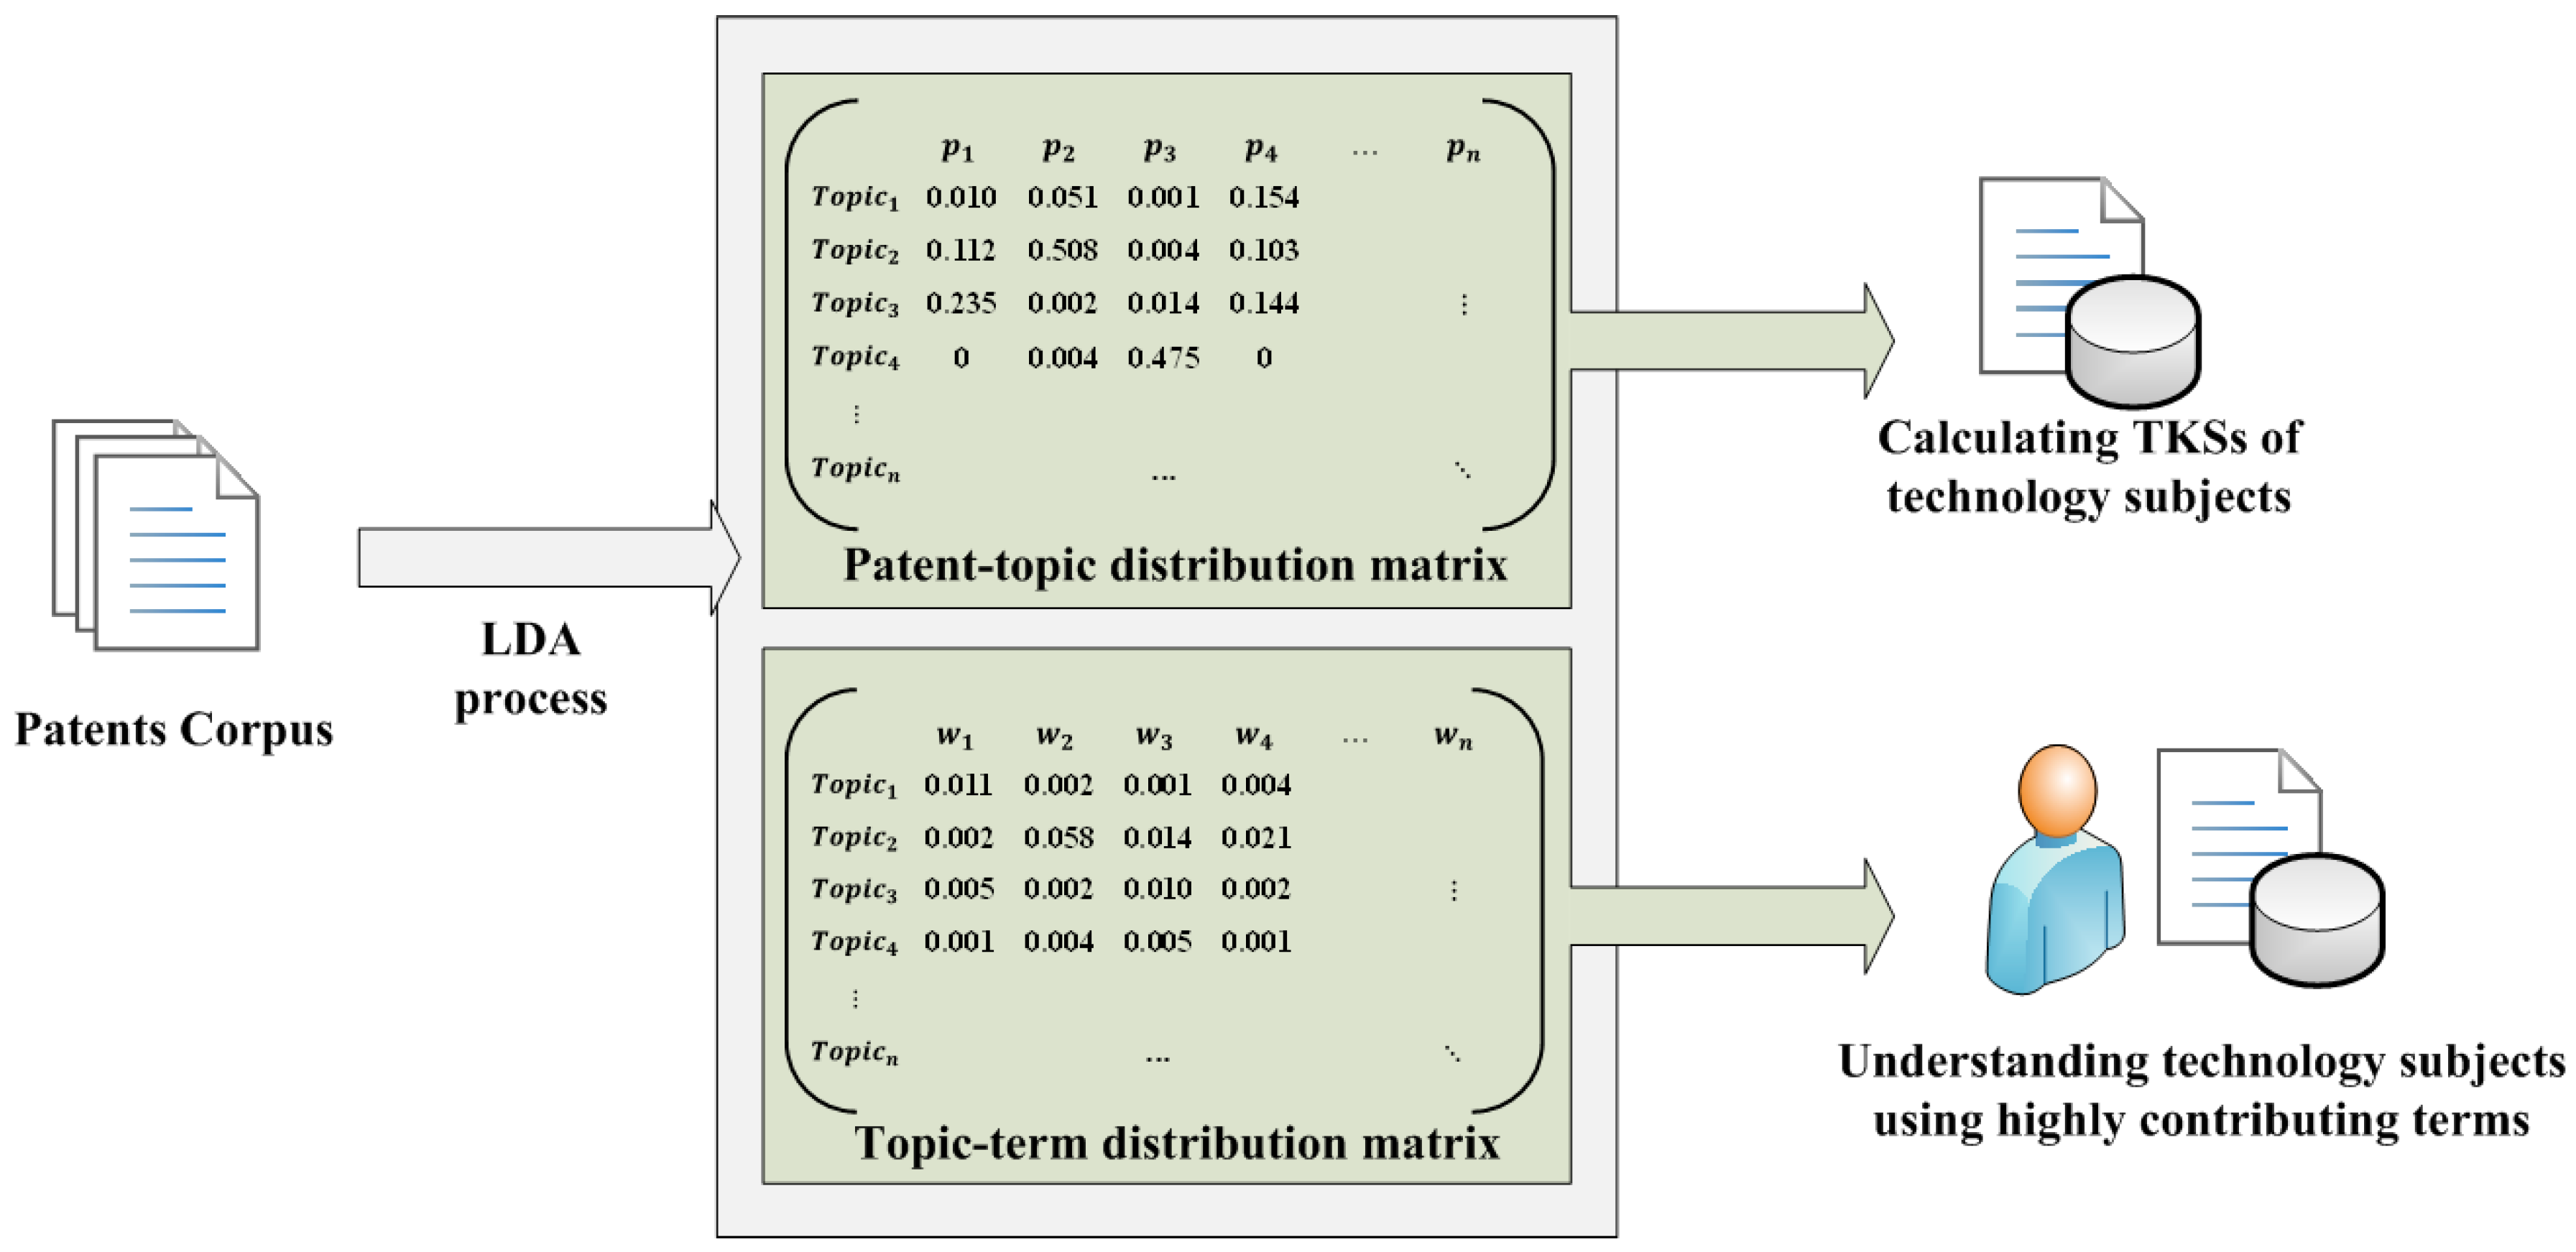
The application of LDA to patent text produces two useful outputs: topic-term distribution matrix and patent-topic distribution matrix (Figure 3). The topic-term distribution matrix contains topics that are characterized by a set of term-probability pairs, each of which represents the extent to which a term contributes to each corresponding topic. The patent-topic distribution matrix shows each patent represented as a set of topic-probability pairs, each of which represents the probability that a patent belongs to a topic. In this study, word-probability pairs of each topic (topic-term distribution vector) are used to examine technological contents that describe the topic, thereby defining the topic as a specific technology subject within augmented reality. In addition, the topic-probability pairs of each patent (patent-topic distribution vector) indicate the patent’s knowledge stocks of the topics identified, so they act as the basis to quantify the competition intelligence among technology subjects or firms.
4.2. Measurement of Technological Knowledge Stocks
Many recent firms have attempted to protect their technologies and secure their competitiveness in industry by applying for patents. This study measures the number of patents filed in a specific technology subject to identify the level of knowledge stock or competition within that technology subject. From a technical point of view, a patent can contain technical knowledge over multiple technology subjects; for example, the patent “interactive and shared augmented reality system and method having local and remote access” (grant number US07714895) is related to both image capture and tracking (tracking approaches) and data communication (infrastructural requirements). Therefore, this study considers that technological knowledge of a patent does not always fully belong to only one technology subject, but rather can be assigned to multiple technology subjects; for example, a patent’s TKS is 1, and its belongingness can be 0.6 for tracking approaches and 0.4 for infrastructural requirements.
To deal with the partial inclusion of patents over technology subjects, this study uses the patent-topic distribution matrix produced in the previous section. Topic-probability pairs of a patent can be used to calculate the quantity of technological knowledge assigned to each technology subject by the patent (Figure 3). We consider the extent to which a patent belongs to a technology subject as the quantity of the patent’s TKS to the technology subject. Then, the total TKS of a technology subject indicates the amount of technological knowledge that is accumulated in the subject by various applicants’ patents; it is thus able to explain the degree of technological competition within the technology subject. The total TKS of a firm of a technology subject can be defined as:
where is the patents possessed by firm and is the probability that patent belongs to technology subject . In this study, the degree of technological competition in augmented reality is quantified by calculating the total TKS values according to the technology subject and applicant, and subsequently tracking historical and current competition information over time using various indices and visual maps.
5. Competitive Intelligence Analysis in Augmented Reality
This section explains the process and results of competitive intelligence analysis in augmented reality, including technology subject determination within augmented reality by LDA approach to patents, followed by competitive intelligence analysis at the levels of technology subject and firm.
5.1. Identifying Technology Subjects in Augmented Reality Technology
The first task of our analysis is to determine the proper number of topics for LDA processing. Each of the topics identified by LDA becomes a technology subject in augmented reality and is then used as the basis to measure the TKSs for the topic and the relevant firms.
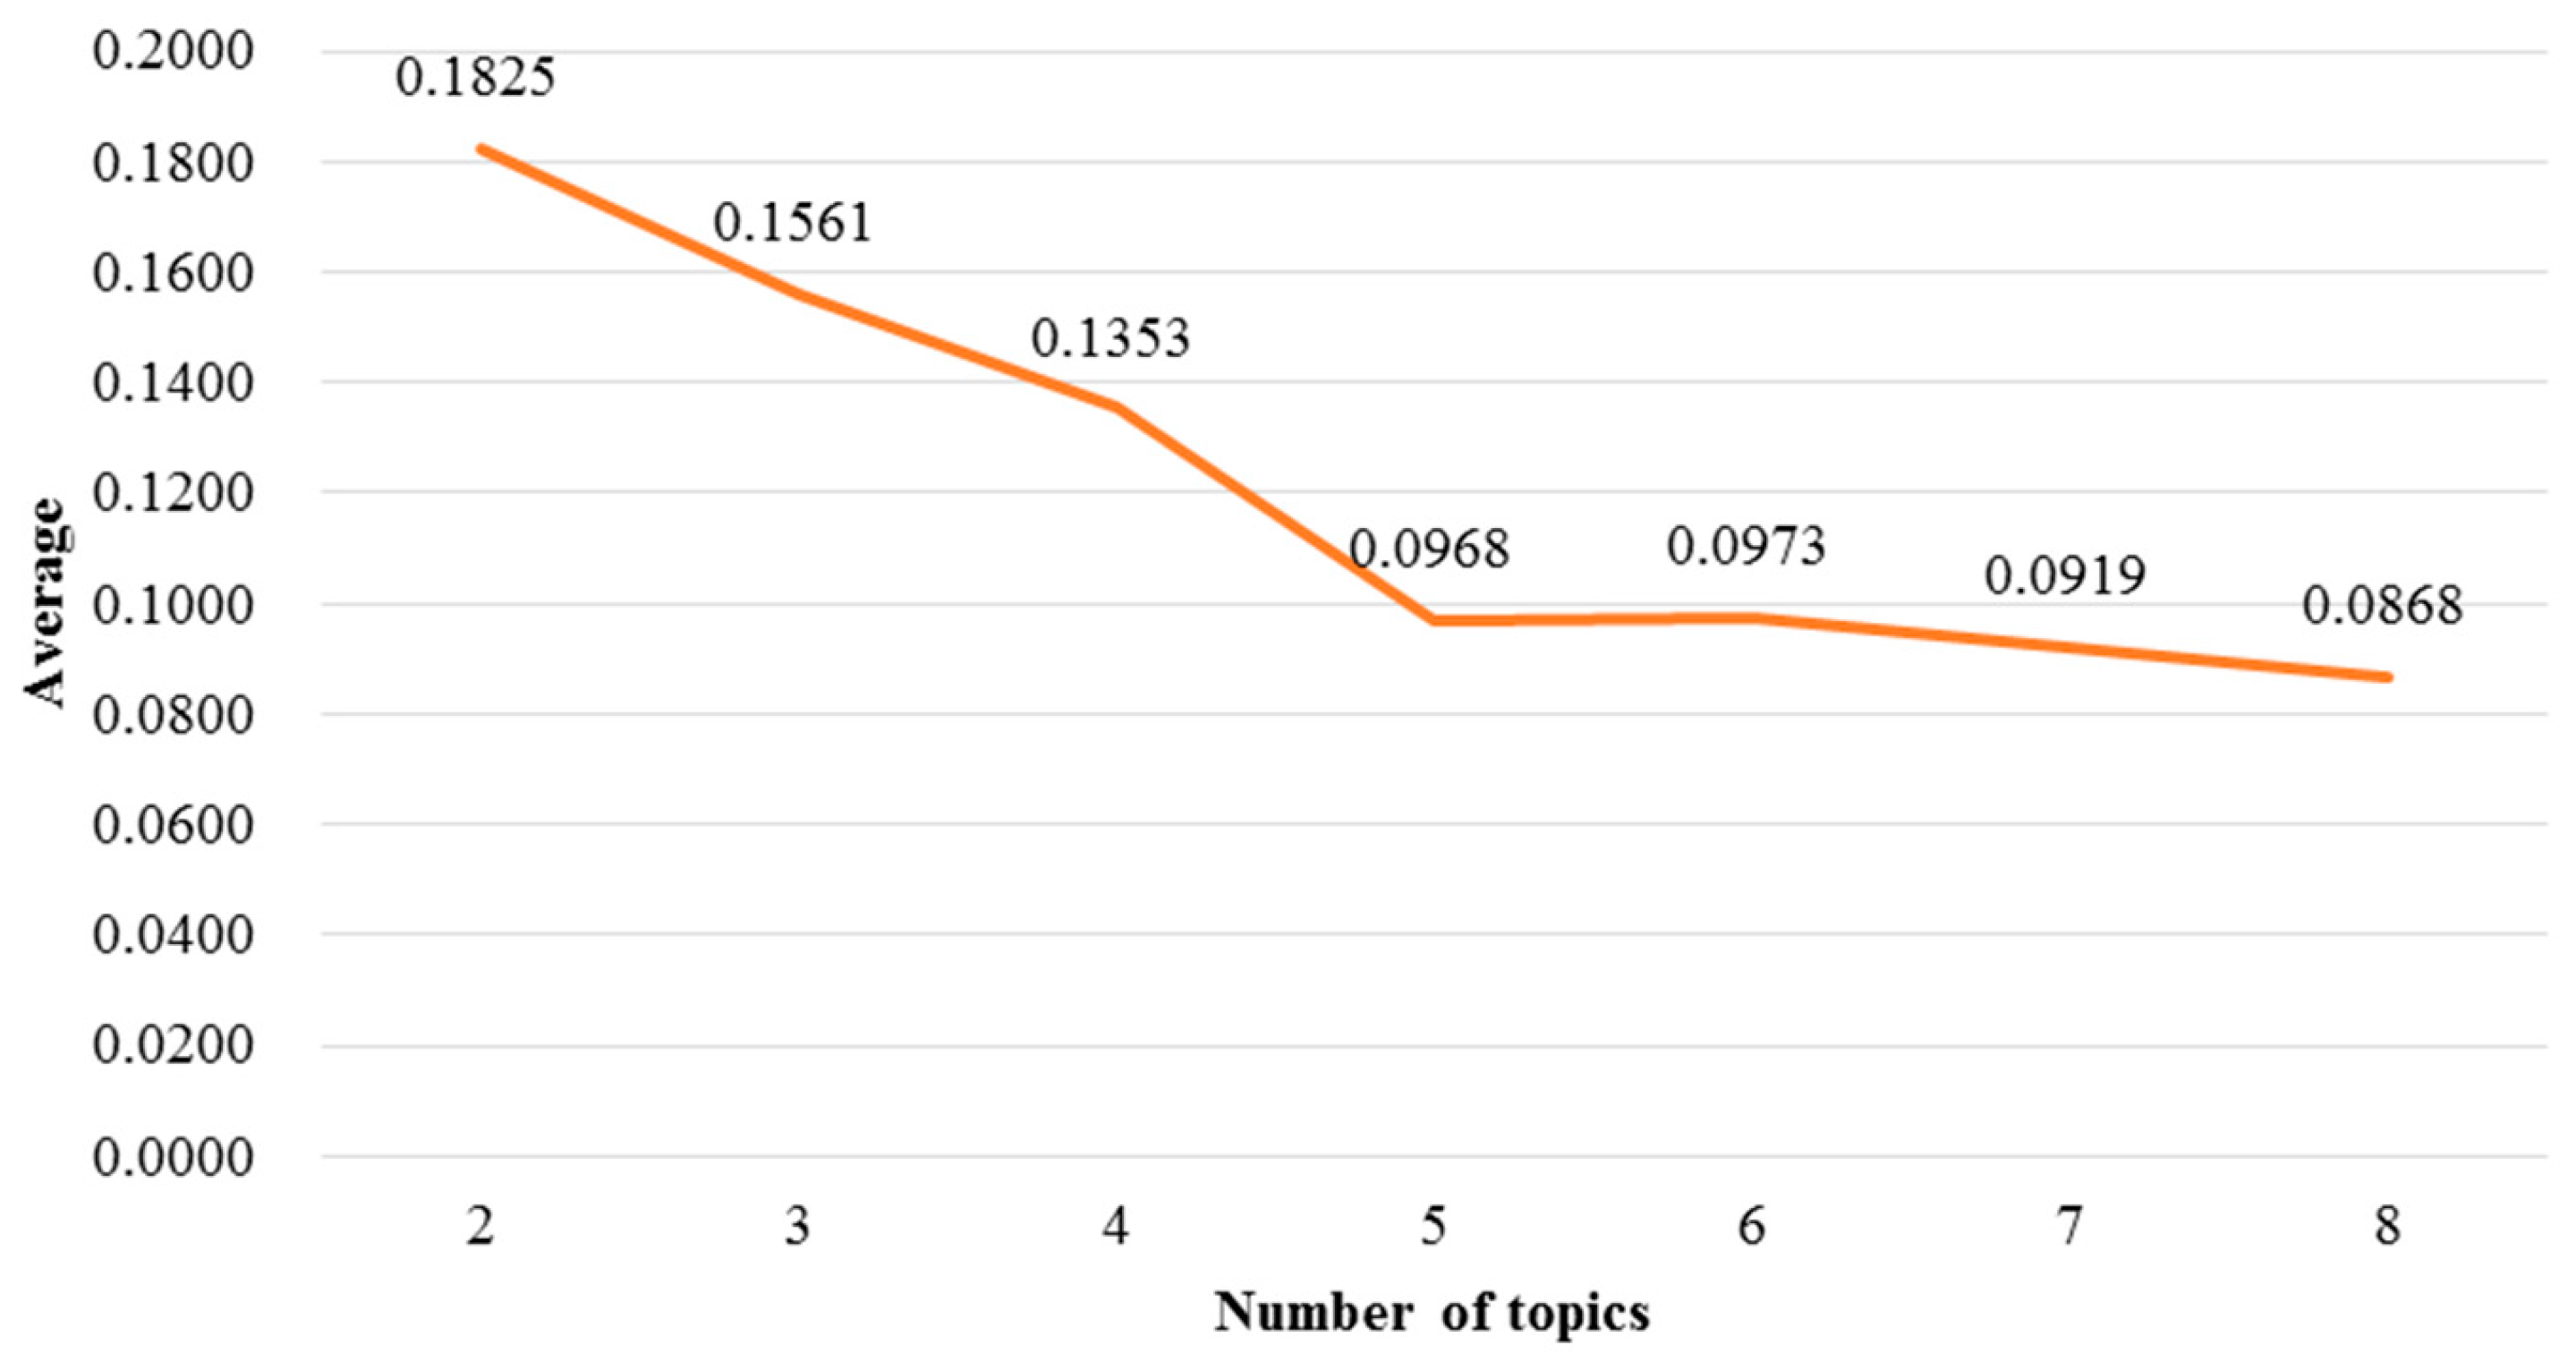
Several techniques can be used to select an appropriate number of topics, including the elbow method, information criterion method, and information theoretic method. Among these methods, the elbow method is adopted in this study, in which an optimal number of topics are determined by calculating the average cosine similarity value between pairs of patents by a different number of topics. We set the number of topics from two to eight and thereby observed the change in the average patent similarities (Figure 4). The average cosine similarity between all pairs of patents by the number of topics showed a tendency to decrease as the number of topics increases; the average similarity decreases rapidly until the number of topics is five, but it showed a scant decrease when the number of topics are five or more. Therefore, we concluded that five is the most appropriate number of technology subjects to classify augmented reality patents.
One output of LDA application to the valid patents of augmented reality is the term-probability pairs for the five topics identified (Table 2). Then, each topic can be interpreted as a specific technology subject within augmented reality technology by examining its major contributing terms. By comparing each topic with the technical keywords of a prior augmented reality technology classification study [7], we examined the technology subject to which each topic technically corresponds; finally, we were able to determine the five technology subjects: tracking sensors and approaches (Tracking), user interface and interaction (UI), displays (Display), head-mounted displays (HMD), and more requirements of augmented reality (Environment).
First, the major contributing terms of Topic 1 are “image”, “object”, “camera”, “position”, “plurality”, “orientation”, “location”, “sensor”, and “target”; we were thus able to conclude that Topic 1 is semantically related to the technology subject “tracking sensors and approaches”; this technology subject contains methods for identifying the location and orientation of users or target objects using various sensors. Second, Topic 2 contains some major contributing terms, including “image”, “virtual”, “user”, “information”, “object”, “position”, “configure”, “control”, and “input”; it thus likely shows methods and devices for interaction with users. The composition of these highly contributing terms is related to the configuration and control of the interface between users and virtual environments, so we concluded that Topic 2 likely corresponds to the technology subject “user interface and interaction”. Third, Topic 3 was constructed by contributing display-related terms, such as “display”, “image”, “light”, “optical”, “eye”, “source”, “lens”, “beam”, and “axis”, so we considered Topic 3 as the technology subject “display”. In particular, we found patents in Topic 3 that address methods and apparatus used for projecting augmented environments through an optic system such as lenses and beams. Fourth, Topic 4 was considered as the technology subject “HMD”. We examined the most contributing terms of Topic 4, including “display”, “head”, “image”, “mounted”, “signal”, “eye”, “light”, “view”, and “camera”. HMD, as an apparatus to display virtual or real environments synthetically, is a device mounted on the user’s head and its display part is located in front of the user’s eyes to cover their sight. Although this topic can be considered as part of the technology subject “display” [7], HMD is used in this study as a separate technology subject, by taking into consideration that many HMD-specialized patents have increasingly been filed and that HMD is a specific subject that deals with human factors [49]. Finally, Topic 5 included highly contributing terms such as “information”, “object”, “mobile”, “location”, “content”, “server”, “computer”, “communication”, and “terminal”, so it is likely related to infrastructural components, including networks, contents, architecture, and frameworks; in particular, the terms “content”, “server”, “computer”, and “communication” were not major contributing terms in the other topics. Therefore, we were able to interpret Topic 5 as the technology subject “more requirements of augmented reality”. A graphical explanation of these five topics is presented in Figure 5. Building on the identification result of technology subjects, we analyze industrial competitive intelligence at the levels of technology subject and firm in the next two sub-sections.
5.2. Technology Subject-Level Competitive Intelligence Analysis
For technology subject-level analysis, we organized the annual TKS values of technology subjects between 1974 and 2014 using Equation (1) (Table 3 and Figure 6). The total number of patents filed during this period is 3595 and the total TKS values for the five technology subjects were 630.4453 (17.54%) for the subject “Tracking”, 708.9484 (19.70) for the subject “UI”, 740.8295 (20.65%) for the subject “Display”, 583.0671 (16.26%) for the subject “HMD”, and 931.7099 (25.85%) for the subject “Environment”.
Patent application statistics for all technology subjects can be used to identify the development stage of augmented reality technology. As mentioned in various studies, a system passes sequentially through several generic stages during its evolutionary life: conception, birth, infancy/growth, maturity, and retirement [14,50,51]. Each stage is marked by a focus on achieving specific technological idealities: “make it work” in the conception stage, “make it properly” in the birth stage, “maximize performance and efficiency” in the growth stage, “maximizing reliability” in the maturity stage and “minimize cost” in the retirement stage [51]. According to general statistics, augmented reality technology seems to undergo two step changes. In the early stage, technological development in augmented reality is dominated by several firms and seems to not be severe until 1992: the number of applicants = 48 and cumulative TKS value = 90 (2.50% of total TKS 3595). However, augmented reality technology had undergone its first spring during the period between 1993 and 2000. During this period, annual TKS values started to exceed 20, the cumulative annual TKS value increased up to 467 (12.99% of total TKS), and the number of applicants increased to 167. This means that technological competition by many applicants began in earnest during this period. From a technology growth aspect, we could consider the period of 1974–1992 to be a conception stage and that of 1993–2000 to be a birth stage. Next, the second step change appears during the period between 2001 and 2012. During this period, the annual TKS values first exceeded 100 and the cumulative annual TKS values increased to 2725 (75.80% of total TKS): the sum of the annual TKS values during the period = 2258 (62.81% of total TKS) and the number of applicants = 906. Interestingly, the annual TKS values approach their peak (annual TKS = 523) in 2012 and started to decrease slowly after 2012. This tendency indicates the typical characteristics of the latter half of the growth stage according to the technology growth life cycle, and a shift is likely to occur soon toward the maturity stage. This finding can be an early warning in terms of the technical focus for further R&D. In the maturity and retirement stages, firms usually compete for the last few incremental improvements to achieve the upper limit of technical advances, particularly regarding reliability and cost. According to system innovation theories, new functions and efficiencies of a system are achieved mainly through inventions during the birth and growth stages, while the reliability and cost reduction problems are handled during the maturity and retirements stages [51]. Therefore, taking into consideration the current stage of augmented reality, researchers and R&D planners in academia and industry should, at this time, focus on technology developments related to maximizing the reliability of augmented reality devices. Furthermore, an early transition toward minimizing costs could be a good R&D strategy for researchers; at this stage, research and inventions will compete for technical focuses, including the mass production of products based on augmented reality and the enabling of flexible and modularized processes for the manufacture of customized products.
Patent application statistics shows an overall development stage, while TKS values according to the technology subject can show the change of the industrial focal point in augmented reality. According to our analysis, TKS values in the early stage were concentrated in the technology subjects of “Display” and “HMD”: the sum of their TKS value during period between 1974 and 1992 = 81.3012 (90.33% of total 90). This shows that the early competition of augmented reality mostly focused on head-mounted or hand-held display devices. Annual TKS values in the two subjects have increased gradually, but their growth rates are relatively low compared to those of the other subjects, “Tracking”, “UI”, and “Environment”. Interestingly, our observation revealed that the total TKS value of the subject “Environment” was the highest among those of all technology subjects: the sum of total annual TKSs in subject “Environment” = 931.7099 (25.85% of total TKS 3595). This suggests that many of the patents in augmented reality both contain and compete for the infrastructural solutions in their invention claims; in other words, the technology subject “Environment” is becoming increasingly important in augmented reality. High TKSs in the subject “Environment” can be explained by the trend whereby recent firms are trying to construct an integrated system or augmented reality, building on the previous achievement. Therefore, the technology subject “Environment” received scant attention as a competing field in the early stage of augmented reality development (the sum of its annual TKS values during the period between 1974 and 2000 = 15.9583), but its annual TKS started to increase explosively from 2001, building on the development of other technology subjects. In particular, the subject “Environment” has recorded the highest annual TKS value every year from 2009 to the present year. This tendency can possibly be explained by the technical characteristics of the subject “Environment”. As the infrastructure to execute augmented reality, network communication, storage, and contents technologies tend to be supportive of and combined with other technology subjects. We expect that further patents will concentrate more on infrastructural technologies in their invention context. The technology subjects “Tracking” and “UI” seem to have a similar growth trend: the sums of annual TKSs are 630.4454 (17.54% of total 3595) for “Tracking” and 708.9484 (19.70% of total 3595) for “UI”. The two subjects’ annual TKSs have increased gradually from the early stage of augmented reality, compared to the scant attention to the subject “Environment”. This is because user control and object tracking are the basic technology to execute augmented reality together with displaying technologies.
Next, we used calculation to identify the technology concentration ratio using the Herfindahl–Hirschman Index (HHI), which is an indicator used to measure the degree of industrial competition among participants within a given industry or technology domain. HHI is used as a market concentration indicator to measure the degree of monopolization by squaring the market share of each firm competing in a market [52]. This index from the point of view of patent analysis was used to measure the concentration of patents for technology fields [53]. To measure technical concentration, each technology subject is used in the present study as an industry and the TKS values of augmented reality-related firms are used as market shares. Then, HHI for the concentration ratio can be defined as:
where is the TKS share of applicant in a technology subject and is the number of applicants competing in the technology subject. The value of HHI can be from close to 0 to 10,000. It is understood that an HHI value between 1000 and 1800 is moderately monopolized, and an HHI value over 1800 is highly monopolized [54,55].
According to HHI analysis, the five technology subjects were found to be currently unconcentrated (Table 4). This means that all technology subjects of augmented reality are highly competitive because their TKS values increase while there are no market-dominating firms in the present year due to the existence of many applicants. However, because the number of historically stocked applicants naturally increases by year, we need to examine the dynamic trends of HHI values of technology subjects over time (Table 5).
In particular, in the early stage of augmented reality development, the HHI values of all technology subjects were over 1000; this result indicates that technological development in augmented reality was dominated until the early 1990s by several pioneering firms such as Sony Corporation and Sun Microsystems. From the mid-1990s, however, HHI values for the subjects “Display” and “HMD” started to rapidly decrease, which explains why many firms had produced industrial research for the two technology subjects from that time; the HHI value of “HMD” first decreased to less than 1000 in 1994 and that of “Display” dropped to under 1000 in 1997. On the other hand, the concentration ratio of the technology subject “Environment” still recorded a relatively high HHI value until the early 2000s. In fact, several firms were found to possess many portions of the total TKS value; for example, Personalized Media Communication (PMC) has approximately 88% of total TKS value of the technology subject “Environment” in 1995. Interestingly, the technology subject “Display” shows a relatively high concentration ratio during recent years: 1032.96 in 2011, 726.90 in 2012, 420.49 in 2013, and 1529.11 in 2014. This suggests that several firms dominate the subject “Display”. In fact, our detailed analysis found that of the TKS share, the three firms of Osterhout Group, Google, and Sony had over 50% of the total TKS value of the subject “Display” during the period between 2011 and 2014: Osterhout Group (24.02%), Google (15.50%), and Sony (9.42%).
5.3. Firm-Level Competitive Intelligence Analysis
The previous section identified the evolving competition trends at the level of technology subject, while this section analyzes the TKS values in light of the firm-level competition using patent applicant information. Our LDA application to the patents of augmented reality outputs patent-topic distributions (Table 6). Therefore, we could obtain TKS values that each firm possesses for the five technology subjects by grouping the patents according to the patent applicant name (Table 7 and Figure 7).
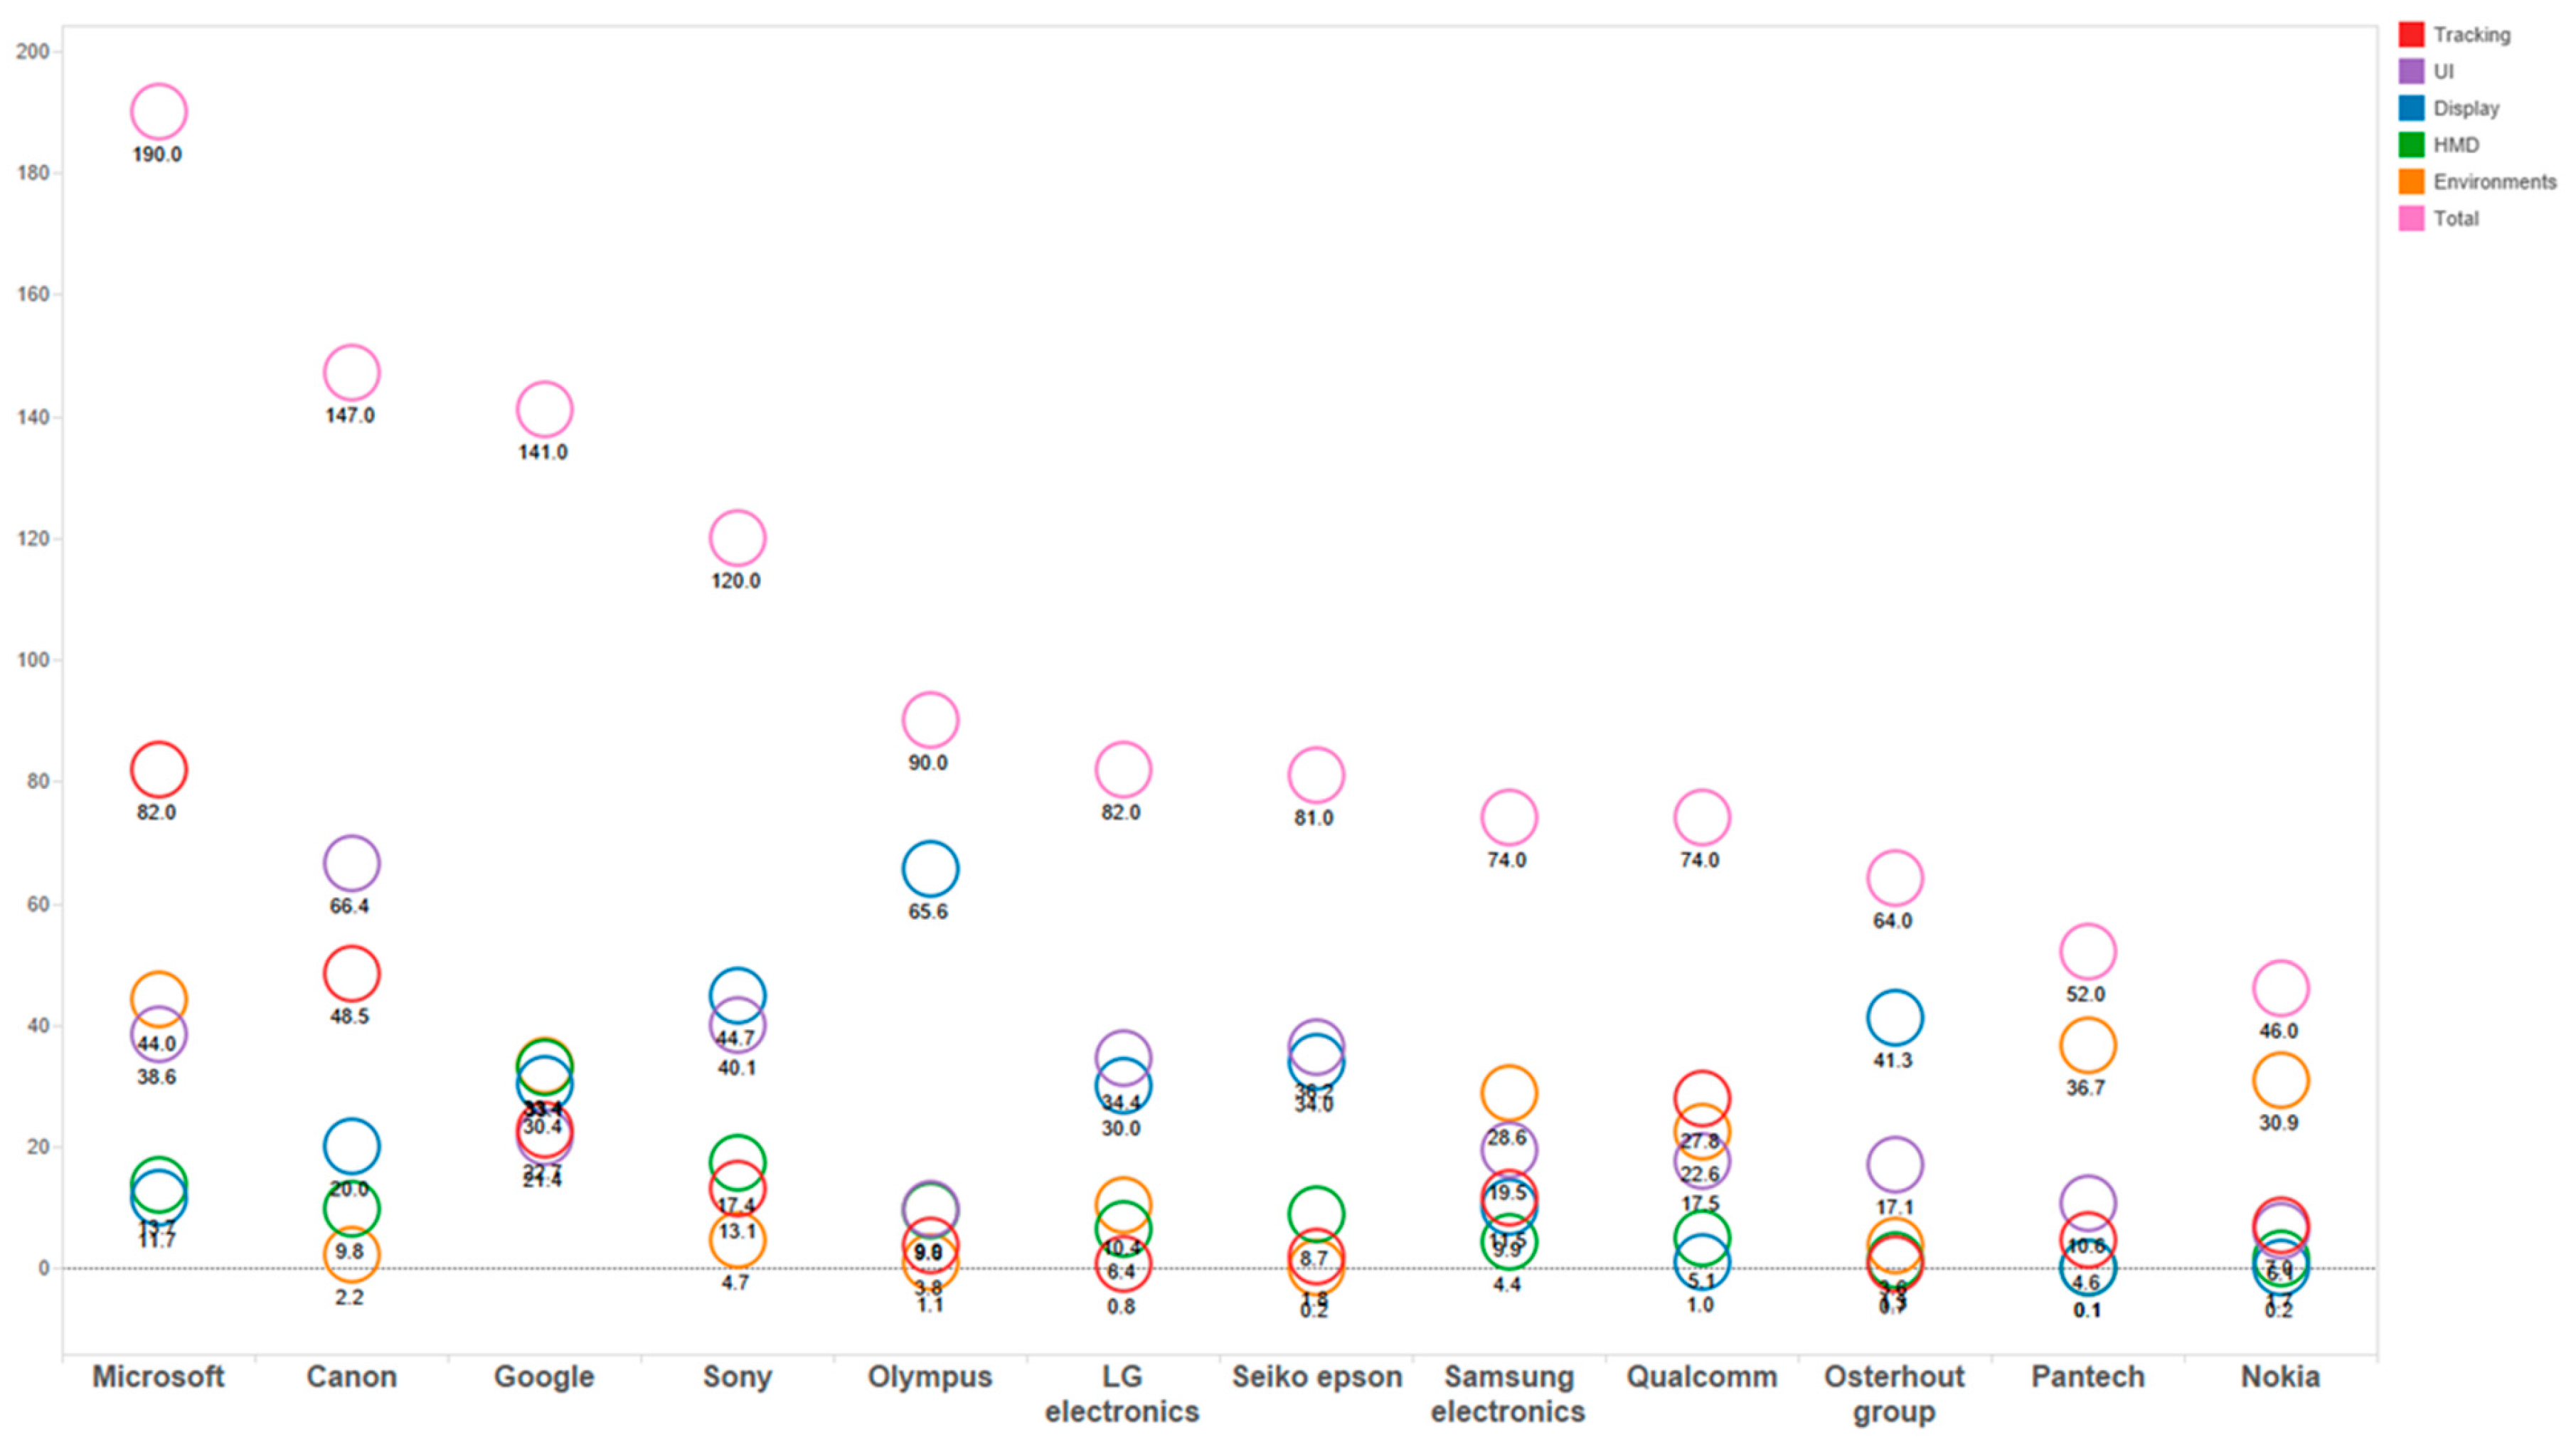
The number of total applicants that filed patents of augmented reality in the USPTO database was 1228: average number of patent applications per applicant = 2.9275. As a result of the total TKS value calculation per applicant, we found that the top 20% of applicants (245 firms) filed over 80% of the total TKS value of augmented reality technology and that the top 1% of applicants (12 firms) possess 1161 patents (32.20% of total patent applications). In particular, as a firm contributing the most to augmented reality technology, Microsoft was found to primarily concentrate on the technology subject “Tracking”: the firms’ TKS was 81.9564 of its total TKS 190. Canon, the second contributing firm, was found to focus on the technology subjects of “UI” and “Tracking”: 66.4214 for “UI” and 48.5475 for “Tracking” of its total TKS 147. Google as a software firm seems to focus on infrastructural technologies, unlike the two previous firms, and its technological effort is distributed relatively evenly to all of the technology subjects: “Environment” (33.4432), “HMD” (33.0973), “Display” (30.3536), “Tracking” (22.6791), and “UI” (21.4267).
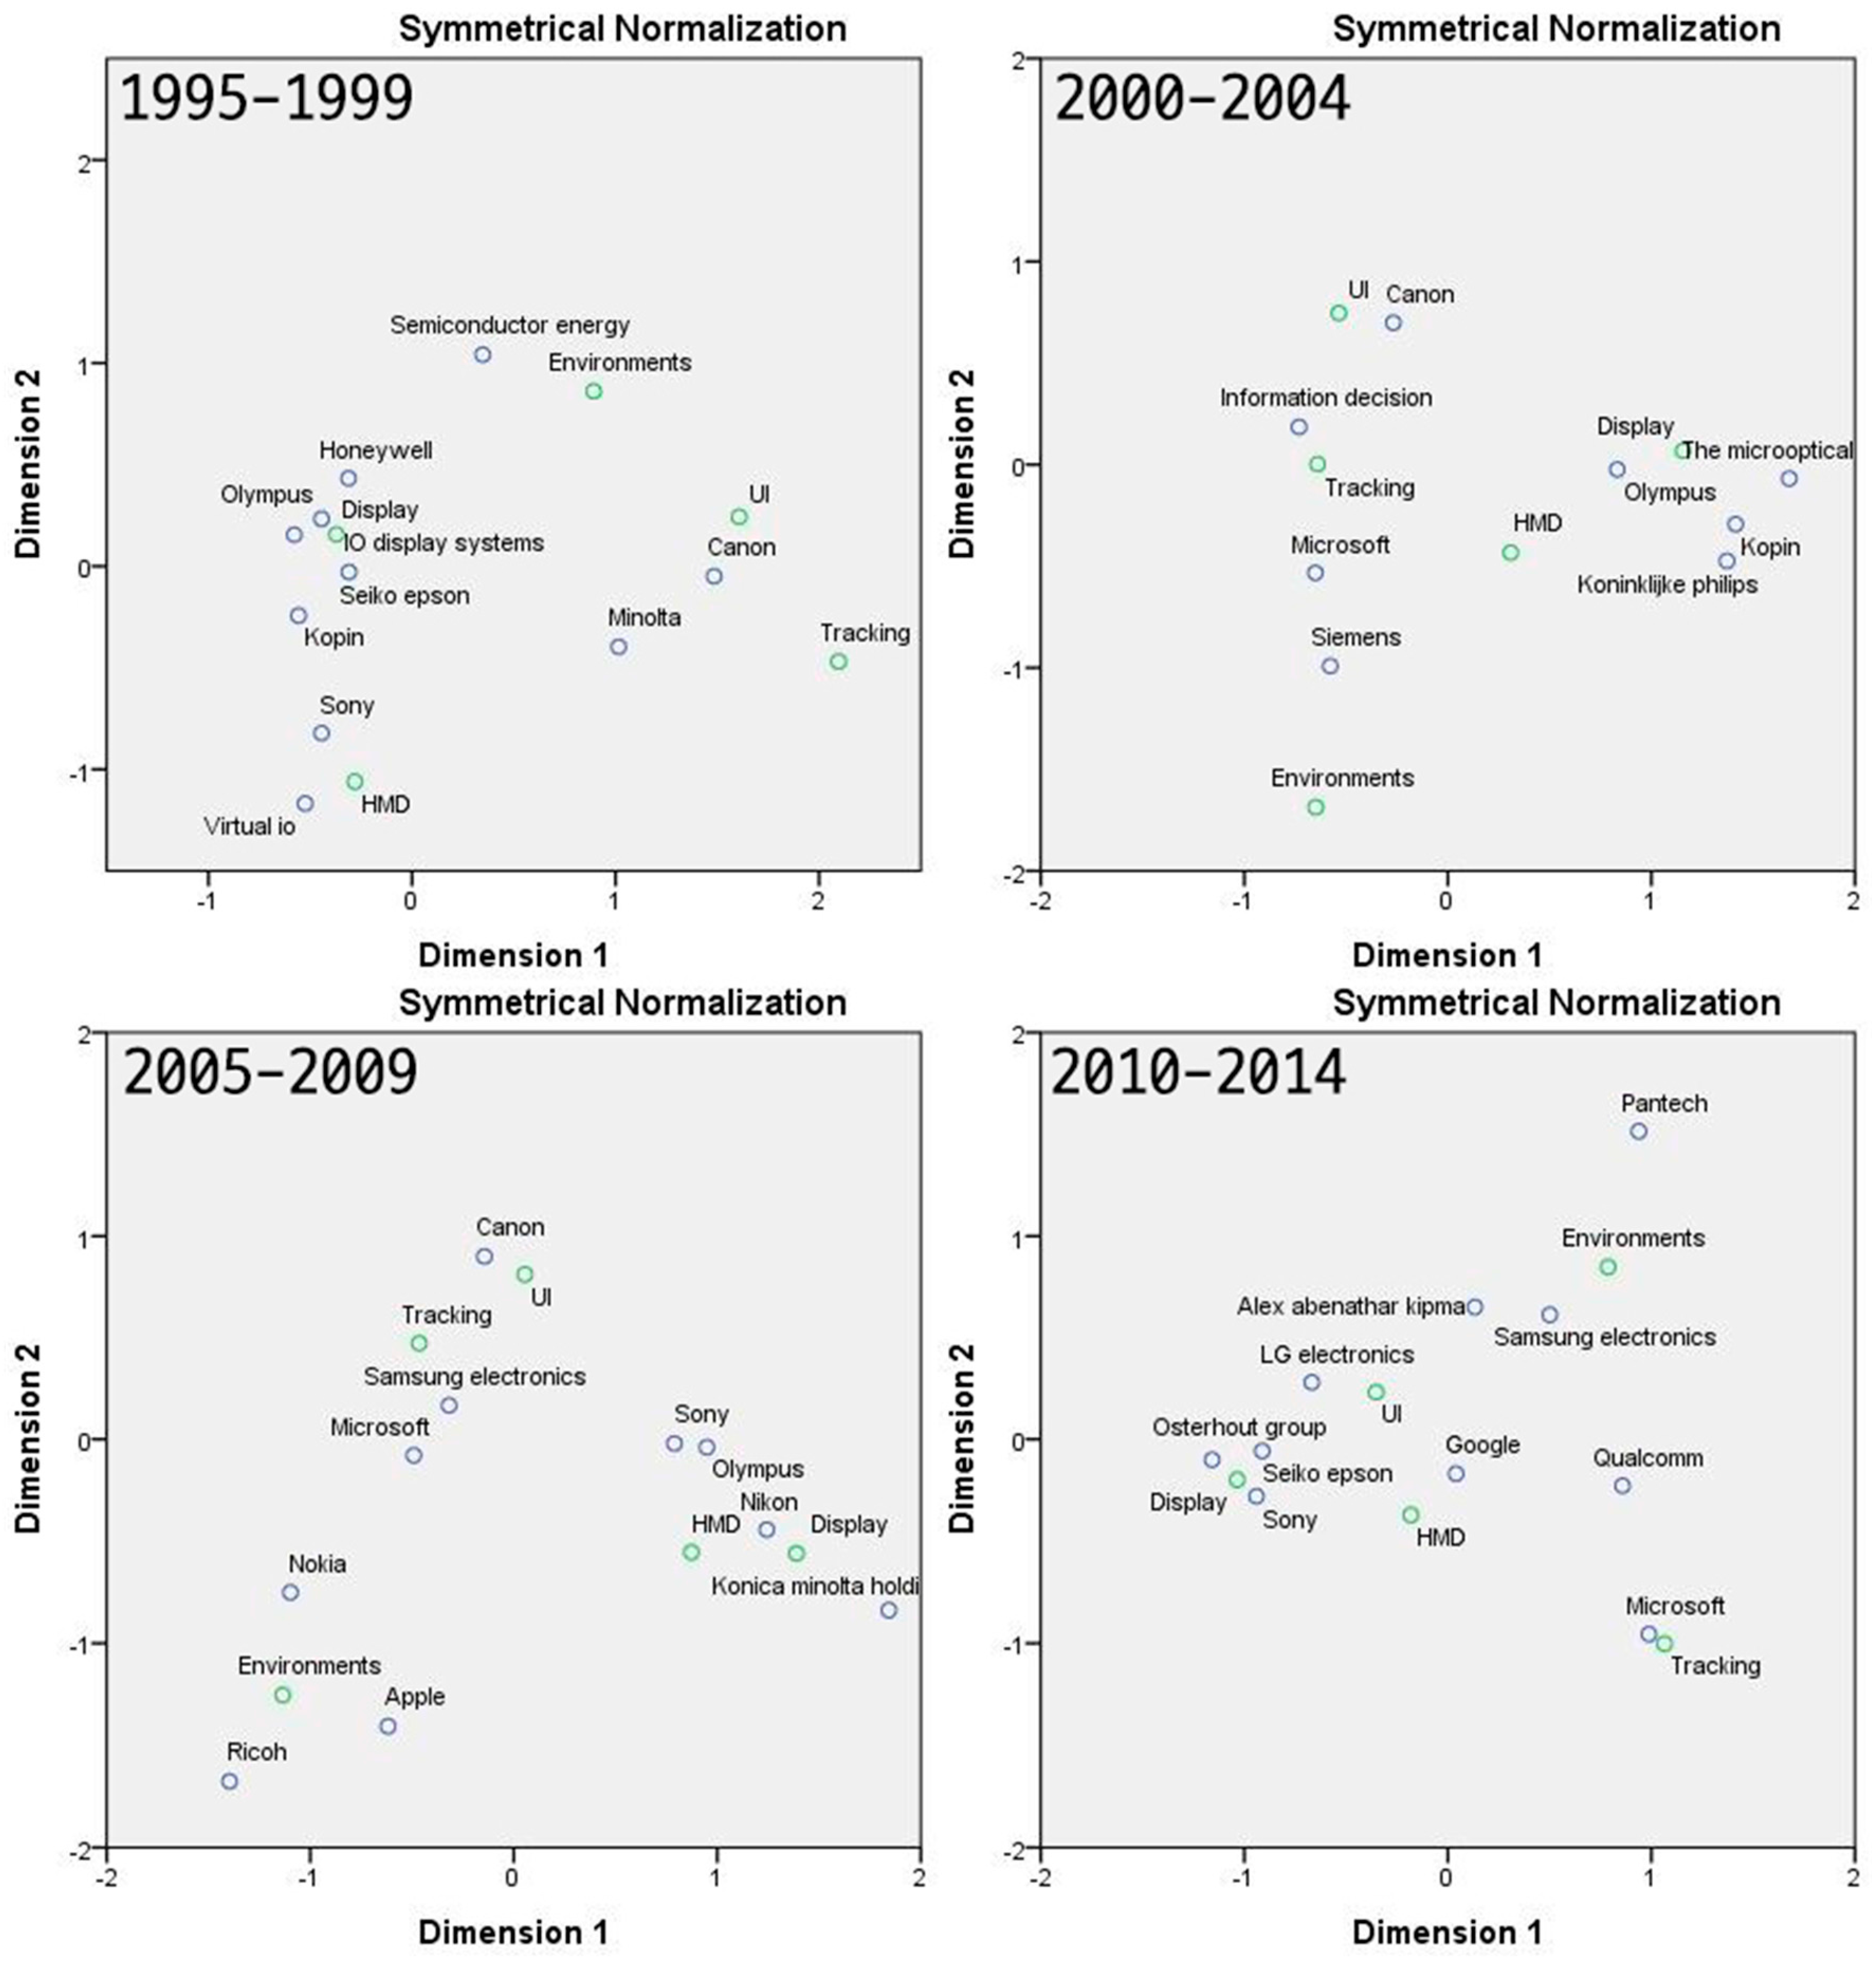
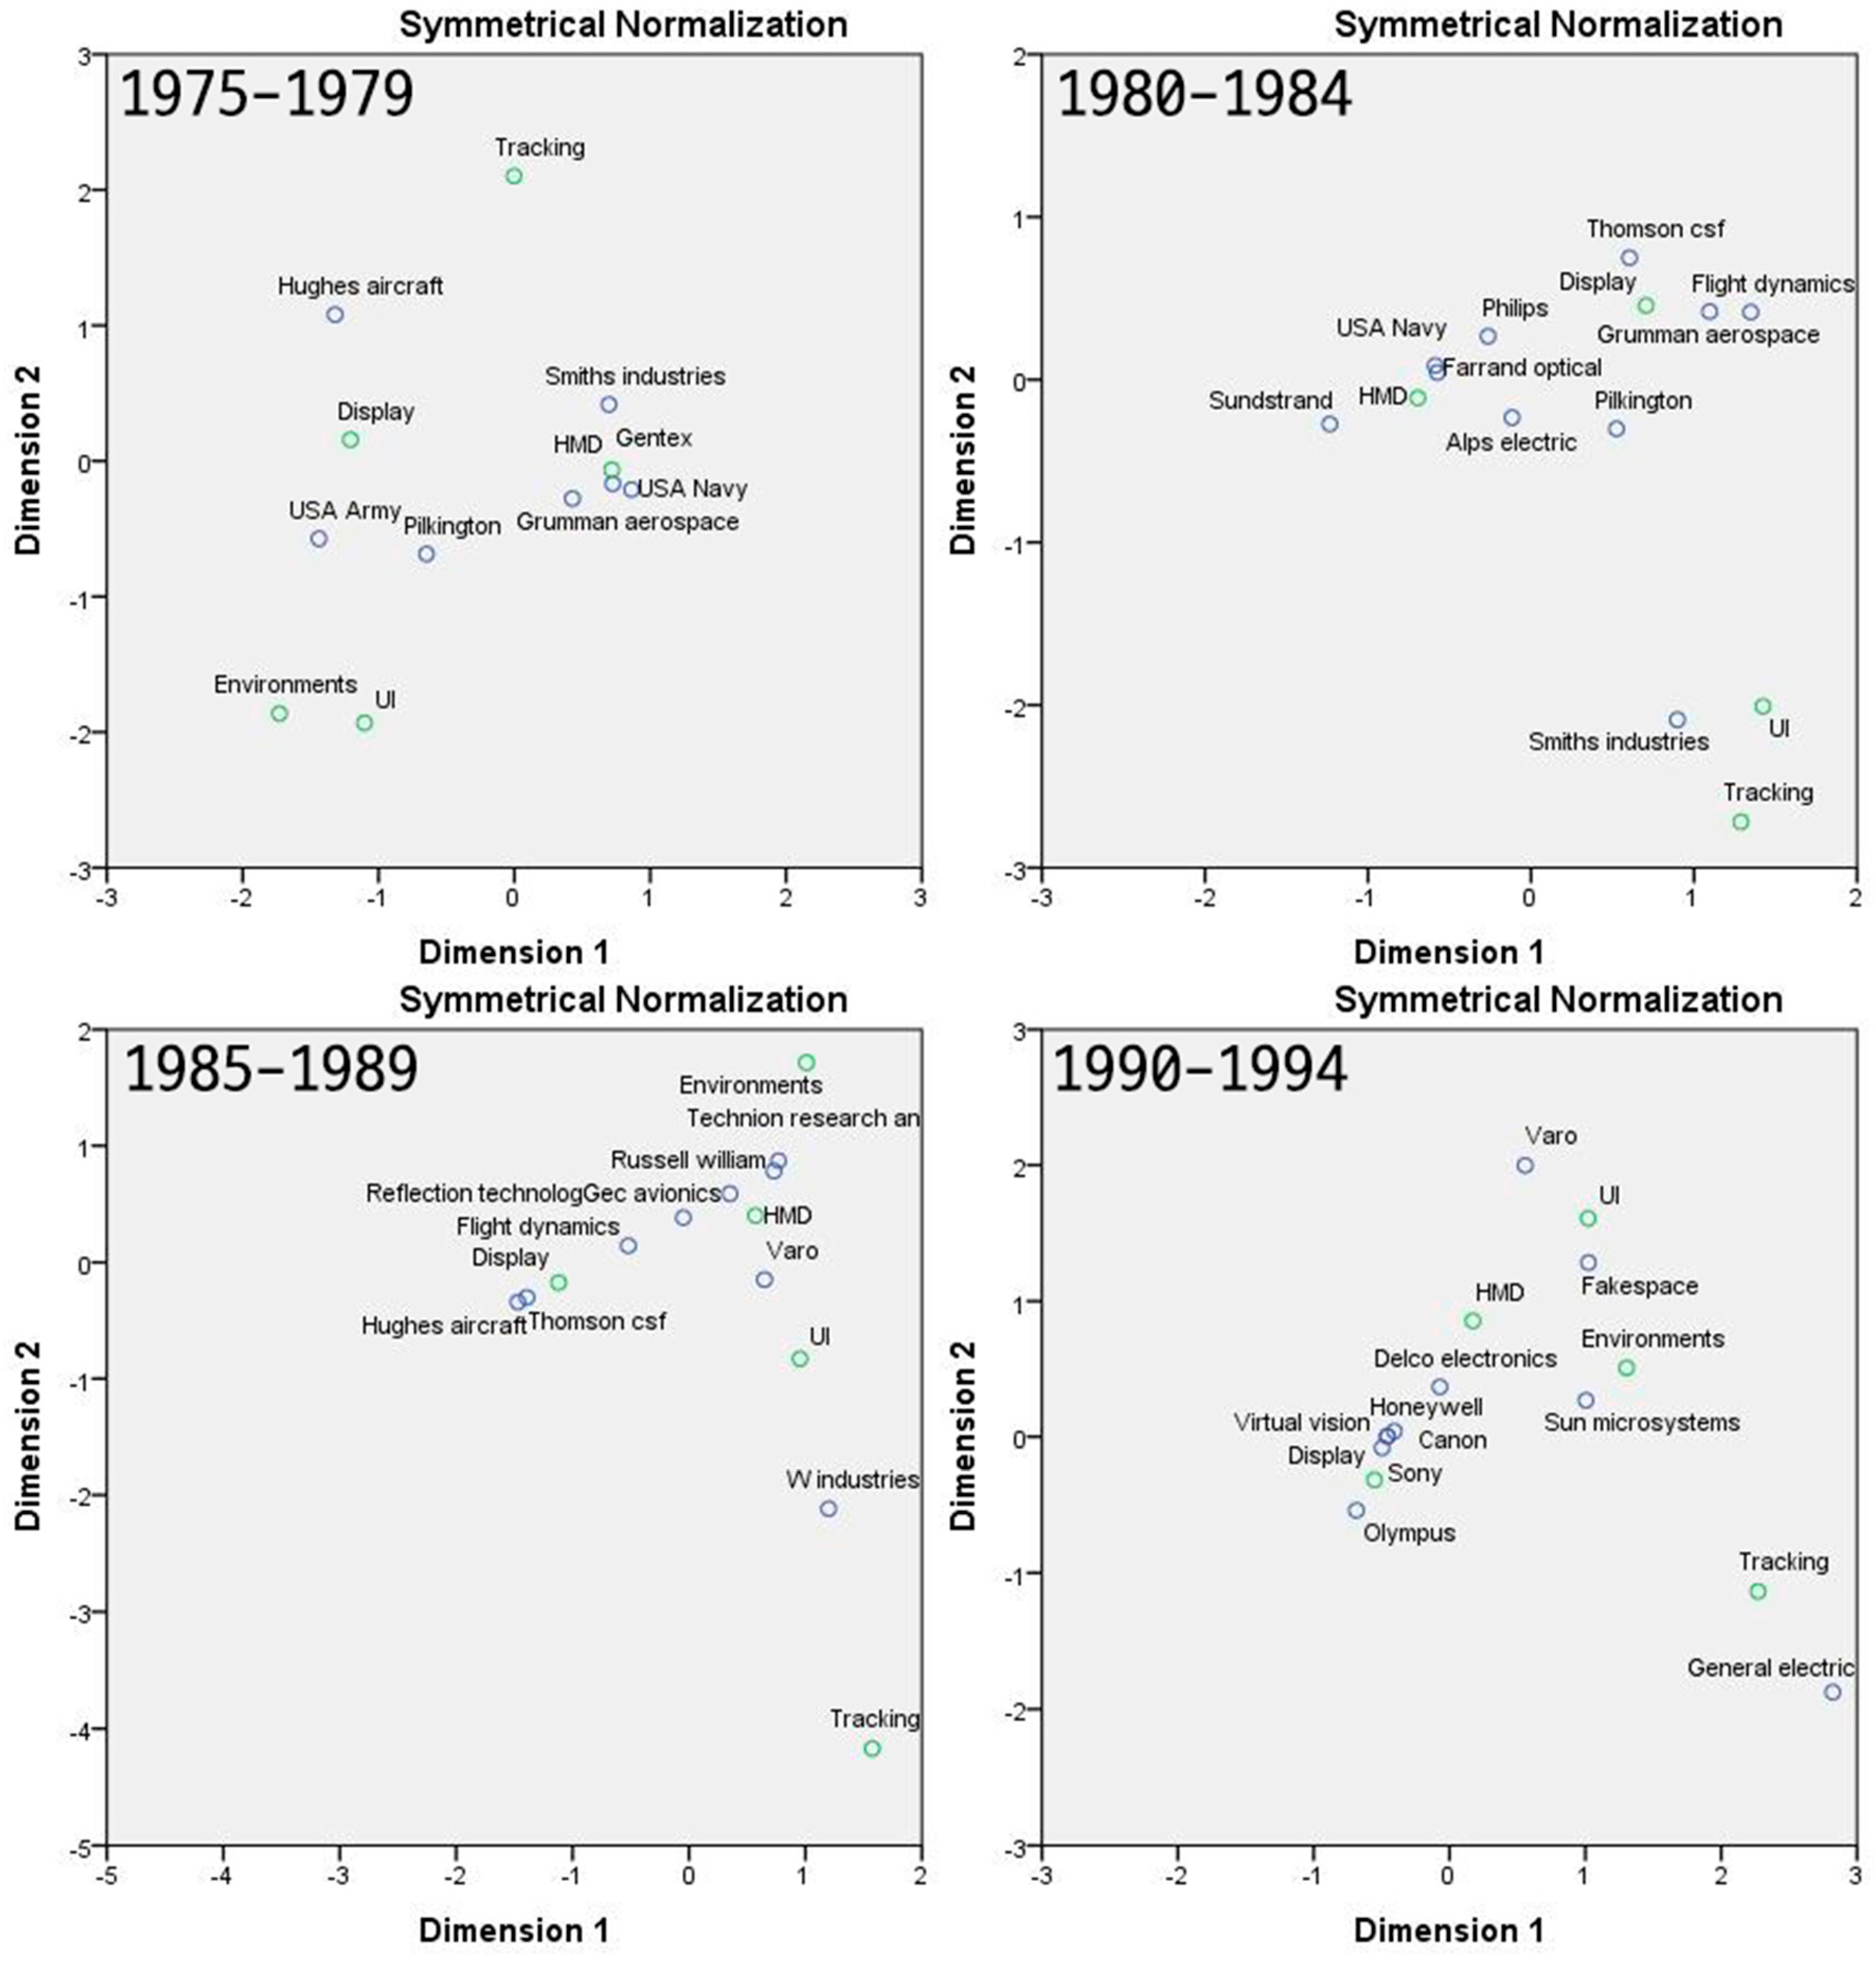
Next, we employ correspondence analysis to analyze the firm-level competition and strategy dynamics for the five technology subjects. Correspondence analysis is a geometric technique used to display the rows and columns of a two-way contingency table as points in a low-dimensional space, such that the positions of the row and column points are consistent with their associations on the table [56]. The present study applies correspondence analysis to the TKS values of firms for technology topics, thereby identifying the changing technical focus of the firms over time. We categorized the 40 years from 1975 to 2014 into eight periods and illustrated the technical focus of the top 10 firms during each period (Figure 8 and Figure 9).
According to the figures, the image display technologies of “Display” and “HMD” are found to be the central technology in augmented reality for the whole period. In particular, the technical focus in the early stage was on displaying technology to combine virtual images with real environments, and such technology was primarily developed by several applicants in military and aerospace fields. For example, the US Navy took the lead in the technology subject “HMD” and its competitiveness continued until 1984. Moreover, applicants in military and aerospace fields, such as the US Navy, the US Army, Hughes Aircraft, Thomson-CSF, and Flight Dynamics, had dominated technological development until 1989. Since 1990, the number of camera manufacturing firms with optical and image processing technologies, including Canon, Sony, Olympus, Minolta, Ricoh, and Nikon, started to increase as emerging competitors. After 2000, many IT firms, such as Microsoft, Apple, Google, Nokia, Samsung, LG, and Qualcomm appeared as new competitors due to the rapid growth of IT and mobile industries. In particular, Microsoft placed their technical focus on the technology subject “Tracking” and Canon focused mainly on the technology subject “UI”. Unlike the other technology subjects, the “Environment” subject did not receive much attention until 2004, but it has recently been actively developed by several major firms such as Nokia, Apple, Ricoh, and Samsung.
The application of correspondence analysis is used to monitor the changing patenting strategies of major firms. If two firms are located close to each other on the visual map, they are likely to deploy a similar technology strategy. For example, we can see that Sony and Olympus were located near the technology subject “HMD” during the period between 2005 and 2009; in fact, the two firms had mainly focused on developing HMD technologies in that period according to our qualitative examination of their patents. Sony had nine patents during the period of 2005–2009 and Olympus had nine patents during the same period (Table 8). Most of the two firms’ patents related to the technology subject “HMD”. In particular, 13 patents (46.43% of total applications 28) of Sony and eight patents (88.89% of total applications nine) of Olympus are found to be directly related to the technology subject “HMD” and to have a very similar TKS distribution in that period (Table 9). The application of correspondence analysis can show the difference between the patenting strategies of firms. For example, we found that the Osterhout group, Seiko Epson, and Sony are closely located near the technology subject “Display” during the period between 2010 and 2014, but Seiko Epson and Sony are close to the technology subject “HMD” (Table 10). During this period, the Osterhout group, Seiko Epson, and Sony applied for 64, 70, and 65 patents, respectively. According to our examination of the firms’ patents, the Osterhout group has focused on developing glass-type (see-through) displays during that period because they applied for 32 patents (50% of the total number of applications of 64) that have a direct relationship with the glass-type display products. Seiko Epson and Sony were found to focus on the subject “Display” combined with the subject “HMD”; 58 patents (82.86% of 70 total applications) of Seiko Epson and 61 patents (93.85% of 65 total applications) were found to display technologies that target HMD applications.
6. Discussion and Conclusions
Augmented reality has recently received much attention as a promising future technology that has much applicability in various industries and will change much of our life. While many researchers are becoming increasingly involved in this technology, studies to understand industrial competitive intelligence within this technology are lacking. In response to this research gap, the aim of this study was to analyze industrial competitive intelligence in terms of technology subject and firm. To this end, we applied topic modeling to the patents of augmented reality technology to identify technology subject constituting augmented reality and thereby quantified TKSs produced according to the individual technology subject and firm.
By applying topic modeling to patent text, we were able to define five technology subjects of augmented reality: “Tracking”, “UI”, “Display”, “HMD”, and “Environment”. From an overall invention aspect, the technology growth stage of this technology was found to be the conception stage during the period of 1974–1992, the birth stage during 1993–2000, the growth stage during 2001–2012, and the expected maturity stage from today. In light of technology subject-level competitive intelligence analysis, the technology subject “Environment” was not a competing technology subject in the early stage, but it has become the focal subject since 2001. This indicates that recent technical competition is primarily placed on environmental systems for augmented reality execution; for example, one can think from recent mobile games that application contents and supporting databases have played the most important role in realizing augmented reality. From a firm-level competition perspective, dynamic maps based on corresponding analysis showed firms’ changing technical focuses over time; similar or dissimilar patenting strategies for some competing firms were identified. Recently, several software firms, including Microsoft and Google, and camera manufacturing firms, including Canon, Sony, and Olympus, were found to be the major firms that dominate the development augmented reality.
This study provides contributions to both industry and academia. From a practical standpoint, the results of this study can provide decisive information for researchers and R&D planners working in the field of augmented reality. First, our analysis showed a likely impending shift toward the maturity stage, so researchers can formulate R&D plans to invest in insulating mechanisms to further improve the quality and reliability of augmented reality products. Second, technology subject-level intelligence analysis suggests that industrial competition will be more concentrated on infrastructural technologies or the technology subject of “Environment”. Third, firm-level analysis helps us understand patenting strategies among firms competing for technology subjects; R&D plans can thus be formulated to cope with such changing industrial technology strategies. Methodologically, our bibliometric analysis framework has the potential to help generate insights into various technology domains. This is because they are neutral with respect to the type of data analyzed, although this study only utilized patent data on augmented reality. Researchers and R&D planners can apply our method for analyzing competitive intelligence using patent data in any technology domain of interest.
Despite these contributions, the present study has some shortcomings and the consequential further research topics are as follows. First, this study performed competitive intelligence analysis using patent data, so its results relate only to the technological and inventional perspectives. Therefore, a research topic in the future should incorporate market information in order to understand industrial competition more systemically. Second, the present study uses patent applications but does not consider their quality in calculating TKSs. The quality of patents can be identified using quantitative measures, such as the number of forward citations and the number of claims, or expert examination can be used. Therefore, TKS measurement using weighting factors related to patent quality is expected to enable more effective industrial competitive intelligence analysis in future research. Third, our bibliometric analysis is based on historical data, so it overlooks potential breakthroughs that can be increased by research. Once our approach is conducted for the patents of augmented reality in the future, it may result in different industrial competition trends. Therefore, our approach should be considered as a tool for monitoring industrial trends. In this regard, incorporating our approach into a software system would help experts monitor the changing industrial competition efficiently. Fourth, as stated previously, this study applied its approach to augmented reality. Methodologically, the approach used in this study is neutral to technology domains. Therefore, application studies in the future can be performed to analyze industrial competitive intelligence within other rapidly evolving technologies.
Acknowledgments
This paper was supported by Konkuk University in 2016.
Author Contributions
Byeongki Jeong and Janghyeok Yoon designed the framework and experiments; Byeongki Jeong performed the experiments; and Byeongki Jeong and Janghyeok Yoon wrote the manuscript.
Conflicts of Interest
The authors declare no conflict of interest.
References
- Feiner, S.; Macintyre, B.; Seligmann, D. Knowledge-based augmented reality. Commun. ACM 1993, 36, 53–62. [Google Scholar] [CrossRef]
- Zhou, F.; Duh, H.B.-L.; Billinghurst, M. Trends in Augmented Reality Tracking, Interaction And Display: A Review of Ten Years of ISMAR. In Proceedings of the 7th IEEE/ACM International Symposium on Mixed and Augmented Reality, Cambridge, United Kingdom, 15–18 September 2008; IEEE Computer Society: Washington, DC, USA, 2008; pp. 193–202. [Google Scholar]
- Luo, X. From augmented reality to augmented computing: A look at cloud-mobile convergence. In Proceedings of the International Symposium on Ubiquitous Virtual Reality, Gwangju, Korea, 8–11 July 2009; pp. 29–32. [Google Scholar]
- MarketsAndMarkets. Augmented Reality Market by Component (Sensor, Display, & Software), Display Type (Head Mounted, Head-Up, Handheld, & Spatial), Application (Aerospace & Defense, Consumer, Commercial), and Geography—Global Forecast to 2020; MarketsAndMarkets: Maharashtra, India, 2015. [Google Scholar]
- Yu, D.; Jin, J.S.; Luo, S.; Lai, W.; Huang, Q. A useful visualization technique: A literature review for augmented reality and its application, limitation & future direction. In Visual Information Communication; Springer: Cham, Switzerland, 2009; pp. 311–337. [Google Scholar]
- Billinghurst, M.; Clark, A.; Lee, G. A Survey of Augmented Reality. Found. Trends Hum. Comput. Interact. 2015, 8, 73–272. [Google Scholar] [CrossRef]
- Van Krevelen, D.; Poelman, R. A survey of augmented reality technologies, applications and limitations. Int. J. Virtual Real. 2010, 9. [Google Scholar] [CrossRef]
- Ong, S.; Yuan, M.; Nee, A. Augmented reality applications in manufacturing: A survey. Int. J. Prod. Res. 2008, 46, 2707–2742. [Google Scholar] [CrossRef]
- Papagiannakis, G.; Singh, G.; Magnenat-Thalmann, N. A survey of mobile and wireless technologies for augmented reality systems. Comput. Animat. Virtual Worlds 2008, 19, 3–22. [Google Scholar] [CrossRef]
- Sielhorst, T.; Feuerstein, M.; Navab, N. Advanced medical displays: A literature review of augmented reality. J. Disp. Technol. 2008, 4, 451–467. [Google Scholar] [CrossRef]
- Thomas, B.H. A survey of visual, mixed, and augmented reality gaming. Comput. Entertain. 2012, 10, 3. [Google Scholar] [CrossRef]
- Chen, T. Competitive and Sustainable Manufacturing in the Age of Globalization. Sustainability 2017, 9, 26. [Google Scholar] [CrossRef]
- Seo, W.; Yoon, J.; Park, H.; Coh, B.-Y.; Lee, J.-M.; Kwon, O.-J. Product opportunity identification based on internal capabilities using text mining and association rule mining. Technol. Forecast. Soc. Chang. 2016, 105, 94–104. [Google Scholar] [CrossRef]
- Yoon, J.; Park, Y.; Kim, M.; Lee, J.; Lee, D. Tracing evolving trends in printed electronics using patent information. J. Nanopart. Res. 2014, 16, 1–15. [Google Scholar] [CrossRef]
- Daim, T.U.; Rueda, G.; Martin, H.; Gerdsri, P. Forecasting emerging technologies: Use of bibliometrics and patent analysis. Technol. Forecast. Soc. Chang. 2006, 73, 981–1012. [Google Scholar] [CrossRef]
- Bengisu, M.; Nekhili, R. Forecasting emerging technologies with the aid of science and technology databases. Technol. Forecast. Soc. Chang. 2006, 73, 835–844. [Google Scholar] [CrossRef]
- Yoon, J.; Park, H.; Seo, W.; Lee, J.-M.; Coh, B.-Y.; Kim, J. Technology opportunity discovery (TOD) from existing technologies and products: A function-based TOD framework. Technol. Forecast. Soc. Chang. 2015, 100, 153–167. [Google Scholar] [CrossRef]
- Choi, S.; Kim, H.; Yoon, J.; Kim, K.; Lee, J.Y. An SAO-based text-mining approach for technology roadmapping using patent information. R&D Manag. 2013, 43, 52–74. [Google Scholar]
- Fujii, H.; Yoshida, K.; Sugimura, K. Research and Development Strategy in Biological Technologies: A Patent Data Analysis of Japanese Manufacturing Firms. Sustainability 2016, 8, 351. [Google Scholar] [CrossRef]
- Choi, S.; Park, H. Investigation of Strategic Changes Using Patent Co-Inventor Network Analysis: The Case of Samsung Electronics. Sustainability 2016, 8, 1315. [Google Scholar] [CrossRef]
- Blei, D.M.; Ng, A.Y.; Jordan, M.I. Latent dirichlet allocation. J. Mach. Learn. Res. 2003, 3, 993–1022. [Google Scholar]
- Rauschnabel, P.A.; Brem, A.; Ro, Y. Augmented Reality Smart Glasses: Definition, Conceptual Insights, and Managerial Importance; Working Paper; The University of Michigan: Ann Arbor, MI, USA, 2015. [Google Scholar]
- McCartney, M. Margaret McCartney: Game on for Pokémon Go. Br. Med. J. 2016. [Google Scholar] [CrossRef] [PubMed]
- Bulearca, M.; Tamarjan, D. Augmented reality: A sustainable marketing tool. Glob. Bus. Manag. Res. Int. J. 2010, 2, 237–252. [Google Scholar]
- Milgram, P.; Kishino, F. A taxonomy of mixed reality visual displays. IEICE Trans. Inf. Syst. 1994, 77, 1321–1329. [Google Scholar]
- Azuma, R.T. A survey of augmented reality. Presence 1997, 6, 355–385. [Google Scholar] [CrossRef]
- Bower, M.; Howe, C.; McCredie, N.; Robinson, A.; Grover, D. Augmented Reality in education—Cases, places and potentials. Educ. Media Int. 2014, 51, 1–15. [Google Scholar] [CrossRef]
- Bacca, J.; Baldiris, S.; Fabregat, R.; Graf, S. Augmented reality trends in education: A systematic review of research and applications. J. Educ. Technol. Soc. 2014, 17, 133–149. [Google Scholar]
- Pucihar, K.Č.; Coulton, P. Exploring the evolution of mobile augmented reality for future entertainment systems. Comput. Entertain. 2013, 11, 1. [Google Scholar] [CrossRef]
- Barsom, E.; Graafland, M.; Schijven, M. Systematic review on the effectiveness of augmented reality applications in medical training. Surg. Endosc. 2016, 30, 4174–4183. [Google Scholar] [CrossRef] [PubMed]
- Zhu, Z.; Branzoi, V.; Sizintsev, M.; Vitovitch, N.; Oskiper, T.; Villamil, R.; Chaudhry, A.; Samarasekera, S.; Kumar, R. AR-Weapon: Live augmented reality based first-person shooting system. In Proceedings of the 2015 IEEE Winter Conference on Applications of Computer Vision (WACV), Hawaii, HI, USA, 6–9 January 2015; pp. 618–625. [Google Scholar]
- Cirulis, A.; Brigmanis, K.B. 3D outdoor augmented reality for architecture and urban planning. Procedia Comput. Sci. 2013, 25, 71–79. [Google Scholar] [CrossRef]
- Sheng, Y.; Yapo, T.C.; Young, C.; Cutler, B. A spatially augmented reality sketching interface for architectural daylighting design. IEEE Trans. Vis. Comput. Gr. 2011, 17, 38–50. [Google Scholar] [CrossRef] [PubMed]
- Pour Rahimian, F.; Ibrahim, R.; Wang, J.; Wang, X.; Shou, W.; Xu, B. Integrating BIM and augmented reality for interactive architectural visualisation. Constr. Innov. 2014, 14, 453–476. [Google Scholar]
- Mourtzis, D.; Doukas, M.; Vandera, C. Smart mobile apps for supporting product design and decision-making in the era of mass customisation. Int. J. Comput. Integr. Manuf. 2016. [Google Scholar] [CrossRef]
- Altuntas, S.; Dereli, T.; Kusiak, A. Forecasting technology success based on patent data. Technol. Forecast. Soc. Chang. 2015, 96, 202–214. [Google Scholar] [CrossRef]
- Joung, J.; Kim, K. Monitoring emerging technologies for technology planning using technical keyword based analysis from patent data. Technol. Forecast. Soc. Chang. 2017, 114, 281–292. [Google Scholar] [CrossRef]
- Pantano, E.; Priporas, C.-V.; Sorace, S.; Iazzolino, G. Does innovation-orientation lead to retail industry growth? Empirical evidence from patent analysis. J. Retail. Consum. Serv. 2017, 34, 88–94. [Google Scholar] [CrossRef]
- Park, H.; Kim, K.; Choi, S.; Yoon, J. A patent intelligence system for strategic technology planning. Expert Syst. Appl. 2013, 40, 2373–2390. [Google Scholar] [CrossRef]
- Yoon, J.; Park, H.; Kim, K. Identifying technological competition trends for R&D planning using dynamic patent maps: SAO-based content analysis. Scientometrics 2013, 94, 313–331. [Google Scholar]
- Wang, C.; Blei, D.M. Collaborative topic modeling for recommending scientific articles. In Proceedings of the 17th ACM SIGKDD International Conference on Knowledge Discovery and Data Mining, San Diego, CA, USA, 21–24 August 2011; ACM: San Diego, CA, USA, 2011; pp. 448–456. [Google Scholar]
- Newman, D.J.; Block, S. Probabilistic topic decomposition of an eighteenth-century American newspaper. J. Am. Soc. Inf. Sci. Technol. 2006, 57, 753–767. [Google Scholar] [CrossRef]
- Bíró, I.; Szabó, J.; Benczúr, A.A. Latent dirichlet allocation in web spam filtering. In Proceedings of the 4th International Workshop on Adversarial Information Retrieval on the Web, Beijing, China, 22–22 April 2008; ACM: San Diego, CA, USA, 2008; pp. 29–32. [Google Scholar]
- Xu, G.; Zhang, Y.; Yi, X. Modelling user behaviour for web recommendation using lda model. In Proceedings of the IEEE/WIC/ACM International Conference on Web Intelligence and Intelligent Agent Technology, Sydney, Australia, 9–12 December 2008; pp. 529–532. [Google Scholar]
- Xing, D.; Girolami, M. Employing Latent Dirichlet Allocation for fraud detection in telecommunications. Pattern Recogn. Lett. 2007, 28, 1727–1734. [Google Scholar] [CrossRef]
- Wang, Y.; Mori, G. Human action recognition by semilatent topic models. IEEE Trans. Pattern Anal. Mach. Intell. 2009, 31, 1762–1774. [Google Scholar] [CrossRef] [PubMed]
- Kim, G.; Park, S.; Jang, D. Technology analysis from patent data using latent dirichlet allocation. In Soft Computing in Big Data Processing; Springer: Cham, Switzerland, 2014; pp. 71–80. [Google Scholar]
- Wang, B.; Liu, S.; Ding, K.; Liu, Z.; Xu, J. Identifying technological topics and institution-topic distribution probability for patent competitive intelligence analysis: A case study in LTE technology. Scientometrics 2014, 101, 685–704. [Google Scholar] [CrossRef]
- Azuma, R.; Baillot, Y.; Behringer, R.; Feiner, S.; Julier, S.; MacIntyre, B. Recent advances in augmented reality. IEEE Comput. Graph. Appl. 2001, 21, 34–47. [Google Scholar] [CrossRef]
- Gao, L.; Porter, A.L.; Wang, J.; Fang, S.; Zhang, X.; Ma, T.; Wang, W.; Huang, L. Technology life cycle analysis method based on patent documents. Technol. Forecast. Soc. Chang. 2013, 80, 398–407. [Google Scholar] [CrossRef]
- Mann, D. Hands on Systematic Innovation; Edward Gaskell Publishers: North devon, UK, 2002. [Google Scholar]
- Matsumoto, A.; Merlone, U.; Szidarovszky, F. Some notes on applying the Herfindahl–Hirschman Index. Appl. Econ. Lett. 2012, 19, 181–184. [Google Scholar] [CrossRef]
- Hu, A.G.; Jaffe, A.B. Patent citations and international knowledge flow: The cases of Korea and Taiwan. Int. J. Ind. Organ. 2003, 21, 849–880. [Google Scholar] [CrossRef]
- Becker, G. Horizontal Merger Guidelines. In Wiley Encyclopedia of Management; Wiley: Hoboken, NJ, USA, 2010. [Google Scholar]
- Miller, R.A. Herfindahl-Hirschman Index as a Market Structure Variable: An Exposition for Antitrust Practitioners, The. Antitrust Bull. 1982, 27, 593. [Google Scholar]
- Ter Braak, C.J. Canonical correspondence analysis: A new eigenvector technique for multivariate direct gradient analysis. Ecology 1986, 67, 1167–1179. [Google Scholar] [CrossRef]
Figure 1.
Reality–virtuality continuum; redrawn from [25].
Figure 1.
Reality–virtuality continuum; redrawn from [25].
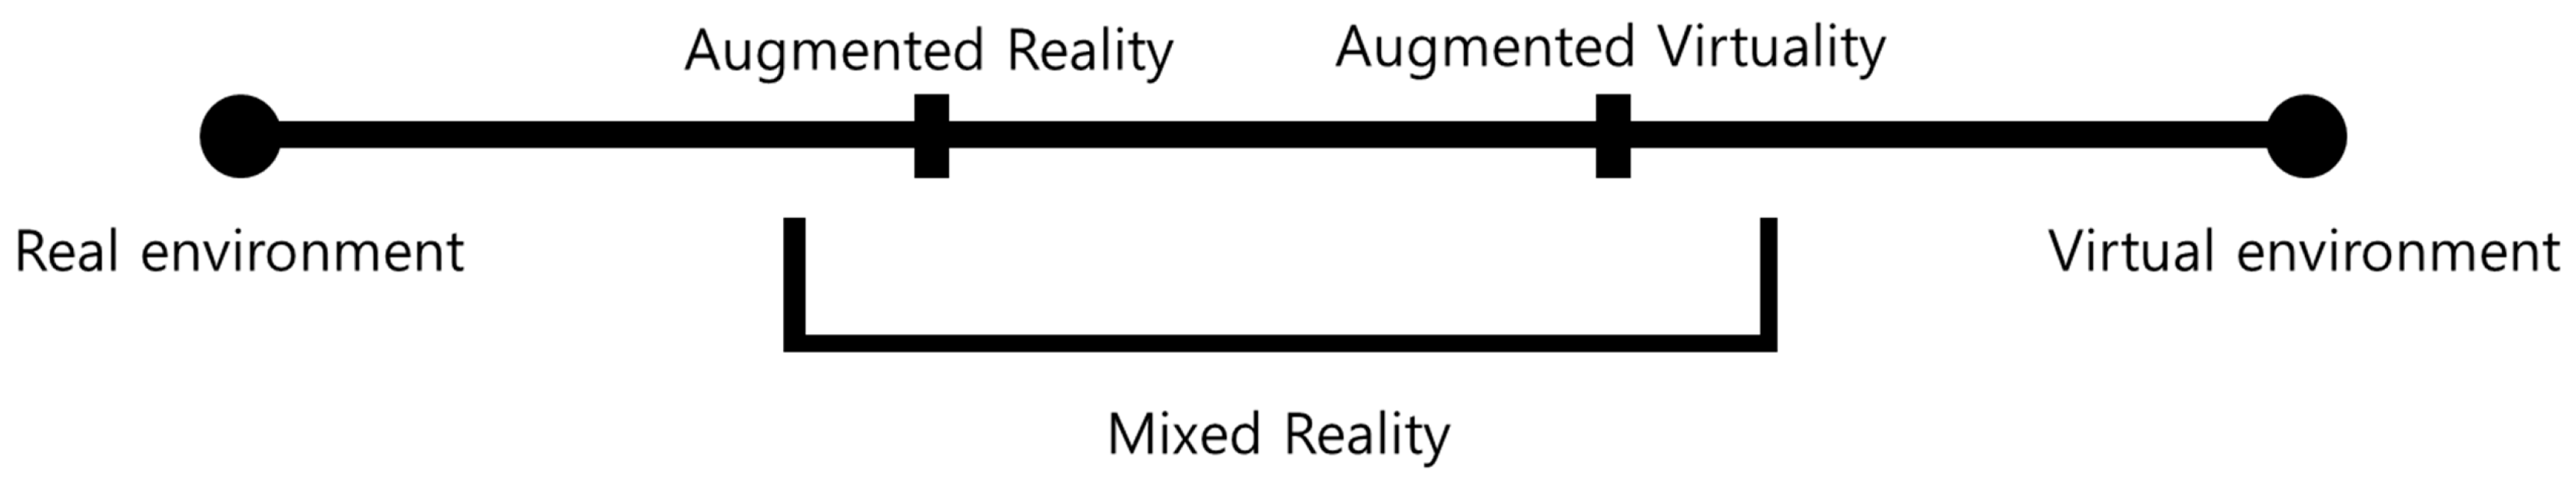
Figure 2.
Graphical model of Latent Dirichlet Allocation (LDA).

Figure 3.
LDA outputs for a patent corpus.

Figure 4.
Average cosine similarity between pairs of topics by the number of topics.

Figure 5.
Graphical explanation of the five technology subjects of augmented reality.
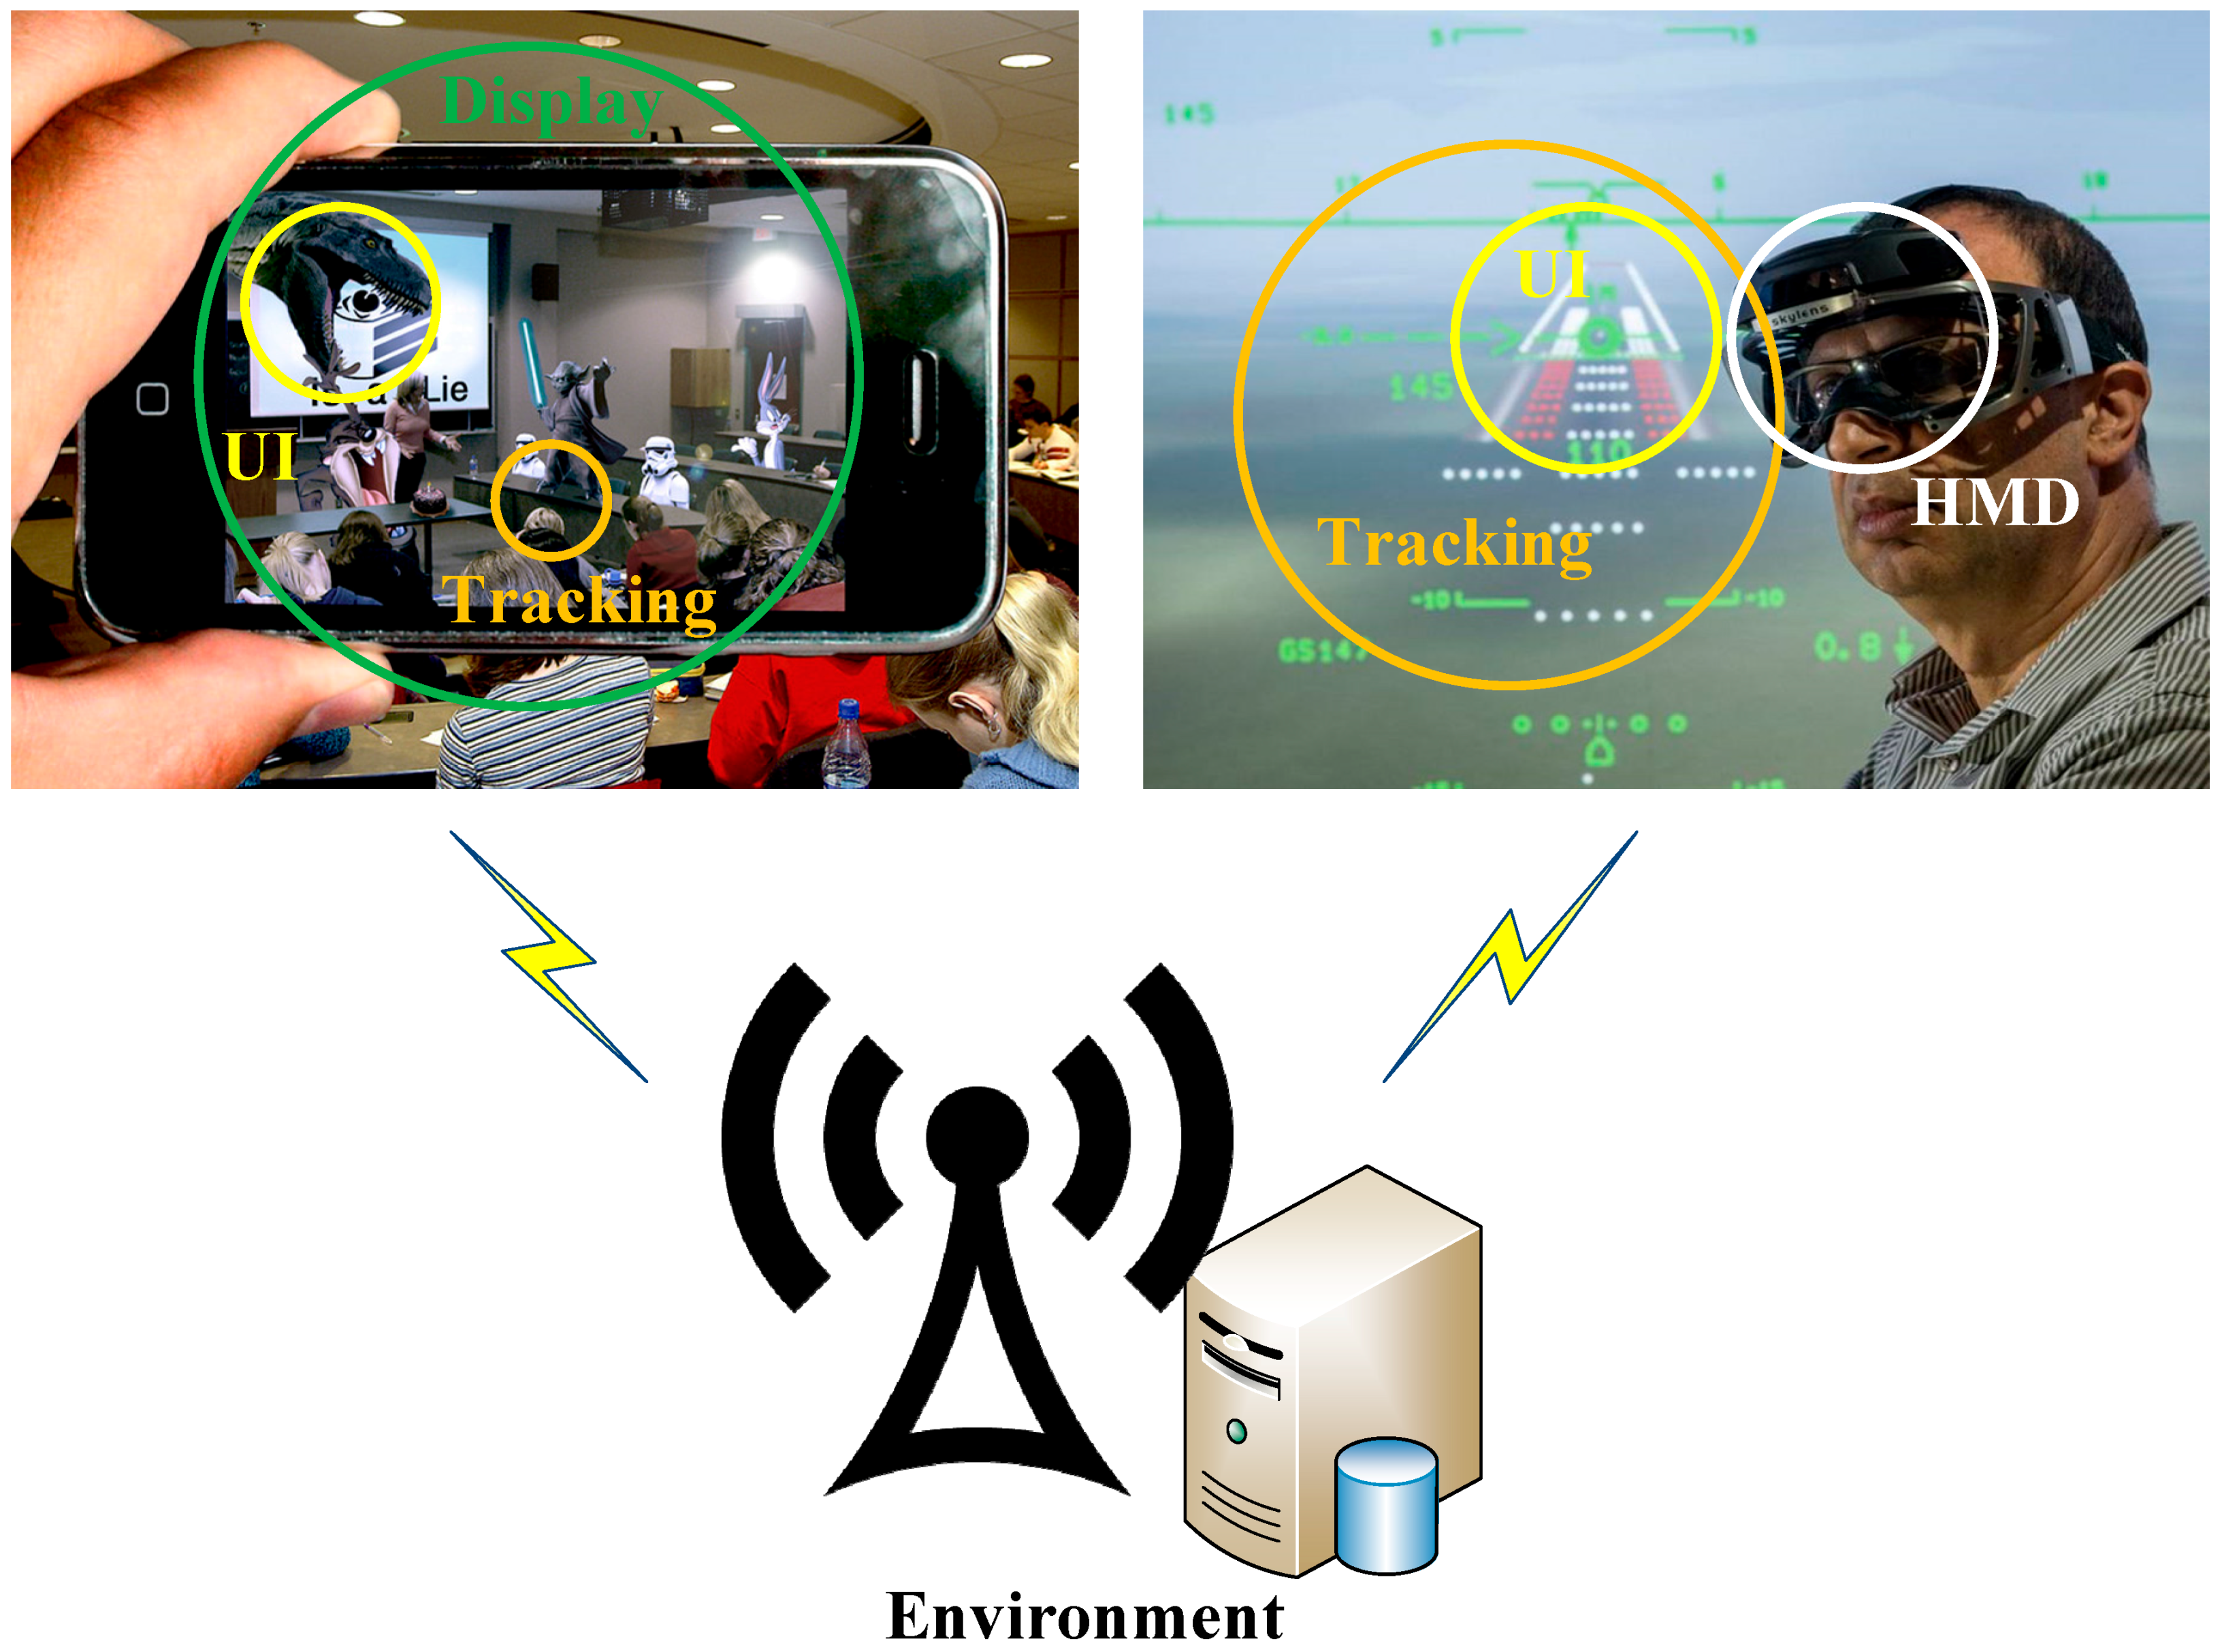
Figure 6.
Trend of cumulative TKS values by technology subject.
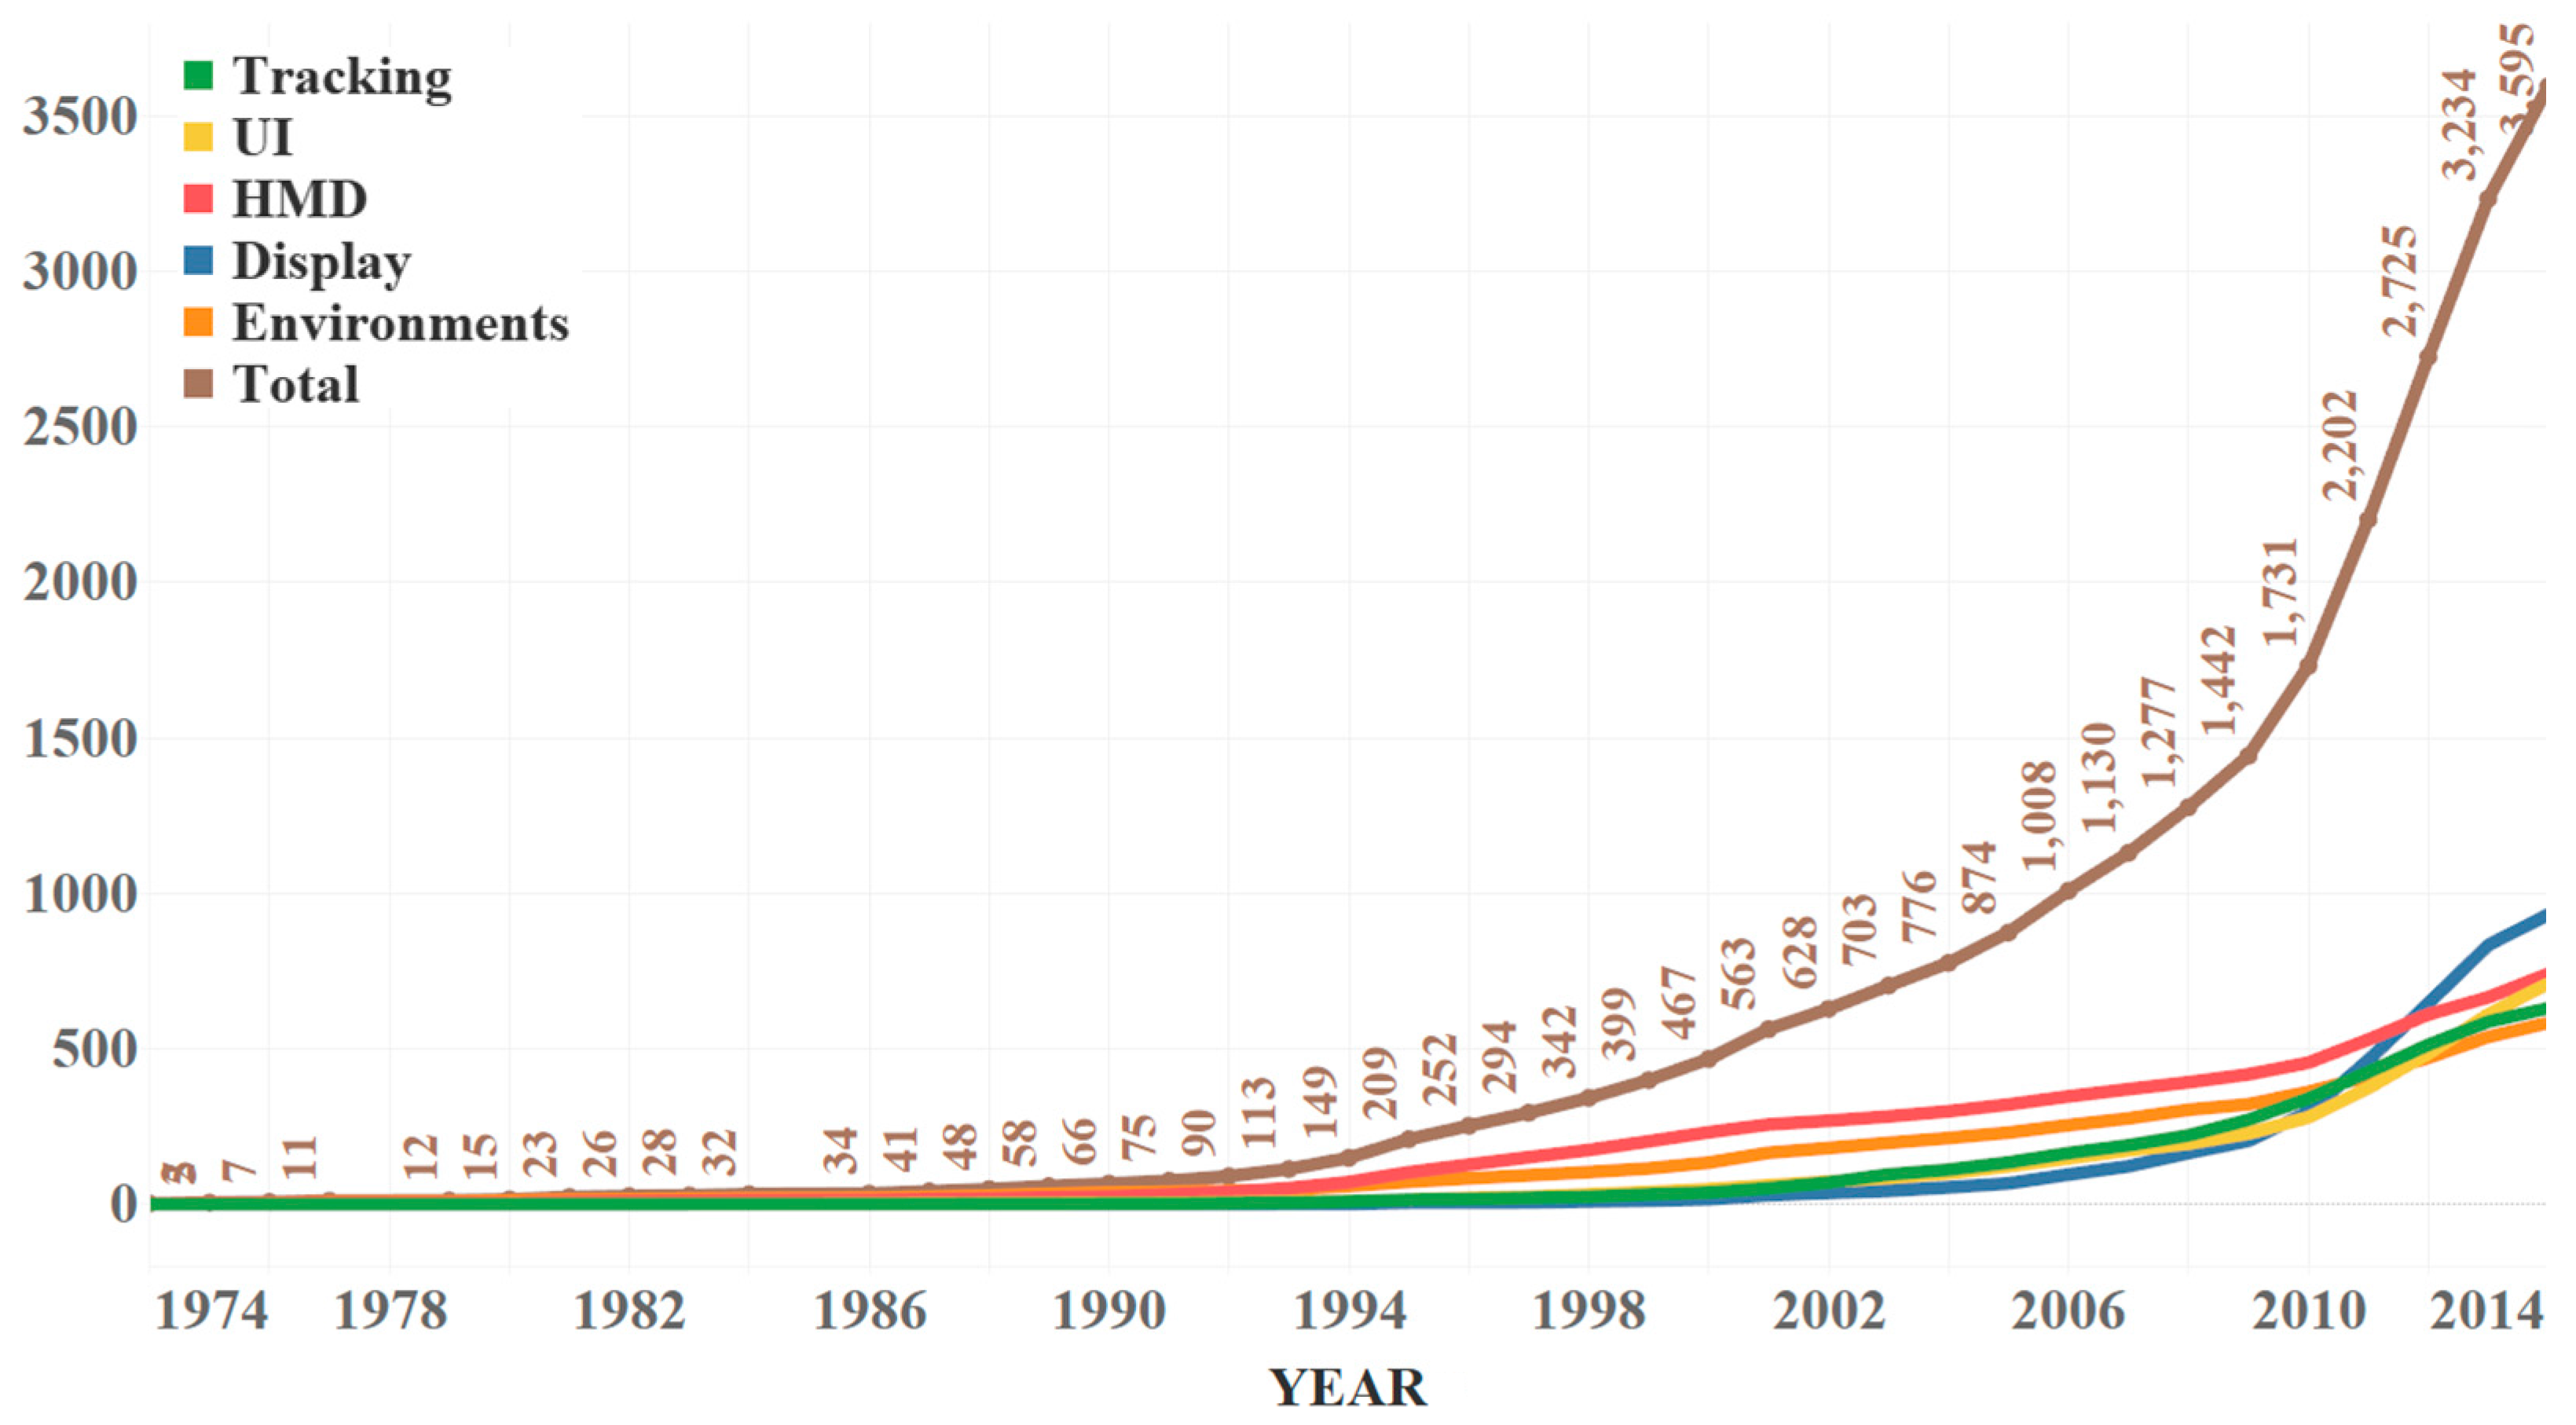
Figure 7.
Top 1% firms’ technology concentrations for technology subjects (12 firms, Y-axis: TKS).

Figure 8.
Dynamic trend of technical focus of firms by correspondence analysis (1975–1994).

Figure 9.
Dynamic trend of technical focus of firms by correspondence analysis (1995–2014).


Table 1.
Patent retrieval query for augmented reality technology.
| Retrieval Query Statement (3595 Valid Patents) |
|---|
| (((augmented near2 (reality or experience)) or (mixed near2 reality))) OR (((augmented near2 (reality or experience)) or (mixed near2 reality)) and (track* or trace* or chase or pursuit* or pursue) and (Gyro* or INS or (inertia adj2 navigation) or sensor sens* or gis or GPS or (global near2 positioning) or LBS or (location adj2 based adj2 service) or (Positional adj3 information) or compass or ((magnetic or electromagnetic or mechanical or optical or inertial or ultrasonic) near2 tracker) or track*)) OR (((augmented near2 (reality or experience)) or (mixed near2 reality)) and (marker or ARTag or Artoolkit or colorcode or QR-code or ((identification or specific or AR) near2 code))) OR (((augmented near2 (reality or experience)) or (mixed near2 reality)) and (track* or trace* or chase or pursuit* or pursue) and (markerless or SIFT or ferns or ((edge or Feature) near3 extract*) or slam or (interest near2 point) or POI or camera or ((3d or 3-dimension*) adj2 (model or based)) or (computer near2 vision))) OR (((augmented near2 (reality or experience)) or (mixed near2 reality)) and (track* or trace* or chase or pursuit* or pursue) and (((Gyro* or INS or (inertia adj2 navigation) or gis or GPS or (global near2 positioning) or LBS or (location adj2 based adj2 service) or (positional adj3 information) or compass or ((magnetic or electromagnetic or mechanical or optical or inertial or ultrasonic) near2 tracker)) and ((marker or ARTag or Artoolkit or colorcode or QR-code or ((identification or specific or AR) near2 code)) or (markerless or SIFT or ferns or ((edge or Feature) near3 extract*) or slam or (interest near2 point) or POI or camera or ((3d or 3-dimension*) adj2 (model or based)) or (computer near2 vision)))) or ((marker or ARTag or Artoolkit or colorcode or QR-code or ((identification or specific or AR) near2 code)) and (markerless or SIFT or ferns or ((edge or Feature) near3 extract*) or slam or (interest near2 point) or POI or camera or ((3d or 3-dimension*) adj2 (model or based)) or (computer near2 vision))))) OR ((((augmented near2 (reality or experience)) or (mixed near2 reality)) and (display or express or show or project* or screen) and (HMD OR HUD OR EMD OR parallax OR ((head-mount*)or(head and mount*)) OR head-up OR Eyeglass-Mounted or ((video or optical) near2 see-through))) OR (((head and mount*) or (head-mount*)) and display)) OR (((augmented near2 (reality or experience)) or (mixed near2 reality)) and (display or express or show or project* or screen) and (project* OR Spatial OR Diorama OR SAR or non-HMD or spatial-AR or laser or calibration or hologra* or panorama or cineorama)) OR (((augmented near2 (reality or experience)) or (mixed near2 reality)) and (display or express or show or project* or screen) and (Smartphone OR UMPC OR tablet OR PDA OR handheld OR mobile OR ((personal or portable) near2 terminal) OR (personal adj2 digital adj2 assistant) or (mobile adj2 communication and device))) |
Table 2.
Five technology subjects and their major contributing terms.
| Topic # | Technology Subject (Abbreviation) | Major Contributing Terms and Probability |
|---|---|---|
| Topic 1 | Tracking sensors and approaches (Tracking) | Image (0.068), Object (0.030), Camera (0.014), Position (0.012), Plurality (0.008), Orientation (0.008), Location (0.008), Sensor (0.007), Target (0.006) |
| Topic 2 | User interface and interaction (UI) | Image (0.042), Virtual (0.029), User (0.028), Information (0.020), Object (0.019), Position (0.016), Configure (0.009), Control (0.008), Input (0.008) |
| Topic 3 | Displays (Display) | Display (0.060), Image (0.054), Light (0.040), Optical (0.035), Eye (0.016), Source (0.012), Lens (0.008), Beam (0.007), Axis (0.006) |
| Topic 4 | Head-mounted displays (HMD) | Display (0.037), Head (0.028), Image (0.019), Mounted (0.017), Signal (0.016), Eye (0.015), Light (0.009), View (0.007), Camera (0.007) |
| Topic 5 | More requirements of augmented reality (Environment) | Information (0.032), Object (0.025), Mobile (0.016), Location (0.015), Content (0.008), Server (0.007), Computer (0.007), Communication (0.006), Terminal (0.005) |
Table 3.
Technological knowledge stock (TKS) values of technology subject over time.
| Year | Tracking | UI | Display | HMD | Environment | Annual TKS 1 | # Of Applicant |
|---|---|---|---|---|---|---|---|
| 1974 | 0.0007 | 0.0007 | 0.9922 | 1.0057 | 0.0007 | 2 | 2 |
| 1975 | 0.0921 | 0.1469 | 1.8231 | 0.9274 | 0.0106 | 3 | 3 |
| 1976 | 0.1690 | 0.0342 | 0.1694 | 1.6271 | 0.0004 | 2 | 2 |
| 1977 | 0.0010 | 0.1405 | 0.5628 | 3.2948 | 0.0010 | 4 | 3 |
| 1979 | 0.0004 | 0.0004 | 0.0558 | 0.9430 | 0.0004 | 1 | 1 |
| 1980 | 0.0006 | 0.0006 | 0.0006 | 2.9977 | 0.0006 | 3 | 2 |
| 1981 | 0.3524 | 0.3013 | 3.4562 | 3.8879 | 0.0023 | 8 | 7 |
| 1982 | 0.0939 | 0.1193 | 2.0927 | 0.6933 | 0.0007 | 3 | 3 |
| 1983 | 0.0006 | 0.0006 | 0.6338 | 1.3644 | 0.0006 | 2 | 2 |
| 1984 | 0.0009 | 0.0934 | 2.2971 | 1.5305 | 0.0780 | 4 | 4 |
| 1986 | 0.0007 | 0.3036 | 0.4519 | 1.2431 | 0.0007 | 2 | 2 |
| 1987 | 0.1815 | 0.9077 | 2.8714 | 3.0373 | 0.0021 | 7 | 4 |
| 1988 | 0.2964 | 0.4896 | 2.1667 | 4.0456 | 0.0016 | 7 | 7 |
| 1989 | 0.0027 | 0.4225 | 4.2648 | 5.2757 | 0.0342 | 10 | 7 |
| 1990 | 0.6718 | 0.7008 | 2.0097 | 4.6150 | 0.0027 | 8 | 5 |
| 1991 | 0.0245 | 0.2026 | 6.6733 | 2.0971 | 0.0026 | 9 | 8 |
| 1992 | 1.5585 | 1.2398 | 7.8640 | 4.3301 | 0.0076 | 15 | 14 |
| 1993 | 1.4204 | 2.7441 | 13.3514 | 4.7572 | 0.7269 | 23 | 13 |
| 1994 | 4.2587 | 1.6429 | 19.3679 | 10.7181 | 0.0123 | 36 | 24 |
| 1995 | 5.5561 | 5.0437 | 31.6031 | 13.7108 | 4.0863 | 60 | 22 |
| 1996 | 1.9171 | 5.4246 | 24.4643 | 10.8937 | 0.3004 | 43 | 26 |
| 1997 | 3.7650 | 3.9452 | 23.9119 | 9.9537 | 0.4242 | 42 | 28 |
| 1998 | 3.6143 | 7.7532 | 23.0168 | 10.3425 | 3.2732 | 48 | 33 |
| 1999 | 7.5522 | 7.4426 | 27.9970 | 11.5954 | 2.4128 | 57 | 30 |
| 2000 | 6.1862 | 9.2576 | 29.1167 | 18.8642 | 4.5754 | 68 | 40 |
| 2001 | 13.6762 | 12.4477 | 25.1255 | 31.6547 | 13.0960 | 96 | 42 |
| 2002 | 18.5006 | 11.8275 | 12.0857 | 15.1498 | 7.4363 | 65 | 32 |
| 2003 | 25.7193 | 12.4989 | 13.6177 | 16.8326 | 6.3315 | 75 | 46 |
| 2004 | 15.3650 | 14.3041 | 16.8171 | 15.3254 | 11.1884 | 73 | 41 |
| 2005 | 23.4290 | 22.5184 | 21.7706 | 17.4803 | 12.8017 | 98 | 50 |
| 2006 | 30.0817 | 25.5037 | 26.0297 | 23.8998 | 28.4850 | 134 | 68 |
| 2007 | 24.9355 | 25.6394 | 23.2077 | 21.7473 | 26.4701 | 122 | 61 |
| 2008 | 31.8693 | 22.3986 | 22.1968 | 27.8292 | 42.7061 | 147 | 64 |
| 2009 | 50.2044 | 32.2948 | 25.4352 | 17.7482 | 39.3174 | 165 | 74 |
| 2010 | 68.4973 | 50.9501 | 37.5198 | 39.7408 | 92.2919 | 289 | 124 |
| 2011 | 84.6816 | 94.5669 | 74.4524 | 49.9303 | 167.3688 | 471 | 182 |
| 2012 | 88.1360 | 111.8118 | 80.5942 | 60.0104 | 182.4476 | 523 | 367 |
| 2013 | 73.8828 | 125.4548 | 55.4768 | 66.9082 | 187.2774 | 509 | 361 |
| 2014 | 43.7489 | 98.3733 | 75.2857 | 45.0588 | 98.5334 | 361 | 180 |
| Total | 630.4453 (17.54%) | 708.9484 (19.70%) | 740.8295 (20.65%) | 583.0671 (16.26%) | 931.7099 (25.85%) | 3595 (100%) |
1 Note: Annual TKS values are identical to annual patent applications.
Table 4.
Herfindahl–Hirschman Index (HHI) of the technology subjects using their total TKS values.
| Topic # | Technology Subject | HHI Value | Concentration Ratio |
|---|---|---|---|
| Topic 1 | Tracking | 224.5939 | Unconcentrated |
| Topic 2 | UI | 200.5407 | Unconcentrated |
| Topic 3 | Environment | 134.0661 | Unconcentrated |
| Topic 4 | Display | 87.1175 | Unconcentrated |
| Topic 5 | HMD | 79.6436 | Unconcentrated |
Table 5.
HHI values of the technology subjects using their annual TKS values.
| Year | Tracking | UI | Display | HMD | Environ. | Total | # of Applicants |
|---|---|---|---|---|---|---|---|
| 1974 | 5102.04 | 5102.04 | 6661.50 | 6615.73 | 5102.04 | 5000.00 | 2 |
| 1975 | 9891.87 | 9945.65 | 4626.38 | 9965.55 | 9266.64 | 3333.33 | 3 |
| 1976 | 9988.17 | 9883.39 | 8878.65 | 5000.36 | 5555.56 | 5000.00 | 2 |
| 1977 | 5200.00 | 9957.23 | 9988.37 | 6184.45 | 5200.00 | 5000.00 | 3 |
| 1979 | 10,000.00 | 10,000.00 | 10,000.00 | 10,000.00 | 10,000.00 | 10,000.00 | 1 |
| 1980 | 5200.00 | 5200.00 | 5200.00 | 5556.74 | 5200.00 | 5555.56 | 2 |
| 1981 | 5319.94 | 4947.73 | 1824.39 | 1749.04 | 1562.50 | 1562.50 | 7 |
| 1982 | 9957.40 | 5200.00 | 6131.37 | 9991.15 | 5200.00 | 5000.00 | 3 |
| 1983 | 10,000.00 | 10,000.00 | 10,000.00 | 10,000.00 | 10,000.00 | 10,000.00 | 2 |
| 1984 | 2592.59 | 9872.07 | 2974.99 | 3577.10 | 9821.60 | 2500.00 | 4 |
| 1986 | 5102.04 | 9980.26 | 6804.78 | 5003.23 | 5102.04 | 5000.00 | 2 |
| 1987 | 3750.00 | 9973.67 | 4971.05 | 4482.52 | 3750.00 | 3333.33 | 4 |
| 1988 | 9908.06 | 5612.58 | 3127.89 | 2172.74 | 1718.75 | 1666.67 | 7 |
| 1989 | 1764.71 | 9922.75 | 2633.06 | 2774.02 | 9205.00 | 1666.67 | 7 |
| 1990 | 2743.76 | 9962.91 | 3939.71 | 2690.29 | 2743.76 | 2800.00 | 5 |
| 1991 | 6966.26 | 5005.61 | 1601.79 | 2737.92 | 1568.05 | 1358.02 | 8 |
| 1992 | 3771.45 | 2518.35 | 1179.42 | 1838.74 | 2657.00 | 769.23 | 14 |
| 1993 | 4817.00 | 3325.68 | 2238.21 | 1411.06 | 3467.60 | 1201.81 | 13 |
| 1994 | 2694.63 | 2791.03 | 1449.13 | 902.30 | 983.91 | 670.34 | 24 |
| 1995 | 2254.50 | 2955.03 | 2217.03 | 791.58 | 7823.85 | 1034.71 | 22 |
| 1996 | 2614.76 | 1561.26 | 2000.66 | 619.88 | 6775.67 | 1054.42 | 26 |
| 1997 | 1650.67 | 2303.59 | 845.58 | 1108.77 | 6527.75 | 504.02 | 28 |
| 1998 | 1821.31 | 2566.32 | 540.71 | 965.77 | 2548.45 | 453.69 | 33 |
| 1999 | 3837.68 | 1648.95 | 723.93 | 1058.64 | 2649.31 | 616.00 | 30 |
| 2000 | 1478.00 | 3737.70 | 705.41 | 503.00 | 1877.90 | 576.97 | 40 |
| 2001 | 1734.04 | 2614.44 | 892.15 | 615.70 | 1925.33 | 546.94 | 42 |
| 2002 | 1156.36 | 1596.78 | 777.00 | 614.22 | 2027.21 | 444.21 | 32 |
| 2003 | 495.17 | 1284.95 | 753.79 | 658.38 | 1160.42 | 270.55 | 46 |
| 2004 | 1868.51 | 2139.51 | 957.14 | 566.27 | 815.93 | 567.60 | 41 |
| 2005 | 1503.84 | 1294.54 | 603.62 | 622.00 | 698.36 | 442.67 | 50 |
| 2006 | 1085.89 | 885.61 | 461.06 | 476.45 | 1036.42 | 300.82 | 68 |
| 2007 | 722.82 | 1122.14 | 687.39 | 889.34 | 556.56 | 313.95 | 61 |
| 2008 | 671.81 | 2210.76 | 628.69 | 868.38 | 456.59 | 398.57 | 64 |
| 2009 | 1539.85 | 672.28 | 845.87 | 538.21 | 375.61 | 422.50 | 74 |
| 2010 | 610.21 | 441.10 | 443.34 | 376.31 | 330.78 | 245.91 | 124 |
| 2011 | 606.86 | 288.41 | 1032.96 | 402.27 | 456.34 | 277.56 | 182 |
| 2012 | 165.18 | 156.37 | 726.90 | 384.80 | 99.11 | 103.31 | 367 |
| 2013 | 133.08 | 165.76 | 420.49 | 156.96 | 148.11 | 81.85 | 361 |
| 2014 | 526.38 | 526.00 | 1529.11 | 295.55 | 208.12 | 256.56 | 180 |
Table 6.
Part of patent-topic distribution matrix.
| Application No. | Tracking | UI | Display | HMD | Environment |
|---|---|---|---|---|---|
| 1999-335497 | 0.000095 | 0.000095 | 0.999618 | 0.000095 | 0.000095 |
| 1980-167276 | 0.000088 | 0.000088 | 0.000088 | 0.999650 | 0.000088 |
| 2000-558631 | 0.000122 | 0.000122 | 0.999514 | 0.000122 | 0.000122 |
| 2006-307856 | 0.000124 | 0.000124 | 0.000124 | 0.999504 | 0.000124 |
| 1999-266855 | 0.000122 | 0.000122 | 0.999514 | 0.000122 | 0.000122 |
| 2010-706352 | 0.000128 | 0.000128 | 0.000128 | 0.999486 | 0.000128 |
| 2010-769063 | 0.000141 | 0.000141 | 0.000141 | 0.999437 | 0.000141 |
| 1980-167275 | 0.000156 | 0.000156 | 0.000156 | 0.999375 | 0.000156 |
| 2010-784753 | 0.000157 | 0.000157 | 0.000157 | 0.999373 | 0.000157 |
| 2002-217444 | 0.000159 | 0.000159 | 0.000159 | 0.999365 | 0.000159 |
| 2001-916266 | 0.000134 | 0.000134 | 0.999463 | 0.000134 | 0.000134 |
| 2011-022112 | 0.000162 | 0.000162 | 0.000162 | 0.999351 | 0.000162 |
| 2010-830866 | 0.000181 | 0.000181 | 0.000181 | 0.999278 | 0.000181 |
Table 7.
TKS values of the top 1% applicants (12 firms).
| Applicant Name | Tracking | UI | Display | HMD | Environment | Total |
|---|---|---|---|---|---|---|
| Microsoft | 81.9564 | 38.5724 | 11.7021 | 13.7289 | 44.0403 | 190 |
| Canon | 48.5475 | 66.4214 | 20.0489 | 9.7537 | 2.2285 | 147 |
| 22.6791 | 21.4267 | 30.3536 | 33.0973 | 33.4432 | 141 | |
| Sony | 13.1387 | 40.0861 | 44.6791 | 17.4248 | 4.6714 | 120 |
| Olympus | 3.8236 | 9.8572 | 65.6424 | 9.5854 | 1.0914 | 90 |
| LG | 0.8117 | 34.3932 | 29.9729 | 6.4494 | 10.3728 | 82 |
| Seiko Epson | 1.8086 | 36.2027 | 34.0214 | 8.7221 | 0.2451 | 81 |
| Samsung | 11.5000 | 19.4594 | 9.9495 | 4.4415 | 28.6496 | 74 |
| Qualcomm | 27.7884 | 17.5301 | 1.0391 | 5.0674 | 22.5750 | 74 |
| Osterhout group | 0.7042 | 17.0887 | 41.3001 | 1.2815 | 3.6255 | 64 |
| Pantech | 4.5653 | 10.5839 | 0.0804 | 0.0953 | 36.6750 | 52 |
| Nokia | 7.0293 | 6.1395 | 0.1609 | 1.7396 | 30.9307 | 46 |
Table 8.
Patent applications by Sony and Olympus during the period 2005–2009.
| Year | Application No. | Title | Applicant |
|---|---|---|---|
| 2005 | 2005-661585 | Augmented reality game system using identification information to display a virtual object in association with a position of a real object | Sony |
| 2006 | 2006-418989 | Methods and apparatus for capturing audio signals based on a visual image | Sony |
| 2006 | 2006-429133 | Selective sound source listening in conjunction with computer interactive processing | Sony |
| 2006 | 2006-382032 | System for tracking user manipulations within an environment | Sony |
| 2006 | 2006-382035 | Inertially trackable hand-held controller | Sony |
| 2006 | 2006-521457 | Adjustable head-mount type display device | Sony |
| 2006 | 2006-536559 | Mapping movements of a hand-held controller to the two-dimensional image plane of a display screen | Sony |
| 2007 | 2007-689982 | Scheme for determining the locations and timing of advertisements and other insertions in media | Sony |
| 2007 | 2007-697633 | Personal theater display | Sony |
| 2007 | 2007-438735 | DISPLAY DEVICE AND DISPLAY METHOD | Sony |
| 2007 | 2007-840170 | Object detection using video input combined with tilt angle information | Sony |
| 2007 | 2007-312615 | Image display system, display apparatus, and display method | Sony |
| 2008 | 2008-048269 | Enhanced video telephony through augmented reality | Sony |
| 2008 | 2008-105367 | Augmented reality enhanced audio | Sony |
| 2008 | 2008-134354 | Information processing apparatus, information processing method, and computer program | Sony |
| 2008 | 2008-193868 | IMAGE COMBINING METHOD, SYSTEM AND APPARATUS | Sony |
| 2008 | 2008-204417 | Image processing apparatus and method | Sony |
| 2008 | 2008-262044 | Method and apparatus for tracking three-dimensional movements of an object using a depth sensing camera | Sony |
| 2009 | 2009-392044 | Methods for capturing depth data of a scene and applying computer actions | Sony |
| 2009 | 2009-422227 | Methods and systems for enabling control of artificial intelligence game characters | Sony |
| 2009 | 2009-426186 | Control device for communicating visual information | Sony |
| 2009 | 2009-059757 | Entertainment device and method of interaction | Sony |
| 2009 | 2009-463359 | Base station for position location | Sony |
| 2009 | 2009-475449 | Multi-positional three-dimensional controller | Sony |
| 2009 | 2009-542032 | Entertainment device, system, and method | Sony |
| 2009 | 2009-543989 | HEAD-MOUNTED DISPLAY | Sony |
| 2009 | 2009-604800 | Head-mounted display apparatus | Sony |
| 2009 | 2009-627862 | HEAD MOUNTED DISPLAY | Sony |
| 2005 | 2005-052729 | Camera and photographing method for setting focal distance of photographing optical system so as to correspond to information that indicates photographic range inputted via an operation section | Olympus |
| 2005 | 2005-067088 | Head-mounted display system and method for processing images | Olympus |
| 2005 | 2005-122502 | Head-mounted display apparatus | Olympus |
| 2005 | 2005-180894 | Information display system | Olympus |
| 2005 | 2005-180883 | Information display system | Olympus |
| 2006 | 2006-337956 | Image processing device | Olympus |
| 2006 | 2006-373884 | Display device | Olympus |
| 2006 | 2006-600429 | Head mount type image display system | Olympus |
| 2009 | 2009-639424 | HEAD-MOUNTED TYPE IMAGE DISPLAY DEVICE | Olympus |
Table 9.
Cosine similarity of firms’ TKS distribution during the period 2005–2009.
| Canon | Microsoft | Nikon | Nokia | Konica Minolta | Sony | Olympus | Apple | Samsung | Ricoh | |
|---|---|---|---|---|---|---|---|---|---|---|
| Canon | 1 | - | - | - | - | - | - | - | - | - |
| Microsoft | 0.7337 | 1 | - | - | - | - | - | - | - | - |
| Nikon | 0.3621 | 0.2326 | 1 | - | - | - | - | - | - | - |
| Nokia | 0.4919 | 0.8357 | 0.0886 | 1 | - | - | - | - | - | - |
| Konica minolta | 0.1214 | 0.1612 | 0.7031 | 0.0132 | 1 | - | - | - | - | - |
| Sony | 0.6367 | 0.4611 | 0.7078 | 0.2972 | 0.8179 | 1 | - | - | - | - |
| Olympus | 0.6265 | 0.4951 | 0.8072 | 0.2506 | 0.8428 | 0.9722 | 1 | - | - | - |
| Apple | 0.1945 | 0.5622 | 0.3250 | 0.8691 | 0.2001 | 0.3017 | 0.2677 | 1 | - | - |
| Samsung | 0.8527 | 0.6247 | 0.4145 | 0.6645 | 0.2043 | 0.7022 | 0.6147 | 0.5415 | 1 | - |
| Ricoh | 0.1427 | 0.5253 | 0.0544 | 0.8984 | 0.0095 | 0.1500 | 0.0712 | 0.9590 | 0.5065 | 1 |
Table 10.
TKSs of Osterhout group, Seiko Epson, and Sony during the period 2010–2014.
| Applicant Name | Tracking | UI | Display | HMD | Environment | Total |
|---|---|---|---|---|---|---|
| Seiko epson | 1.542548 | 34.21329 | 0.23848 | 26.57048 | 7.4352 | 70 |
| Sony | 2.195377 | 21.33332 | 0.707768 | 29.76205 | 11.00149 | 65 |
| Osterhout group | 0.704187 | 17.08872 | 3.625475 | 41.3001 | 1.281518 | 64 |
© 2017 by the authors. Licensee MDPI, Basel, Switzerland. This article is an open access article distributed under the terms and conditions of the Creative Commons Attribution (CC BY) license (http://creativecommons.org/licenses/by/4.0/).
Share and Cite
MDPI and ACS Style
Jeong, B.; Yoon, J. Competitive Intelligence Analysis of Augmented Reality Technology Using Patent Information. Sustainability 2017, 9, 497. https://doi.org/10.3390/su9040497
AMA Style
Jeong B, Yoon J. Competitive Intelligence Analysis of Augmented Reality Technology Using Patent Information. Sustainability. 2017; 9(4):497. https://doi.org/10.3390/su9040497
Chicago/Turabian StyleJeong, Byeongki, and Janghyeok Yoon. 2017. "Competitive Intelligence Analysis of Augmented Reality Technology Using Patent Information" Sustainability 9, no. 4: 497. https://doi.org/10.3390/su9040497
Note that from the first issue of 2016, this journal uses article numbers instead of page numbers. See further details here.