
The Biogeophysical Effects of Revegetation around Mining Areas: A Case Study of Dongsheng Mining Areas in Inner Mongolia

1
College of Desert Control Science and Engineering, Inner Mongolia Agricultural University, Hohhot 010018, China
2
Institute of Geographic Sciences and Natural Resources Research, Chinese Academy of Sciences, Beijing 100101, China
3
Institute of Remote Sensing and Digital Earth, Chinese Academy of Sciences, Beijing 100101, China
*
Authors to whom correspondence should be addressed.
Sustainability 2017, 9(4), 628; https://doi.org/10.3390/su9040628
Submission received: 12 February 2017
/
Revised: 12 April 2017
/
Accepted: 14 April 2017
/
Published: 17 April 2017
Abstract
:The biogeophysical effects of land cover change (LCC) on land surface temperature are largely understood, especially in tropical and boreal zones, but fewer studies have reported the biogeophysical consequences of ecological restoration of mining areas located in arid and semi-arid temperate zones. In this study, we employed 2000–2015 satellite-based net radiation (Rn) and latent heat flux (LE) data from mining areas (taking Dongsheng in Inner Mongolia as an example) and adjacent ecological restoration areas to understand the biogeophysical effect of revegetation around mining areas. The results showed that revegetation increased Rn (0.25 ± 0.17 W/m2) and LE (0.43 ± 0.26 W/m2). The warming effect of increased Rn (∆Rn), however, was completely offset by the cooling effect of increased LE (∆LE), thus revegetation caused an overall cooling effect of −0.18 ± 0.17 W/m2. Land surface temperature (LST) from mining areas and adjacent ecological restoration areas also showed that revegetation decreased LST (∆LST being −0.2 ± 0.1 K). The difference of ∆Rn and ∆LE explained 27% of the ∆LST variations. These findings reinforce our understanding for the potential climatic benefits of the ecological restoration around mining areas in arid and semi-arid temperate zones.
1. Introduction
Mining activities can generally give rise to vegetation deterioration, soil erosion, geological hazards and environmental pollution, which restrict the sustainable development of mining areas [1,2,3]. Mining areas are thus a typical vulnerable ecosystem [3,4]. To recover and maintain sustainable ecosystems around mines, revegetation has become one of the main means of ecological restoration of mining areas. It is based on recognizing the perniciousness of mining and the intrinsic cause of ecosystems’ destruction. In recent years, revegetation around mines has attracted the scientific community’s attention. Most studies have focused on some abilities of revegetation, mainly including vegetation cover changes [5,6,7], carbon sequestration [8,9], soil conservation and soil remediation [10,11]. For example, using Landsat satellite images with four different image processing methods, Karan et al. [6] evaluated the effectiveness of ecological restoration in the Block II area of the Jharia coal field, in India. Reclamation activity of mining areas largely improved vegetation cover [6]. The results from Mukhopadhyay and Masto [8] report that revegetation around mining areas causes a linear increase in soil organic carbon stock with time. In addition, revegetation around mining areas has also been proposed as a suitable technique to reduce metal toxicity and improve soil fertility [9]. However, the ability of temperature regulation of revegetation around mining areas has rarely been reported.
Revegetation plays an important role in regional temperature regulation. Many studies have reported that afforestation largely affects local climate by altering the land-atmosphere fluxes of energy and water [12,13,14,15,16,17]. However, current studies on the regional temperature regulation mainly concentrate on afforestation or deforestation. Lack of knowledge on temperature regulation of revegetation around mining areas limits our full understanding of revegetation effects. Similar to the biogeophysical mechanisms of afforestation affecting regional climate, revegetation around mining areas (mainly planting grass and shrubs) reduces land surface albedo, lowering solar radiation reflection to space [18,19,20,21]. The biogeophysical effects of revegetation around mining areas are further complicated given that land use changes simultaneously affect vegetation cover and partitioning of energy into different heat fluxes. On the other hand, ecological restoration of mining areas is an important form of ecological engineering with wide-area coverage [1,4]. Therefore, the ability of temperature regulation of revegetation around mining areas needs to be clarified. Certainly, revegetation around mining areas also has large biogeochemical effects by changing carbon uptake and emission. However, in this study we mainly focused on the biogeophysical effects.
The aims of this study are (1) to investigate the biogeophysical effects of revegetation around mining areas in Inner Mongolia; and (2) to explain the potential mechanism of these effects.
2. Materials and Methods
2.1. Study Area
In this study, we selected the Dongsheng coal mining areas in Inner Mongolia as a typical case study area. The area (approximately, 39.33°–40.25°N, 109.67°–110.83°E) is located in the northern Loess Plateau, which is controlled by an arid and semi-arid temperate continental climate. The annual total precipitation is nearly 350 mm, and the annual mean temperature is nearly 6.5 °C. The topography of the region is higher in the mid-western area and lower in other areas (Figure 1a).
2.2. Data and Processing
Data on the locations of mines in 2000 (shape file data, Figure 1a) were obtained from Inner Mongolia Agricultural University. The data were derived from Landsat TM/ETM+ imagery and validated based on Google Earth image and field data. The validation showed that the interpretation accuracy of the mining area location data reached 95%. To match the 500 m spatial resolution of remote sensing data, we only selected some mining areas of greater than 2.5 km2 area (a remote sensing pixel). The final mining areas are shown in Figure 1b. Generally, ecological restoration is implemented within the range of 1.5–2.0 km around mining areas according to our field observations. Thus, to expediently analyze the biogeophysical effect of revegetation, we uniformly assumed 1.5 km (buffer zones) around mining areas as potential revegetation zones.
The eight-day temporal interval and 500 spatial resolution MODIS data were collected from the Land Processes Distributed Active Archive Center for the period of 2000–2015, including surface reflectance data (MOD09A1), land surface shortwave white-sky albedo (or bi-hemispherical reflectance under conditions of isotropic illumination), and land surface temperature (LST, including daytime and nighttime data). The MOD09A1 product includes thirteen bands: six auxiliary information bands and seven spectral bands. Seven spectral bands cover red (620–670 nm), NIR1 (841–876 nm), blue (459–479 nm), green (545–565 nm), NIR2 (1230–1250 nm), SWIR1 (1628–1652 nm), and SWIR2 (2105–2155 nm) bands. Based on surface reflectance () from the NIR1 (), red (), and blue () bands, Normalized Difference Vegetation Index (NDVI) and Enhanced Vegetation Index (EVI) were derived from MOD09A1 data [22,23].
The Fractional Vegetation Cover (Fvc), defines the fraction of green vegetation as seen from the nadir of the total statistical area, is a canopy-intrinsic variable that depends only on the canopy structural attributes and plays an important role in carbon, water, and energy modeling [24]. It can be computed based on NDVI as follows:
where NDVImax and NDVImin represent the maximum and minimum NDVI, set as constants of 0.95 (NDVI value at 100% vegetation cover level) and 0.1 (NDVI of bare soil) for each pixel, respectively.
The modified Savitzky-Golay (mSG) filter is a simple but robust method based on the Savitzky-Golay (SG) filter [25,26], which employs land surface index time-series characterizations to smooth out the noise caused by clouds, atmospheric water vapor and aerosols. This study thus employed the mSG filter to smooth the temporal profiles of surface albedo, LST, NDVI and EVI [25,27].
Daily downward short-wave radiation flux (Rs) and net upward long-wave radiation flux (Rnl) with 0.125° spatial resolution were acquired form the European Centre for Medium-Range Weather Forecasts (ECMWF). To match the temporal and spatial resolutions of remote sensing data, downloaded radiation data (Rs and Rnl) were first resampled (500 m) based on the projection transformation with a bilinear interpolation technique [28], and then were composited to an eight-day temporal interval.
Surface net radiation (Rn) was calculated based on net short-wave radiation (Rns, which is a function of surface albedo () and Rs) and Rnl:
Latent heat flux (LE) or evapotranspiration was derived from a regression function based on Rn, EVI and LST [29], as Equation (5) shows. We used tower flux-observed LE data, which were collected from a Xilinguole grassland site (43.63°N, 116.70°E), to validate the performance of the method. This site was considered due to two reasons: (1) it is a typical semi-arid grassland site in ChinaFLUX (a similar grassland type in this study area); and (2) it is also the nearest tower flux site from our study area. The validation result is shown in the Section 3.2:
2.3. Statistical Analyses
The space-for-time substitution technique assumes that spatial and temporal variations are equivalent [30]. To investigate the climatic effect of revegetation, the space-for-time substitution technique was thus employed in this study. Its specific calculation is as follows:
where X represents Fvc, surface albedo, Rn, LE, or LST; Xmine and Xreveg are averaged X values in the mining area and the corresponding revegetation regions around the mining area, respectively. The least square method [31] was used to compute the trend (or slope) of ∆X. The coefficient of determination (R2) was used to explain the proportion of the variance in the dependent variable ∆X. The p-value was calculated based on Student’s t-test, and was used to examine the statistical significance of the slope.
3. Results
3.1. Vegetation Changes around Mining Areas
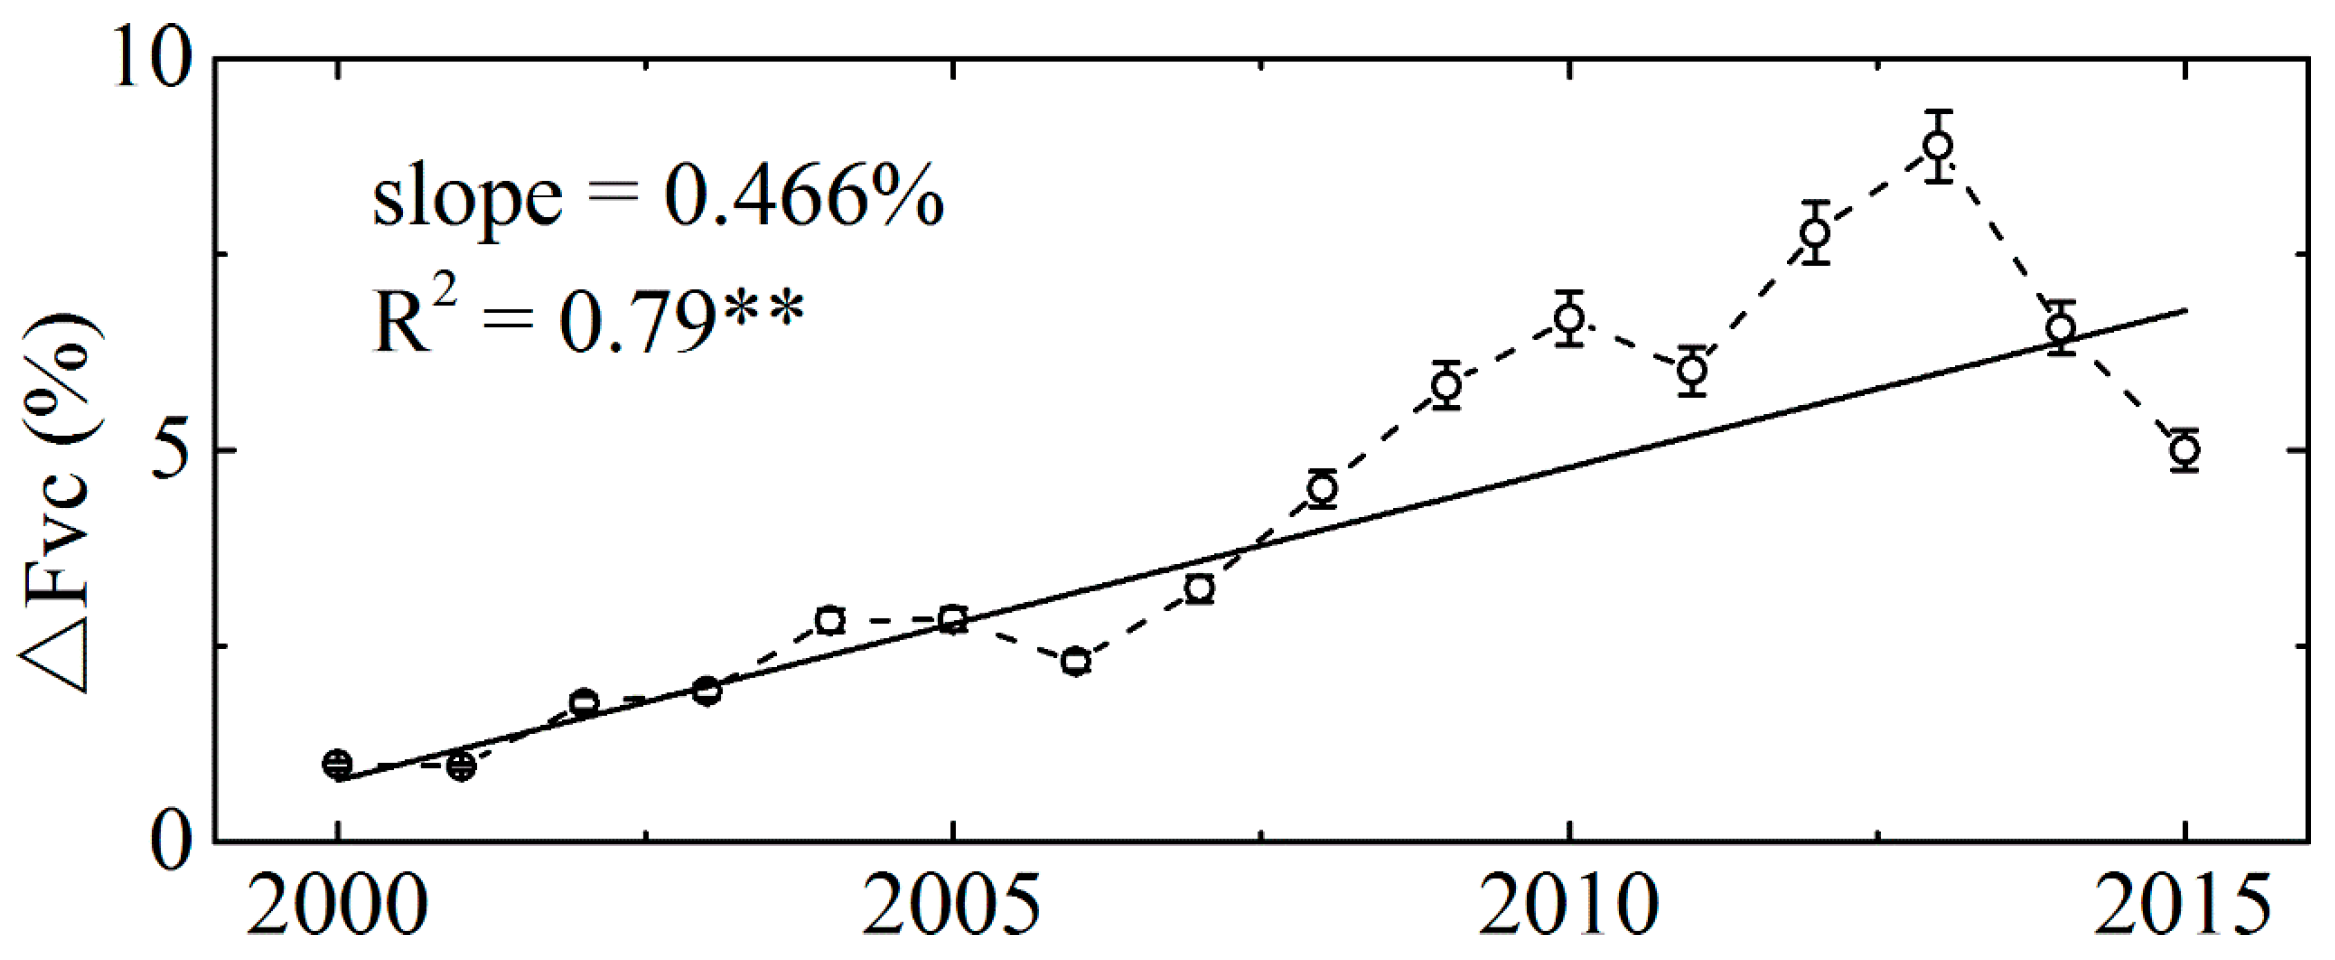
Ecological restoration significantly increased vegetation cover around mining areas with a slope of 0.47%/year (R2 = 0.79, p < 0.01) during the period 2000–2015. Figure 2 shows that ∆Fvc slowly increased before 2006 (slope = 0.31%/year), but after that ∆Fvc (2006–2013) rapidly increased with a slope of 0.88%/year (R2 = 0.95, p < 0.01). The reason for this increase could be attributed to the fact that eco-environmental restoration projects have been executed in this region since 2005. After 2013, a decreased trend was observed in ∆Fvc due to the drying and warming climate. However, an increased trend was still observed with a slope of 0.45%/year during the period 2006–2015, comparable with the slope during the entire period (2000–2015).
3.2. The Biogeophysical Effect of Ecological Restoration of Mining Areas
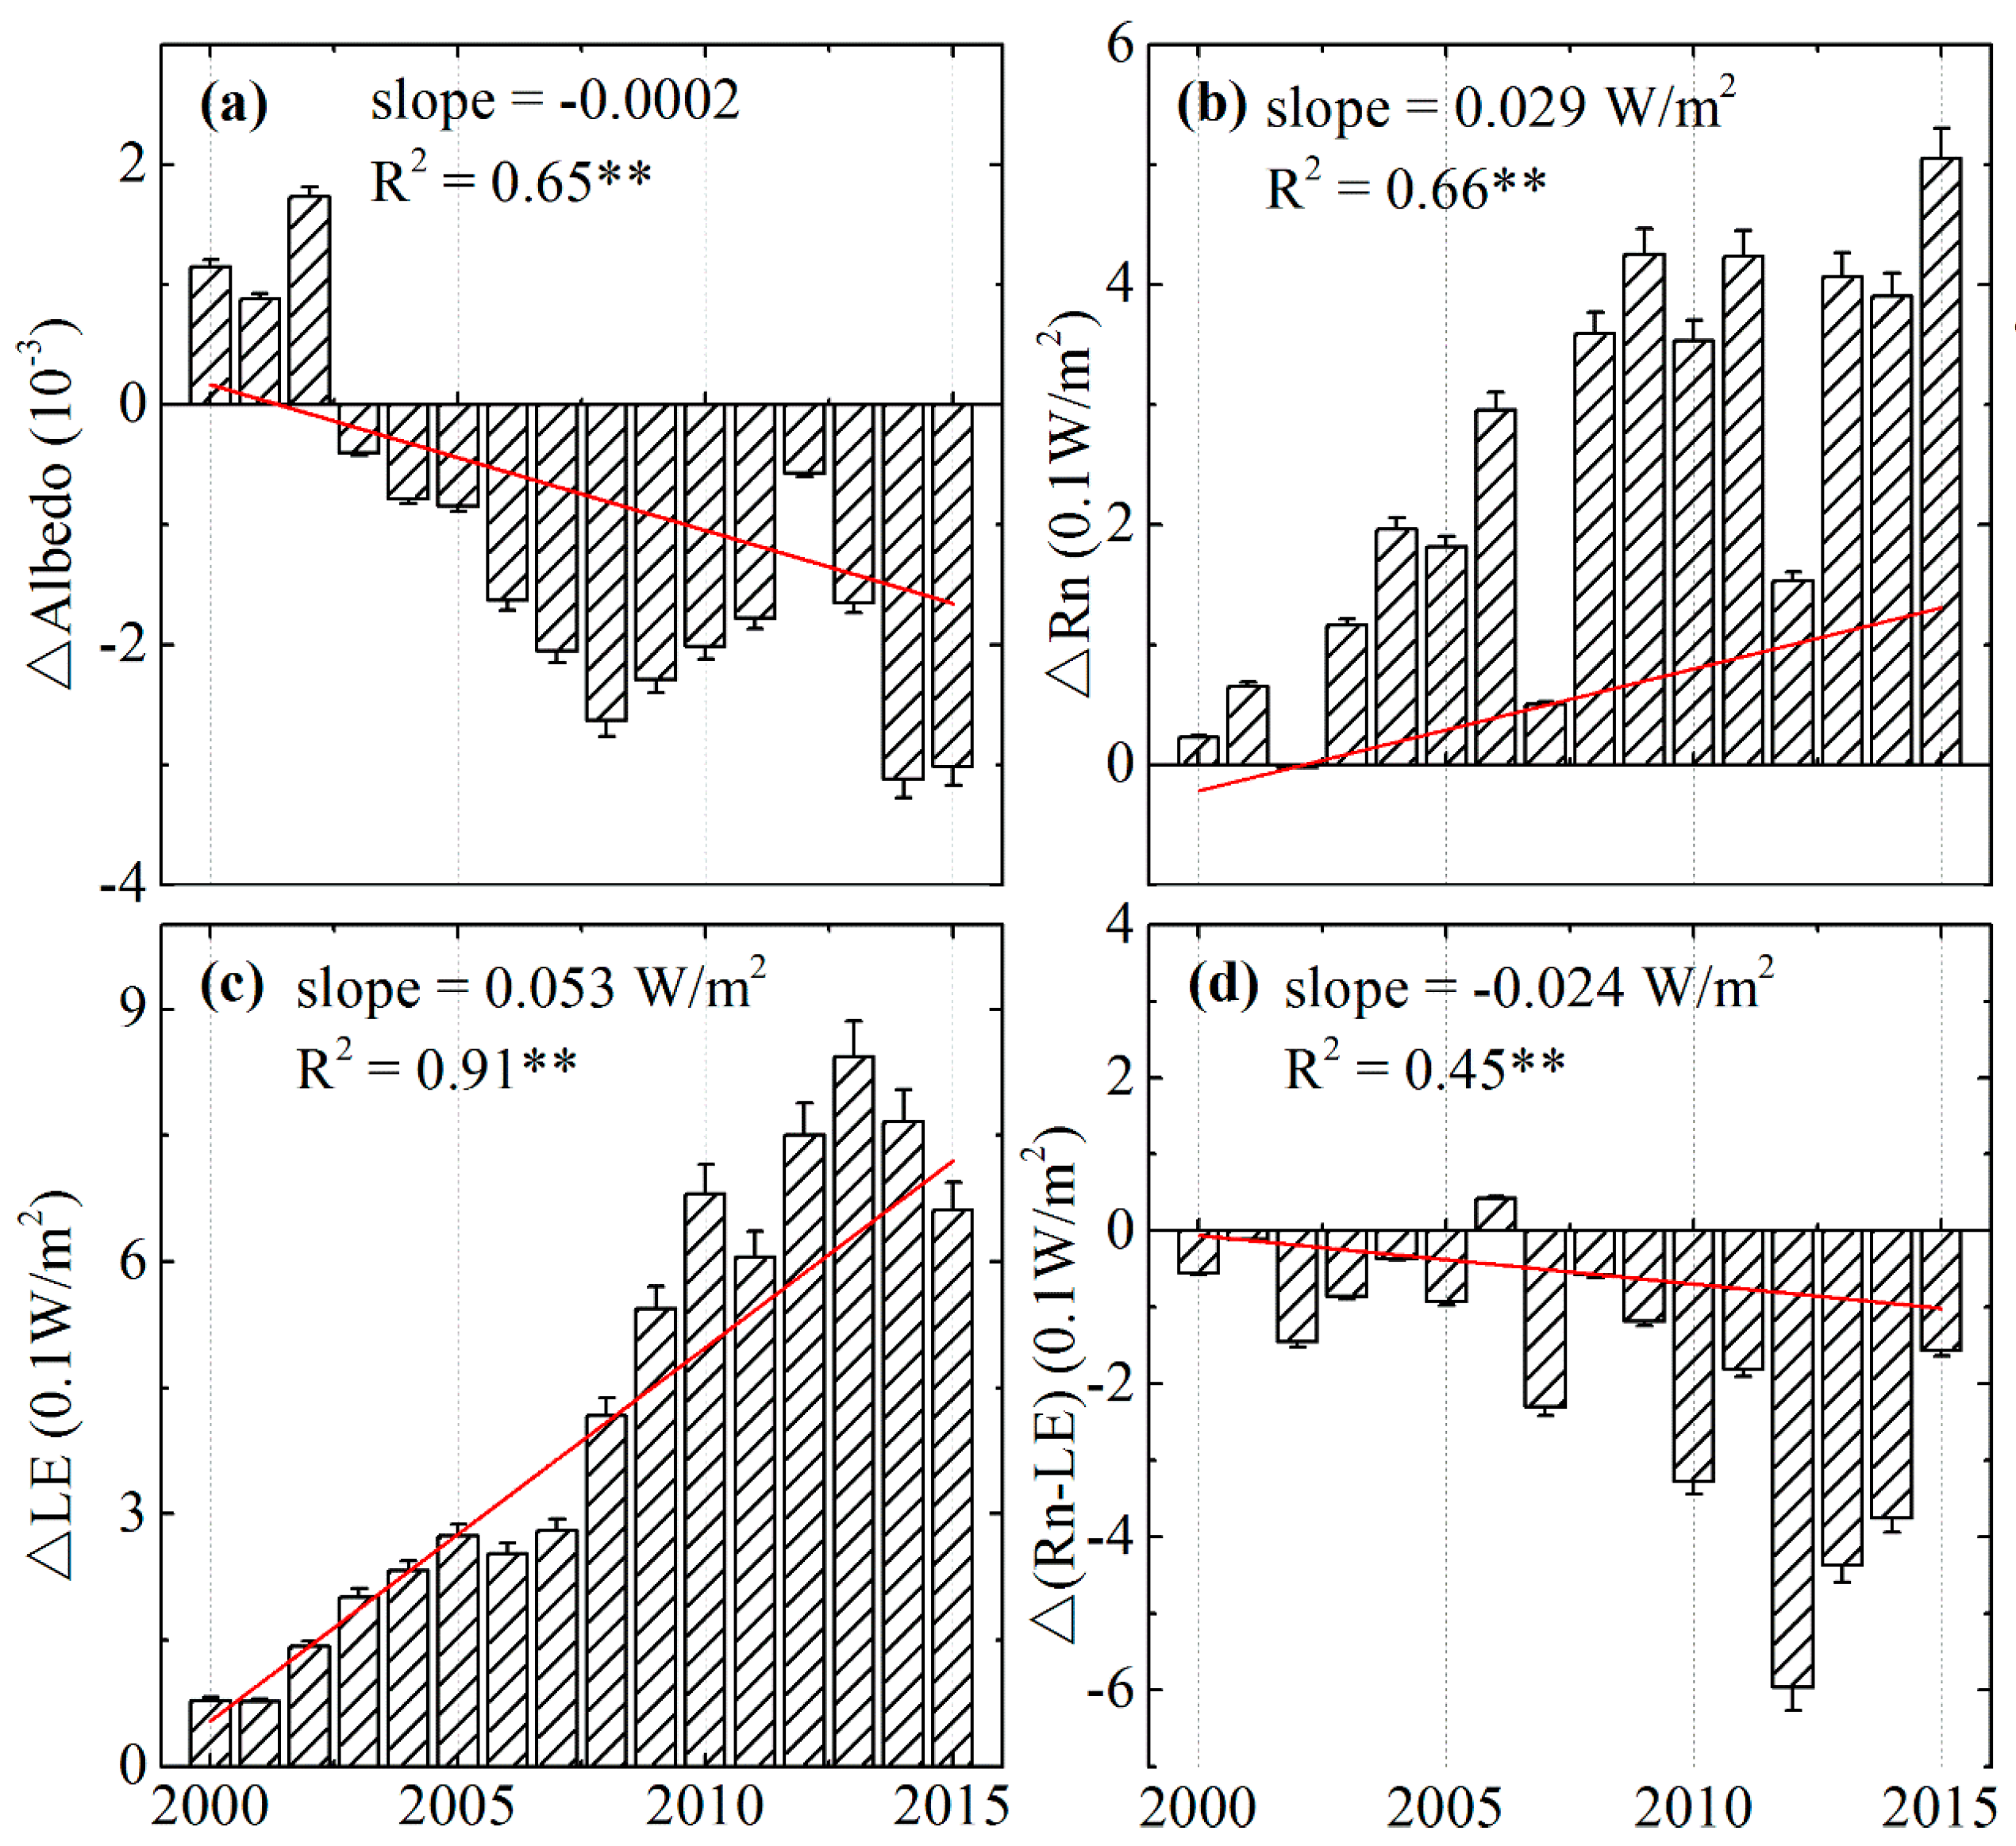
Revegetation around mining areas decreased the surface albedo, as vegetation generally has a lower surface albedo relative to bare soil. A highly decreased trend is observed in Figure 3a with a slope of 0.0002/year (R2 = 0.65, p < 0.01). ∆albedo shows a significant negative correlation with ∆Fvc (r = 0.62, p < 0.05), suggesting the important impact of revegetation on the change of the surface albedo. The change of the surface albedo caused the increase of surface Rns (~0.25 W/m2, 2000–2015 averaged). ∆Rns reveals a strong positive trend with a slope of 0.028 W/m2/year (R2 = 0.56, p < 0.01) given the decreased ∆albedo. ∆Rn further showed a highly increased trend with a slope of 0.029 W/m2/year (R2 = 0.66, p < 0.01, Figure 3b), suggesting that revegetation around mining areas resulted in a warming effect when considering only the effect of ∆Rns.
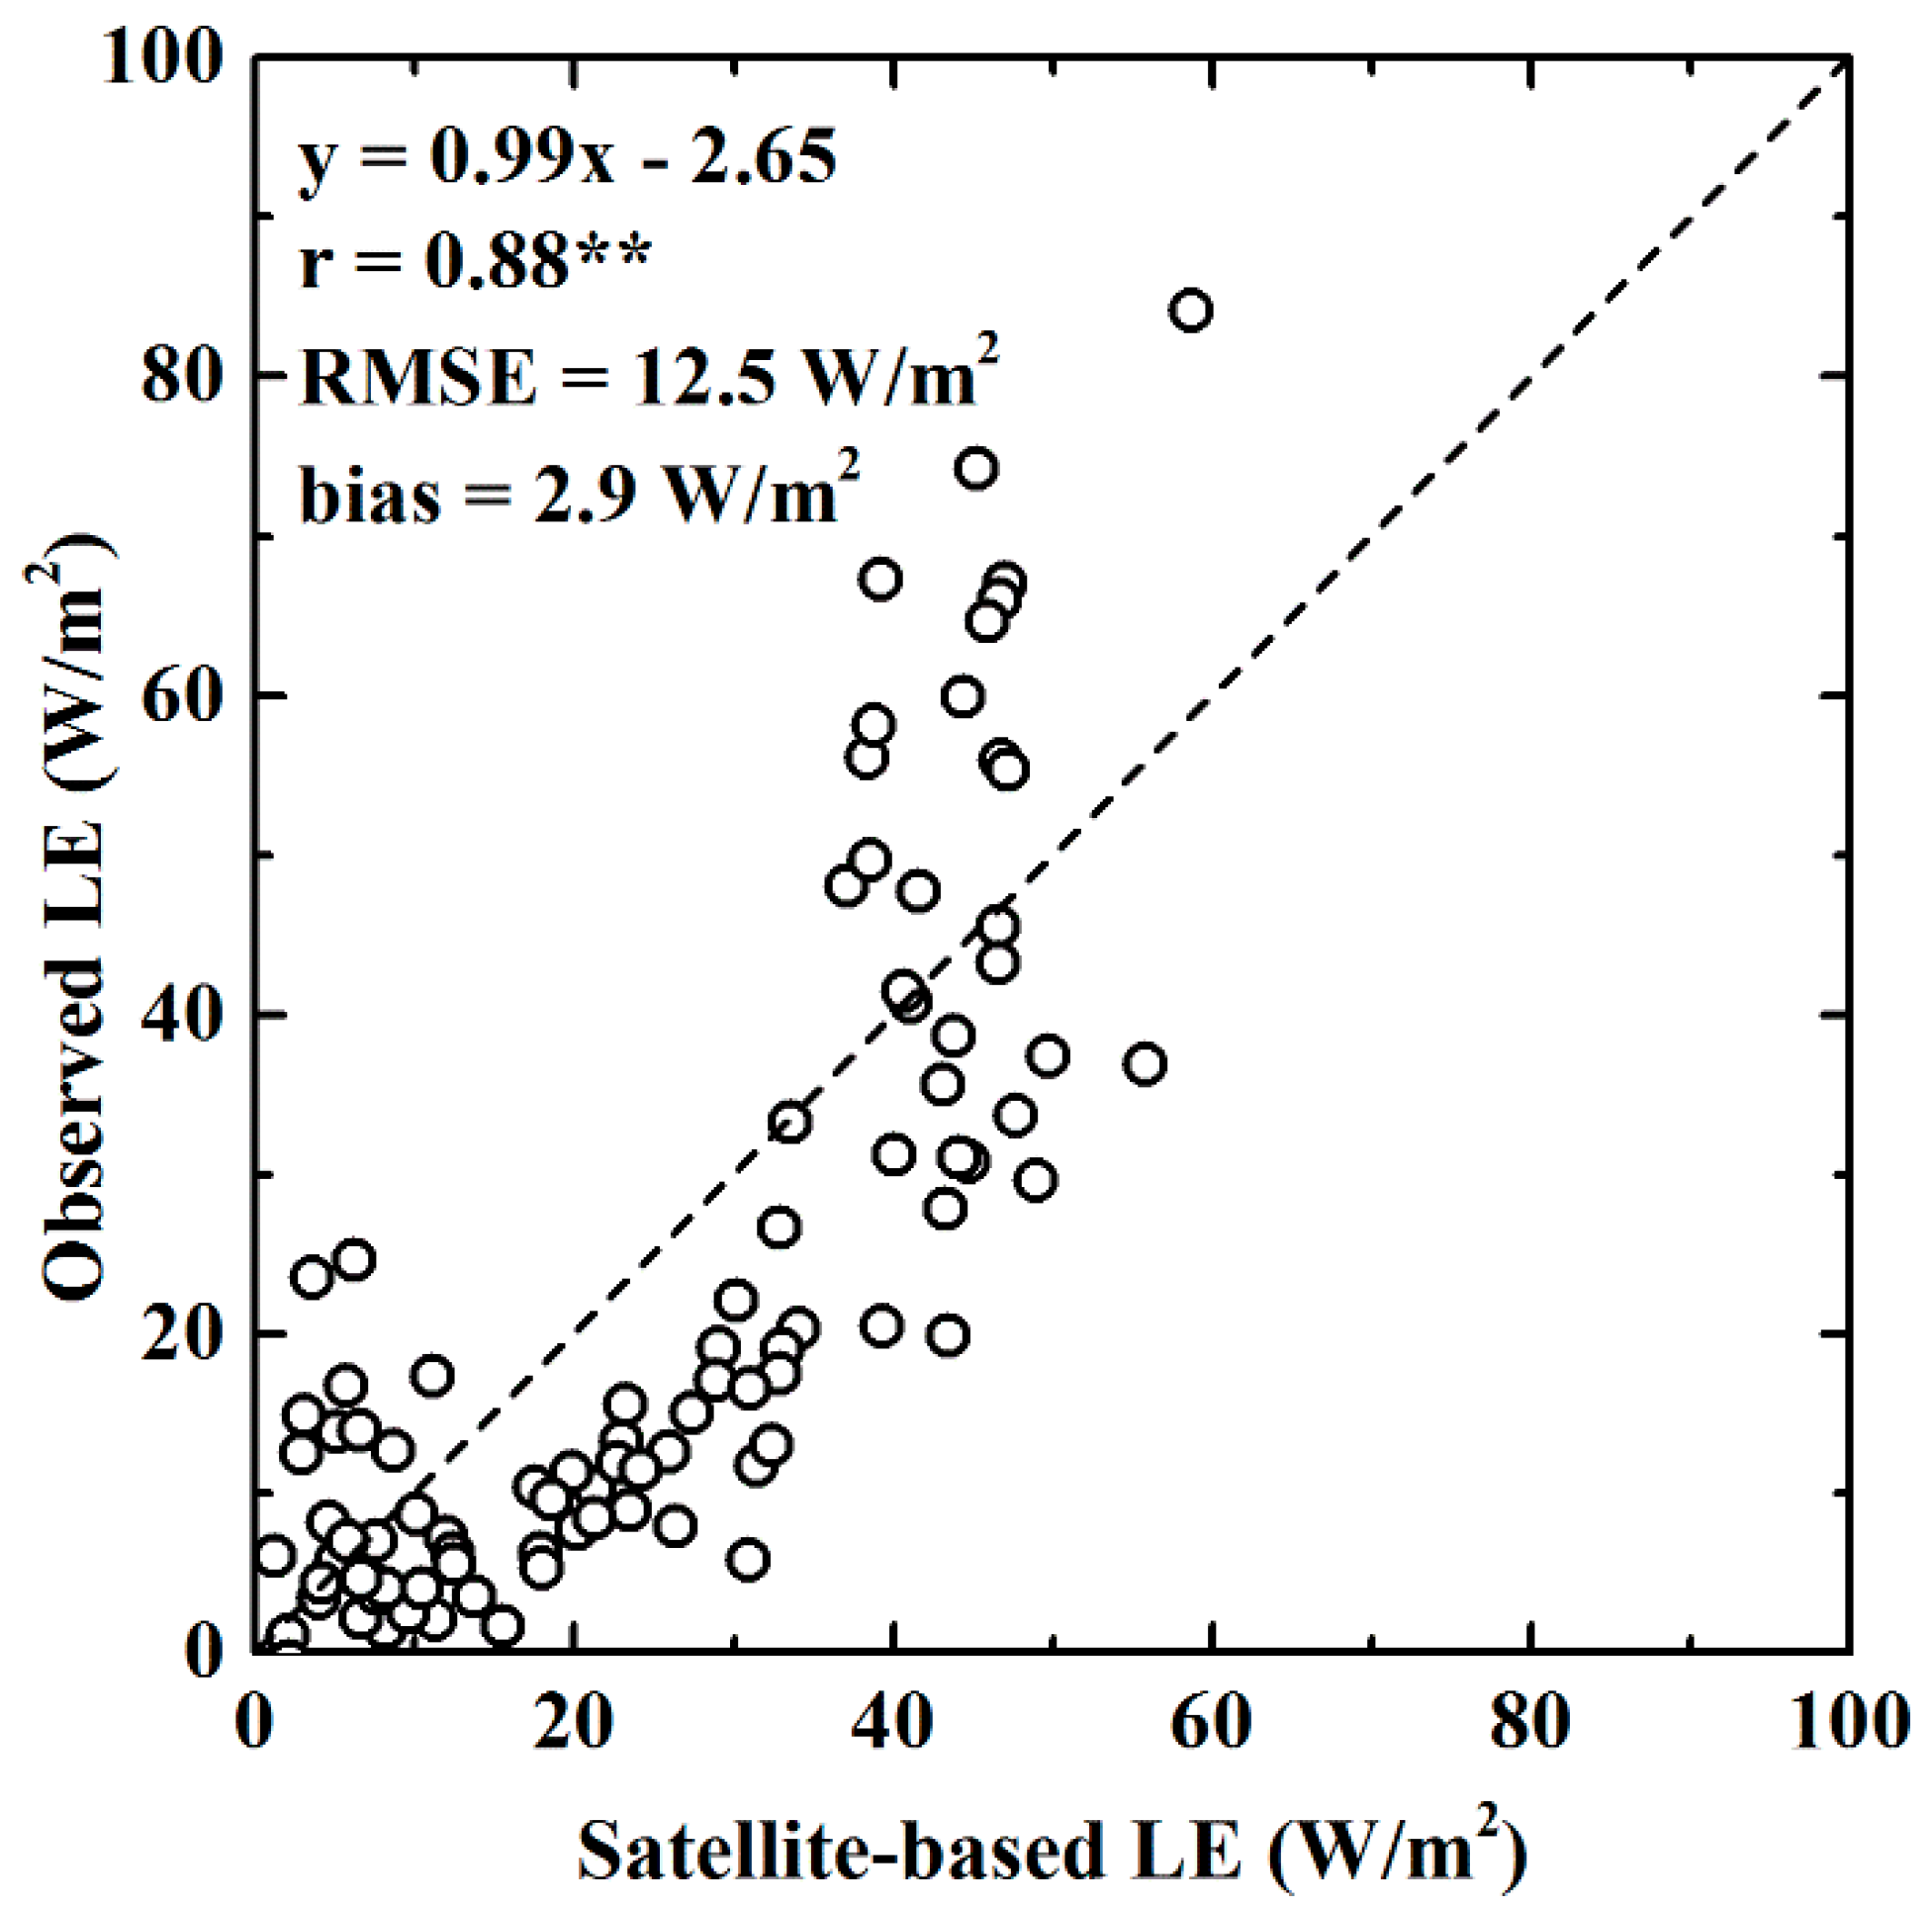
A good predicted performance for LE was observed with r = 0.88 (p < 0.01), a bias of 2.9 W/m2, and an RMSE of 12.5 W/m2 (Figure 4). Satellite-based LE in this study showed a closer correspondence than the MOD16 ET product (r = 0.71, bias = −3.5 W/m2, and RMSE = 14.2 W/m2) [32]. These results suggested the reliability of estimated LE derived from Equation (5).
Revegetation around mining areas significantly increased LE (~0.43 W/m2, 2000–2015 averaged). In particular, ∆LE was significantly correlated with ∆Fvc (r = 0.98, p < 0.01), suggesting the contribution of revegetation to the increased LE. The increase of ∆LE indicated that revegetation around mining areas caused a cooling effect, as each ∆LE was positive in Figure 3c. The effect was one of a significant cooling with a slope of 0.053 W/m2/year (R2 = 0.91, p < 0.01).
Ecological restoration does not only alter land use, but also changes the partitioning of Rn into LE and sensible heat. Thus, the biogeophysical effect of revegetation around mining areas is a coupling effect between ∆Rn and ∆LE. As Figure 3d shows, a significant cooling effect (−0.18 W/m2) is observed with a slope of 0.024 W/m2/year (R2 = 0.45, p < 0.01) mainly due to the warming effect of ∆Rn being completely offset by the cooling effect of ∆LE.
4. Discussion
4.1. ∆LST in Relation to ∆(Rn-LE)
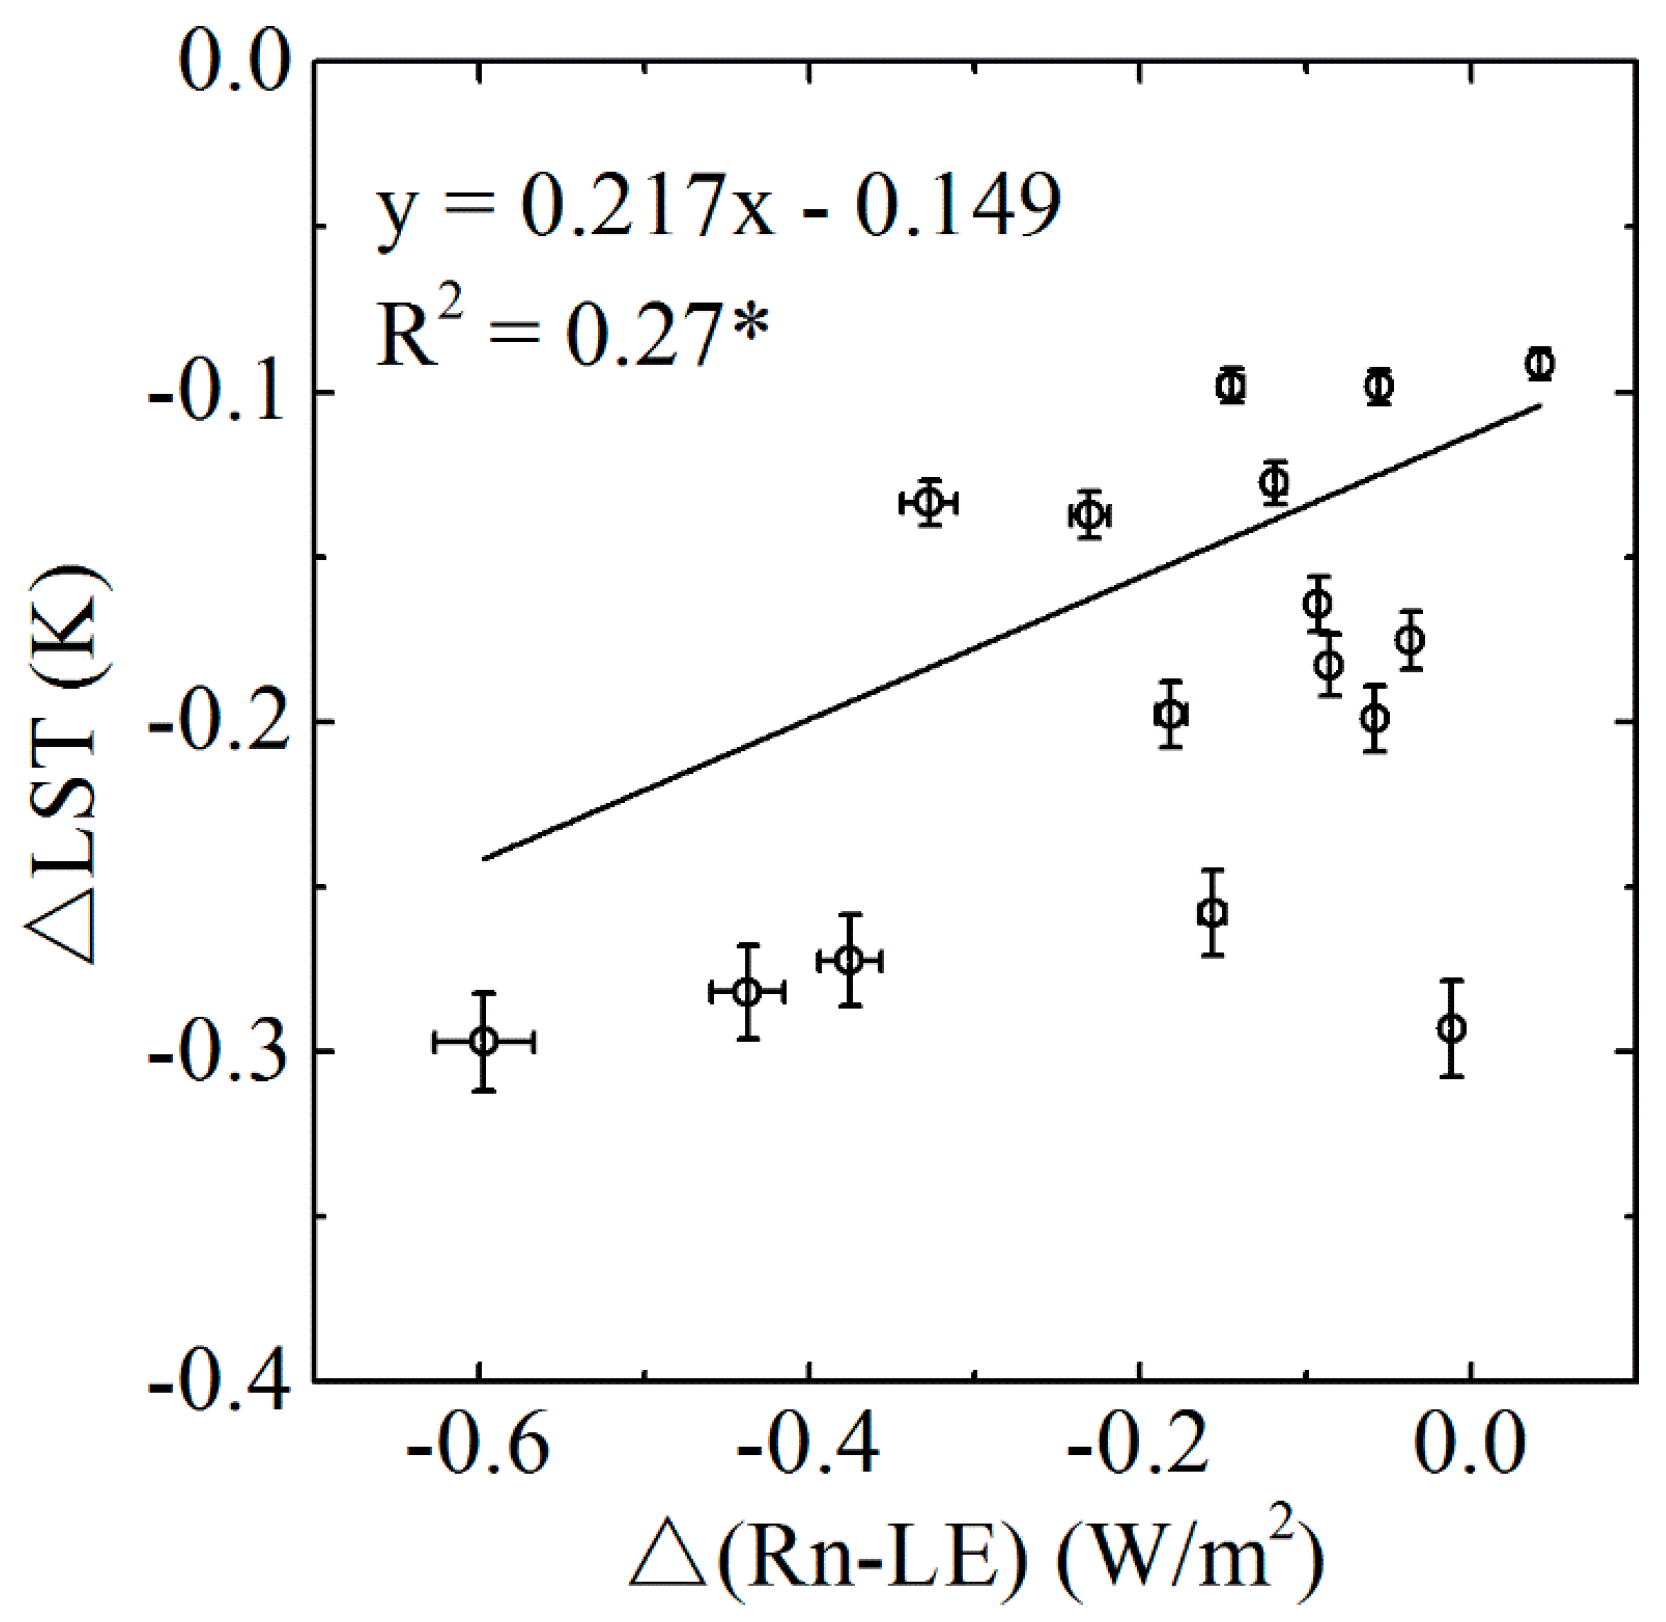
LST in revegetated areas was ~0.2 K lower than that in mining areas. ∆LST showed a significant negative trend of 0.008 K/year (p < 0.05). ∆LST was negatively correlated with ∆Fvc (r = 0.49, p < 0.05, Figure 5). The above results suggest that revegetation reduced LST around mining areas. The relationship between ∆(Rn-LE) and ∆LST showed that ∆(Rn-LE) could explain 27% of ∆LST variations. This finding reinforced the importance of biogeophysical effects of revegetation in regulating temperature, although this effect could be less than the biogeochemical effect [13,15,33].
4.2. Potential Applications and Limitations
In this study, we introduced a simple, but robust, method (space-for-time substitution technique) to evaluate the biogeophysical effect of large-scale ecological restoration. The evaluation of the biogeophysical effect of ecological restoration around mining areas has potential applications in similar large-scale mining areas. However, its potential applications to other areas (e.g., areas with different eco-climatic backgrounds) still need to be investigated.
The evaluation method used in this study is based on an important assumption that ecological restoration is implemented all around mining areas (~1.5 km). Indeed, ecological restoration is generally located in nearby waste dumps. However, locations of waste dumps are often random, which increase the difficulty of evaluation. Our assumption makes the evaluation much easier, but it could inevitably amplify or shrink the climatic effect of ecological restoration. More theoretical studies aimed for locating suitable revegetation areas will be helpful to overcome the above limitation.
5. Conclusions
Using satellite-based net radiation (Rn) and latent heat (LE) during 2000–2015, this study quantified the biogeophysical effects of revegetation around mining areas (taking Dongsheng in Inner Mongolia as an example). The results showed that revegetation around mining areas decreased the surface albedo and increased the fraction of vegetation cover, Rn, and LE. The warming effect of ∆Rn (the Rn difference between revegetation areas and mining areas) was completely offset by the cooling effect of ∆LE, thus, revegetation caused cooling (−0.18 W/m2). This study reinforces our understanding of the potential climatic benefits of revegetation around mining areas in arid and semi-arid temperate zones.
Acknowledgments
We appreciate two anonymous reviewers and their valuable comments. Also, we thank M. Hasan for his English editing and comments. This work was funded by the Inner Mongolia Science and Technology Agency (Grant No. 20140701 and 20140175).
Author Contributions
Guoqing Chen, Zhengjia Liu, and Wenfeng Chi designed the experiments and interpreted the results; Guoqing Chen wrote the draft; Zhengjia Liu and Wenfeng Chi prepared the figures; Mingjiu Wang reviewed the manuscript. All authors revised the manuscript.
Conflicts of Interest
The authors declare no conflict of interest.
References
- Li, M.S. Ecological restoration of mineland with particular reference to the metalliferous mine wasteland in China: A review of research and practice. Sci. Total Environ. 2006, 357, 38–53. [Google Scholar] [CrossRef] [PubMed]
- Jackson, S.T.; Hobbs, R.J. Ecological Restoration in the Light of Ecological History. Science 2009, 325, 567–569. [Google Scholar] [CrossRef] [PubMed]
- Dominguez-Haydar, Y.; Armbrecht, I. Response of Ants and Their Seed Removal in Rehabilitation Areas and Forests at El Cerrejón Coal Mine in Colombia. Restor. Ecol. 2011, 19, 178–184. [Google Scholar] [CrossRef]
- Zhang, L.; Wang, J.; Bai, Z.; Lv, C. Effects of vegetation on runoff and soil erosion on reclaimed land in an opencast coal-mine dump in a loess area. CATENA 2015, 128, 44–53. [Google Scholar] [CrossRef]
- De Giudici, G.; Pusceddu, C.; Medas, D.; Meneghini, C.; Gianoncelli, A.; Rimondi, V.; Podda, F.; Cidu, R.; Lattanzi, P.; Wanty, R.B.; et al. The role of natural biogeochemical barriers in limiting metal loading to a stream affected by mine drainage. Appl. Geochem. 2017, 76, 124–135. [Google Scholar] [CrossRef]
- Karan, S.K.; Samadder, S.R.; Maiti, S.K. Assessment of the capability of remote sensing and GIS techniques for monitoring reclamation success in coal mine degraded lands. J. Environ. Manag. 2016, 182, 272–283. [Google Scholar] [CrossRef] [PubMed]
- Mudrák, O.; Doležal, J.; Frouz, J. Initial species composition predicts the progress in the spontaneous succession on post-mining sites. Ecol. Eng. 2016, 95, 665–670. [Google Scholar] [CrossRef]
- Mukhopadhyay, S.; Masto, R.E. Carbon storage in coal mine spoil by Dalbergia sissoo Roxb. Geoderma 2016, 284, 204–213. [Google Scholar] [CrossRef]
- Touceda-González, M.; Álvarez-López, V.; Prieto-Fernández, Á.; Rodríguez-Garrido, B.; Trasar-Cepeda, C.; Mench, M.; Puschenreiter, M.; Quintela-Sabarís, C.; Macías-García, F.; Kidd, P.S. Aided phytostabilisation reduces metal toxicity, improves soil fertility and enhances microbial activity in Cu-rich mine tailings. J. Environ. Manag. 2017, 186, 301–313. [Google Scholar] [CrossRef] [PubMed]
- Zhen, Q.; Ma, W.; Li, M.; He, H.; Zhang, X.; Wang, Y. Reprint of “Effects of vegetation and physicochemical properties on solute transport in reclaimed soil at an opencast coal mine site on the Loess Plateau, China”. CATENA 2017, 148, 17–25. [Google Scholar] [CrossRef]
- Wang, J.; Yang, R.; Feng, Y. Spatial variability of reconstructed soil properties and the optimization of sampling number for reclaimed land monitoring in an opencast coal mine. Arab. J. Geosci. 2017, 10, 46. [Google Scholar] [CrossRef]
- Peng, S.; Piao, S.; Zeng, Z.; Ciais, P.; Zhou, L.; Li, L.Z.X.; Myneni, R.B.; Yin, Y.; Zeng, H. Afforestation in China cools local land surface temperature. Proc. Natl. Acad. Sci. USA 2014, 111, 2915–2919. [Google Scholar] [CrossRef] [PubMed]
- Alkama, R.; Cescatti, A. Biophysical climate impacts of recent changes in global forest cover. Science 2016, 351, 600–604. [Google Scholar] [CrossRef] [PubMed]
- Li, Y.; Zhao, M.; Motesharrei, S.; Mu, Q.; Kalnay, E.; Li, S. Local cooling and warming effects of forests based on satellite observations. Nat. Commun. 2015, 6, 6603. [Google Scholar] [CrossRef] [PubMed]
- Anderson-Teixeira, K.J.; Snyder, P.K.; Twine, T.E.; Cuadra, S.V.; Costa, M.H.; DeLucia, E.H. Climate-regulation services of natural and agricultural ecoregions of the Americas. Nat. Clim. Chang. 2012, 2, 177–181. [Google Scholar] [CrossRef]
- Betts, R.A. Biogeophysical impacts of land use on present day climate: Near-surface temperature change and radiative forcing. Atmos. Sci. Lett. 2001, 2, 39–51. [Google Scholar] [CrossRef]
- Mahmood, R.; Pielke, R.A.; Hubbard, K.G.; Niyogi, D.; Dirmeyer, P.A.; McAlpine, C.; Carleton, A.M.; Hale, R.; Gameda, S.; Beltrán-Przekurat, A.; et al. Land cover changes and their biogeophysical effects on climate. Int. J. Climatol. 2014, 34, 929–953. [Google Scholar] [CrossRef]
- Betts, A.K.; Ball, J.H. Albedo over the boreal forest. J. Geophys. Res. 1997, 102, 28901–28909. [Google Scholar] [CrossRef]
- Betts, R.A.; Falloon, P.D.; Goldewijk, K.K.; Ramankutty, N. Biogeophysical effects of land use on climate: Model simulations of radiative forcing and large-scale temperature change. Agric. For. Meteorol. 2007, 142, 216–233. [Google Scholar] [CrossRef]
- Pielke, R.A.; Marland, G.; Betts, R.A.; Chase, T.N.; Eastman, J.L.; Niles, J.O.; Niyogi, D.D.; Running, S.W. The influence of land-use change and landscape dynamics on the climate system: Relevance to climate-change policy beyond the radiative effect of greenhouse gases. Philos. Trans. Ser. A Math. Phys. Eng. Sci. 2002, 360, 1705–1719. [Google Scholar] [CrossRef] [PubMed]
- Pielke, R.A.; Pitman, A.; Niyogi, D.; Mahmood, R.; McAlpine, C.; Hossain, F.; Goldewijk, K.K.; Nair, U.; Betts, R.; Fall, S.; et al. Land use/land cover changes and climate: Modeling analysis and observational evidence. Wiley Interdiscip. Rev. Clim. Chang. 2011, 2, 828–850. [Google Scholar] [CrossRef]
- Huete, A.R.; Liu, H.Q.; Batchily, K.; van Leeuwen, W. A comparison of vegetation indices over a global set of TM images for EOS-MODIS. Remote Sens. Environ. 1997, 59, 440–451. [Google Scholar] [CrossRef]
- Tucker, C.J. Red and photographic infrared linear combinations for monitoring vegetation. Remote Sens. Environ. 1979, 8, 127–150. [Google Scholar] [CrossRef]
- Xiao, Z.; Wang, T.; Liang, S.; Sun, R. Estimating the Fractional Vegetation Cover from GLASS Leaf Area Index Product. Remote Sens. 2016, 8, 337. [Google Scholar] [CrossRef]
- Chen, J.; Jönsson, P.; Tamura, M.; Gu, Z.; Matsushita, B.; Eklundh, L. A simple method for reconstructing a high-quality NDVI time-series data set based on the Savitzky-Golay filter. Remote Sens. Environ. 2004, 91, 332–344. [Google Scholar] [CrossRef]
- Savitzky, A.; Golay, M.J. Smoothing and differentiation of data by simplified least squares procedures. Anal. Chem. 1964, 36, 1627–1639. [Google Scholar] [CrossRef]
- Wang, S.; Mo, X.; Liu, Z.; Baig, M.H.A.; Chi, W. Understanding long-term (1982–2013) patterns and trends in winter wheat spring green-up date over the North China Plain. Int. J. Appl. Earth Obs. 2017, 57, 235–244. [Google Scholar] [CrossRef]
- Smith, P.R. Bilinear interpolation of digital images. Ultramicroscopy 1981, 6, 201–204. [Google Scholar] [CrossRef]
- Wang, K.; Wang, P.; Li, Z.; Cribb, M.; Sparrow, M. A simple method to estimate actual evapotranspiration from a combination of net radiation, vegetation index, and temperature. J. Geophys. Res. 2007, 112. [Google Scholar] [CrossRef]
- Pickett, S.T.A. Space-for-Time Substitution as an Alternative to Long-Term Studies. In Long-Term Studies in Ecology: Approaches and Alternatives; Likens, G.E., Ed.; Springer: New York, NY, USA, 1989; pp. 110–135. [Google Scholar]
- Blanchet, G.; Charbit, M.; Blanchet, G.; Charbit, M. The Least Squares Method. In Digital Signal and Image Processing Using Matlab®; Charbit, M., Ed.; John Wiley & Sons, Inc.: Somerset, NJ, USA, 2014; pp. 349–395. [Google Scholar]
- Liu, Z.; Shao, Q.; Liu, J. The performances of MODIS-GPP and ET products in China and their sensitivity to input data (FPAR/LAI). Remote Sens. 2015, 7, 135–152. [Google Scholar] [CrossRef]
- Naudts, K.; Chen, Y.; McGrath, M.J.; Ryder, J.; Valade, A.; Otto, J.; Luyssaert, S. Europe’s forest management did not mitigate climate warming. Science 2016, 351, 597–600. [Google Scholar] [CrossRef] [PubMed]
Figure 1.
The location of the mining areas and its topography (a). The location of mining areas and buffer zones (b).
Figure 1.
The location of the mining areas and its topography (a). The location of mining areas and buffer zones (b).
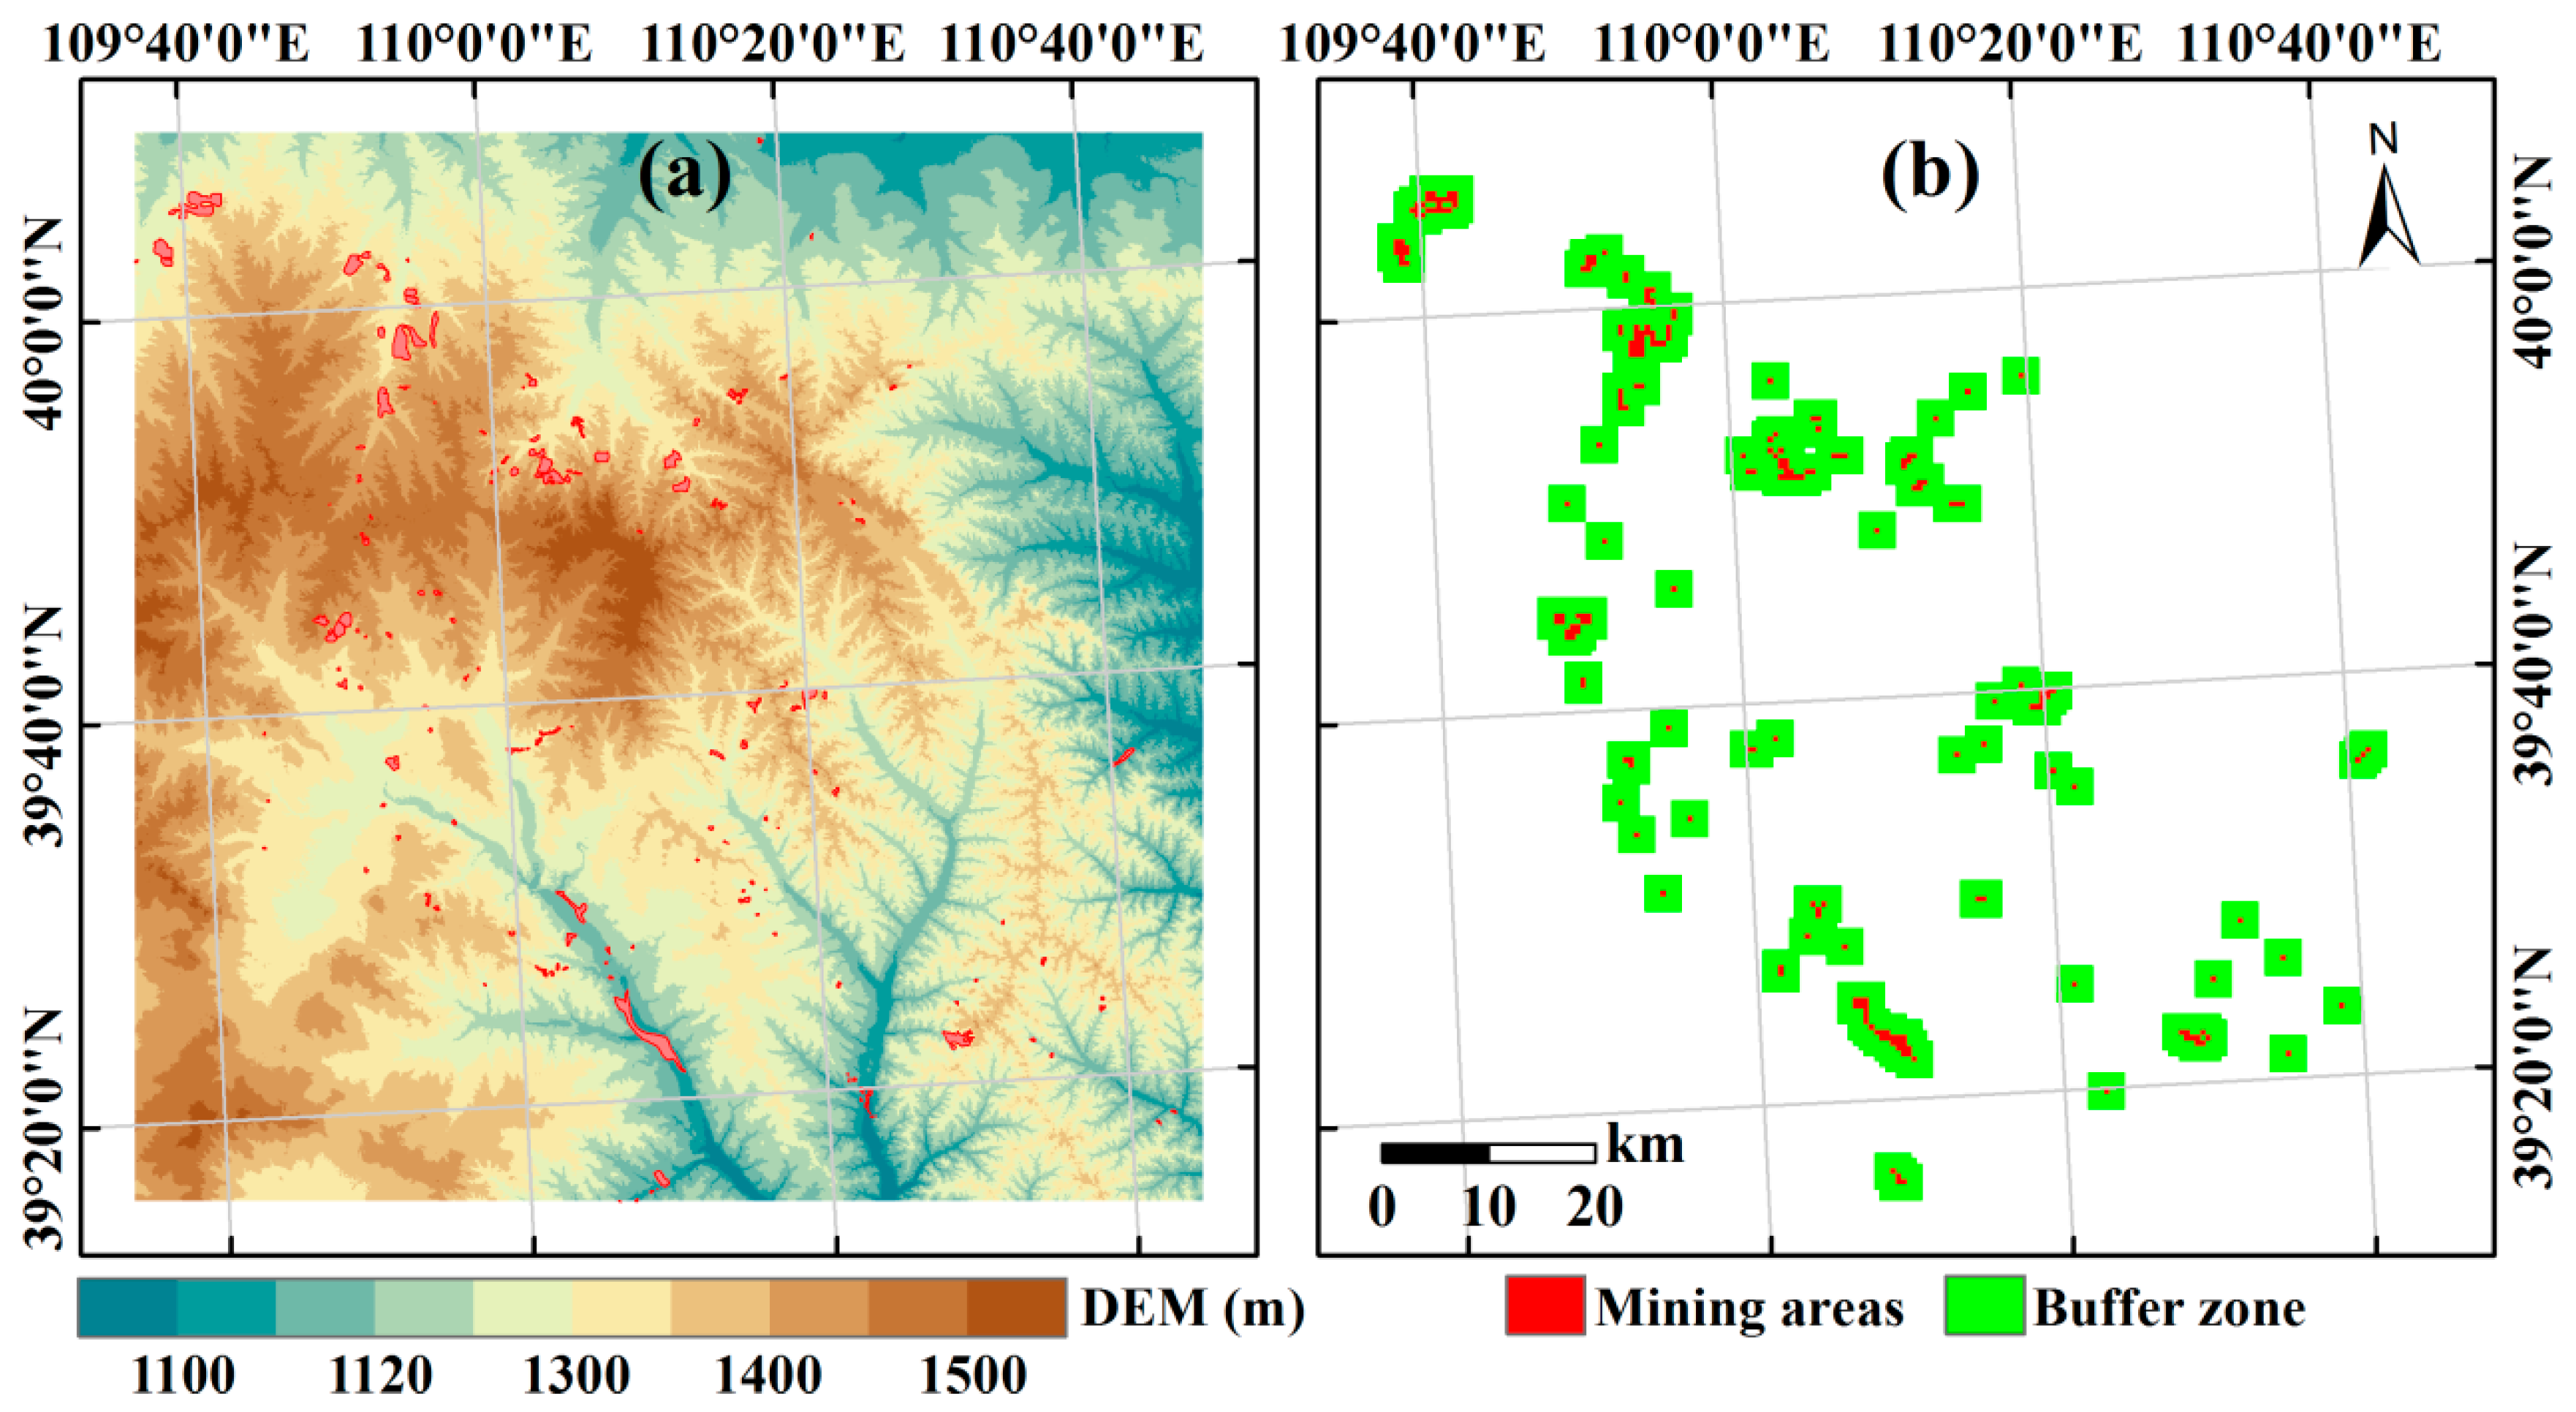
Figure 2.
The trend of ∆Fvc (the difference of fractional vegetation cover between revegetation areas and mining areas). The symbol ** represents statistical significance at the 0.01 level.
Figure 2.
The trend of ∆Fvc (the difference of fractional vegetation cover between revegetation areas and mining areas). The symbol ** represents statistical significance at the 0.01 level.

Figure 3.
The trends of mean values with standard errors of change in albedo (∆albedo), change in net radiation (∆Rn), change in latent heat flux (∆LE), and ∆(Rn-LE) (the different variable differences between revegetation areas and mining areas). The symbol ** represents statistical significance at the 0.01 level. (a) ∆albedo; (b) Rn; (c) ∆LE; (d) ∆(Rn-LE).

Figure 4.
The performance of satellite-based LE against flux tower-observed LE. The symbol ** represents statistical significance at the 0.01 level.
Figure 4.
The performance of satellite-based LE against flux tower-observed LE. The symbol ** represents statistical significance at the 0.01 level.

Figure 5.
The relationship of mean values with standard errors between ∆LST and ∆(Rn-LE). The symbol * represents statistical significance at the 0.05 level.
Figure 5.
The relationship of mean values with standard errors between ∆LST and ∆(Rn-LE). The symbol * represents statistical significance at the 0.05 level.
© 2017 by the authors. Licensee MDPI, Basel, Switzerland. This article is an open access article distributed under the terms and conditions of the Creative Commons Attribution (CC BY) license (http://creativecommons.org/licenses/by/4.0/).
Share and Cite
MDPI and ACS Style
Chen, G.; Wang, M.; Liu, Z.; Chi, W. The Biogeophysical Effects of Revegetation around Mining Areas: A Case Study of Dongsheng Mining Areas in Inner Mongolia. Sustainability 2017, 9, 628. https://doi.org/10.3390/su9040628
AMA Style
Chen G, Wang M, Liu Z, Chi W. The Biogeophysical Effects of Revegetation around Mining Areas: A Case Study of Dongsheng Mining Areas in Inner Mongolia. Sustainability. 2017; 9(4):628. https://doi.org/10.3390/su9040628
Chicago/Turabian StyleChen, Guoqing, Mingjiu Wang, Zhengjia Liu, and Wenfeng Chi. 2017. "The Biogeophysical Effects of Revegetation around Mining Areas: A Case Study of Dongsheng Mining Areas in Inner Mongolia" Sustainability 9, no. 4: 628. https://doi.org/10.3390/su9040628
Note that from the first issue of 2016, this journal uses article numbers instead of page numbers. See further details here.