
Analysis of Regional Inequality from Sectoral Structure, Spatial Policy and Economic Development: A Case Study of Chongqing, China

1
School of Construction Management and Real Estate, Chongqing University, Chongqing 400045, China
2
Center for Construction Economics and Management, Chongqing University, Chongqing 400045, China
3
School of Public Finance and Taxation, Southwestern University of Finance and Economics, Chengdu 611130, China
*
Author to whom correspondence should be addressed.
Sustainability 2017, 9(4), 633; https://doi.org/10.3390/su9040633
Submission received: 23 March 2017
/
Revised: 10 April 2017
/
Accepted: 14 April 2017
/
Published: 17 April 2017
Abstract
:Inequality is a large challenge to sustainable development, and achieving equity has already become one of the top goals in sustainable development of the UN’s post-2015 development agenda. Located in the western inland region of China, Chongqing is characterized by “big city, big countryside, big mountain area, big reservoir area” and its regional inequality is more serious. This paper is to explore Chongqing’s regional inequality from sectoral structure, spatial policy and economic development by constructing, decomposing, and calculating the inter-county per capita GDP Gini Coefficient. Through this study, it is mainly found that: (1) Chongqing has experienced a dynamic evolution from unbalanced development to balanced development, and its regional inequality has been decreasing steadily in recent years; (2) the Tertiary Sector gradually contributes most to regional inequality; (3) inequality between regions is the main section of regional inequality; (4) the spatial policy as per regional division of Five Function Areas is more rational than the division of the main urban and suburb areas; and (5) economic development is the best way to reduce the regional inequality. Based on the results of empirical study and the reality of Chongqing, targeted and systematic policy suggestions are proposed to reduce regional inequality and promote sustainable development.
1. Introduction
Sustainability is a broad topic with multiple dimensions, covering economy, society, environment, and resources. A key issue of sustainable development is equity [1]. Indeed, equity and sustainability are fundamental issues for human society and major concerns of governments worldwide [2,3]. Equity is an important factor to promote sustainable development, in particular, which can enhance the flexibility of the economy [4], help to gain the right of judicial justice [2], promote social harmony and stability [5], as well protect environment [6] and biodiversity [7]. In addition, the residents living in equitable regions have better health and longer life expectancy than those in inequalities [8,9]. Since the 2008 financial crisis, the issue of “inequality” once again raises public protests and political thinking [2], which not only involves problems on the level of morality, but also is regarded as a great challenge against sustainable development. Economic inequality is an obstacle to the sustainable growth [2,10,11], socially, it undermines social stability [12,13], politically, it depresses popular participation in politics and public benefit activities [14], environmentally, it encourages poor people to overuse natural resources, which leads to pollution and biodiversity loss [15]. In addition, inequality would intensify the conflict among different social classes and undermine social cohesion, which leads to many social ills (e.g., violent crime, murder, imprisonment) that damage the health of residents [16]. Consequently, inequality is a big problem that must receive serious attention and be solved for sustainable development [17] and equity became one of the top sustainable development goals of the UN’s post-2015 development agenda [1].
As a key component of inequality, regional inequality has also drawn renewed scholarly interests and social concerns in both underdeveloped and developed countries or districts [18]. As the largest developing country, China has made a great achievement in the economic area since the end of the 1970s, from which market mechanism and the policy of opening to the outside world are implemented. Nearly 40 years have passed, and its gross domestic production (GDP) annual growth rate (as per the constant price) is now almost 10% and has achieved more than a 30-fold increase [19,20]; since 2010, its total GDP has overtaken Japan and taken the second place in the world [2]; by the end of 2015, its full-year total GDP had already reached 67.67 trillion RMB, about 60% of the United States [20]; moreover, China is predicted to catch up with the US within 10 years [21]. However, China’s regional inequality is very evident [22]. The eastern coastal regions are far richer than the western inland regions [23,24]—for instance, although total GDP of Guangdong Province reached 7.28 trillion RMB in 2015, which approximates to that of Spain or South Korea [19,20], some western remote regions are less than 300 billion, such as Ningxia (291 billion), Qinghai (241 billion), and Tibet (103 billion) [20]. From the point of per capita GDP, some eastern coastal regions exceeded 100 thousand RMB in 2015, such as Beijing (106 thousand), Shanghai (103 thousand), and Tianjin (109 thousand), while Yunnan and Gansu are less than 30 thousand [20]. In order to change the situation of regional inequality, especially to promote the development of undeveloped regions, “Western Development Strategy”, “Central Grow-Up Strategy”, and a “Northeastern Re-Rising Strategy” have been implemented by China’s central government successively [25]. Meanwhile, “Five Development Concepts” (innovation, coordination, green, opening up, and sharing) have been designed to guide development in the next five years (2016–2020) and facilitate building a “Moderately Prosperous Society in All Aspects” by 2020 [26]. Among them, coordination and sharing are committed to further reduce inequality and accomplish sustainable development in the next period.
Regional inequality is a significant issue that China’s government and residents are facing and trying to solve, drawing, in addition, wide attention of academic scholars. Existing research is mostly studying regional inequality from four aspects: (1) measuring regional inequality based on different spatial scale-level, including region-level [5,23,25], province-level [3,21], and intra-province-level [27]; (2) looking for long-term trends and rules of regional inequality. Although the Kuznets inverted curve U-shape as a universal law for regional inequality development has a wide range of influence and does go through such a Kuznets’s process in many districts [28], the reality is more complex and the trend tends to be more complicated [18,23,27,29,30]; (3) analyzing influencing factors or determinants of regional inequality—physical nature [18,31], institution [25,32], spatial scale [3,27,33], location [3,18,21,27,34], globalization [2,18,35], urbanization [18,28,29,36,37], and industrialization [34,38,39,40,41,42,43,44], which all play significant roles in economic development and regional inequality; and (4) exploring multi-dimensional inequality. A body of literature has been concerned about regional inequality beyond economy or income, and social and environmental inequalities are causing increasing concern [6,45,46,47].
These studies not only provide a good theoretical perspective and analytical paradigm, which contribute to understanding and grasping the problem of China’s regional inequality, but also offer much basic data for solving China’s regional inequality. However, there are some limitations of previous study: (1) most studies focus on regional inequality from the whole economic outputs, but the specific sectoral structure is ignored. China’s sectoral structure has also undergone profound changes with urbanization and industrialization with its rapid economic growth [41,43]. From 1978 to 2015, the proportion of the three sectoral production values in GDP has changed from 28.2:47.9:23.9 (Primary:Secondary:Tertiary) (According to Chinese sectoral statistical classification, sectors are categorized into three kinds: (1) the Primary Sector, which refers to agriculture, forestry, animal husbandry and fishery; (2) the Secondary Sector, which contains manufacturing and construction; (3) the Tertiary Sector, which refers to all others but are not included in the primary or secondary sectors, such as real estate, finance, transportation, etc.) to 9.0:40.5:50.5 [20]. Although sectoral structural transformation promotes the economic increase, it is also an important reason for regional inequality in China [3,18,42,43]. Analyzing the regional inequality from the perspective of sectoral structure can not only reveal the composition of regional economic inequality, but also find further detailed reasons why the inequality changes, which is helpful to analyze and comprehend the regional inequality. (2) Although some studies decompose regional inequality as per spatial division [27,31,48], most spatial divisions are just based on physical spatial characteristics rather than the spatial function division, thus it is failing to assess and analyze different spatial policies which are made based on the spatial function division. For regional development, both central and local government in China have implemented various regional policies based on spatial division. Generally, there are two goals for spatial division, namely, there are more similarities within each region and more differences between regions so that different targeted spatial policies could be made based on the regional characteristics, respectively [49]. Therefore, spatial policies can be assessed and compared by decomposing regional inequality as per spatial division. (3) A quantitative relationship between economic development and regional inequality change is not be fully interpreted yet. Consequently, this paper is to study regional inequality from sectoral structure, spatial policy and economic development.
Furthermore, the studies on the regional inequality of China are conducted from three spatial scale levels [21], including region level [5,23,25], province level [3,21], and intra-province level [27]. These studies contribute to grasping the status of Chinese inequality and the formulation of coordinated regional development policies. While the previous studies also have some limitations, with analysis based on larger spatial scales, it is easier to ignore the inequality of internal regions [17,18]. Especially for China, which is a large country in economy and geography, the regional economic and industrial differences are quite obvious [23,25,50]. In order to master more specific conditions and take more targeted measures, it is necessary to study the regional inequality at different spatial scales [23,27,33]. However, most research just stays at the province level or above [23,25]. Even if there are some studies as per intra-provincial scales, most of them concentrate in eastern coastal regions [27,29], while western inland regions have not received sufficient attention [21]. Based on the above analysis, the reasons why this article selects Chongqing as the research object are as follows: (1) from the spatial scale, as a municipality, its spatial size is smaller than ordinary provinces, but bigger than other cities, and regional inequality study of this spatial scale is rare in the previous studies; (2) considering the geographical location, Chongqing is located in the Chinese western undeveloped region, which is less concerned by the previous studies about the regional economic inequality; (3) Chongqing has distinctive regional characteristics of high-speed development and serious regional inequality (Section 2.1 will give a detailed introduction), which are worthy of study and discussion; and (4) Chongqing has been implementing different spatial policies in various periods, thus different spatial policies can be compared and assessed.
2. Materials and Methods
2.1. Study Area
As shown in Figure 1, as the youngest and unique municipality in western China, Chongqing is located in the upriver of the Yangzi River. As the temporary capital of China and the eastern center of the World Anti-Fascist War in World War II [51], Chongqing is famous for the Mountain City and the Three Gorges Project. In 1997, including former Chongqing City, Wanxian City, Fuling City, and Qianjiang Area, these four cities (or areas) in Sichuan Province composed the new Chongqing Municipality that is directly under the jurisdiction of the Chinese central government, namely, its administrative level is the same as the province. After becoming a municipality, Chongqing covers 82,402 square kilometers, which is 2.39 times as large as other three municipalities (Beijing, Shanghai, and Tianjin). From 1997 to 2015, the permanent population of Chongqing increased from 28.73 million to 30.17 million. Moreover, its economic construction has also made a remarkable achievement, the regional GDP has maintained a high growth, which increased from 15.10 billion RMB in 1997 to 157.20 billion in 2015, and the annual growth rate exceeds 13%. Especially in recent years, although China’s economic development has entered a new normal and growth shifted from high-speed to medium-to-high-speed [41,52], Chongqing’s economy continues to maintain strong growth and it does play an important role as the economic engine as one of China’s “super-large” cities [53], and its GDP growth rate is up to 11%, which is far higher than the national average level 6.9% and leads in the 31 provinces all around mainland China [20].
However, due to natural resources, historical conditions, policy system and other factors, there are great differences in the resource conditions, sectoral structure, and development speed between different regions in Chongqing. As the basic administrative unit in China, the county is the foundation of Chinese national economics. After several adjustments, there are 38 counties or districts (its level is the same as the county) currently, some of which are developed metropolitan areas, whilst 14 of which are poor counties from the state level. Combined with sectoral actuality, there are also huge differences between regions. Indeed, due to being a municipality, many undeveloped areas are assigned to Chongqing, which results in it being both a region and a city, as well having a lot of low density agricultural land inside the “city”. It would be confusing just using the concept of “city” to define Chongqing based on Chan and Wan’s urban definition in China [53]. In fact, Chongqing has the characteristics of “big city, big countryside, big mountain area, and big reservoir area” since becoming a municipality. Compared with other areas in China, its interregional and urban-rural inequalities are more serious [54].
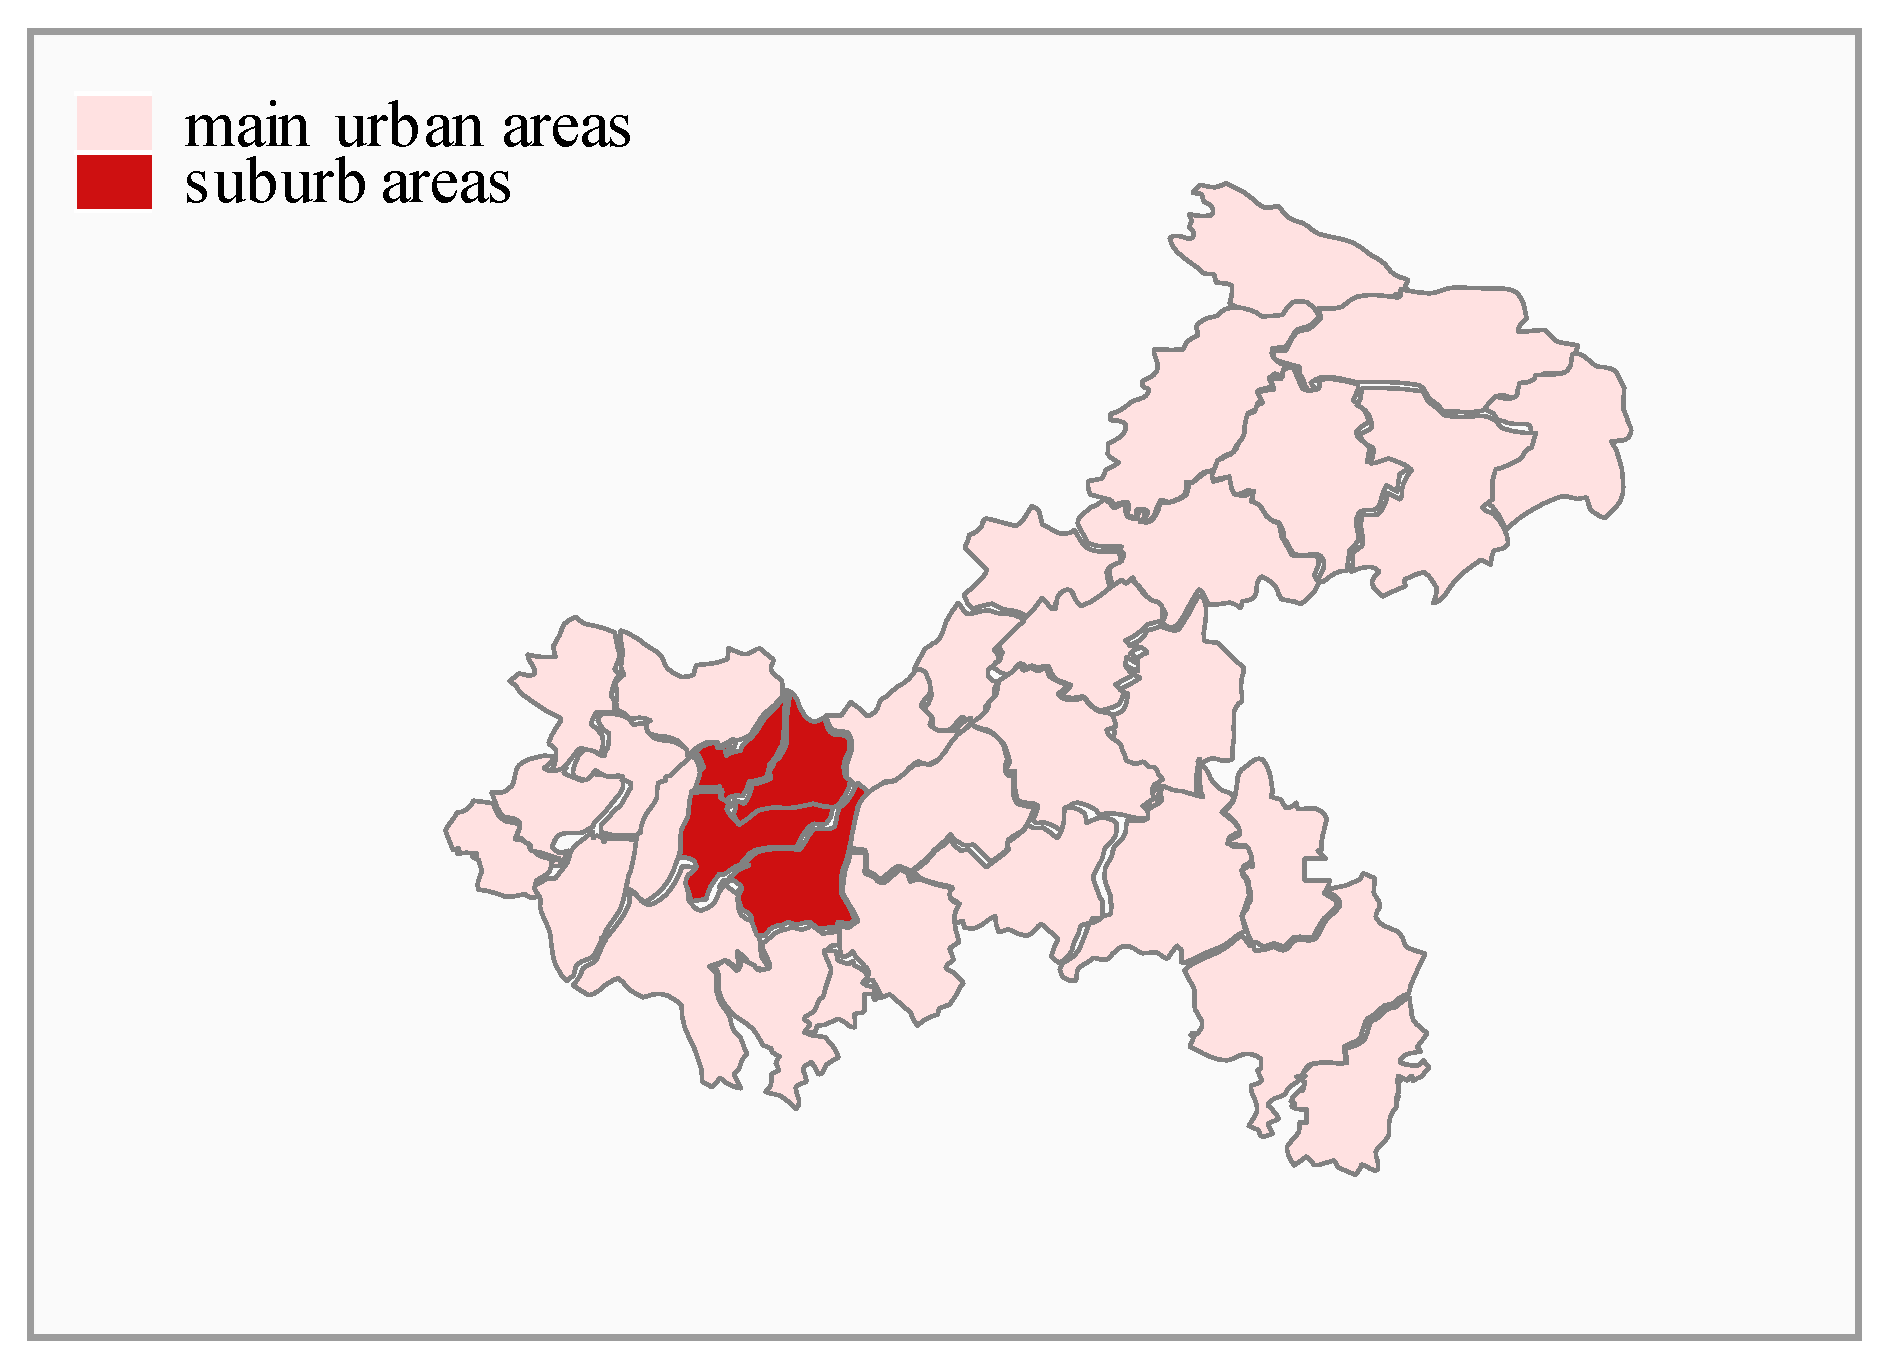
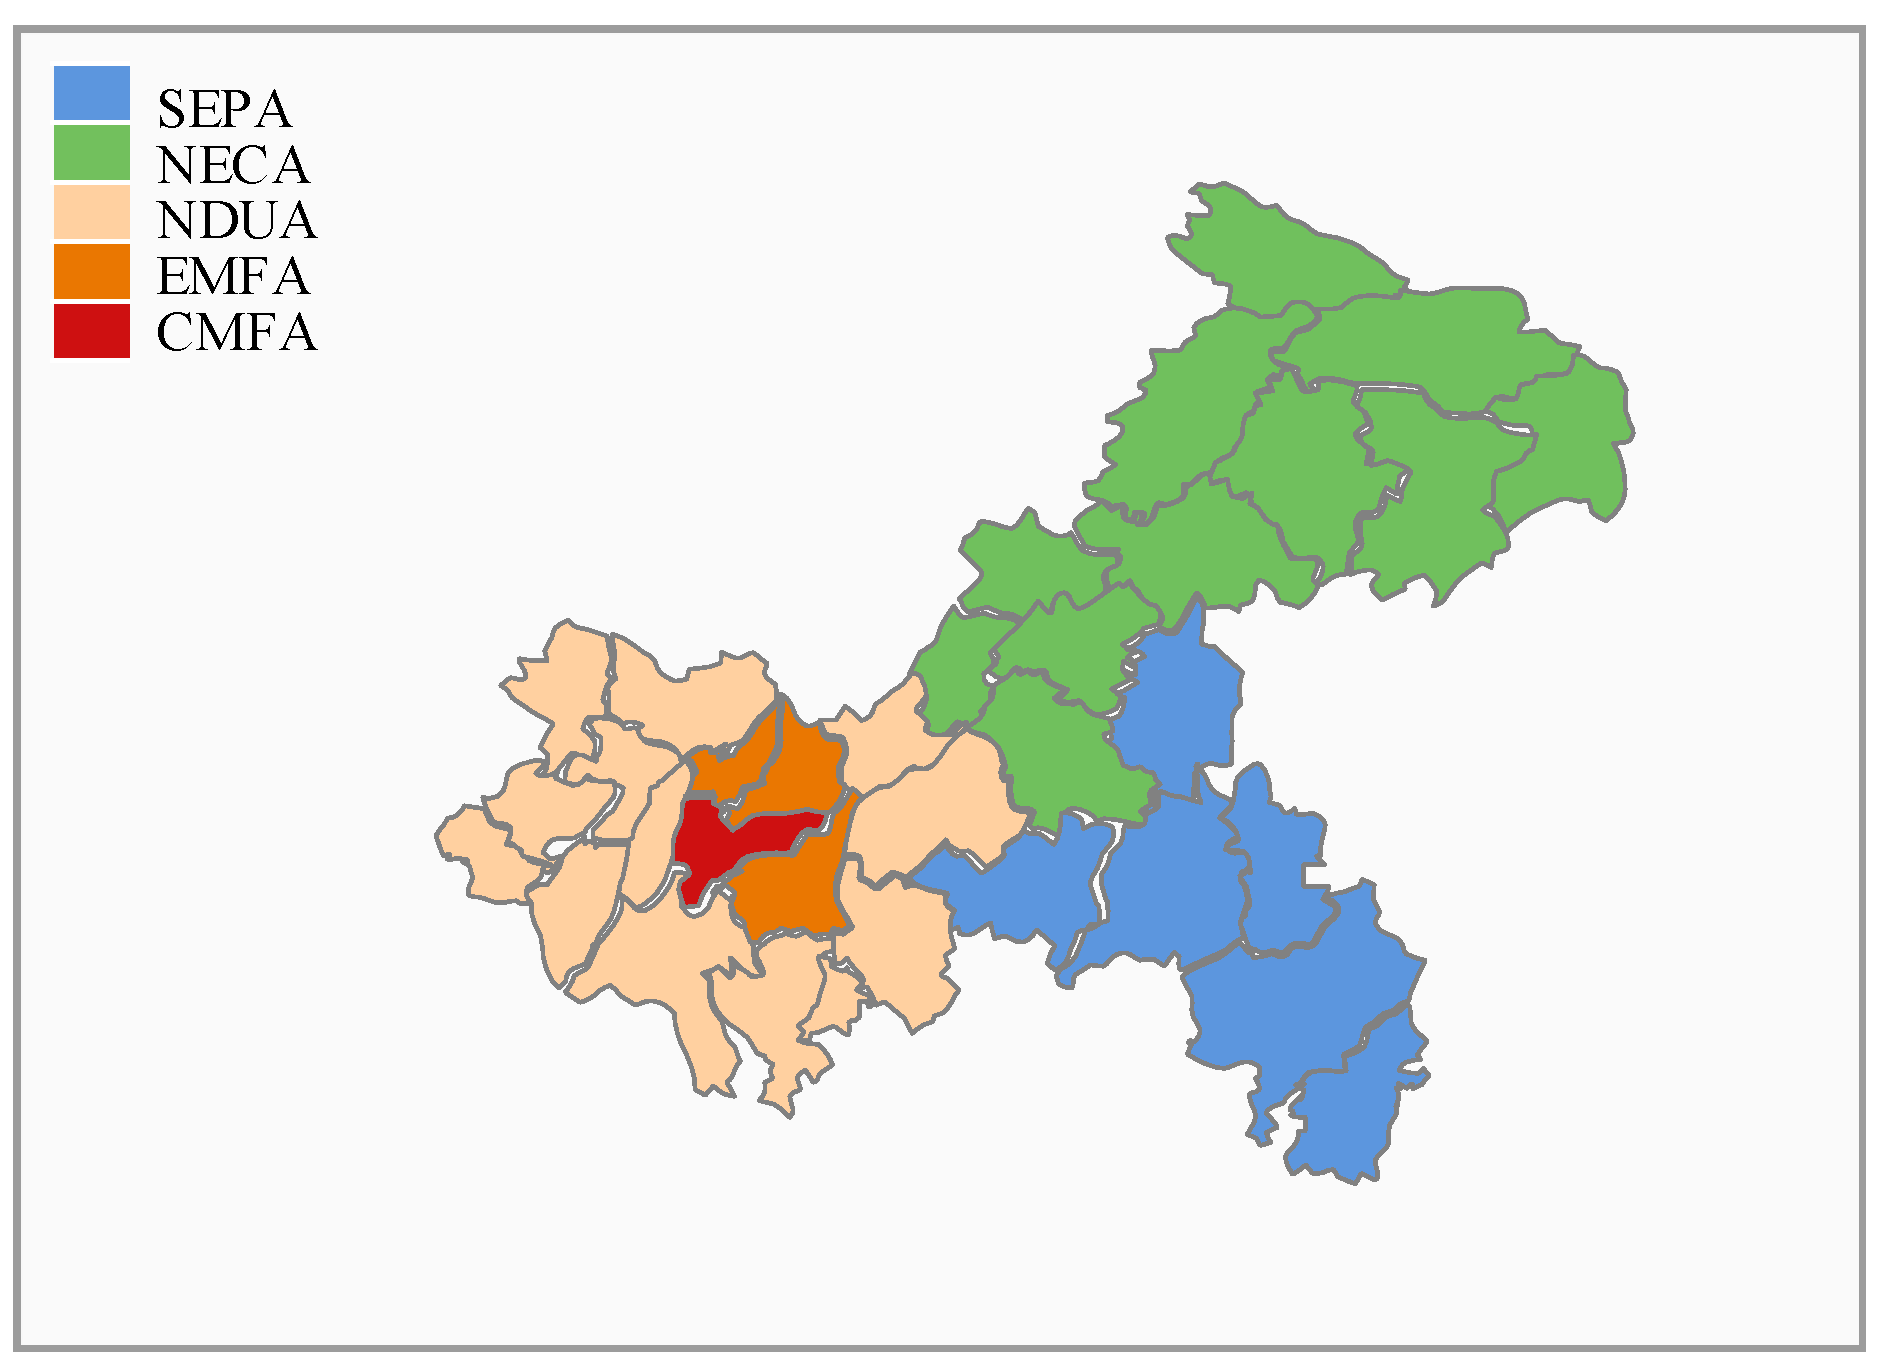
In addition, at the beginning of becoming a municipality, Chongqing was divided into two spatial parts by the local administrative system, namely, the main urban areas and suburb areas, as shown in Figure 2. Furthermore, regional policies of Chongqing were also according to this division for a long time. After that, given spatial differences, characteristics of nature, economics and society in each region were taken into consideration. Consequently, more positive and specific regional development strategies were taken, such as “Three Economic Zones”, “Four Development Areas”, and “One Circle and Two Wings”. At present, the strategy of “Five Function Areas” is being conducted. As shown in Figure 3, according to the strategy of “Five Function Areas”, Chongqing is divided into Core Metropolitan Function Area (CMFA), Extended Metropolitan Function Area (EMFA), Newly Developed Urban Area (NDUA), Northeastern Ecological Conservation Area (NECA), and Southeastern Environment Protection Area (SEPA). Since the strategy of “Five Function Areas” was proposed in 2013, Chongqing has made regional policies based on this regional division, namely, each region has its unique orientation and regional policies according to this regional division.
2.2. Indicator and Data
Per capita GDP is widely used to compare the regional inequality [21,22,23,27,49,55,56], and this study will select per capita GDP as the indicator that can reflect the regional inequality objectively. Due to China’s sector consisting of the Primary Sector, the Secondary Sector, and the Tertiary Sector, naturally, the per capita GDP of each sector is selected as the indicator to measure the each sectoral regional inequality.
In order to master and comprehend the overall situation of inequality since Chongqing became a municipality, the years 1997–2015 are selected as the time series of this study. Data from 1997–2015 is obtained from the Chongqing Statistical Yearbook (1998–2016).
2.3. Construction and Decomposition of the Gini Coefficient
The Gini Coefficient is used to measure inequality popularly. Compared with other common measure methods that are applied to measure inequality, such as the Theil index and the Coefficient of Variation, applications of the Gini Coefficient are the most widespread [57]. Furthermore, the Gini Coefficient has functions as follows: (1) It can measure the overall inequality directly to measure overall regional inequality in Chongqing (RIC), and, naturally, regional inequality of various sectors can be also measured. (2) It can be decomposed in terms of sectoral structure to find the contribution rate (CR) of each sector to RIC. (3) It can be decomposed as per the spaces to find the inequality within each region and between regions, as well the corresponding CR to RIC. (4) The relationship between economic development and inequality change can be found by decomposing the increment of Gini Coefficient. Therefore, based on above analyses and considerations, Gini Coefficient is selected as the method of this study.
2.3.1. Construction of Gini Coefficient
Given that the county is the foundation of China’s national economics, per capita GDP of each county is used to construct the regional per capita GDP Gini Coefficient in Chongqing (RGGC), and the data range of RGGC is 0–1, which represents the level of RIC (the bigger, the more inequitable). Similarly, the RGGC of each sector is based on per capita GDP of each sector. Specific formulas of various Gini Coefficient are listed in the following:
In Formula (1), is RGGC, represents population of each county and stands for average per capita GDP in Chongqing. While and represent per capita GDP in County and County , respectively. Similarly, in Formulas (2)–(4), , , and are RGGC of the Primary Sector, the Secondary Sector and the Tertiary Sector, respectively; , and represent average per capita GDP of each sector, respectively; , , and represent per capita GDP of each sector, respectively, in County ; , , and represent per capita GDP of each sector, respectively, in County .
2.3.2. The CR of Each Sector to Gini Coefficient
The CR of each sector to RIC can be found through decomposing RGGC as per sectoral structure. The specific calculation formula is as follows:
In Formula (5), is RGGC, represents the proportion of Sector , and represents the concentration index (also called pseudo Gini Coefficient) of Sector . represents RGGC of Sector . represents the correlation coefficient of Gini Coefficient for Sector and GDP, and its specific calculation formula is as follows:
In Formula (6), and represent GDP of Sector in County and County , respectively, and the data range of is [–1,1] [58]. In addition, Formula (6) can be transformed into Formula (7):
In this formula, is the CR of Sector to RGGC.
2.3.3. Decomposing Gini Coefficient Based on Spaces
The 38 counties of Chongqing can be divided into groups based on spatial characteristics. The specific decomposition calculation formula is as follows [59]:
In this formula, is RGGC. represents Gini Coefficient between areas; and represent the proportion of GDP and population in spatial Group respectively; and represents the residual term as a result of the cross between groups. Only if the per capita GDP distribution between groups is completely non-overlapping will the term equal zero.
2.3.4. Decomposing the Increment of Gini Coefficient
Regional inequality changes along with demographic and economic factors. We can find the reasons why it changes through the decomposing increment of the Gini Coefficient. The specific calculation formula is the following according to per capita GDP and shares of population in each county [49]:
In this formula, represents the increment of RGGC, represents the change of RGGC caused by the change of per capita GDP, represents the change of RGGC caused by the change of the interregional rank of per capita GDP, and represents the change of Gini Coefficient caused by the change of shares of population in each county. Meanwhile, regional inequality follows the logic that the change of each county’s per capita GDP makes the interregional rank change. Thus, these two terms, namely, the change of per capita GDP and the change of the interregional rank, can be combined, and the new term can be called economic development. Consequently, the specific formula is as follows:
Finally, these two sections are divided by , and the corresponding CR to the change of Gini Coefficient can be obtained.
3. Results
3.1. Various Gini Coefficients in Chongqing
By Formulas (1)–(4), various Gini Coefficients in Chongqing are obtained from 1997 to 2015. As shown in Figure 4, first of all, RGGC shows the characteristics that it increases slowly from 0.3280 in 1997 to 0.3382 in 2002 firstly, and then falls sharply to 0.2835 in 2003, and rises to 0.3203 in 2009 with fluctuations. Afterwards, it declined steadily from 0.3203 in 2009 to 0.2475 in 2015. In general, RGGC experiences a period of fluctuations firstly and then reduces steadily.
Secondly, RGGC of each sector shows the following features: (1) RGGC of the Primary Sector increases in waves from 0.1765 in 1997 to 0.2510 in 2015 generally; (2) by and large, RGGC of the Secondary Sector declines from 0.4501 in 1997 to 0.2684 in 2015 gradually; (3) RGGC of the Tertiary Sector shows the regularity that it decreases firstly from 0.4203 in 1997 to 0.3369 in 2004 and then increases 0.4114 in 2009. Finally, it declines from 0.4114 in 2009 to 0.3792 in 2015 slowly.
At last, a further comparison in RGGC of each sector provides this information: (1) RGGC of the Primary Sector is always below RGGC of the Secondary Sector and the Tertiary Sector; and (2) before 2004, RGGC of the Secondary Sector is greater than RGGC of the Tertiary Sector. However, the situation completely reverses afterwards, the Gini Coefficient of the Tertiary Sector is greater than RGGC of the Secondary Sector and the gap between the two is widening gradually.
3.2. The CR of Each Sector to RGGC
The calculation results through Formula (7) can be seen in Figure 5: (1) firstly, the CR of the Primary Sector is the lowest and has been negative since 2003. (2) Secondly, in general, the CR of the Secondary Sector decreases with fluctuations from 52.19% in 1997 to 43.80% in 2005 firstly, then increases to 50.41% in 2011, and afterwards, it declines to 41.50% in 2015 gradually. (3) Thirdly, although there are some shocks, the CR of the Tertiary Sector increases from 44.99% in 1997 to 63.97% in 2015 roughly. (4) Finally, compared with the Tertiary Sector, the CR of the Secondary Sector is greater than the CR of the Tertiary Sector at first, whereas the CR of the Tertiary Sector has exceeded that of the Secondary Sector since 2005, and the gap between them has been widening gradually in recent years.
3.3. Inequality of Main Urban and Suburban Areas in Chongqing
Dividing Chongqing into main urban and suburb areas, by Formula (8), the following information can be acquired as shown in Table 1.
First of all, the CR between main urban and suburban areas to RGGC is always the largest, which accounts for more than 60% of all the time except for 2003 and 2004. However, the CR of suburban areas is the second largest, which is about 30% in general.
Secondly, both the Gini Coefficient of main urban areas and the Gini Coefficient between them decreases gradually in general, namely, the Gini Coefficient of main urban areas declines from 0.2345 in 1997 to 0.1444 in 2015 and the Gini Coefficient between them falls from 0.1977 to 0.1499 in the same period. However, the Gini Coefficient of suburban areas decreases firstly from 0.2160 in 1997 to 0.1988 in 2007 and then increases to 0.2261 in 2009. Afterwards, it steadily declines to 0.1885 in 2015.
Finally, the Gini Coefficient of main urban areas compares with that of suburban areas, the Gini Coefficient of main urban areas is greater than that of suburban areas before 2003, and then the situation reverses.
3.4. Inequality of Five Function Areas in Chongqing
Table 2 presents the results by Formula (8) based on the division of Five Function Areas. First of all, the CR between areas to RGGC is overwhelmingly the greatest, which accounts for approximately 90% before 2005, and then it declines to 80.32% in 2015 gradually.
Secondly, in general, the Gini Coefficient between areas falls from 0.2936 in 1997 to 0.1998 in 2015 gradually.
Thirdly, the Gini Coefficient of CMFA, EMFA and NDUA is always below 0.15 except in individual years, whereas the Gini Coefficient of SEPA stays at about 0.15 all the time. The Gini Coefficient of NECA, in general, firstly increases from 0.1334 in 1997 to the peak of 0.2346 in 2010 and then declines to 0.1856 in 2015.
Finally, according to comparisons of the Gini Coefficient of each area, the Gini Coefficient of SEPA and NECA is obviously greater than that of CMFA, EMFA and NDUA, in particular, the Gini Coefficient of NECA has been the greatest in recent years.
3.5. The Causes of the Change of RGGC
Based on Formula (10), the change of Gini Coefficient is caused by economic development and the change in shares of population in each county. As shown in Table 3, the CR of these two sources to the change of RGGC is 103.85% and −3.85%, respectively.
4. Findings and Discussions
4.1. Dynamics of Regional Inequality in Chongqing
RGGC stands for the level of RIC, as shown in Figure 4, RIC has experienced slow growth since Chongqing became a municipality, whereas it suddenly dropped in 2003 and then increased with a fluctuation until 2009. Afterwards, the level of RIC decreased steadily. This situation means that regional development of Chongqing has experienced a dynamic process from unbalanced development to balanced development. In the early times, Chongqing was dedicated to expanding the economic scale and giving priority to the efficiency of development, namely, the areas which have better basic conditions achieved the leading development [42]. However, long-term inequality is a big challenge to sustainable development [1,17,22]. After entering the 21st century, especially in recent years, in order to realize the regional balanced and sustainable development, strategies for regional balanced development were put forward continually, such as “Coordinating Urban and Rural Development”, “Three Economic Zones”, “Four Development Areas”, and “Five Function Areas”. The empirical results of this study show that the level of RIC has been already narrowing in recent years, which demonstrates that the regional balanced and sustainable development strategies have already achieved a certain effect.
4.2. Confirming the Key Sector to Reduce Inequality
The CR of each sector to RGGC represents each sectoral contribution to RIC. As shown in Figure 5, the RIC is mainly caused by the Secondary Sector and the Tertiary Sector. In order to reduce inequality more targetedly and efficiently, the Secondary Sector and the Tertiary Sector should be the key sectors. Since Chongqing became a municipality, sectoral structure has changed significantly, the proportion of the three sectoral production values in GDP has changed from 24.7:42.8:32.5 in 1997 to 7.3:45.0:47.7 in 2015, which caused the CR of the Tertiary Sector to RIC to exceed that of the Secondary Sector and the CR of the Tertiary Sector accounted for more than 60% in 2015, which means that if the Tertiary Sector can be distributed perfectly balanced in Chongqing in 2015, then the inequality would be cut more than 60%.
Meanwhile, as shown in Figure 4, the Gini Coefficient of the Tertiary Sector was greater than that of the Secondary Sector in recent years, which means that, compared to the Secondary Sector, the Tertiary Sector’s regional inequality is more serious than that of the Secondary Sector. Therefore, the Tertiary Sector, from the considerations of both each sectoral CR to RIC and each sectoral regional inequality level, should be confirmed as the most crucial sector to reduce the inequality of Chongqing.
In addition, the CR of the Primary Sector has been negative since 2003, which means that the Primary Sector contributes to narrowing RIC. Consequently, we need to encourage and support development of the Primary Sector, which is helpful for reducing the inequality of Chongqing.
4.3. Analysis of Spatial Policies
4.3.1. Focusing on the Inequality between the Five Function Areas
Given current regional policies in Chongqing are made based on the spatial division of the Five Function Areas. We will focus on the analysis of regional inequality based on the Five Function Areas. As shown in Table 2, the CR between regions is the absolutely largest section, namely, between regions’ inequality is the main source of regional inequality in Chongqing. If these undeveloped regions do not realize effective development, or their per capita GDP can not achieve a remarkable growth, it is difficult to narrow the inequality. Consequently, we must focus on the inequality between the Five Function Areas and support development of undeveloped regions, such as NECA and SEPA, where the per capita GDP is relatively too low.
4.3.2. Evaluating the Rationality of Spatial Divisions
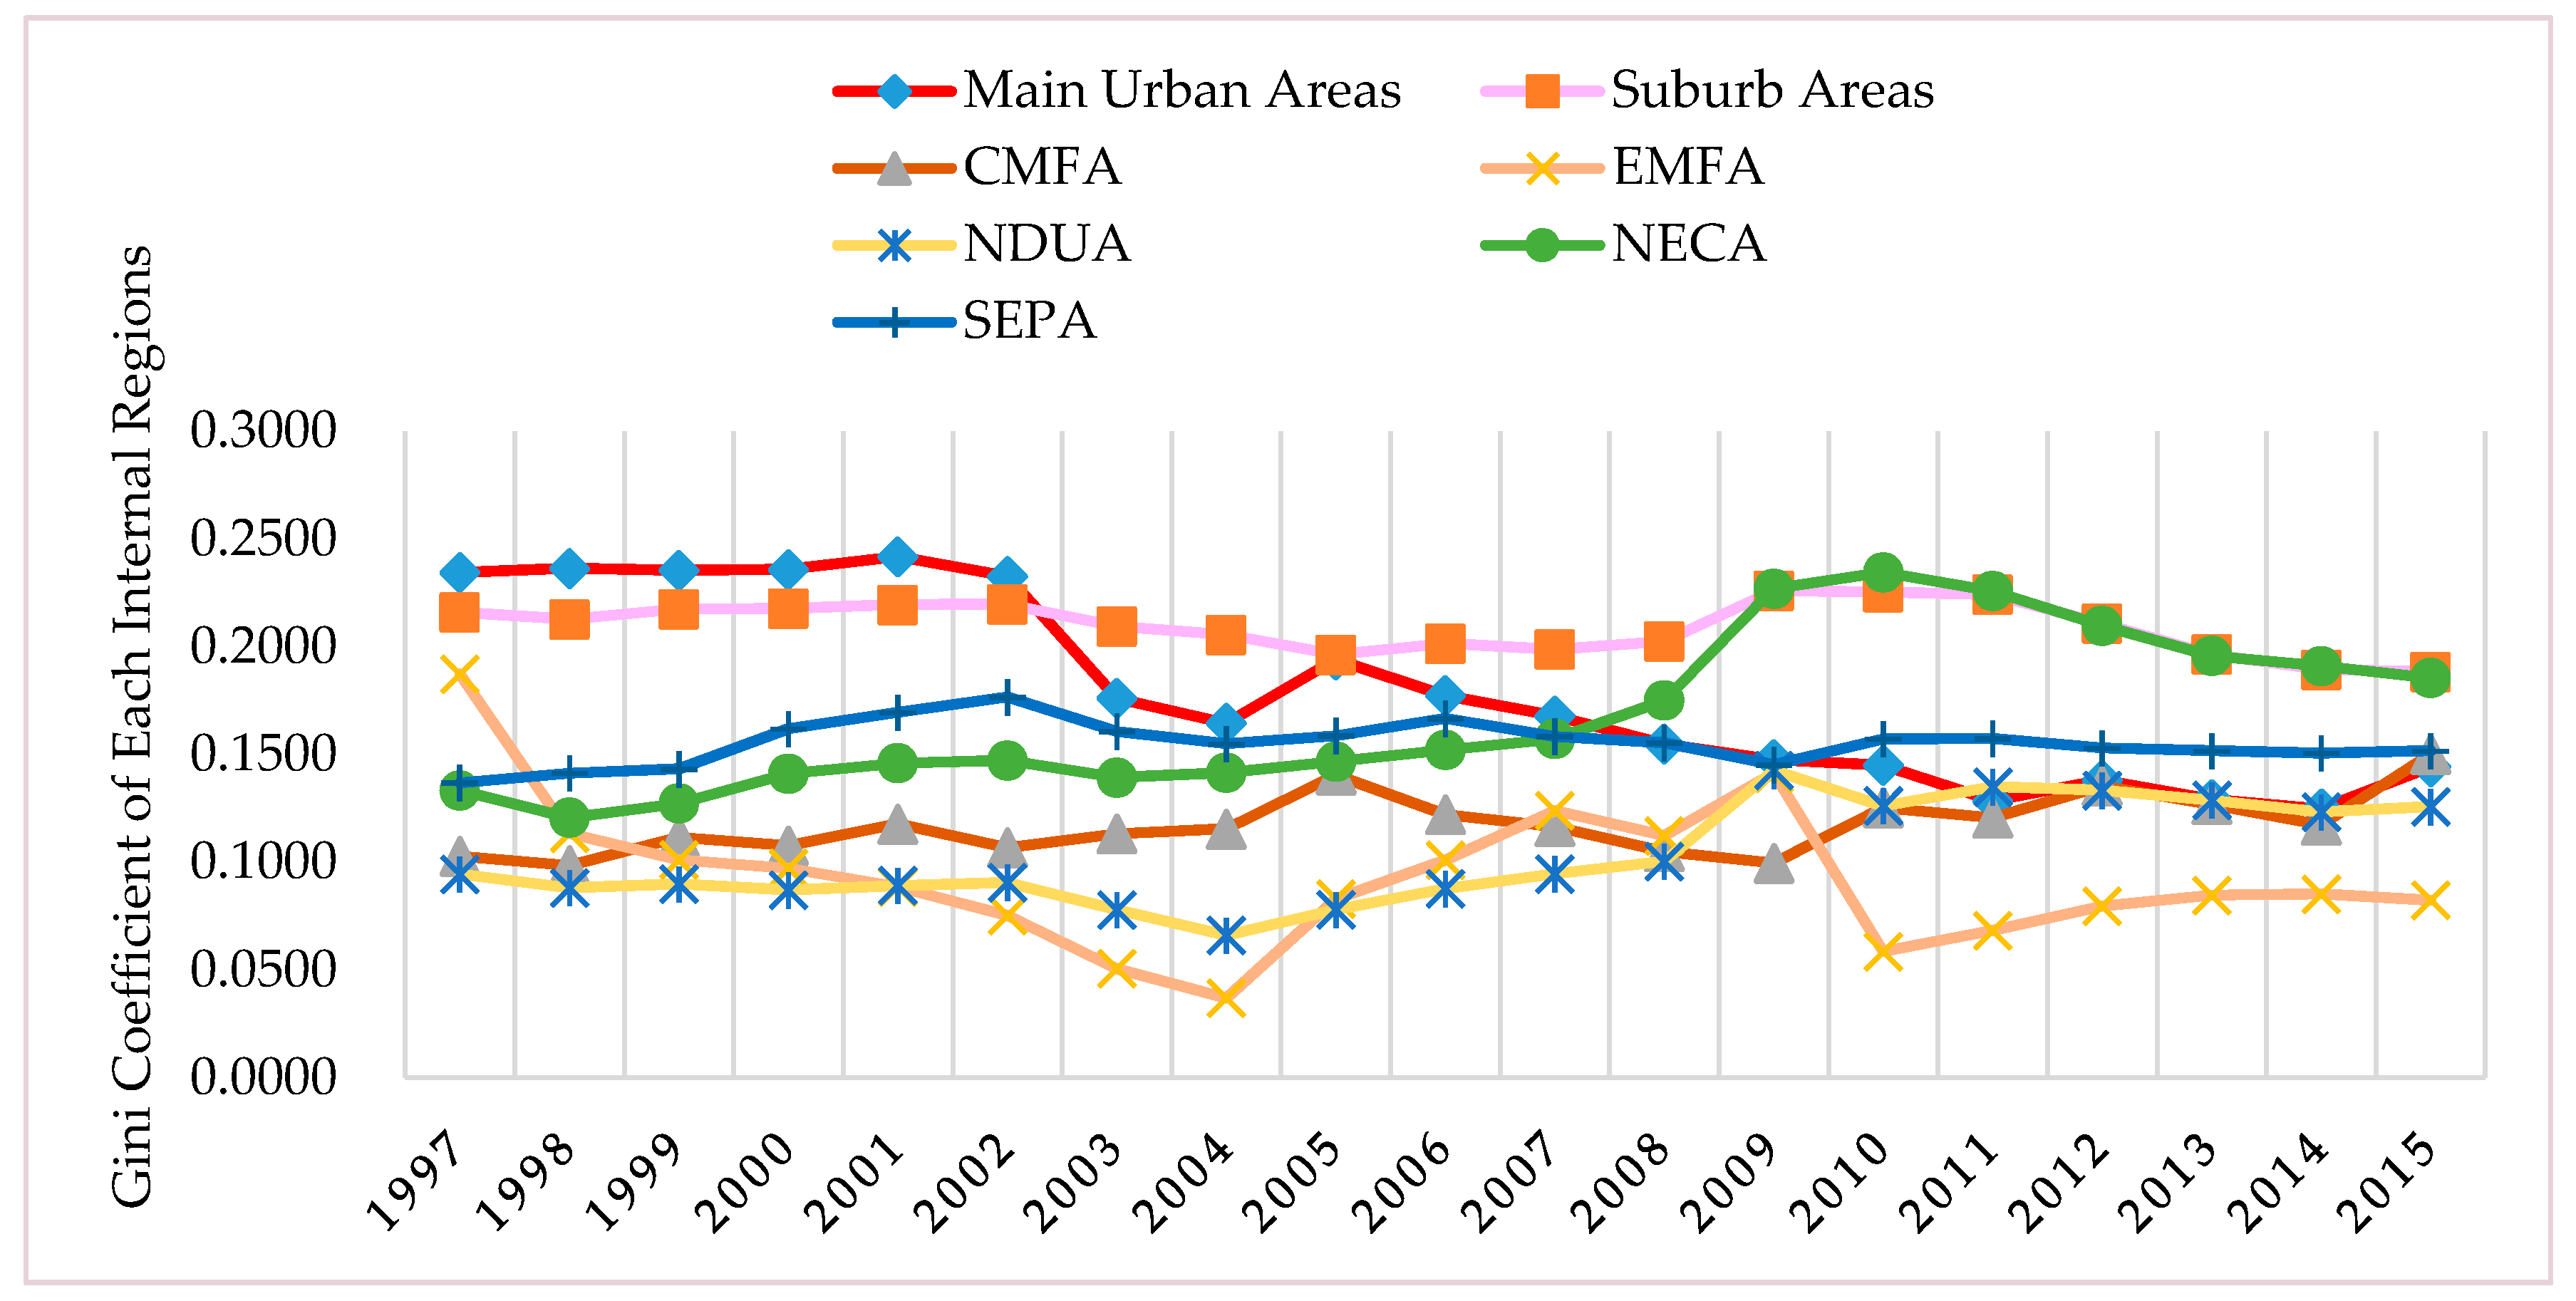
Based on the results of decomposing RGGC by two spatial divisions, both spatial divisions show that the between regions’ contribution is the largest section to RIC, and there are also large differences between the two divisions. According to the division of main urban and suburban areas, between regions’ contribution is about 60%, while the contribution between regions is more than 80% as per the division of Five Function Areas. It shows the difference between regions of the Five Function Areas is greater than that of main urban and suburban areas. Meanwhile, as shown in Figure 6, which is compiled from Table 1 and Table 2, the Gini Coefficient of main areas and suburban areas is greater than that of other regions, which are roughly divided by the Five Function Areas, especially at the beginning of Chongqing became a municipality. It means that the intraregional inequality of the main urban and suburban areas is larger than that of the Five Function Areas, given that the economic areas should achieve two goals that the internal regions have some certain similarities and the between regions have some differences [49]. Therefore, the current spatial division based on the Five Function Areas is more reasonable and rational than the division of main urban areas and suburban areas.
In addition, it is necessary to point out that, according to the current regional division of the Five Function Areas, the CR between regions to RIC has been decreasing sharply in recent years as shown in Table 2. This situation that stands for that interregional inequality has been relatively narrowing, but inequality of internal regions has been relatively increasing, which means that current regional division of the Five Function Areas needs to be further adjusted to make more targeted and preciser regional policies. In particular, as shown in Figure 6, although the Gini Coefficient of NECA has certainly declined in recent years, it increased sharply from 1997 to 2010, and it is also significantly larger than that of the other four function areas in recent years, which means that the internal inequality of NECA is relatively greater. In order to make more targeted regional policies, NECA needs to be further divided into smaller units to reduce its internal inequality for making more targeted regional policies.
4.4. Economic Development Reduces Regional Inequality
RGGC declined from 0.3280 in 1997 to 0.2475 in 2015 and the rate of decrease is 24.54%, namely, the level of RIC decreased by 24.54%. As shown in Table 3, the decrease of RGGC is caused by economic development and the change of each county population share, and the CR of each part is 103.85 and −3.85%, respectively. This results mean that economic development decreased the level of RIC effectively, whereas the change of each county population share expanded the level of RIC conversely in some degree. Consequently, according to empirical results, as the best way to reduce the regional inequality, Chongqing should continue to focus on developing the economy.
4.5. Policy Suggestions
Based on the results of this study and combined with the practical development and conditions of Chongqing and China, some targeted and systematic policy suggestions are proposed to promote sustainable development of Chongqing as follows:
- Combined with the national strategies to develop the economy of Chongqing. The empirical results show that economic development is helpful to reduce the inequality of Chongqing effectively, thus Chongqing should develop the economy continually. China is promoting the national strategies of “the Silk Road Economic Belt and the 21st Century Maritime Silk Road” (or simply “the Belt and Road” for short) and the “Yangtze River Economic Belt”. As the municipality and national central city in the upriver of the Yangzi River, Chongqing is located in the joint of “the Belt and Road” and the “Yangtze River Economic Belt”, which has the unique advantages of linking the east to the west and connecting the south to the north. Based on the advantages and opportunities, Chongqing should take the initiative to merge itself into national strategies, as well make the best of its own resources and national policies to develop.
- Promoting and optimizing the construction of the Five Function Areas. Chongqing is a combination of a “big city, big countryside, big mountain area, big reservoir area”, its spatial maldistribution of resources and the environment restricts industrialization and urbanization in some areas. For instance, the Three Gorges Reservoir Area has geological disasters that bring many hidden dangers to the safety of people’s lives and property, as well as having a fragile ecosystem that impacts not only itself, but also the ecological situation in the whole Yangtze River basin. It is necessary to identify whether a region could develop or not, what is proper to develop, what needs protection, namely, each area’s function must be assessed and determined. Given the current strategy of the Five Function Areas is based on this idea, in order to achieve the coordinated and sustainable development of the economy, society, and the environment, the construction of Five Function Areas should be promoted continually. In addition, given development of the Five Function Areas is under dynamic change, it is necessary to establish the mechanism for real-time monitoring and dynamic adjustment of the Five Function Areas, which is helpful to make more targeted and effective regional policies.
- Encouraging regional special economic and advantageous industrial development based on local respective conditions. There are some poor phenomena existing in the process of regional development, including unclear regional functional positioning, the industrial homogeneous competition, and the industrial unordered development, which is harmful to making the best of resources and developing sustainably. Faced with the problems, given the fact that there are big differences in resources, environment and the development basis between regions in Chongqing, the government needs to better guide and regularize the regional industrial orderly development by regional and industrial policies. More specifically, Chongqing should encourage each area to develop its special economic and advantageous industries based on the local comparative advantages and existing industrial conditions, as well as constricting the industries, which is not suitable for local development.
- Taking more targeted measures to help people lift themselves out of poverty. As a socialist country, China has been dedicated to Poverty Alleviation since the People’s Republic of China (PRC) was established in 1949, which is a road with Chinese characteristics and acquired better effects. Due to poverty being closely linked to geographical location in China [60], as a western inland region, Chongqing still has 14 national poverty counties and more than 1.6 million people in poverty, and it is unrealistic to make all of them get out of poverty by developing the economy in a short time. China, however, plans to build a comprehensively well-off society in five years, which means that there will be no people in poverty in China theoretically. Consequently, it is necessary to take more targeted measures to help people lift themselves out of poverty. Recently, policy makers have made significant progress in overcoming this difficulty by relocating people living in impoverished regions with no sustainable conditions, or development-oriented Poverty Alleviation.
- Improving people’s livelihood and achieving regional equalization of basic public services. Economic inequality also brings about the inequality of health, education, and other public services, which could lead to greater social conflicts and unsustainable development [17]. Although economic sustainable development is a good way to reduce the regional inequality, it will take quite a long time. Consequently, it is necessary to take action to improve people’s livelihood and achieve regional equalization of basic public services immediately. There are two possible ways to handle this problem: the first is that directly offering aid of capital, technology, and competent professionals to the undeveloped areas where the public services are plagued by stockouts, poor working conditions, and staff shortages; the second is that fiscal transfer payment from richer areas to undeveloped areas to support the supplies of undeveloped areas’ public services.
5. Conclusions
Given that regional inequality is a large challenge to sustainable development, this paper analyzes regional inequality from the perspective of sectoral structure, spatial policies, and economic development by constructing and decomposing the Gini Coefficient. Taking Chongqing as the analytical case, it is mainly found that: (1) through the analysis of RIC since Chongqing became a municipality in 1997, Chongqing’s regional economic development has experienced a dynamic process from unbalanced development to balanced development, in particular, the level of RIC has been decreasing steadily in recent years; (2) according to the sectoral decomposition results, the CR of the Tertiary Sector to RIC became the largest section gradually; (3) in the view of multi-spatial decomposition results, inequality between regions contributes most to RIC and the spatial division of Five Function Areas is more rational; and (4) based on the decomposition results of the Gini Coefficient increment, economic development is the best way to reduce the inequality, whereas the change of population distribution exacerbates inequality to some extent.
Compared with previous studies, this research mainly makes progress in the following aspects: (1) the perspective of sectoral structure is more comprehensive. Most studies on the regional inequality just focus on the GDP as a whole, rather than analyze it more deeply as per sectoral structure. This paper analyzes not only the inequality of various sectors, but also their contribution to the RIC, respectively, which can better and more deeply comprehend and account for the regional inequality; (2) meanwhile, most previous studies on regional inequality conduct from only a spatial perspective, rather than the multi-spatial perspective [49], even if some studies on regional inequality from multi-spatial perspectives exist, they do not assess the rationality of the spatial policies based on various spatial divisions. While this paper makes up the gap, (3) quantitative explanation for the relationship between economic development and the change of regional inequality is more scientific.
Regional inequality is a worldwide problem that both researchers and policy makers are dedicated to studying and solving. By this study, it could provide a newly feasible paradigm to study and comprehend the regional inequality. Meanwhile, Chongqing as a typical region has the characteristics of a “big city, big countryside, big mountain area, big reservoir area”, which means that the regional inequality of Chongqing is more serious, and, through this research, it could offer detailed references to reduce the regional inequality and promote sustainable development of Chongqing, as well as give some suggestions and experiences for the similar regions in promoting regional, coordinated and sustainable development. The findings of this study are not only for the researchers, but also for the policy makers.
However, it should be noted that this study has been primarily concerned with economic inequality—environmental inequality, health inequality, and social inequality have not been taken into consideration, despite all of them being a challenge to sustainable development. Meanwhile, as a method of measuring inequality, the Gini Coefficient is not a panacea, which cannot directly reflect the factors that do not exist in the formulas, such as policy variables and environmental variables. Therefore, a more in-depth and systematic study on inequality from a variety of aspects needs to be conducted in the future, and the method should also be further explored.
Acknowledgments
The authors appreciate the support of the National Natural Science Foundation of China (Project No. 71473203) and the National Social Science Foundation of China (Project No. 10XGL009). Our gratefulness also goes to Fundamental Research Funds for the Central Universities (Project No. 2016CDJXY and Project No. 106112016 CDJSK 03 JD 01) for partial support of this work.
Author Contributions
Xiaosu Ye conceptualized the study design. Lie Ma contributed to study design, data collection and drafting. Kunhui Ye revised the manuscript. Qiu Xie reviewed the manuscript, collected and sorted out some of the data. Lie Ma and Jiantao Chen conducted the data analysis. All authors read, revised and approved the final manuscript.
Conflicts of Interest
The authors declare no conflict of interest.
References
- Wei, Y. Towards Equitable and Sustainable Urban Space: Introduction to Special Issue on “Urban Land and Sustainable Development”. Sustainability 2016, 8, 804. [Google Scholar] [CrossRef]
- Stiglitz, J.E. The Price of Inequality: How Today's Divided Society Endangers Our Future; W.W. Norton & Company Publishing: New York, NY, USA, 2012. [Google Scholar]
- Liao, F.H.; Wei, Y.D. Space, scale, and regional inequality in provincial China: A spatial filtering approach. Appl. Geogr. 2015, 61, 94–104. [Google Scholar] [CrossRef]
- Berg, A.; Ostry, J.D.; Zettelmeyer, J. What makes growth sustained? J. Dev. Econ. 2012, 98, 149–166. [Google Scholar] [CrossRef]
- Lyhagen, J.; Rickne, J. Income inequality between Chinese regions: Newfound harmony or continued discord? Exp. Econ. 2013, 47, 93–110. [Google Scholar] [CrossRef]
- Jorgenson, A.K.; Schor, J.B.; Knight, K.W.; Huang, X. Domestic Inequality and Carbon Emissions in Comparative Perspective. Sociol. Forum 2016, 31, 770–786. [Google Scholar] [CrossRef]
- Graham, M.; Ernstson, H. Comanagement at the Fringes: Examining Stakeholder Perspectives at Macassar Dunes, Cape Town, South Africa—At the Intersection of High Biodiversity, Urban Poverty, and Inequality. Ecol. Soc. 2012, 17, 1571–1582. [Google Scholar] [CrossRef]
- Wilkinson, R.G. Income distribution and life expectancy. BMJ 1995, 311, 1282–1285. [Google Scholar] [CrossRef]
- Mayrhofer, T.; Schmitz, H. Testing the relationship between income inequality and life expectancy: A simple correction for the aggregation effect when using aggregated data. J. Popul. Econ. 2014, 27, 841–856. [Google Scholar] [CrossRef]
- Alesina, A.; Rodrik, D. Distributive Politics and Economic Growth. Q. J. Econ. 1991, 109, 465–490. [Google Scholar] [CrossRef]
- Persson, T.; Tabellini, G. Is inequality harmful for growth? Am. Econ. Rev. 2011, 16, 600–621. [Google Scholar]
- Haggard, S.; Kaufman, R.R. Inequality and Regime Change: Democratic Transitions and the Stability of Democratic Rule. Am. Political Sci. Rev. 2012, 106, 495–516. [Google Scholar] [CrossRef]
- Jung, F.; Sunde, U. Income, inequality, and the stability of democracy—Another look at the Lipset hypothesis. Eur. J. Political Econ. 2014, 35, 52–74. [Google Scholar] [CrossRef]
- Solt, F. Does Economic Inequality Depress Electoral Participation? Testing the Schattschneider Hypothesis. Political Behav. 2010, 32, 285–301. [Google Scholar] [CrossRef]
- Mikkelson, G.M.; Gonzalez, A.; Peterson, G.D. Economic inequality predicts biodiversity loss. PLoS ONE 2007, 2, 346. [Google Scholar] [CrossRef] [PubMed]
- Wilkinson, R.G.; Pickett, K.E. The Spirit Level: Why Equality Is Better for Everyone; Penguin: London, UK, 2010. [Google Scholar]
- Genevey, R.; Pachauri, R.K.; Tubiana, L.; Jozan, R.; Voituriez, T.; Sundar, S. Reducing Inequalities: A Sustainable Development Challenge; Cirad: Paris, France, 2013. [Google Scholar]
- Wei, Y.D. Spatiality of regional inequality. Appl. Geogr. 2015, 61, 1–10. [Google Scholar] [CrossRef]
- National Bureau of Statistics of China. China Statistical Yearbook 2015; China Statistics Press: Beijing, China, 2015. (In Chinese)
- National Bureau of Statistics of China. Statistical Communiqué of the People’s Republic of China on the 2015 National Economic and Social Development. Available online: http://www.stats.gov.cn/tjsj/zxfb/201602/t20160229_1323991.html (accessed on 29 February 2016). (In Chinese)
- Zhang, J.; Deng, W. Multiscale Spatio-Temporal Dynamics of Economic Development in an Interprovincial Boundary Region: Junction Area of Tibetan Plateau, Hengduan Mountain, Yungui Plateau and Sichuan Basin, Southwestern China Case. Sustainability 2016, 8, 215. [Google Scholar] [CrossRef]
- Yang, F.; Pan, S.; Yao, X. Regional Convergence and Sustainable Development in China. Sustainability 2016, 8, 121. [Google Scholar] [CrossRef]
- Xu, H.; Yang, H.; Li, X.; Jin, H.; Li, D. Multi-Scale Measurement of Regional Inequality in Mainland China during 2005–2010 Using DMSP/OLS Night Light Imagery and Population Density Grid Data. Sustainability 2015, 7, 13469–13499. [Google Scholar] [CrossRef]
- Zhang, Q.; Zou, H. Regional Inequality in Contemporary China. Ann. Econ. Financ. 2012, 13, 113–137. [Google Scholar]
- Fan, S.; Kanbur, R.; Zhang, X. China’s regional disparities: Experience and policy. Rev. Dev. Financ. 2011, 1, 47–56. [Google Scholar] [CrossRef]
- Tang, R. Five development ideas to shape the future of China. Red Flag Manuscr. 2016, 1, 14–17. [Google Scholar]
- Yue, W.; Zhang, Y.; Ye, X.; Cheng, Y.; Leipnik, M. Dynamics of Multi-Scale Intra-Provincial Regional Inequality in Zhejiang, China. Sustainability 2014, 6, 5763–5784. [Google Scholar] [CrossRef]
- Zhang, W.; Bao, S. Created unequal: China’s regional pay inequality and its relationship with mega-trend urbanization. Appl. Geogr. 2015, 61, 81–93. [Google Scholar] [CrossRef]
- Li, G.; Fang, C. Analyzing the multi-mechanism of regional inequality in China. Ann. Reg. Sci. 2014, 52, 155–182. [Google Scholar] [CrossRef]
- Li, C.; Gibson, J. Rising Regional Inequality in China: Fact or Artifact? World Dev. 2013, 47, 16–29. [Google Scholar] [CrossRef]
- Li, Y. Resource Flows and the Decomposition of Regional Inequality in the Beijing-Tianjin-Hebei Metropolitan Region, 1990–2004. Growth Chang. 2012, 43, 335–357. [Google Scholar] [CrossRef]
- Zhao, X.B.; Tong, S.P. Unequal Economic Development in China: Spatial Disparities and Regional Policy Reconsideration, 1985–1995. Reg. Stud. 2010, 34, 549–561. [Google Scholar] [CrossRef]
- Chen, P.Y.; Zhu, X.G. Regional Inequalities in China at Different Scales. Acta Geogr. Sin. 2012, 67, 1085–1097. [Google Scholar]
- Ehrlich, M.; Seidel, T. Regional implications of financial market development: Industry location and income inequality. Eur. Econ. Rev. 2015, 73, 85–102. [Google Scholar] [CrossRef]
- Wei, Y.H.D.; Liefner, I. Globalization, industrial restructuring, and regional development in China. Appl. Geogr. 2012, 32, 102–105. [Google Scholar] [CrossRef]
- Wu, D.; Rao, P. Urbanization and Income Inequality in China: An Empirical Investigation at Provincial Level. Soc. Indic. Res. 2017, 131, 189–214. [Google Scholar] [CrossRef]
- He, C.; Chen, T.; Mao, X.; Zhou, Y. Economic transition, urbanization and population redistribution in China. Habitat Int. 2016, 51, 39–47. [Google Scholar] [CrossRef]
- Liu, B.; Chen, X.; Wang, X.; Chen, Y. Development potential of Chinese construction industry in the new century based on regional difference and spatial convergence analysis. KSCE J. Civ. Eng. 2013, 18, 11–18. [Google Scholar] [CrossRef]
- Feser, E.J.; Bergman, E.M. National Industry Cluster Templates: A Framework for Applied Regional Cluster Analysis. Reg. Stud. 2000, 34, 1–19. [Google Scholar] [CrossRef]
- Ye, Q. The Transfer Trend and Undertaking Competitive Situation of China’s Regional Industry. Econ. Geogr. 2014, 34, 91–97. [Google Scholar]
- Yu, D.; Zhang, Y. China’s industrial transformation and the ‘new normal’. Third World Q. 2015, 36, 2075–2097. [Google Scholar] [CrossRef]
- Liu, G.Z.; Zhou, Q. An Empirical Analysis on Industrial Structural Transition and Regional Inequality in China. In Proceedings of the 2009 International Conference on Management Science and Engineering, Moscow, Russia, 14–16 September 2009; Hua, L., Ed.; IEEE Computer Society: Moscow, Russia, 2009; pp. 1044–1052. [Google Scholar]
- Cheong, T.S.; Wu, Y. The impacts of structural transformation and industrial upgrading on regional inequality in China. China Econ. Rev. 2014, 31, 339–350. [Google Scholar] [CrossRef]
- Wei, Y.H.D.; Gu, C. Industrial Development and Spatial Structure in Changzhou City, China: The Restructuring of the Sunan Model. Urban Geogr. 2013, 31, 321–347. [Google Scholar] [CrossRef]
- Bakkeli, N.Z. Income inequality and health in China: A panel data analysis. Soc. Sci. Med. 2016, 157, 39–47. [Google Scholar] [CrossRef] [PubMed]
- Xu, H.; Xie, Y. Socioeconomic Inequalities in Health in China: A Reassessment with Data from the 2010–2012 China Family Panel Studies. Soc. Indic. Res. 2016. [Google Scholar] [CrossRef]
- Chen, J.; Cheng, S.; Song, M.; Wang, J. Interregional differences of coal carbon dioxide emissions in China. Energy Policy 2016, 96, 1–13. [Google Scholar] [CrossRef]
- Wan, G.; Zhou, Z. Income Inequality in Rural China: Regression-based Decomposition Using Household Data. Rev. Dev. Econ. 2005, 9, 107–120. [Google Scholar] [CrossRef]
- Hong, X. Regional Inequality, Polarization and Mobility in China. Econ. Res. J. 2010, 12, 82–96. [Google Scholar]
- Kanbur, R.; Zhang, X. Which Regional Inequality? The Evolution of Rural-Urban and Inland-Coastal Inequality in China from 1983 to 1995. J. Comp. Econ. 1999, 27, 686–701. [Google Scholar] [CrossRef]
- Primm, A.T. Echoes of Chongqing: Women in Wartime China—By Danke Li. Oral Hist. Rev. 2011, 38, 422–424. [Google Scholar] [CrossRef]
- Zhang, H.; Li, L.; Chen, T.; Li, V. Where will China’s real estate market go under the economy’s new normal? Cities 2016, 55, 42–48. [Google Scholar] [CrossRef]
- Chan, K.W.; Wan, G. The size distribution and growth pattern of cities in China, 1982–2010: Analysis and policy implications. J. Asia Pac. Econ. 2017, 22, 136–155. [Google Scholar] [CrossRef]
- Sun, Z. Balancing Urban-rural and Regional Development to Build a Well-off Society in an All-round Way. Qiushi J. 2013, 9, 10–12. (In Chinese) [Google Scholar]
- Chen, D.; Wang, Y.; Ren, F.; Du, Q. Spatio-Temporal Differentiation of Urban-Rural Equalized Development at the County Level in Chengdu. Sustainability 2016, 8, 422. [Google Scholar] [CrossRef]
- Meng, D.; Lu, Y. Industry Decomposition of County Economic Disparity Based on Gini Coefficient in Henan Province. Econ. Geogr. 2011, 31, 799–804. [Google Scholar]
- Sen, A. On Economic Inequality; Clarendon Press: Oxford, UK, 1997. [Google Scholar]
- Lerman, R.I.; Yitzhaki, S. Income Inequality Effects by Income Source: A New Approach and Applications to the United States. Rev. Econ. Stat. 1985, 67, 151–156. [Google Scholar] [CrossRef]
- Mookherjee, D.; Shorrocks, A. A Decomposition Analysis of the Trend in UK Income Inequality. Econ. J. 1982, 92, 886–902. [Google Scholar] [CrossRef]
- Li, T.; Long, H.; Tu, S.; Wang, Y. Analysis of Income Inequality Based on Income Mobility for Poverty Alleviation in Rural China. Sustainability 2015, 7, 16362–16378. [Google Scholar] [CrossRef]
Figure 1.
Location of Chongqing in China.
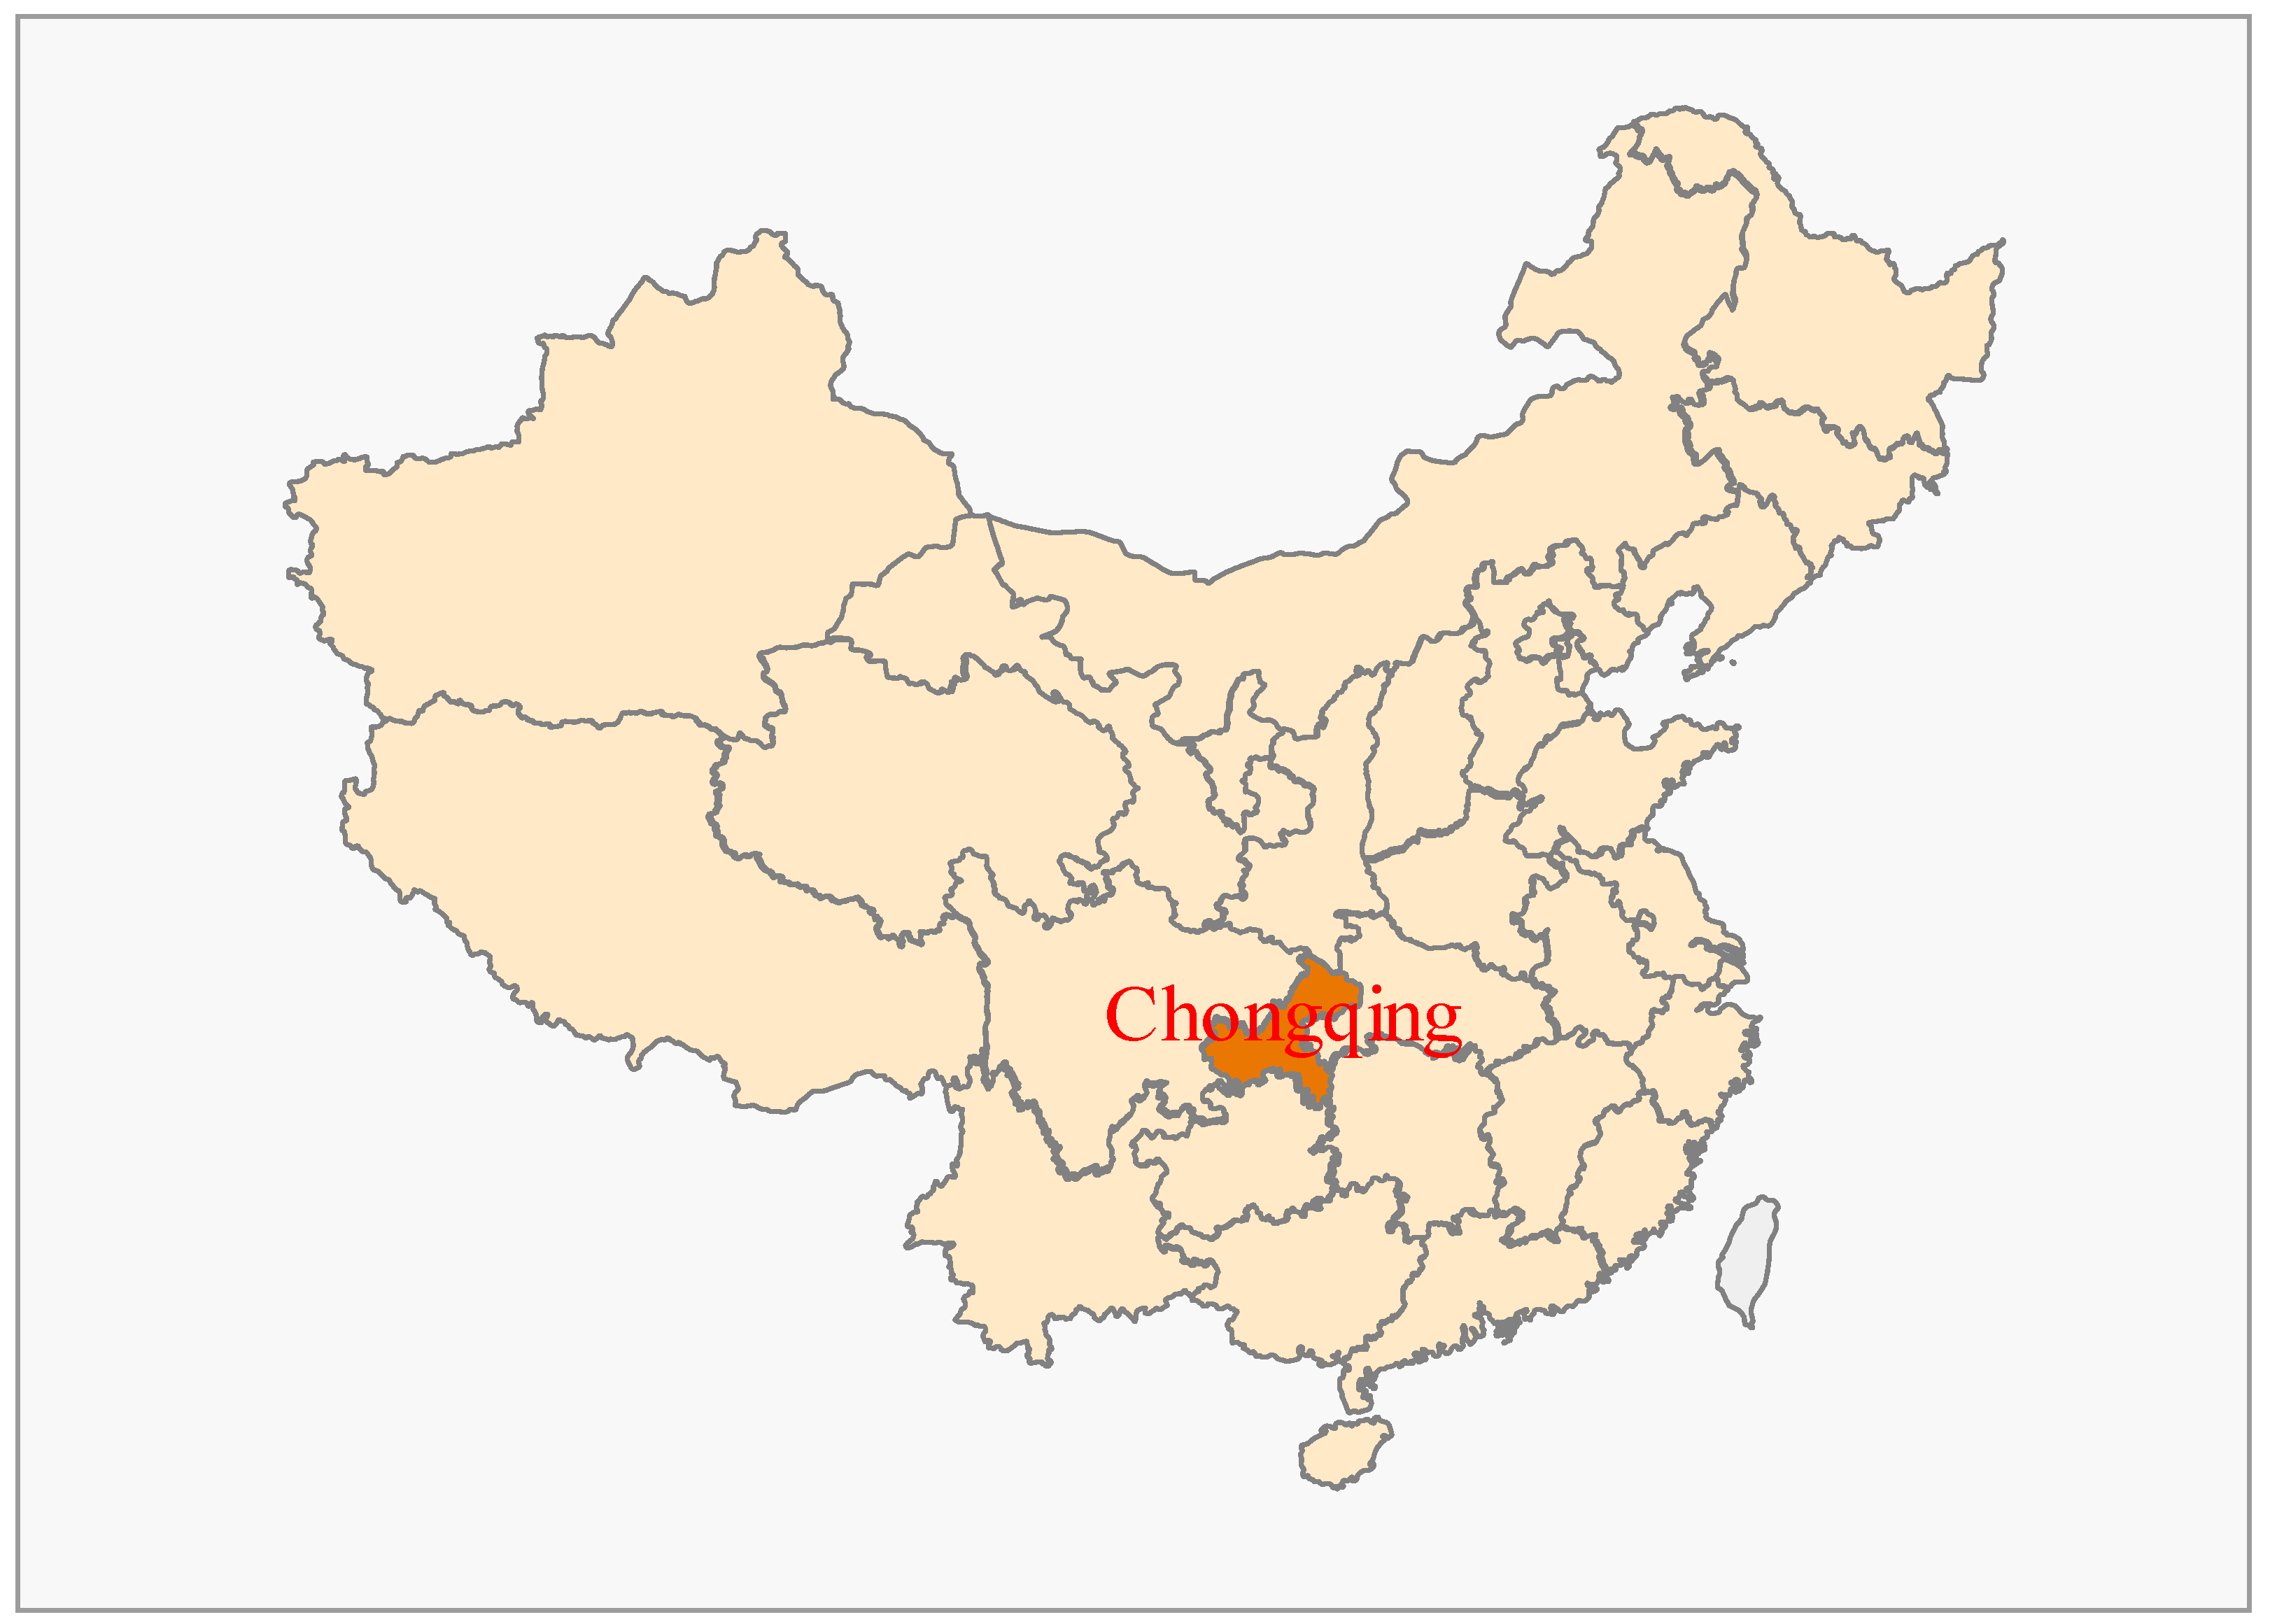
Figure 2.
Main urban and suburban areas in Chongqing.

Figure 3.
Five Function Areas in Chongqing.

Figure 4.
Various Gini Coefficients in Chongqing (1997–2015).
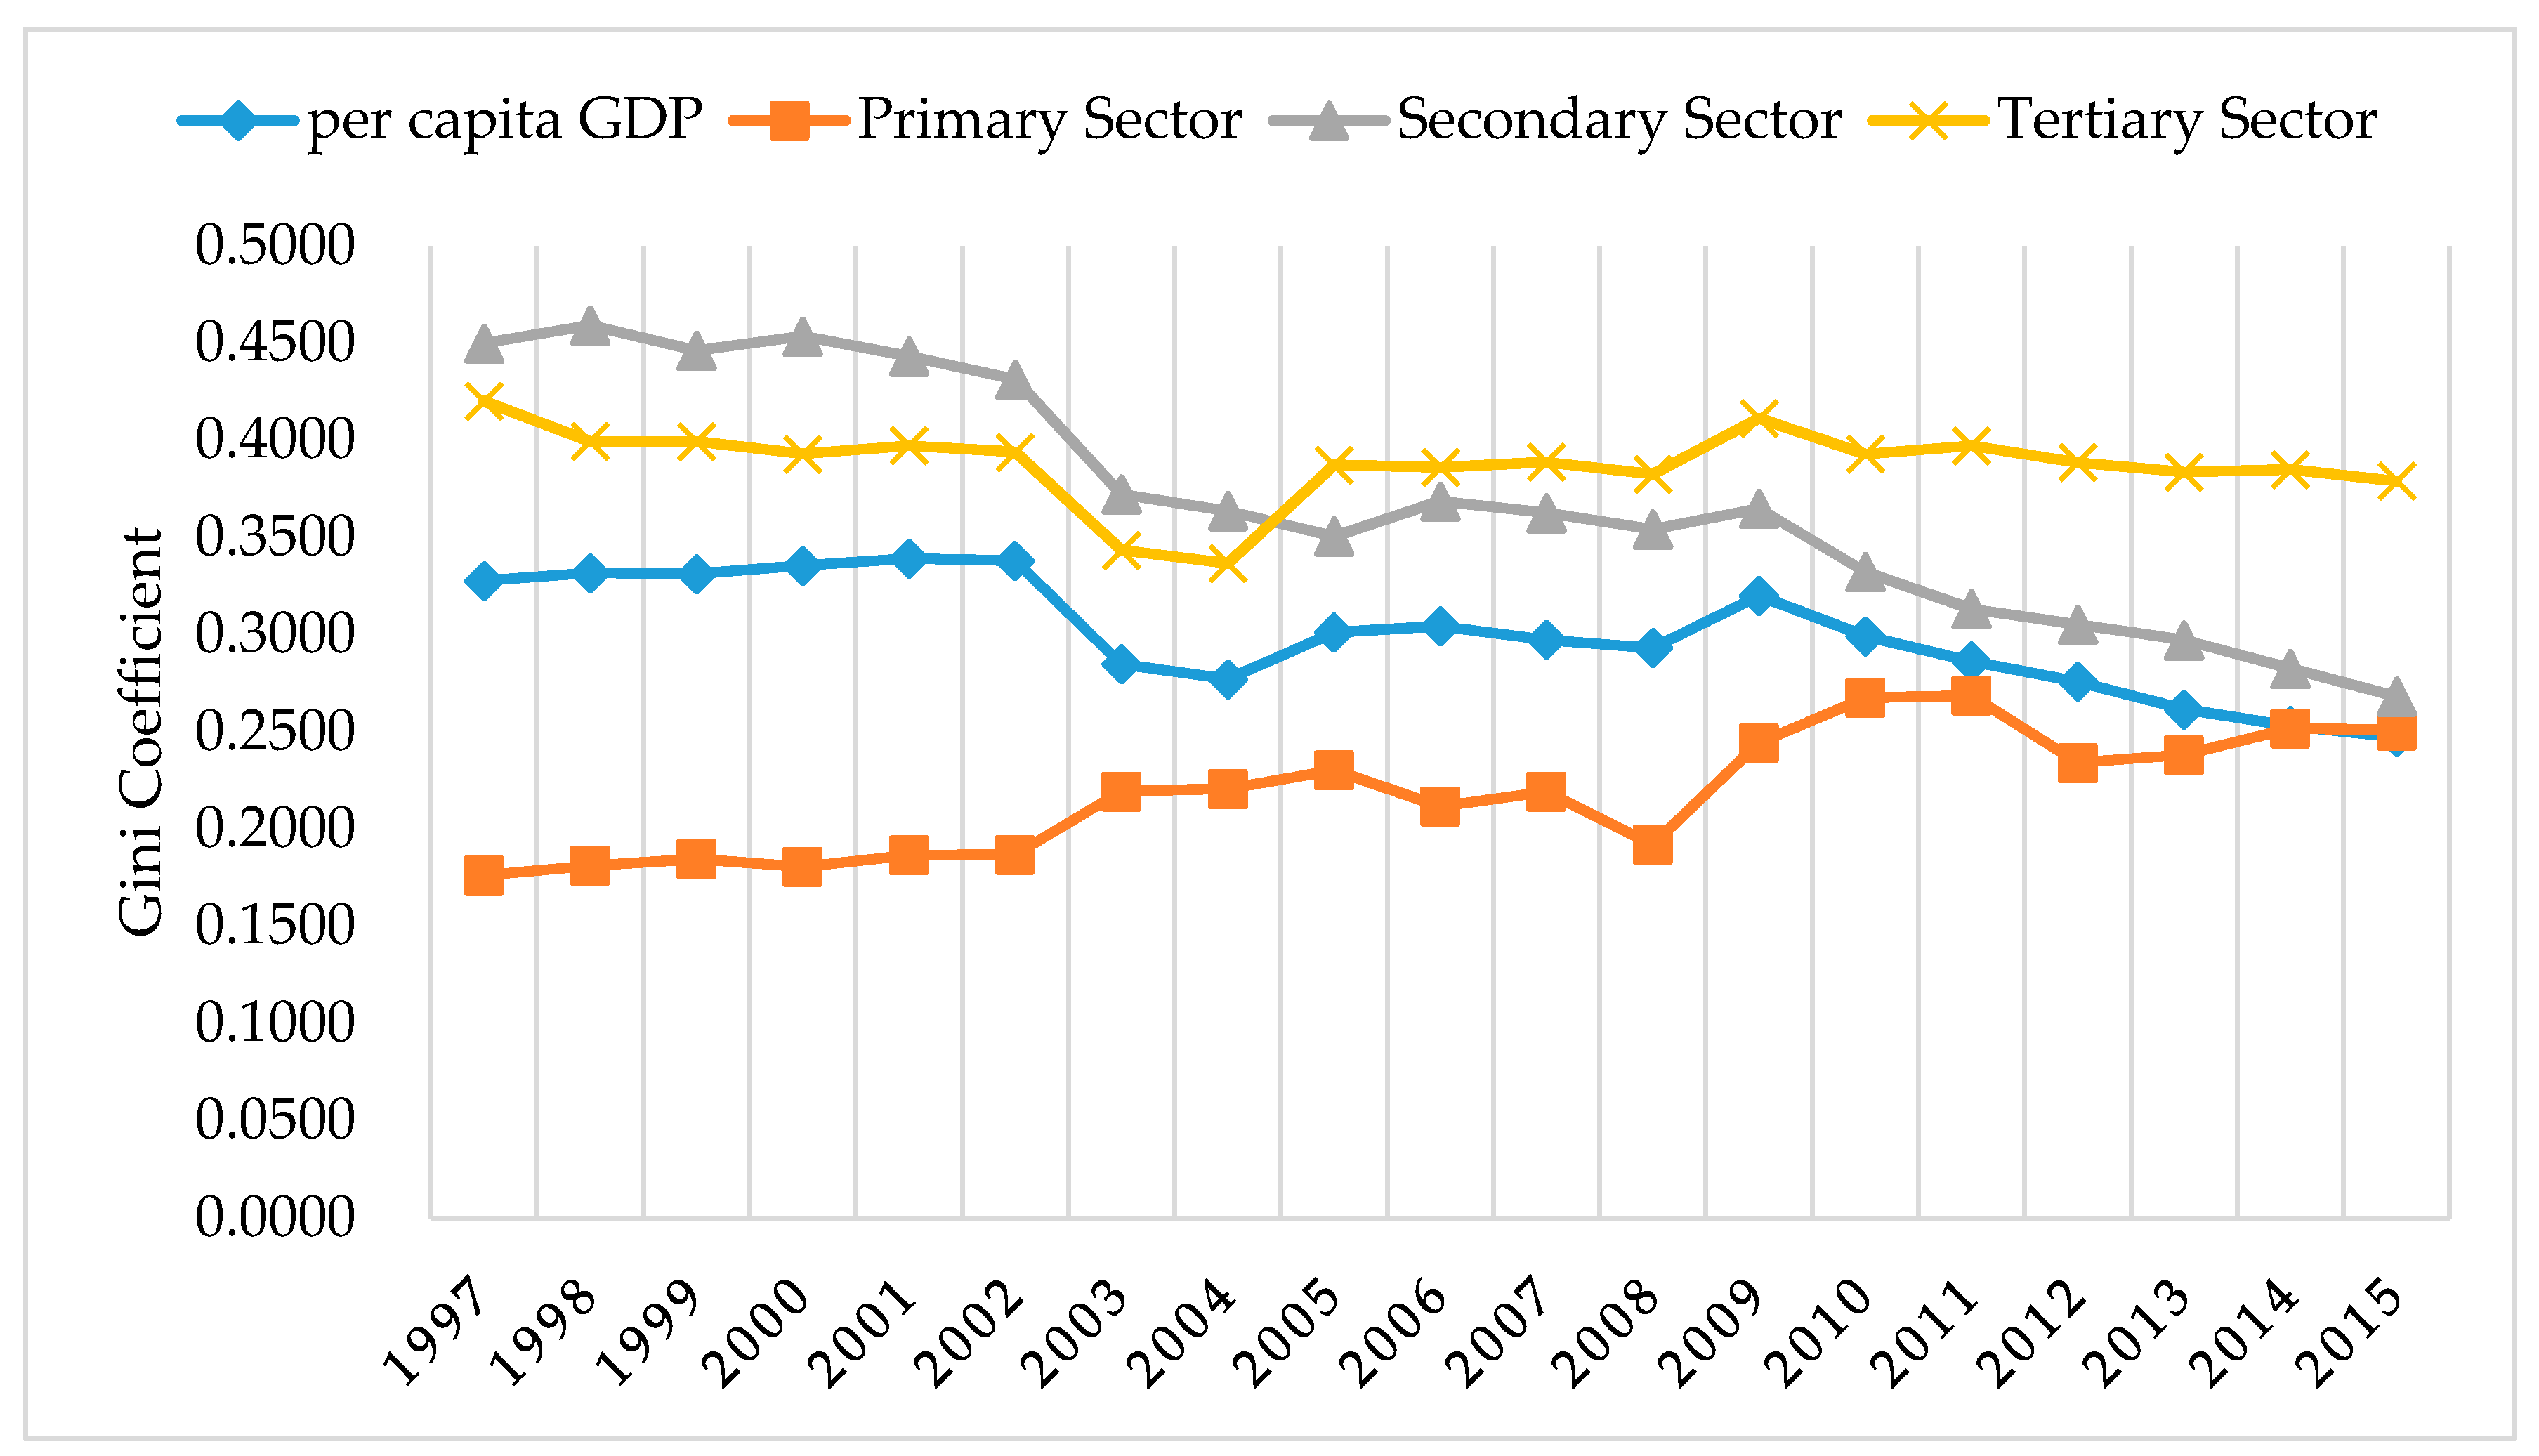
Figure 5.
The CR of each sector to RGGC (1997–2015).
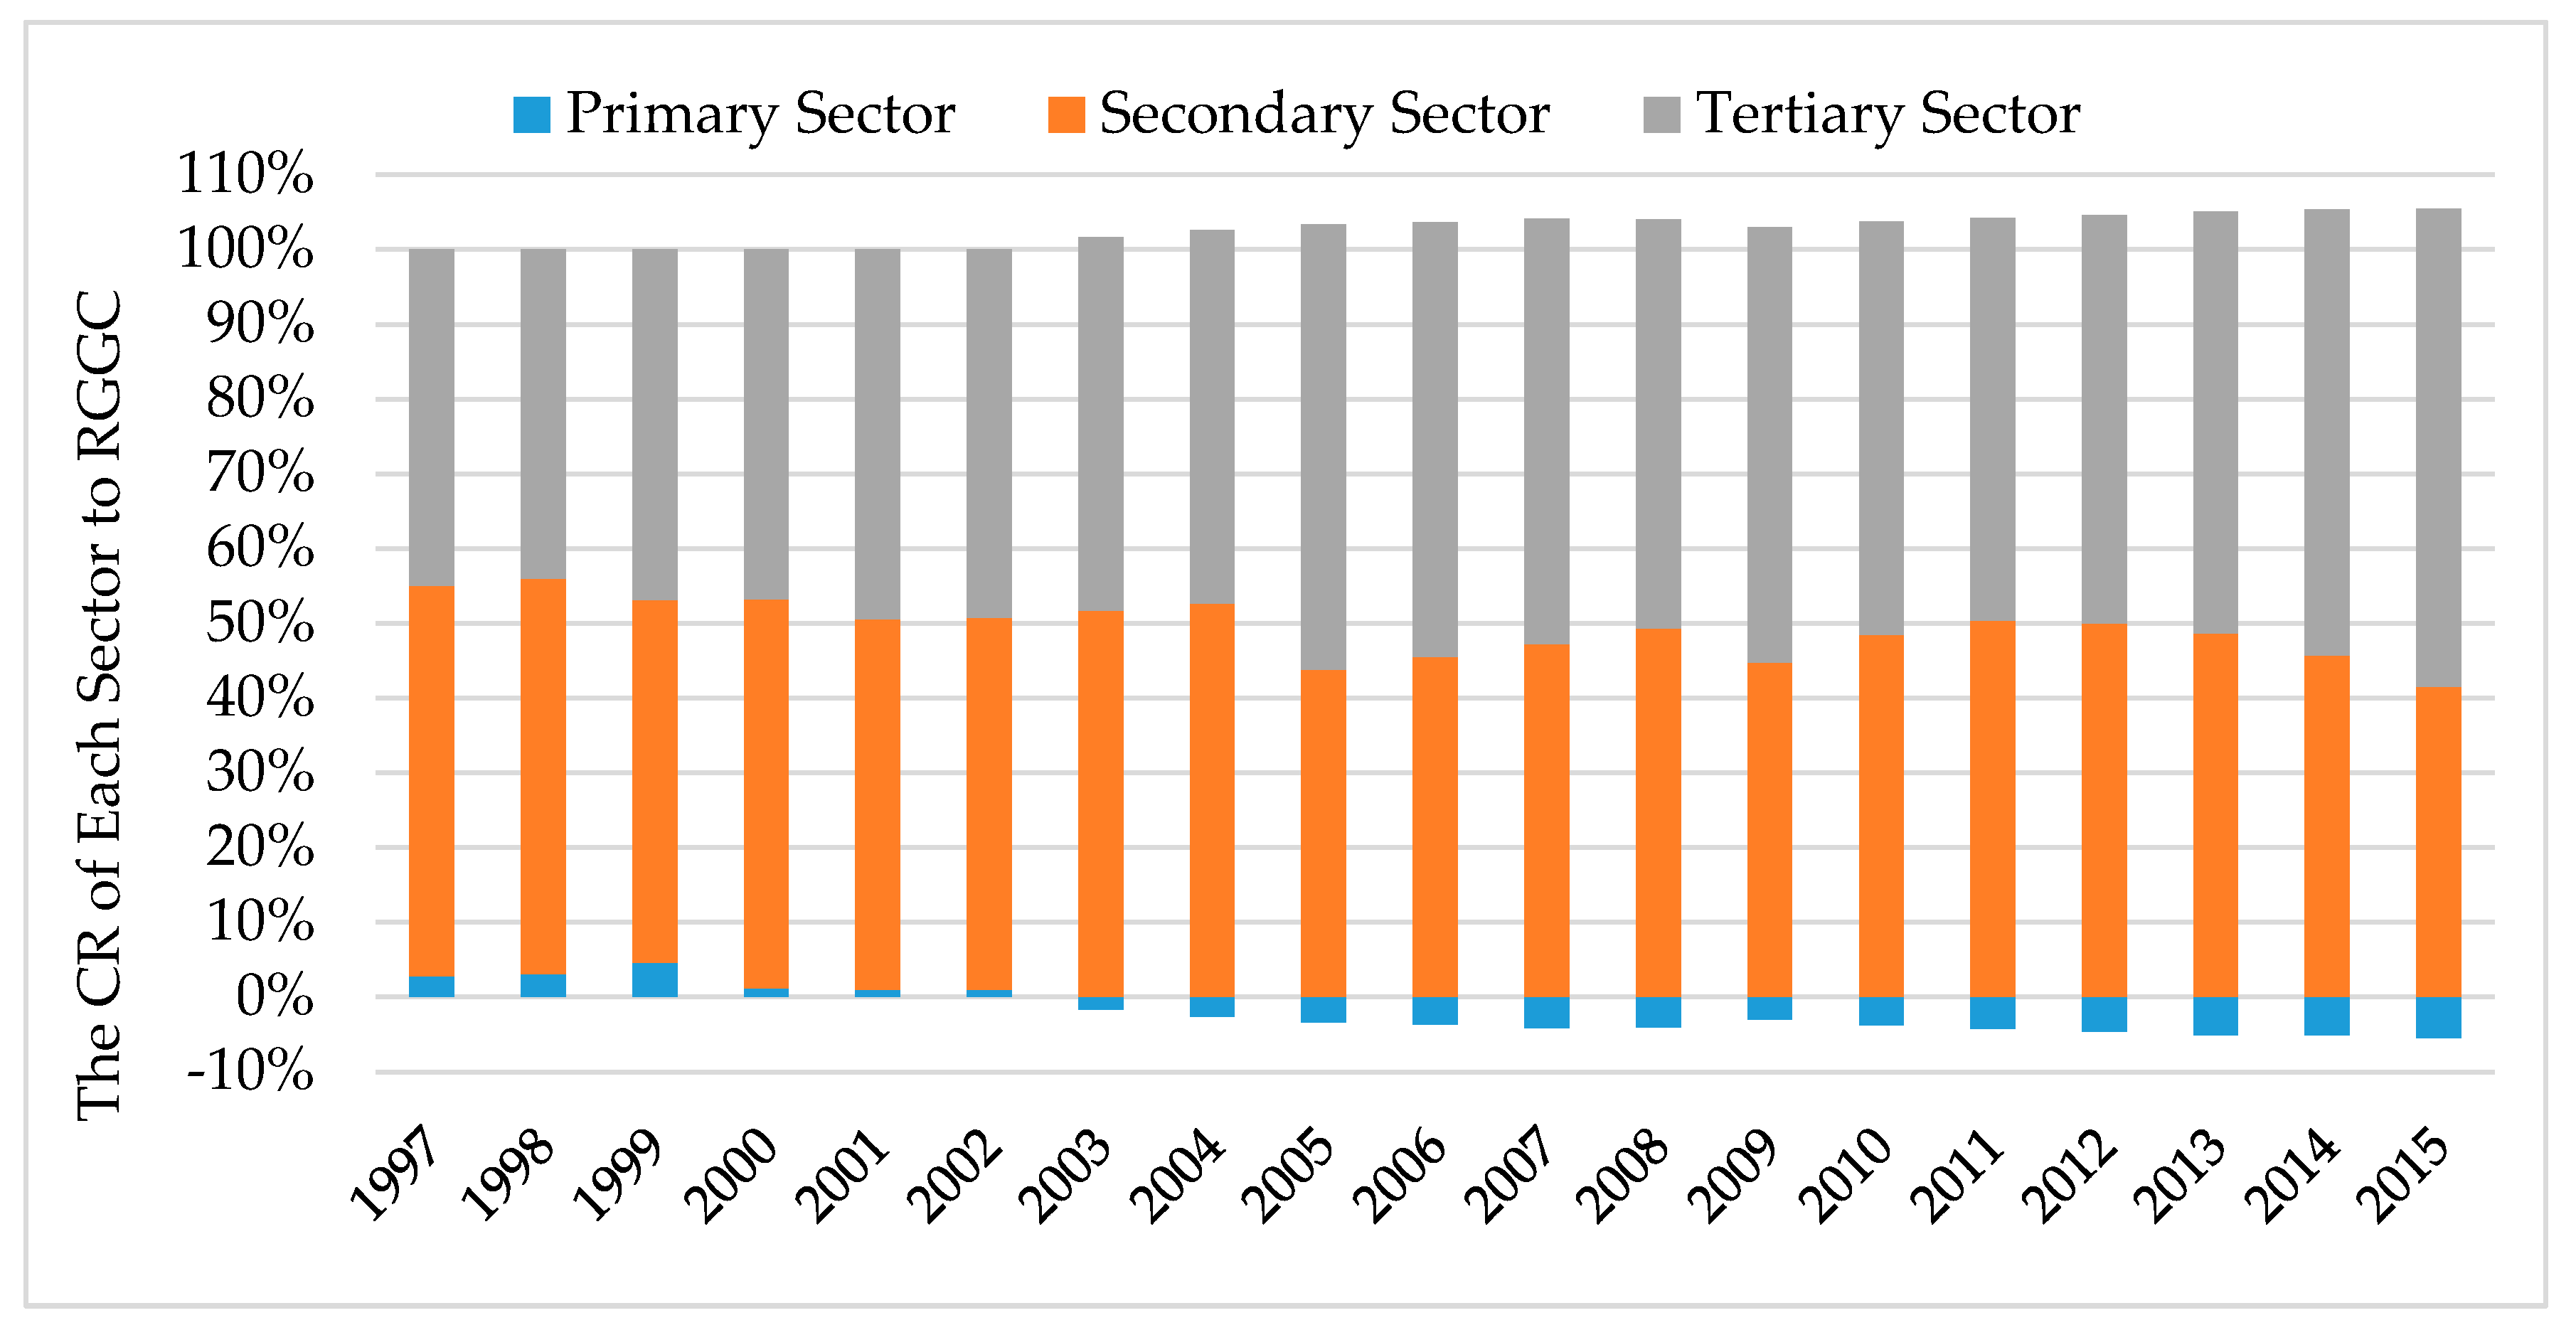
Figure 6.
Gini Coefficient of each internal area (1997–2015).


Table 1.
Gini Coefficient and the respective CR to RGGC in main urban and suburban areas (1997–2015).
Table 1.
Gini Coefficient and the respective CR to RGGC in main urban and suburban areas (1997–2015).
| Year | Main Urban Areas | Suburb Areas | Between Them | Residual Term | ||||
|---|---|---|---|---|---|---|---|---|
| G | CR | G | CR | G | CR | G | CR | |
| 1997 | 0.2345 | 4.62% | 0.2160 | 34.20% | 0.1977 | 60.29% | 0.0030 | 0.90% |
| 1998 | 0.2364 | 4.70% | 0.2128 | 32.86% | 0.2057 | 61.99% | 0.0015 | 0.45% |
| 1999 | 0.2355 | 4.67% | 0.2176 | 33.76% | 0.2028 | 61.20% | 0.0012 | 0.36% |
| 2000 | 0.2359 | 4.67% | 0.2178 | 33.12% | 0.2079 | 61.94% | 0.0009 | 0.27% |
| 2001 | 0.2419 | 4.83% | 0.2196 | 32.72% | 0.2112 | 62.24% | 0.0007 | 0.21% |
| 2002 | 0.2328 | 4.71% | 0.2198 | 32.78% | 0.2110 | 62.38% | 0.0005 | 0.13% |
| 2003 | 0.1762 | 5.39% | 0.2096 | 34.76% | 0.1695 | 59.47% | 0.0011 | 0.39% |
| 2004 | 0.1646 | 5.26% | 0.2057 | 34.88% | 0.1657 | 59.73% | 0.0004 | 0.13% |
| 2005 | 0.1941 | 6.32% | 0.1964 | 28.81% | 0.1947 | 64.63% | 0.0007 | 0.24% |
| 2006 | 0.1775 | 5.92% | 0.2015 | 28.70% | 0.1984 | 65.13% | 0.0007 | 0.24% |
| 2007 | 0.1680 | 5.81% | 0.1988 | 28.93% | 0.1929 | 64.86% | 0.0012 | 0.40% |
| 2008 | 0.1550 | 5.47% | 0.2026 | 29.90% | 0.1884 | 64.22% | 0.0012 | 0.41% |
| 2009 | 0.1477 | 5.06% | 0.2261 | 29.30% | 0.2088 | 65.18% | 0.0015 | 0.45% |
| 2010 | 0.1451 | 5.61% | 0.2254 | 30.83% | 0.1892 | 63.21% | 0.0011 | 0.36% |
| 2011 | 0.1286 | 5.26% | 0.2243 | 32.07% | 0.1784 | 62.26% | 0.0012 | 0.41% |
| 2012 | 0.1382 | 5.97% | 0.2109 | 31.14% | 0.1715 | 62.15% | 0.0020 | 0.73% |
| 2013 | 0.1293 | 5.86% | 0.1965 | 30.81% | 0.1638 | 62.57% | 0.0020 | 0.76% |
| 2014 | 0.1249 | 5.83% | 0.1895 | 30.85% | 0.1584 | 62.54% | 0.0020 | 0.78% |
| 2015 | 0.1444 | 6.97% | 0.1885 | 31.40% | 0.1499 | 60.57% | 0.0026 | 1.06% |
Table 2.
The Gini Coefficient and the respective CR to RGGC in Five Function Areas (1997–2015).
| Year | CMFA | EMFA | NDUA | NECA | SEPA | Between Them | Residual Term | |||||||
|---|---|---|---|---|---|---|---|---|---|---|---|---|---|---|
| G | CR | G | CR | G | CR | G | CR | G | CR | G | CR | G | CR | |
| 1997 | 0.1029 | 0.86% | 0.1874 | 0.41% | 0.0946 | 4.45% | 0.1334 | 2.41% | 0.1370 | 0.23% | 0.2936 | 89.51% | 0.0070 | 2.13% |
| 1998 | 0.0986 | 0.84% | 0.1135 | 0.24% | 0.0882 | 4.02% | 0.1208 | 2.12% | 0.1414 | 0.25% | 0.3010 | 90.69% | 0.0061 | 1.84% |
| 1999 | 0.1117 | 0.95% | 0.1013 | 0.22% | 0.0899 | 4.14% | 0.1274 | 2.21% | 0.1433 | 0.26% | 0.2995 | 90.37% | 0.0062 | 1.86% |
| 2000 | 0.1078 | 0.92% | 0.0973 | 0.20% | 0.0871 | 3.90% | 0.1412 | 2.44% | 0.1620 | 0.28% | 0.3036 | 90.44% | 0.0061 | 1.81% |
| 2001 | 0.1179 | 1.03% | 0.0886 | 0.18% | 0.0892 | 3.92% | 0.1461 | 2.47% | 0.1696 | 0.29% | 0.3064 | 90.28% | 0.0062 | 1.84% |
| 2002 | 0.1069 | 0.95% | 0.0754 | 0.16% | 0.0907 | 3.97% | 0.1473 | 2.50% | 0.1767 | 0.30% | 0.3054 | 90.30% | 0.0061 | 1.82% |
| 2003 | 0.1133 | 1.67% | 0.0507 | 0.14% | 0.0780 | 3.82% | 0.1394 | 2.61% | 0.1608 | 0.31% | 0.2554 | 89.58% | 0.0053 | 1.87% |
| 2004 | 0.1156 | 1.75% | 0.0371 | 0.11% | 0.0661 | 3.32% | 0.1416 | 2.69% | 0.1551 | 0.31% | 0.2499 | 90.09% | 0.0048 | 1.74% |
| 2005 | 0.1406 | 2.18% | 0.0830 | 0.25% | 0.0780 | 3.32% | 0.1468 | 2.48% | 0.1588 | 0.29% | 0.2700 | 89.61% | 0.0056 | 1.87% |
| 2006 | 0.1223 | 1.90% | 0.1011 | 0.33% | 0.0878 | 3.63% | 0.1522 | 2.49% | 0.1668 | 0.29% | 0.2721 | 89.33% | 0.0062 | 2.02% |
| 2007 | 0.1166 | 1.84% | 0.1241 | 0.44% | 0.0947 | 3.99% | 0.1573 | 2.65% | 0.1585 | 0.29% | 0.2625 | 88.24% | 0.0076 | 2.56% |
| 2008 | 0.1051 | 1.66% | 0.1124 | 0.42% | 0.1005 | 4.31% | 0.1752 | 2.99% | 0.1555 | 0.29% | 0.2565 | 87.42% | 0.0085 | 2.91% |
| 2009 | 0.0997 | 1.49% | 0.1414 | 0.55% | 0.1427 | 5.24% | 0.2270 | 3.54% | 0.1453 | 0.24% | 0.2666 | 83.23% | 0.0183 | 5.70% |
| 2010 | 0.1254 | 2.02% | 0.0587 | 0.28% | 0.1262 | 4.88% | 0.2346 | 3.85% | 0.1573 | 0.28% | 0.2482 | 82.90% | 0.0173 | 5.78% |
| 2011 | 0.1207 | 2.01% | 0.0684 | 0.36% | 0.1351 | 5.55% | 0.2259 | 3.83% | 0.1575 | 0.28% | 0.2353 | 82.13% | 0.0167 | 5.83% |
| 2012 | 0.1355 | 2.38% | 0.0798 | 0.45% | 0.1334 | 5.67% | 0.2098 | 3.66% | 0.1531 | 0.29% | 0.2245 | 81.34% | 0.0171 | 6.21% |
| 2013 | 0.1269 | 2.30% | 0.0848 | 0.52% | 0.1289 | 5.89% | 0.1958 | 3.58% | 0.1518 | 0.31% | 0.2127 | 81.25% | 0.0161 | 6.16% |
| 2014 | 0.1174 | 2.18% | 0.0853 | 0.54% | 0.1233 | 5.95% | 0.1911 | 3.57% | 0.1507 | 0.31% | 0.2071 | 81.76% | 0.0144 | 5.69% |
| 2015 | 0.1503 | 2.86% | 0.0824 | 0.55% | 0.1258 | 6.23% | 0.1856 | 3.54% | 0.1518 | 0.31% | 0.1988 | 80.32% | 0.0153 | 6.20% |
Table 3.
The causes and the corresponding CR to the change of RGGC from 1997 to 2015.
| Title | Economic Development | The Change of Shares of Population in Each County |
|---|---|---|
| ΔG | −0.0836 | 0.0031 |
| CR to ΔG | 103.85% | −3.85% |
© 2017 by the authors. Licensee MDPI, Basel, Switzerland. This article is an open access article distributed under the terms and conditions of the Creative Commons Attribution (CC BY) license (http://creativecommons.org/licenses/by/4.0/).
Share and Cite
MDPI and ACS Style
Ye, X.; Ma, L.; Ye, K.; Chen, J.; Xie, Q. Analysis of Regional Inequality from Sectoral Structure, Spatial Policy and Economic Development: A Case Study of Chongqing, China. Sustainability 2017, 9, 633. https://doi.org/10.3390/su9040633
AMA Style
Ye X, Ma L, Ye K, Chen J, Xie Q. Analysis of Regional Inequality from Sectoral Structure, Spatial Policy and Economic Development: A Case Study of Chongqing, China. Sustainability. 2017; 9(4):633. https://doi.org/10.3390/su9040633
Chicago/Turabian StyleYe, Xiaosu, Lie Ma, Kunhui Ye, Jiantao Chen, and Qiu Xie. 2017. "Analysis of Regional Inequality from Sectoral Structure, Spatial Policy and Economic Development: A Case Study of Chongqing, China" Sustainability 9, no. 4: 633. https://doi.org/10.3390/su9040633
Note that from the first issue of 2016, this journal uses article numbers instead of page numbers. See further details here.