
How Do Quality Practices Affect the Results?: The Experience of Thalassotherapy Centres in Spain


1
Financial Economy and Accounting Department, Faculty of Business, Finance and Tourism, University of Extremadura, 10071 Caceres, Spain
2
Business Organisation and Marketing Department, Faculty of Business Administration and Tourism, University of Vigo, 32004 Ourense, Spain
3
Financial Economics and Operation Management Department, Faculty of Business and Economics, Universidad de Sevilla, 41018 Seville, Spain
*
Author to whom correspondence should be addressed.
Sustainability 2017, 9(4), 671; https://doi.org/10.3390/su9040671
Submission received: 24 March 2017
/
Revised: 18 April 2017
/
Accepted: 18 April 2017
/
Published: 24 April 2017
(This article belongs to the Section Economic and Business Aspects of Sustainability)
Abstract
:Most thalassotherapy centres in Spain do not have any quality certification but they are carrying out several actions of quality management in an attempt to obtain better results. Consequently, the aim of this research is to study if the implementation of quality practices on thalassotherapy centres has the same impact on companies’ results as on the results of those companies that got the quality certifications. In addition, the relationships between different factors considered are going to be studied. Our sample is composed of Spanish thalassotherapy centres, and the statistical technique used is based on structural equation modelling, in particular partial least squares (PLS) regression. The data were provided by the answers given by 31 managers (70.45% of the selected sample) to a structured questionnaire based on previous research and statistically validated. The results of this research allow us to conclude that these kinds of organizations have implemented informal practices to improve the quality of the service in terms of leadership, personnel management, alliances, and resources and show that the practices that have been carried out by these centres to enhance the quality of the service have an impact on companies’ results. Managers of these kinds of establishments that want to improve customer results should focus their efforts on continuous improvement, whereas, if they are pursuing enhancement of other results, their efforts should be focused on process management.
1. Introduction
Research on the benefits obtained from implementing a quality management system has followed two differentiated approaches; on the one hand, researchers have tried to identify them [1,2], and, on the other hand, researchers have tried to analyse how quality management influences business results [3,4,5,6,7]. Although the results are heterogeneous on this last point, most research confirms that proper implementation of a quality management system can positively influence business performance [8,9].
Most of these studies have been conducted in the industrial sector [7,10] using the ISO 9001 standard (Quality management systems—Requirements) or one of the three models of excellence most recognized, such as the European Foundation for Quality Management (EFQM Model, Europe), the Malcolm Baldrige National Quality Award (MBNQA, USA), or the Deming Prize (JUSE, Japan) of the Union of Japanese Scientists and Engineers.
However, in recent years, some researchers have begun to analyse this relationship in the tourism sector [11,12,13,14,15], a sector in which quality cannot be managed in the same way as in the industrial sector [16]. This difference in management is derived from the differentiated characteristics of services as opposed to products, including intangibility, inseparability of production of consumption, the intensity of the labour force, and heterogeneity; hence the importance of the study of quality management in this sector and in particular of examining how quality practices influence business results in a sector whose main activity is the provision of services.
The relevance that the tourism industry has in Spain is undeniable [17,18]. Due to the growing importance of health tourism and wellness in the last years [19], the target population of the research is thalassotherapy centres in Spain.
According to The Global Spa and Wellness Summit (GSWS) [20], the global wellness economy was estimated at $3.4 trillion in 2013 (spa economy $94 billion and $277.1 billion, including the direct and indirect impact; wellness tourism $494 billion and $1.5 trillion; and thermal/minerals springs, which includes thalassotherapy spas, $50 billion). In the case of Spain, there are 2432 spas, providing employment for 45,381 people, which represent revenues (billion US$) of $2.51. In the Top Ten Spa Markets 2013, Spain occupies the ninth position. With respect to thermal/minerals springs, there are 165 establishments with revenues (billion US$) amounting to $672, and in the Top Twenty-five Thermal/Mineral Springs Markets 2013, it occupies the 10th position behind China, Japan, Germany, Russia, Italy, Austria, Turkey, Hungary, and the Czech Republic.
Additionally, the majority of thalassotherapy centres in Spain have not implemented formal quality systems (as ISO 9001 or Spanish Standard UNE 182001:2008) although they carried out several practices to enhance the quality of the service provided. Considering this, this research is key to covering a lack of research on quality, critical success factors, and results in environments that have not implemented formal quality systems, since most of the previous research is focused in organizations that have implemented these types of systems [14,21,22,23]. Consequently, the aim of this article is to analyse if the implementation of quality practices in thalassotherapy centres has the same impact on companies’ results as on the result of those companies that got the quality certifications. In addition, the relationships between the different factors considered are going to be studied.
To carry out our research, we are going to analyse the aim through the structural equation modelling technique, in particular partial least squares (PLS) regression, taking the exploratory nature of the research into account. The data were provided by the answers given by 31 managers of the Spanish thalassotherapy centres (70.45% of the selected sample) to a structured questionnaire based on previous research and statistically validated.
The layout of the manuscript is as follows. The background, the theoretical framework, and the hypotheses are presented in Section 2, while the methodology (sample, questionnaire, statistical method) is explained in Section 3. Later, the results are shown and discussed in Section 4, and, finally, the conclusions and limitations are highlighted.
2. Total Quality Management, Critical Success Factors, and Companies’ Results
With the aim to propose a theoretical structural model to study the causal relationships between the critical factors of quality and business performance, the objective of this research is based on the premise of EFQM: ‘the satisfaction of customers and employees and obtaining a positive impact on society are achieved through adequate leadership of managers in the process of transforming the organization, setting adequate policies and strategies, and through the correct use of resources and partnerships of all kinds, and good management of its processes, which leads to achieve the vision of the organization with excellent business results’ [24].
The EFQM Excellence Model in Europe also proposes that there is a relationship between the critical quality factors (facilitators) and business results but does not establish causal relationships.
There has been numerous researches conducted in this regard in the industrial sector [7,25,26] (among others), being more scarce in the service sector and more specifically in the tourist sector [3,4,5,13,27,28,29,30].
Taking into account the above, it is necessary to deepen and study the structure of relationships in a sub-sector such as the health tourism sector in which most companies have so far not implemented formal quality systems, even though they perform practices to improve the quality of their service. In this context, it would be important to know those critical factors on which managers of thalassotherapy centres should focus their efforts on in order to achieve improvements in each of the considered business results.
2.1. TQM and Critical Factors
There is no unanimity in the definition of the ‘Total Quality Management (TQM)’ concept, but after analysing the different definitions [31,32,33,34], consensus can be reached that it is a management approach aimed at efficiently managing a set of ‘critical factors’ that enable organizations to achieve better performance of the organization in the long-term [35,36,37,38], leading to obtaining an improvement in customer satisfaction and benefits to all members of the organization and society [39].
In practice, for the successful implementation of a quality management system, managers of establishments must operationalize and focus their efforts on the critical factors of TQM [31,36]. The Critical Success Factors (CSFs) are defined as ‘key areas of the organisation that when managed adequately, ensure improved competitiveness and business’ [40] (p. 811). Despite the great efforts carried out by several researchers [41,42,43,44,45,46], there is still a lack of a consensus about the key CSFs.
In addition to the CSFs identified by academic research, those provided by quality models (EFQM Model, MBNQA) should be considered since these models are companies’ references to achieve quality excellence and they are used by researchers to operationalize TQM [47,48,49].
Our research is based on the CSFs included in the EFQM Excellence Model in Europe. This model establishes which CSFs should be managed to achieve an improvement in companies’ performance [50,51,52]; leadership, employee management, alliances and resources, and process management. Even though process management is considered such a unidimensional concept by the EFQM model, according to Saraph et al. [40] it is better explained if two constructs are taken into account; process management and continuous improvement. Therefore, we are going to use these two constructs to test process management.
Leadership and management support is the most important factor for successful quality implementation [40,47,53,54,55] due to its influence on the rest of the critical factors [40,47,56]. In this sense, the leadership of top management is responsible for promoting the implementation of quality through the necessary organizational change [57]; it provides the vision-mission and values to achieve sustainable success and is responsible for establishing the right direction of resources and staff, achieving the commitment of its staff, and planning and managing its alliances and internal resources for the effective performance of its processes [58]. Taking into account the above, we propose the following hypotheses:
Hypothesis 1 (H1).
The leadership of top management has a positive and significant influence on personnel management.
Hypothesis 2 (H2).
The leadership of top management has a positive and significant influence on alliances and resources.
The causal relationship between personnel management and process management and continuous improvement is based on the idea that the management can manage its human resources, favouring the commitment of employees [36] so that they use their skills and knowledge (empowerment, learning, training, and teamwork) for the benefit of the company, which will positively influence process management [56,59], which is orientated towards satisfying customers and other interest groups and, in the process of continuous improvement, is present in all activities of the company. This leads us to propose the following hypotheses:
Hypothesis 3 (H3).
Personnel management has a positive and significant influence on process management.
Hypothesis 4 (H4).
Personnel management has a positive and significant influence on continuous improvement.
As companies manage external partnerships, their suppliers and internal resources are a very important aspect for achieving effective performance of their processes and continuous improvement [50]. In this sense, Osseo-Asare and Longbottom [60] state that management must manage this critical factor by focusing on optimizing resources and, on the other hand, proper management of suppliers, which enables companies to achieve greater efficiency in their processes [61] and therefore continuous improvement thereof [38]. These approaches lead us to propose the following hypotheses:
Hypothesis 5 (H5).
The management of alliances and resources has a positive and significant influence on process management.
Hypothesis 6 (H6).
The management of alliances and resources has a positive and significant influence on continuous improvement.
Hypothesis 7 (H7).
Process management has a positive and significant influence on continuous improvement.
2.2. TQM and Companies’ Results
There is a large amount of evidence in the literature that supports the relationship between the implementation of TQM and business performance. Not all empirical results in the tourism sector support this relationship [62,63,64,65,66,67].
However, most agree that the certification of quality processes can improve the results, including financial results [5] (p. 55). Specifically, the effect of these quality systems on performance can be explained in two complementary ways [62] (p. 35). On the one hand, establishing standardized processes within the company to carry out its activity leads to improved efficiency, productivity, and cost reduction and therefore to improving business results. On the other hand, company performance also improves when customer satisfaction is higher (higher demand, increased sales, and market share) and due to an improved corporate image [68].
Most researchers have tried to classify different business results by grouping results according to various criteria [69,70,71,72,73]. The EFQM Excellence Model in Europe divides business results into: (1) customer results (‘excellent organizations that measure and achieve commendable results with regard to their customers’); (2) employee results (‘excellent organizations that measure and achieve commendable results with regard to their employees’); (3) society results (‘excellent organizations that measure and achieve commendable results with regard to society’); and (4) key results (‘excellent organizations that measure and achieve commendable results with regard to key elements of their policies and strategies’) [74] (p. 7, adapted from the EFQM [24]).
According to the premise of the EFQM model, Black and Crumley [75] claim that it is intended to guide the establishment of systematic activities within the company that will lead to improved results. The first studies that approach the issue of the relationship between the concepts of TQM collected in the EFQM model and the results obtained determine that the results obtained are derived from the management of the criteria contained therein [47,50,51,52,74,76,77]. The results of these studies are also corroborated in the framework of the MBNQA model [49,56,78,79]. According to Bou-Llusar et al. [74] (p. 8), ‘there is consensus regarding the positive influence of the application of the system on the results’.
Thus, numerous studies find evidence of the relationship between process management and employee results [50,80,81,82,83], organizational results [59,84], and employee and customer results [47,50]. According to EFQM model, the critical factor ‘process management’ is the link between the rest of the CSFs considered in the model and business results. Therefore, the following hypotheses are proposed:
Hypothesis 8 (H8).
Process management has a positive and significant influence on customer results.
Hypothesis 9 (H9).
Process management has a positive and significant influence on employee results.
Hypothesis 10 (H10).
Process management has a positive and significant influence on society results.
Hypothesis 11 (H11).
Process management has a positive and significant influence on key results.
Hypothesis 12 (H12).
Continuous improvement has a positive and significant influence on customer results.
Hypothesis 13 (H13).
Continuous improvement has a positive and significant influence on employee results.
Hypothesis 14 (H14).
Continuous improvement has a positive and significant influence on society results.
Hypothesis 15 (H15).
Continuous improvement has a positive and significant influence on key results.
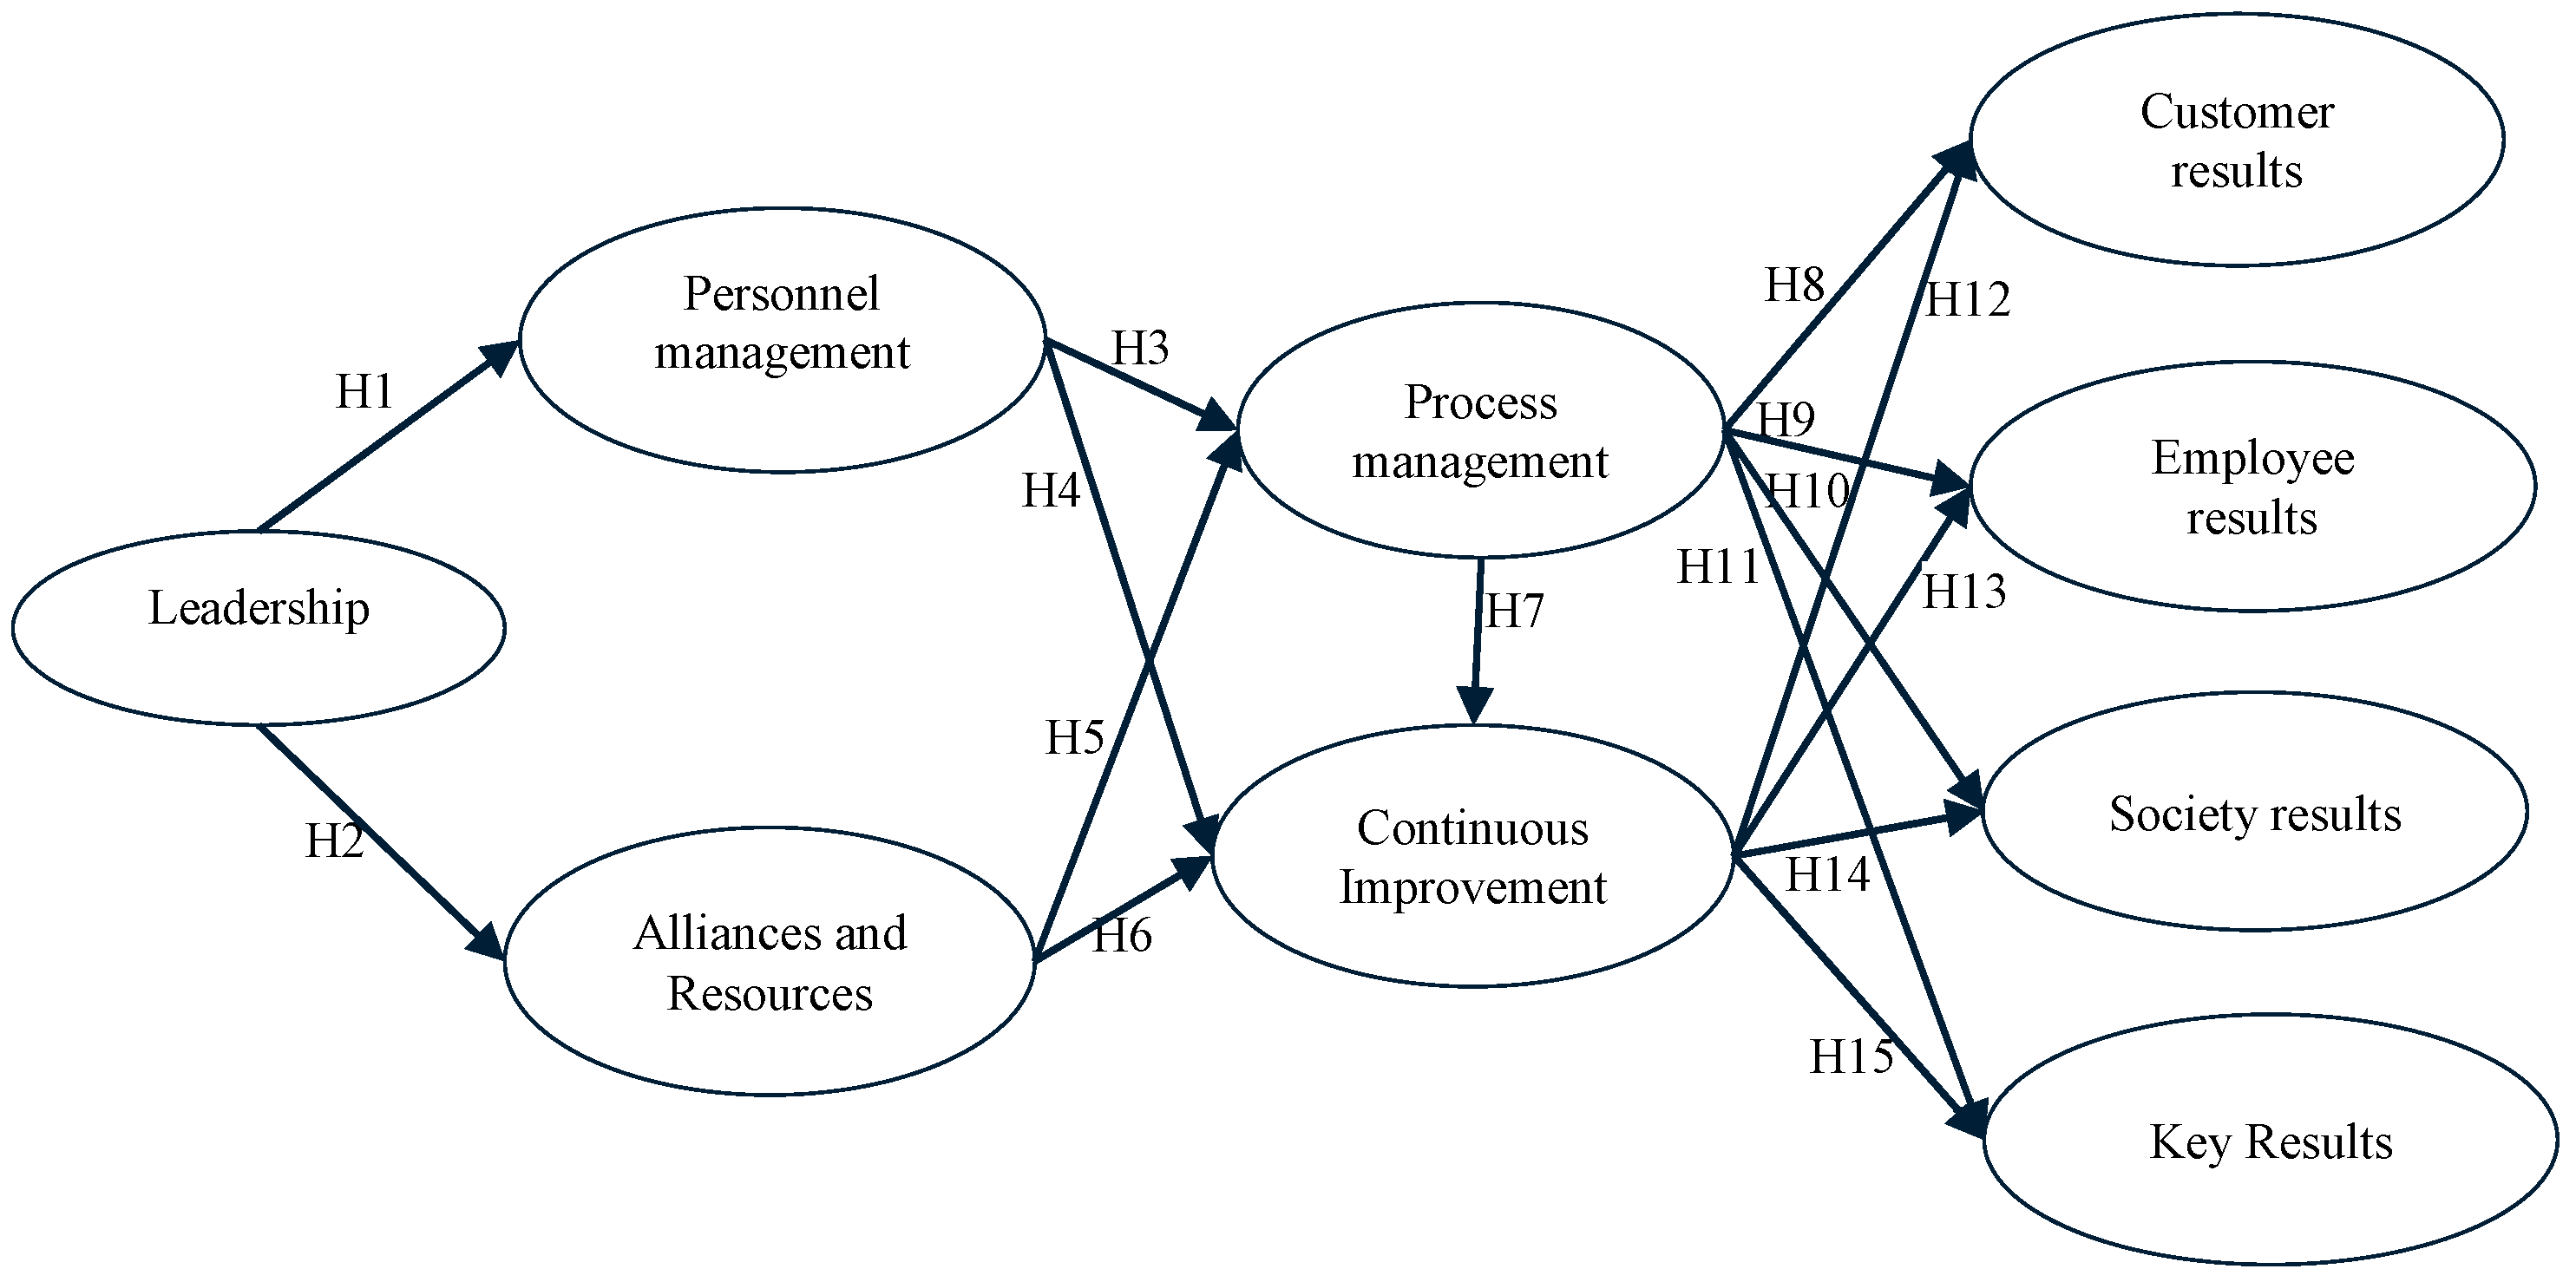
Figure 1 shows the structural model proposed in which the proposed causal relationships are observed. The aim of the model is to observe how critical quality factors taken into account influence business results.
3. Methodology
3.1. Sample and Data
The study was conducted in 44 thalassotherapy centres in Spain, which are facilities where a ‘therapeutic procedure which is under medical supervision and through the use of seawater (and marine products) heated around to 34 Celsius degrees and in a marine environment’ [85] (p. 136) is provided. The process of data collection was through a questionnaire sent by mail obtaining a response rate of 70.45% (31 valid surveys), representing a sampling error of ±9.76% for a confidence level of 95% (Z = 1.96; p = q = 0.5). It was requested that the questionnaire be completed by the quality manager or manager of the thalassotherapy centre.
Regarding the profile of the sample, if we consider the size, 14 centres have zero to nine workers, 15 centres 10 to 49 workers, and two centres 50 to 250 workers. Taking into account the associated accommodation variable, 27 centres have associated accommodation (87.1%) and four centres do not have associated accommodation (12.9%). Those that do have accommodation are three star accommodations, 17 are four star accommodation, and seven are five star accommodation. Finally, 24 centres are not certified in quality (which accounts for 77.42%) and seven are certified in the system of quality assurance UNE-EN ISO 9001:2015 standard [86], and four of them also have the environmental certification UNE-EN ISO 14001:2015 standard [87].
3.2. Questionnaire and Reliability of the Measurement Scales
Data were obtained through a structured survey. The questionnaire was designed, taking into account previous work such as Saraph et al. [40], Black and Porter [88], Powell [35], Grandzol and Gershon [89], and the EFQM Model [90]. The use of items used in other work fulfills the requirement of internal validity, which indicates the degree to which the measurement process is free of systematic error and random error.
Thus, the questionnaire (Appendix A) to measure each of the critical factors was constituted by 10 items to measure leadership, nine for alliances and resources, 11 for personnel management, seen for process management, and eight for continuous improvement. The respondent replied taking into account a seven point Likert scale ranging from 1 (not implemented) to 7 (100% implemented). All the items could be seen in the Appendix A. Due to the length of the name of variables and items, we will use an abbreviation for each of them (see in Appendix A). To measure the results, 30 items were used, grouped into customer results (7), employee results (9), society results (8), and key results (6). The scale used is 1 for strongly disagree to 7 for strongly agree.
Before studying the reliability and validity of the measurement scales, an exploratory as well as a confirmatory (strategy of rival models and second-order model) factorial analyses were performed with the aim of testing that the process management concept is better measured if the two constructs highlighted by Saraph et al. [40] are considered. The results of these two analyses confirm the suitability of using the two constructs instead of only one.
With regard to the reliability of the measurement scales, in the first place, it was evaluated whether the proposed scales measure each of the critical factors in a consistent and stable manner and if they are free of systematic and random errors [91] (p. 367). To achieve this, an analysis of item-total correlation was performed and the items PEM11, CI1, and CR7 were removed because they had values lower than the minimum recommended values of 0.3 [92], which allowed improvement to Cronbach’s alpha. After debugging the scales, the Cronbach’s alpha coefficient reached higher values than 0.7, which is the minimum required [93].
To confirm the one-dimensionality of the scales, an exploratory factor analysis (a principal component of Varimax Rotation) was performed, which identifies the underlying dimensions in each of the constructs, thus being the last step to corroborate the reliability of the scales. Its application did not involve the removal of any items. In all cases, the factor loadings are greater than 0.5, not considering factor loadings less than 0.3 as significant [94]. In all the scales, the accumulated percentage of explained variance is above 50%.
Therefore, taking into account the results, we can say that the proposed scales are highly reliable, thus being free of random errors and able to provide consistent results, and all the measurement scales are one-dimensional. Table 1 shows the results of the descriptive analysis.
Finally, the matrix of correlations between the critical factors and results (Table 2) was analysed. It is observed that there is correlation in all cases. However, it is not significant in the relationship between leadership, key results, and society results. Thus, it is shown that the way of managing the critical factors is related to and can positively influence the results that the company obtains, except for the non-significant relationships that we have observed.
3.3. Method
In order to achieve this objective, we will test our hypotheses through Structural Equation Models (SEM), since this is one of the most used statistical techniques to evaluate models based on variables (called constructs) that are not observable and require several indicators to be able to build them. They are multivariate techniques that combine aspects of multiple regression and factor analysis to estimate a series of interrelated dependency relationships simultaneously.
The main contribution of the SEM is that they evaluate within a single analysis the measurement model (how each of the latent variables are constructed; through which indicators) and the structural model (the causal relationships between the variables involved and the explained variance of the dependent variables; coefficient R2). These models, as opposed to traditional techniques also allow for modelling the error of measurement, incorporating constructs that cannot be observed, modelling relationships between multiple predictor variables and criteria, and, finally, allow you to combine and confront hypotheses with empirical data.
According to Roldán and Sánchez-Franco [95], this SEM analysis can be performed by two statistical techniques; those based on the covariance (Linear Structural Relationships—LISREL—statistical software for structural equation modeling that includes statistical methods for complex survey data, AMOS—statistical software which is specially used for Structural Equation Modelling, path analysis, and confirmatory factor analysis) and those based on the variance (Partial Least Squares—PLS). Both analyses differ in the analysis objective, the statistical assumptions on which they are based, and the nature of the adjustment statistics provided. While the covariance based on SEM intends to test a solid theory, those based on the variance are more predictive, and their use is recommended for theoretical developments, although they can also be used to contrast an already established approach [96].
Since the theoretical model that will be tested introduces some variations on the model that is generally used in TQM, we have chosen to use SEM based on the variance (PLS) as it allows us to test these new relationships within the model while allowing us to contrast them. The importance of this technique is growing in the business management field [97,98].
Another advantage of PLS is that it can also estimate models in which the samples are small [99], as in our case. Finally, PLS is also more appropriate when dealing with new or significantly changing phenomena [100], such as quality in thalassotherapy centres; when the model is very complex, i.e., when the number of indicators and latent variables is very high [96]; or when the variables do not follow normal distribution because the logarithm used by PLS does not need it.
To properly evaluate this PLS model, we must evaluate as discussed above, the measurement model (if the theoretical concepts are measured correctly through the observed variables), and the structural model (which evaluates the magnitude and significance of the relationships between different variables). Both the measurement and structural models were tested using SmartPLS software.
4. Results
The results of the model are reported above.
4.1. Measurement Model
First of all, for the evaluation of the measurement model, in which we will use reflective indicators as indicated by the TQM Theory, we consider: (1) individual reliability of the items (the minimum factorial load recommended is 0.707 [101]; all those items that do not meet this requirement must be removed from the measurement model); (2) the reliability of each construct (to measure the internal consistency of the constructs is measured through Cronbach α, which must be greater than 0.7 [93]); (3) the convergent validity (measured through the Average Variance Extracted (AVE), and it is necessary for it to be at least 0.5 for each variable as in Fornell and Larcker [102]); and (4) the discriminant validity (which indicates to what extent the constructs are different to each other; the correlations between constructs are lower than the square root of the AVE of each construct). Table 3 shows the factor loadings of each of the items to their constructs. As you can see, some items had to be removed (AR4, PEM1, PEM3, PEM4, PEM6, PEM7, PM5, PM6, L5, L7, L8, CI2, KR1, KR2, CR3, ER1, ER2, ER9, SR1, SR2) because they did not meet the requirements (factor loading > 0.707).
In Table 4, the results of the other requirements of the reflective constructs are shown: construct reliability (Cronbach α > 0.7, although it is recommended to be higher than 0.8), convergent validity (AVE > 0.5), and discriminant validity (square root of AVE higher than all the bivariate correlations with the other constructs). All the constructs considered in the analysis comply with all the requirements so that the measurement model was positively evaluated.
4.2. Structural Model
Once the measurement model is valid, we evaluate the structural model (Table 5). For its evaluation, the goodness of the model is determined by the significance and strength of the path coefficients. The significance is obtained by the bootstrap resampling technique in our case we used 5000 subsamples [103,104]. All the hypotheses have an expected sign, and the significance of the path coefficient is determined by a one-tailed t-student distribution. The R2 value is used as an indicator of the overall predictive strength of the model. The R2 value of continuous improvement is 0.676, which indicates that the exogenous variables of the constructs explain approximately 67.6% of the variance of this construct. Regarding the results, the construct has shown a lower R2 coefficient for society results (0.4529), while the construct ‘customer results’ is the one that has been better explained by the other variables used (0.6156).
This study provides empirical evidence that the leadership of management has a positive and significant influence on alliances and resources and personnel managemen; hypothesis H1 and H2 are confirmed. These results are corroborated in studies by Calvo-Mora and Criado [61], Gómez, Martínez-Costa and Martínez-Lorente [105] for H1 and in Flynn et al. [53], Black and Porter [88], Samson and Terziovski [106], Moon et al. [107], Savic et al. [108] in the case of hypothesis H2. Continuous support and commitment from management are essential in the context studied, as would be expected by the results of numerous studies.
In addition, alliances and resources has a positive and statistically significant influence on process management (H5) and continuous improvement (H6). The relationship with process management and continuous improvement is consistent with the results obtained in studies by Eskildsen and Dahlgaard [50], Calvo-Mora et al. [52], and He et al. [109]. On the other hand, personnel management shows a statistically significant effect on processes management (H3), which is corroborated by Eskilsen and Dahlgaard [50], Calvo de Mora et al. [52], Chinda and Mohamed [110] and Tarí et al. [23], thereby losing the relationship with continuous improvement (H4) as it does not show a significant Path coefficient (−0.0618), as in the study by Tarí et al. [23].
With regard to the relationship of process management with business results, the relationship with employee results (H9) is confirmed, which is consistent with studies by Eskilsen and Dahlgaard [50], Bou-Llusar et al. [51], Tutuncu and Kucukusta [111], Tarí et al. [23], Gómez-Gómez et al. [105], and Alsarayreh and Khudair [112]. The relationship with society results (H10) and key results (H11) is also corroborated, as in studies by Flynn et al. [113], Ahire and Dreyfus [114], Bou-Llusar et al. [51], and Tarí et al. [23]. However, the initial hypothesis H8, which proposes the existence of the relationship of process management with customer results is not corroborated, as in a study by Ooi et al. [115] and opposed to the study by Kumar et al. [116], as it does not show a significant Path coefficient (−0.0047).
In relation to the hypotheses proposed that reflect the causal relationship of continuous improvement with the results, the Path coefficient obtained did not confirm the initial H13, H14 and H15 hypotheses, which proposed the significant and positive relationship of continuous improvement with employees, society and key results due to the lack of significance of the Path coefficients (0.0253, −0.1625, and 0.0927). These results are consistent with those obtained by Rungtusanatham et al. [117] and Rahman and Bullock [118] in the case of H13 and opposite to the results obtained by Flynn et al. [113] and Ahire and Dreyfus [114] in the case of H14 and H15. In this case, the only hypothesis that is confirmed is the positive and significant relationship of continuous improvement with customer results (0.7884).
Finally, the results obtained suggest that continuous improvement has a positive direct effect on customer results and that process management has a positive direct effect on employee, society, and key results. The R2 obtained for each of the constructs shows a high degree of explanation of each of the variables in the model.
5. Conclusions
Although most thalassotherapy centres in Spain have not implemented or certified a quality management system according to UNE-EN-ISO 9001, this fact does not imply that they do not follow a quality management approach. The results of this research allow us to conclude that these kinds of organizations have implemented informal practices to improve the quality of the service in terms of leadership, personnel management, process management, continuous improvement, and alliances and resources.
Considering that the aim of the paper is to determine if the implementation of practices to improve the quality allow the achievement of better results (in customers, employees, society, or those considered factors “key”) in thalassotherapy centres, we could state that the practices that have been carried out by these centres to enhance the quality of the service have been successful since the different results considered are increased due to the implementation of these kinds of practices.
Particularly, the structural model proposed validates empirically that the management of the quality critical factors have a positive influence (both direct and indirect) on companies’ results. It also enables us to observe how each of the critical factors influences different results, which is the main contribution of this research.
From the results, we can deduce that leadership in thalassotherapy centres has a higher impact on personnel management than on alliances and resources and, that personnel management has no direct effect on the continuous improvement; it acts on it through the management of the processes. Both process management and continuous improvement are well explained by the critical factors considered.
Thus, managers of thalassotherapy centres that wish to improve their customer results, including improving customer satisfaction, should focus their efforts on the implementation of the practices considered in the critical factor continuous improvement. The practices included in this critical factor are those aimed at favouring, on the one hand, increasing customer satisfaction and, secondly, at improving the information obtained from them. In this sense, the practices to be implemented should focus on making improvements in services, based on the information obtained from customers to adapt to current and future customer needs; identifying areas for improvement; increasing personal contacts with customers in order to obtain direct information to adapt to their needs; detecting possible deviations of the service; and using of customer requirements to design services; etc.
All these activities included in the critical factor ‘continuous improvement’ are aimed at achieving customer satisfaction, with management support being essential for the effective implementation of this critical factor. In this regard, leaders (establishment managers) should promote the culture of continuous improvement among their employees (training and awareness) and plan and manage their external alliances so that they favour the effective performance of their processes. In addition, the results show that standardization and processes management is necessary but not sufficient to achieve adequate levels of customer results and to maintain this over time.
On the contrary, if they want to improve their employee, society, and key results, they should focus their efforts on process management, which involves its design, systematic review, and standardization. In order to achieve all that, leadership that promotes quality culture among its employees, ensuring the development, implementation, and continuous improvement of the management system, is required. In addition, managers, as well as standardizing their processes, should also carry out a comprehensive performance control to establish preventive and corrective measures.
As a first step, it is recommended that managers of thalassotherapy centres set a strategic objective for the implementation of a quality management system to improve their business results, whether they are performance results, at the customer level, or the economic-financial level. The implementation and certification of their quality management system will allow for ‘the definition of a series of standardized and well documented procedures detailing the coordination of a set of resources and activities to ensure the quality of processes and the development of a product to meet customer requirements’ [16] (p. 211). On the other hand, it will allow them to gain a competitive advantage over their competitors, resulting in an improved image of the products or services by providing greater confidence to customers when having certified a quality management system.
There are several limitations that we can mention. The first one is derived from the specific characteristics of the sector analysed, so the findings cannot be extrapolated to other sectors or countries with no previous studies. Secondly, the respondents are managers or quality managers, which involves the risk of receiving biased answers, so it would be interesting in future research to consider the perception of other staff members and also of customers of thalassotherapy centres and to check if there are similarities. A third limitation is related to the cross section thereof, since this research was conducted at a precise moment in time.
It could be interesting to conduct this research again in few years and see if the implementation of formal quality management systems changes the relationships found before they have officially been implemented. As the final sample size is not so large that we could not make a multi-group analysis in order to identify if there are statistical differences between the thalassotherapy centres. Future research on this field could enlarge the sample size (i.e., including more countries in the analysis), so that comparisons between the centres could be carried out.
Author Contributions
All authors contributed equally to this work. All authors wrote, reviewed, and commented on the manuscript. All authors have read and approved the final manuscript.
Conflicts of Interest
The authors declare no conflict of interest.
Appendix A

Table A1.
Validated questionnaire.
| L—Leadership |
| L1—Personal commitment of the management in the formulation and communication of the mission, vision, and values of the company can clearly be seen
L2—The management team of our company encourages change and the implementation of a culture of trust, involvement, and support aimed at achieving the best practice L3—The management team actively communicates to its employees its commitment to the process of providing quality service to its customers L4—Employees are encouraged to help implement changes in the organization L5—The management team allows employees to make their own decisions L6—The management team motivates its employees and helps them to fulfil their work at a high level L7—The management appreciates the efforts and improvements made by the staff L8—The management maintains contacts with customers, suppliers, and other external agents and is involved with them in the promotion and participation of alliances and improvement actions L9—The changes that should be carried out for improvement are identified and boosted by the management, and their effectiveness is reviewed once implemented L10—Continuous improvement is pursued proactively (in advance) before having to react to conflict or crisis |
| AR—Alliances and Resources |
| AR1—There is a close working relationship with suppliers
AR2—We strive to establish long-term relationships with suppliers AR3—The suppliers are provided with the necessary requirements (quality) of the goods or services AR4—The management encourages the use of a few suppliers, with quality rather than price as the first selection criterion AR5—Suppliers are actively involved in our development of new products and/or services AR6—A management plan for buildings, equipment, and other materials is formulated (form of use, maintenance, insurance, renovations, etc.) to improve the overall performance of the organization AR7—Economic and financial resources are assigned and used adequately so as to ensure the success of the strategy AR8—All important information and the knowledge generated is collected and managed, such information being reliable and easy to use by the relevant personnel AR9—In general, management of alliances and resources is carried out according to the strategy |
| PEM—Personnel Management |
| PEM1—Management of human resources in line with the strategy and/or business plans is performed
PEM2—Employees are trained in problem-solving skills PEM3—Employees are trained in teamwork PEM4—Experience and training of people is adjusted to current and future needs, or specific training plans are developed PEM5—People are encouraged and supported to take responsibility and make decisions without risk for the organization and to be involved in improvement activities, teamwork, etc. PEM6—There is a transparent system to reward staff achievements and improvements, as well as a social benefits system (pension plan, kindergarten, etc.) PEM7—Employee performance is measured and recognized in order to motivate them and improve their work performance PEM8—Communication between all personnel is ascending, descending, and horizontal so that employees are considered to be well-informed and their opinions are valued PEM9—Staff satisfaction is measured formally and regularly PEM10—Improvements in human resource management are introduced by using staff satisfaction surveys, regular meetings with employees, performance analysis, etc. PEM11—Safety and/or health practices policies are well established |
| PM—Process Management |
| PM1—Control and continuous improvement of key processes
PM2—Prevention of defective services is a strong attitude in this organization PM3—The processes used in this organization include measures to ensure that development of services is consistent with the previous design and subsequent execution (quality measures) PM4—Employees involved in different processes know how to evaluate them PM5—New services in an attempt to access other markets are developed to anticipate the needs of today’s market or try to be better than the main competitors PM6—The development of products/services in line with previous designs and later developments is guaranteed PM7—The process design minimizes employee errors |
| CI—Continuous Improvement |
| CI1—Service improvements as a result of customer satisfaction surveys, complaints and claims, etc. are introduced.
CI2—A program to find losses of time and costs in all processes is implemented CI3—Market research is conducted to understand current and future customer needs, and, as a result, improvements in its products, services, and processes are introduced CI4—Areas for improvement are identified CI5—Information is managed to support quality improvement (analysis of business information, cost, and financial aspects to support the development of priorities for improvement) CI6—Increase in direct personal contacts of the organization with customers CI7—Use of customer requirements as the basis for quality Managers and supervisors support activities that improve customer satisfaction |
| CR—Customer Results |
| CR1—The company is concerned about collecting information from its customers to measure their satisfaction through surveys, complaints, etc.
CR2—Customer satisfaction shows improvement over time CR3—It has a mechanism to hear and resolve customer complaints CR4—Objectives in this context are established, and the customer results achieved meet the objectives CR5—The causes of these customer results are analysed and improvement plans or actions are implemented CR6—All these customer results cover the most relevant areas of the organization CR7—These customer results are compared with those of the main competitors being such comparative favourable or otherwise learning from them |
| ER—Employee Results |
| ER1—The company collects relevant information to measure employee satisfaction (surveys, meetings, motivation, training, promotion, etc.)
ER2—Other indirect indicators of satisfaction like the level of absenteeism, complaints, involvement in improvement programs, staff turnover, etc. are evaluated ER3—Employee satisfaction shows improvement over time ER4—Absenteeism is low ER5—Staff rotation is low ER6—Objectives in this context are established and the results achieved meet the objectives set by the organization ER7—The causes of these results in people are analysed and plans or actions for improvement are implemented ER8—These employee results cover the most relevant areas of the organization ER9—These employee results are compared with those of the main competitors being such comparative favourable or otherwise learning from them |
| SR—Society Results |
| SR1—Policies to reduce and prevent risks to health and safety are developed
SR2—Environmental protection policies are developed SR3—The company participates in many community activities SR4—The feeling the community has is evaluated through surveys, meetings authorities, etc. SR5—The results in society show improvements over time SR6—Objectives in this context are established, and the results achieved meet the objectives set by the organization SR7—The causes of these results in society are analysed and plans or actions for improvement are implemented SR8—These results in society are compared with the company's main competitors, being comparative, favourable, or otherwise learning from them |
| KR—Key Results |
| KR1—Our financial results have been excellent
KR2—The trends of all key results in the last three years are analysed and show improvement or a high score maintained over time KR3—Both economic and non-economic key results are evaluated, as well as financial and non-financial KR4—Objectives in this context are established, and these are met by the key results achieved KR5—The causes of these key results are analysed and plans or actions for improvement are implemented KR6—All these key results cover the most relevant areas of the organization |
References
- Brecka, J. Study finds gains with ISO 9000 registration increase over time. Qual. Prog. 1994, May, 18–20. [Google Scholar]
- Brown, A.; Van der Wiele, A. Survey on Australian self-assessment. Qual. Mag. 1995, 5, 18–24. [Google Scholar]
- Mak, B.L.M. ISO certification in the tour operator sector. Int. J. Contemp. Hosp. Manag. 2011, 23, 115–130. [Google Scholar] [CrossRef]
- Sheehan, L.; Presenza, A. The organizational impacts of quality management in tourism firms: An empirical investigation of the Molise Region, Italy. Tourism 2011, 59, 427–446. [Google Scholar]
- Tarí-Guilló, J.J.; Pereira-Moliner, J. Calidad y rentabilidad. Análisis del certificado Q en las cadenas hoteleras. Univ. Bus. Rev. 2012, 34, 52–67. [Google Scholar]
- Psomas, E.L.; Pantouvakis, A.; Kafetzopoulos, D.P. The impact of ISO 9001 effectiveness on the performance of service companies. Manag. Serv. Qual. Int. J. 2013, 23, 149–164. [Google Scholar] [CrossRef]
- Chatzoglou, P.; Chatzoudes, D.; Kipraios, N. The impact of ISO 9000 certification on firms’ financial performance. Int. J. Oper. Prod. Manag. 2015, 35, 145–174. [Google Scholar] [CrossRef]
- Wayhan, V.B.; Kirche, E.T.; Khumawala, B.M. ISO 9000 certification: The financial performance implications. Total Qual. Manag. 2002, 13, 217–231. [Google Scholar] [CrossRef]
- Chow-Chua, C.; Goh, M.; Wan, T.B. Does ISO 9000 certification improve business performance? Int. J. Qual. Reliab. Manag. 2003, 20, 936–953. [Google Scholar] [CrossRef]
- Häversjö, T. The financial effects of ISO 9000 registration for Danish companies. Manag. Audit. J. 2000, 15, 47–52. [Google Scholar] [CrossRef]
- Wilkins, H.; Merrilees, B.; Herington, C. Towards an understanding of total service quality in hotels. Int. J. Hosp. Manag. 2007, 26, 840–853. [Google Scholar] [CrossRef]
- Tarí, J.; Claver-Cortes, E.; Pereira-Moliner, J.; Molina, J. Is it worthwhile to be a quality certified hotel? Evidence from Spain. Int. J. Qual. Reliab. Manag. 2009, 26, 850–864. [Google Scholar] [CrossRef]
- Casadesús, M.; Marimón, F.; Alonso, M. The future of standardised quality management in tourism: Evidence from the Spanish tourist sector. Serv. Ind. J. 2010, 30, 2457–2474. [Google Scholar] [CrossRef]
- Tarí, J.J.; Claver-Cortés, E.; Pereira-Moliner, J.; Molina-Azorín, J.F. Levels of quality and environmental management in the hotel industry: Their joint influence on firm performance. Int. J. Hosp. Manag. 2010, 29, 500–510. [Google Scholar] [CrossRef]
- Pereira-Moliner, J.; Claver-Cortés, E.; Molina-Azorín, J.F.; Tarí, J. Quality management, environmental management and firm performance: Direct and mediating effects in the hotel industry. J. Clean. Prod. 2012, 37, 82–92. [Google Scholar] [CrossRef]
- Camisón, C.; Cruz, S.; González, T. Gestión de la Calidad: Conceptos, Enfoques y Sistemas; Pearson—Prentice Hall: Madird, Spain, 2006. [Google Scholar]
- Cunado, J.; Gil-Alana, L.A.; De Gracia, F.P. Modelling monthly Spanish tourism: A seasonal fractionally integrated approach. Tour. Econ. 2004, 10, 79–94. [Google Scholar] [CrossRef]
- García-Sánchez, A.; Fernández-Rubio, E.; Collado, M.D. Daily expenses of foreign tourists, length of stay and activities: Evidence from Spain. Tour. Econ. 2013, 19, 613–630. [Google Scholar] [CrossRef]
- Medina-Muñoz, D.R.; Medina-Muñoz, R.D. Critical issues in health and wellness tourism: An exploratory study of visitors to wellness centres on Gran Canaria. Curr. Issues Tour. 2013, 16, 415–435. [Google Scholar] [CrossRef]
- Global Wellness Institute Global Spa and Wellness Economy Monitor. 2013. Available online: http://www.globalwellnesssummit.com/ (accessed on 5 January 2017).
- Salaheldin, S.I. Critical success factors for TQM implementation and their impact on performance of SMEs. Int. J. Prod. Perform. Manag. 2009, 58, 215–237. [Google Scholar] [CrossRef]
- Taylor, W.A.; Wright, G.H. A longitudinal study of TQM implementation: Factors influencing success and failure. Omega 2003, 31, 97–111. [Google Scholar] [CrossRef]
- Tarí, J.J.; Molina, J.F.; Castejon, J.L. The relationship between quality management practices and their effects on quality outcomes. Eur. J. Oper. Res. 2007, 183, 483–501. [Google Scholar] [CrossRef]
- EFQM. The EFQM Excellence Model; European Foundation for Quality Management: Brussels, Belgium, 2013. [Google Scholar]
- Prakash, J. Empirical assessment of ISO 9000 related management practices and performance relationships. Int. J. Prod. Econ. 2008, 113, 40–59. [Google Scholar]
- Lee, P.K.C.; To, W.M.; Yu, B.T.W. The implementation and performance outcomes of ISO 9000 in service organizations: An empirical taxonomy. Int. J. Qual. Reliab. Manag. 2009, 26, 646–662. [Google Scholar] [CrossRef]
- Rubio-Andrada, L.; Alonso-Almeida, M.M.; Rodríguez-Antón, J. Motivations and impacts in the firm and stakeholders of quality certification: Evidence from small- and medium-sized service enterprises. Total Qual. Manag. Bus. Excell. 2011, 22, 833–852. [Google Scholar] [CrossRef]
- Sedláček, M.; Suchánek, P.; Špalek, J.; Štamfestová, P. Relationship between quality and performance: Tourism companies in the Czech Republic. Rev. Econ. Perspect. 2011, 11, 195–222. [Google Scholar] [CrossRef]
- Alonso-Almeida, M.M.; Rodríguez-Antón, J.M.; Rubio-Andrada, L. Reasons for implementing certified quality systems and impact on performance: An analyses of the hotel industry. Serv. Ind. J. 2012, 32, 919–936. [Google Scholar] [CrossRef]
- Tarí, J.J.; Heras-Saizarbitoria, I.; Dick, G. Internal and External Drivers for Quality Certification in the Service Industry: Do They Have Different Impacts on Success? Serv. Bus. 2014, 8, 337–354. [Google Scholar] [CrossRef]
- Wilkinson, A.; Redman, T.; Snape, E.; Marchington, M. Managing with Total Quality Management: Theory and Practice; McMillan Business: Hong Kong, China, 1998. [Google Scholar]
- Oakland, J. TQM. Text with Cases; Butterworth-Heinemann: Oxford, UK, 2000. [Google Scholar]
- Dale, B.G. Managing Quality, 4th ed.; Blackwell Publishers: Oxford, UK, 2003. [Google Scholar]
- Eriksson, H.; Garvare, R. Organisational performance improvement through quality award process participation. Int. J. Qual. Reliab. Manag. 2005, 22, 894–912. [Google Scholar] [CrossRef]
- Powell, T.C. Total quality management as competitive advantage: A review and empirical study. Strateg. Manag. J. 1995, 16, 15–37. [Google Scholar] [CrossRef]
- Zhang, Z. Developing a model of quality management methods and evaluating their effects on business performance. Total Qual. Manag. 2000, 11, 129–137. [Google Scholar] [CrossRef]
- Hendricks, K.B.; Singhal, V.R. Firm characteristics, total quality management, and financial performance. J. Oper. Manag. 2001, 19, 269–285. [Google Scholar] [CrossRef]
- Kaynak, H. The relationship between total quality management practices and their effects on firm performance. J. Oper. Manag. 2003, 21, 405–435. [Google Scholar] [CrossRef]
- European Committee for Standardization. ISO 8402—Quality Management and Quality Assurance; International Standards Organisation: Brussels, Belgium, 1992. [Google Scholar]
- Saraph, J.; Benson, P.G.; Schroeder, R. An instrument for measuring the critical factors of quality management. Decis. Sci. 1989, 20, 810–829. [Google Scholar] [CrossRef]
- Sila, I.; Ebrahimpour, M. An invesigation of the total quality management survey based research published between 1989 and 2000: A literature review. Int. J. Qual. Reliab. Manag. 2002, 19, 902–970. [Google Scholar] [CrossRef]
- Claver, E.; Tarí, J.J.; Molina, J.F. Critical factors and results of quality management: An empirical study. Total Qual. Manag. Bus. Excell. 2003, 14, 91–118. [Google Scholar] [CrossRef]
- Dahlgaard-Park, S.M.; Chen, C.K.; Jang, J.Y.; Dahlgaard, J.J. Diagnosing and prognosticating the quality movement–a review on the 25 years’ quality literature (1987–2011). Total Qual. Manag. Bus. Excell. 2013, 24, 1–18. [Google Scholar] [CrossRef]
- Magd, H.A. TQM Constructs Development and Validation in the context of Egyptian Manufacturing Sector: A snapshot Perspective. Best Pract. Constr. Manuf. 2014, 7, 1–16. [Google Scholar]
- Hietschold, N.; Reinhardt, R.; Gurtner, S. Measuring critical success factors of TQM implementation successfully–a systematic literature review. Int. J. Prod. Res. 2014, 52, 6254–6272. [Google Scholar] [CrossRef]
- Aquilani, B.; Silvestri, C.; Ruggieri, A. Sustainability, TQM and Value Co-Creation Processes: The Role of Critical Success Factors. Sustainability 2016, 8, 995. [Google Scholar] [CrossRef]
- Curkovic, S.; Melnyk, S.; Calantone, R. Validating the Malcolm Baldrige National Quality Award framework through structural equation modelling. Int. J. Prod. Res. 2000, 38, 765–791. [Google Scholar] [CrossRef]
- Yong, J.; Wilkinson, A. Rethinking total quality management. Total Qual. Manag. 2001, 12, 247–258. [Google Scholar] [CrossRef]
- Lee, S.M.; Rho, B.H.; Lee, S.G. Impact of Malcolm Baldrige National Quality Award criteria on organizational quality Performance. Int. J. Prod. Res. 2003, 41, 2003–2021. [Google Scholar] [CrossRef]
- Eskildsen, J.K.; Dahlgaard, J.J. A causal model for employee satisfaction. Total Qual. Manag. 2000, 11, 1081–1094. [Google Scholar]
- Bou-Llusar, J.C.; Escrig, A.B.; Roca, V.; Beltrán, I. To what extent do enablers explain results in the EFQM Excellence Model? An empirical study. Int. J. Qual. Reliab. Manag. 2005, 22, 337–353. [Google Scholar] [CrossRef]
- Calvo-Mora, A.; Leal, A.; Roldán, J.L. Relationships between the EFQM Model Criteria: A study in Spanish Universities. Total Qual. Manag. 2005, 16, 741–770. [Google Scholar] [CrossRef]
- Flynn, B.F.; Schroeder, R.C.; Sakakibara, S. The impact of quality management practices on performance and competitive advantage. Decis. Sci. 1995, 26, 659–691. [Google Scholar] [CrossRef]
- Yusof, S.M.; Aspinwall, E. Total quality management implementation frameworks: Comparison and review. Total Qual. Manag. 2000, 11, 281–294. [Google Scholar] [CrossRef]
- Lakhal, L.; Pasin, F.; Limam, M. Quality management practices and their impact on performance. Int. J. Qual. Reliab. Manag. 2006, 23, 625–646. [Google Scholar] [CrossRef]
- Wilson, D.D.; Collier, D.A. An empirical investigation of the Malcolm Baldrige National Quality award causal model. Decis. Sci. 2000, 31, 361–383. [Google Scholar] [CrossRef]
- Saraph, J.V.; Sebastian, R.J. Developing a quality culture. Qual. Prog. 1993, 26, 73–78. [Google Scholar]
- Anderson, J.C.; Rungtusanatham, M.; Schroeder, R.G. A theory of quality management underlying the deming management method. Acad. Manag. Rev. 1994, 19, 472–509. [Google Scholar]
- Eskildsen, J.K.; Kristensen, K.; Juhl, H.J. Trends in EFQM criterion weights. The case of Denmark 1998–2001. Meas. Bus. Excell. 2002, 6, 22–28. [Google Scholar] [CrossRef]
- Osseo-Asare, A.E.; Longbottom, D. The need for education and training in the EFQM Model for quality management in UK higher-education institutions. Qual. Assur. Educ. 2002, 10, 26–36. [Google Scholar] [CrossRef]
- Calvo-Mora, A.; Criado, F. Análisis de la validez del modelo europeo de excelencia para la gestión de la calidad en instituciones universitarias: Un enfoque directivo. Rev. Eur. Dir. Econ. Empresa 2005, 14, 41–58. [Google Scholar]
- Claver, E.; Tarí, J.J.; Pereira, J. Does quality impact on hotel performance? Int. J. Contemp. Hosp. Manag. 2006, 18, 350–358. [Google Scholar] [CrossRef]
- Marín Vinuesa, L.M. Enfoques de estudio y modelos de investigación sobre calidad y resultados: Una revisión crítica. Cuad. Gest. 2009, 9, 89–110. [Google Scholar]
- Ul Hassan, M.; Mukhtar, A.; Qureshi, S.U.; Sharif, S. Impact of TQM practices on firm’s performance of Pakistan’s manufacturing organizations. Int. J. Acad. Res. Bus. Soc. Sci. 2012, 2, 232–259. [Google Scholar]
- Ferron Vilchez, V.; Darnall, N. Two are better than one: The link between management systems and business performance. Bus. Strategy Environ. 2016, 25, 221–240. [Google Scholar] [CrossRef]
- O’Neill, P.; Sohal, A.; Teng, C.W. Quality management approaches and their impact on firms׳ financial performance–An Australian study. Int. J. Prod. Econ. 2016, 171, 381–393. [Google Scholar] [CrossRef]
- Ramesh, K. Application of interpretive structural modelling for analysing barriers to total quality management practices implementation in the automotive sector. Total Qual. Manag. Bus. Excell. 2016, 1–22. Available online: http://www.tandfonline.com/doi/full/10.1080/14783363.2016.1213627 (accessed on 23 April 2017).
- Yahya, S.; Goh, W.K. The implementation of an ISO 9000 quality system. Int. J. Qual. Reliab. Manag. 2001, 18, 941–966. [Google Scholar] [CrossRef]
- Buttle, F.A.; Jayne, M.R. ISO 900: Is the real estate sector any different? Property Manag. 1999, 17, 125. [Google Scholar] [CrossRef]
- Jones, R.; Arndt, G.; Kustin, R. ISO 9000 amongst Australian companies: Impact of time and reasons for seeking certification on perceptions of benefits received. Int. J. Qual. Reliab. Manag. 1997, 14, 650–660. [Google Scholar] [CrossRef]
- Casadesús, M.; Karapetrovic, S. An empirical study of the benefits: A temporal study. Int. J. Qual. Reliab. Manag. 2005, 16, 105–120. [Google Scholar]
- Naveh, E.; Marcus, A. Financial performance, ISO 9000 standard and safe driving practices effects on accident rate in the US motor carrier industry. Accid. Anal. Prev. 2007, 39, 731–742. [Google Scholar] [CrossRef] [PubMed]
- Marín Vinuesa, L.M.; Gimeno, J. La certificación ISO 9000 en el sector industrial del Mueble: Evidencias sobre la cultura de calidad total y las ventajas que la caracterizan. Investig. Eur. Dir. Econ. Empresa 2010, 16, 77–101. [Google Scholar] [CrossRef]
- Bou-Llusar, J.C.; Escrig-Tena, A.B.; Roca-Puig, V.; Beltrán-Martín, I. An empirical assessment of the EFQM Excellence Model: Evaluation as a TQM framework relative to the MBNQA Model. J. Oper. Manag. 2008, 27, 1–22. [Google Scholar] [CrossRef]
- Black, S.A.; Crumley, H.C. Self-assessment: What’s in it for us? Total Qual. Manag. 1997, 8, 90–93. [Google Scholar] [CrossRef]
- Eskildsen, J.K.; Kristensen, K.; Juhl, H.J. The causal structure of the EFQM Excellence Model. 2000. Available online: http://pure.au.dk/portal/files/32330561/0003106.pdf (accessed on 20 April 2017).
- Reiner, G. Analysis of critical factors of company success based on the EFQM Excellence model. In Proceedings of the 7th World Congress for Total Quality Management, Verona, Italy, 25–27 June 2002; pp. 361–366. [Google Scholar]
- Pannirselvam, G.P.; Ferguson, L.A. A study of the relationships between the Baldrige categories. Int. J. Qual. Reliab. Manag. 2001, 18, 14–34. [Google Scholar] [CrossRef]
- Ghosh, S.; Handfield, R.B.; Kannan, V.R.; Tan, K.C. A structural model analysis of the Malcolm Baldrige National Quality Award framework. Int. J. Manag. Decis. Mak. 2003, 4, 289–311. [Google Scholar] [CrossRef]
- Sila, I.; Ebrahimpour, M. Critical linkages among TQM factors and business results. Int. J. Oper. Prod. Manag. 2005, 25, 1123–1155. [Google Scholar] [CrossRef]
- Ooi, K.B.; Abu Bakar, N.; Arumugam, V.; Vellapan, L.; Kim Yin Loke, A. Does TQM influence employees’ job satisfaction? An empirical case analysis. Int. J. Qual. Reliab. Manag. 2007, 24, 62–77. [Google Scholar]
- Tutuncu, O.; Kucukusta, D. Canonical correlation between job satisfaction and EFQM business excellence model. Qual. Quant. 2010, 44, 1227–1238. [Google Scholar] [CrossRef]
- Zelnik, M.; Maletič, M.; Maletič, D.; Gomišček, B. Quality management systems as a link between management and employees. Total Qual. Manag. Bus. Excell. 2012, 23, 45–62. [Google Scholar] [CrossRef]
- Kristensen, K.; Juhl, H.J.; Eskildsen, J. Benchmarking Excellence. Meas. Bus. Excell. 2001, 5, 19–23. [Google Scholar] [CrossRef]
- Martínez-Moure, O. Talasoterapia y turismo: Los recursos terapéuticos del agua del mar como mecanismo sostenible de promoción turística para los municipios costeros: El caso de la Provincia de Pontevedra (Galicia). Med. Nat. 2008, 2, 90–96. [Google Scholar]
- ISO. UNE-EN-ISO 9001:2015: Sistemas de Gestión de la Calidad—Requisitos; Aenor: Madrid, Spain, 2015; Available online: https://www.iso.org/obp/ui#iso:std:iso:9001:ed-5:v1:es (accessed on 23 April 2017).
- ISO. UNE-EN-ISO 14001:2015: Sistemas de Gestión Ambiental—Requisitos con Orientación para su Uso; Aenor: Madrid, Spain, 2015; Available online: https://www.iso.org/obp/ui#iso:std:iso:14001:ed-3:v1:es (accessed on 23 April 2017).
- Black, S.A.; Porter, L.J. Identification of the critical factors of TQM. Decis. Sci. 1996, 27, 1–21. [Google Scholar] [CrossRef]
- Grandzol, J.R.; Gershon, M. A survey instrument for standardizing TQM modeling research. Int. J. Qual. Sci. 1998, 3, 80–105. [Google Scholar] [CrossRef]
- EFQM. EFQM Model for Business Excellence: Company Guidelines; European Foundation for Quality Management: Brussels, Beligum, 1999. [Google Scholar]
- Sánchez, F.J.S. Metodología Para la Investigación en Marketing y Dirección de Empresas; Ediciones Pirámide: Madrid, Spain, 1999. [Google Scholar]
- Norusis, M.J. SPSS for Windows: Base System User´s Guide; SPSS Inc.: Chicago, IL, USA, 1993. [Google Scholar]
- Nunnally, J.C. Psychometric Theory, 2nd ed.; McGraw-Hill: New York, NY, USA, 1978. [Google Scholar]
- Hair, J.F.; Anderson, R.E.; Tatham, R.L.; Black, W.C. Análisis Multivariante, 5th ed.; Prentice Hall: Madrid, Spain, 1999. [Google Scholar]
- Roldán, J.L.; Sánchez-Franco, M.J. Variance-based structural equation modeling: Guidelines for using partial least squares in information systems research. In Research Methodologies, Innovations and Philosophies in Software Systems Engineering and Information Systems; IGI Global: Hershey, PA, USA, 2012; pp. 193–221. [Google Scholar]
- Chin, W.W. How to write up and report PLS analyses. In Handbook of Partial Least Squares: Concepts, Methods and Applications; Vinzi, V.E., Chin, W.W., Henseler, J., Wang, H., Eds.; Springer: Berlin, Germany, 2010. [Google Scholar]
- Sánchez-Hernández, M.I.; Gallardo-Vázquez, D.; Barcik, A.; Dziwiński, P. The Effect of the Internal Side of Social Responsibility on Firm Competitive Success in the Business Services Industry. Sustainability 2016, 8, 179. [Google Scholar] [CrossRef]
- Wang, B.; Yang, Z.; Han, F.; Shi, H. Car Tourism in China: The Mediation Effect of Perceived Value and Tourist Satisfaction on the Relationship between Destination Image and Loyalty. Sustainability 2016, 9, 22. [Google Scholar] [CrossRef]
- Reinartz, W.; Haenlein, M.; Henseler, J. An empirical comparison of the efficacy of covariance- based and variance-based (SEM). Int. J. Res. Mark. 2009, 26, 332–344. [Google Scholar] [CrossRef]
- Chin, W.W.; Newsted, P.R. Structural equation modelling analysis with small samples using partial least squares. In Statistical Strategies for Small Samples; Hoyle, R., Ed.; Sage Publications: Thousand Oaks, CA, USA, 1999. [Google Scholar]
- Carmines, E.G.; Zeller, R.A. Reliability and Validity Assessment; Sage: Beverly Hills, CA, USA, 1979. [Google Scholar]
- Fornell, C.; Larcker, D.F. Evaluating structural equation models with unobservable variables and measurement error. J. Mark. Res. 1981, 18, 39–50. [Google Scholar] [CrossRef]
- Hair, J.F.; Ringle, C.M.; Sarstedt, M. PLS-SEM: Indeed a silver bullet. J. Mark. Theory Pract. 2011, 19, 139–152. [Google Scholar] [CrossRef]
- Henseler, J.; Ringle, C.M.; Sinkovics, R.R. The use of partial least squares path modeling in international marketing. In New Challenges to International Marketing; Sinkovics, R.R., Ghauri, P.N., Eds.; Emerald: Bingley, UK, 2009; pp. 277–319. [Google Scholar]
- Gómez-Gómez, J.; Martínez-Costa, M.; Martínez-Lorente, A.R. A critical evaluation of the EFQM model. Int. J. Qual. Reliab. Manag. 2011, 28, 484–502. [Google Scholar] [CrossRef]
- Samson, D.; Terziovski, M. The relationship between total quality management practices and operational performance. J. Oper. Manag. 1999, 17, 393–409. [Google Scholar] [CrossRef]
- Moon, J.Y.; Lee, S.C.; Yong-Seu, P.; Suh, Y.H. A study on the causal relationships in the Korean National Quality Award model. Total Qual. Manag. Bus. Excell. 2011, 22, 705–726. [Google Scholar] [CrossRef]
- Savic, M.; Djordjevic, P.; Nikolic, D.; Mihajlovic, I.; Zivkovic, Z. Modeling the influence of EFQM criteria on employee’s satisfaction and loyalty in transition economy: The study of banking sector in Serbia. Serbian J. Manag. 2013, 9, 15–30. [Google Scholar] [CrossRef]
- He, Y.; Li, W.; Lai, K.K. Service climate, employee commitment and customer satisfaction: Evidence from the hospitality industry in China. Int. J. Contemp. Hosp. Manag. 2011, 23, 592–607. [Google Scholar] [CrossRef]
- Chinda, T.; Mohamed, S. Causal relationships between enablers of construction safety culture. In Proceedings of the 4th International Conference on Construction in 21st Century: Accelerating Innovation in Engineering, Management and Technology, Gold Coast, Australia, 11–13 July 2007. [Google Scholar]
- Tutuncu, O.; Kucukusta, D. Relationship between job satisfaction and business excellence: empirical evidence from hospital nursing departments. J. Comp. Int. Manag. 2006, 9, 40–57. [Google Scholar]
- Alsarayreh, B.; Khudair, H. Structural Equation Modeling Analysis between Enabler and Results in EFQM Model; a Case Study in Vocational Training Corporation in Jordan. Int. J. Innov. Technol. Explor. Eng. 2012, 1, 52–55. [Google Scholar]
- Flynn, B.B.; Schroeder, R.G.; Sakakibara, S. A framework for quality management research and an associated measurement instrument. J. Oper. Manag. 1994, 11, 339–366. [Google Scholar] [CrossRef]
- Ahire, S.L.; Dreyfus, P. The impact of design management and process management on quality: An empirical examination. J. Oper. Manag. 2000, 18, 549–575. [Google Scholar] [CrossRef]
- Ooi, K.B.; Lin, B.; Tan, B.I.; Chong, A.Y.L. Are TQM practices supporting customer satisfaction and service quality? J. Serv. Mark. 2011, 25, 410–419. [Google Scholar] [CrossRef]
- Kumar, V.; Smart, P.A.; Maddern, H.; Maull, R.S. Alternative perspectives on service quality and customer satisfaction: The role of BPM. Int. J. Serv. Ind. Manag. 2008, 19, 176–187. [Google Scholar] [CrossRef]
- Rungtusanatham, M.; Forza, C.; Filippini, R.; Anderson, J.C. A replication study of a theory of quality management underlying the Deming management method: Insights from an Italian context. J. Oper. Manag. 1998, 17, 77–95. [Google Scholar] [CrossRef]
- Rahman, S.U.; Bullock, P. Soft TQM, hard TQM, and organisational performance relationships: An empirical investigation. Omega 2005, 33, 73–83. [Google Scholar] [CrossRef]
Figure 1.
Theoretical model proposed (source: authors’ own data).

Table 1.
Descriptive Analysis.
| Items A | Mean | (SD) B | Items A | Mean | (SD) B | ||
|---|---|---|---|---|---|---|---|
| Leadership | L1 | 5.64 | 1.33 | Alliances and Resources | AR1 AR2 AR3 AR4 AR5 AR6 AR7 AR8 AR9 | 4.83 4.54 5.64 4.51 4.64 5.19 4.83 5.09 4.38 | 1.73 1.62 1.37 1.63 1.49 1.66 1.73 1.66 1.94 |
| L2 | 6.00 | 1.12 | |||||
| L3 | 6.16 | 0.93 | |||||
| L4 | 5.61 | 1.14 | |||||
| L5 | 5.32 | 1.22 | |||||
| L6 | 5.80 | 1.24 | |||||
| L7 | 5.80 | 1.27 | |||||
| L8 | 5.32 | 1.68 | |||||
| L9 | 5.61 | 1.38 | |||||
| L10 | 6.03 | 1.16 | |||||
| Personnel Management | PEM1 | 5.35 | 2.05 | Process Management | PM1 PM2 PM3 PM4 PM5 PM6 PM7 | 5.54 5.51 5.41 4.96 5.06 5.54 5.09 | 1.45 1.36 1.33 1.87 1.91 1.20 1.57 |
| PEM2 | 5.48 | 1.38 | |||||
| PEM3 | 5.58 | 1.45 | |||||
| PEM4 | 5.48 | 1.74 | |||||
| PEM5 | 5.70 | 1.24 | |||||
| PEM6 | 3.29 | 2.45 | |||||
| PEM7 | 4.35 | 2.15 | |||||
| PEM8 | 5.45 | 1.60 | |||||
| PEM9 | 4.93 | 2.50 | |||||
| PEM10 | 5.22 | 1.85 | |||||
| PEM11 | 5.67 | 1.98 | |||||
| Continuous Improvement | CI1 | 6.00 | 1.43 | Customer Results | CR1 CR2 CR3 CR4 CR5 CR6 CR7 | 6.45 6.61 6.35 6.16 6.22 6.16 4.29 | 1.15 0.76 1.05 0.89 0.71 0.96 2.19 |
| CI2 | 4.12 | 2.12 | |||||
| CI3 | 4.32 | 2.35 | |||||
| CI4 | 5.35 | 1.58 | |||||
| CI5 | 5.12 | 1.43 | |||||
| CI6 | 5.25 | 1.56 | |||||
| CI7 | 6.16 | 0.93 | |||||
| CI8 | 6.38 | 0.95 | |||||
| Employee Results | ER1 | 5.41 | 1.72 | Society Results | SR1 SR2 SR3 SR4 SR5 SR6 SR7 SR8 | 5.93 5.19 5.22 4.06 4.45 3.80 3.90 3.35 | 1.80 1.79 1.97 2.20 2.11 2.37 2.25 2.33 |
| ER2 | 5.16 | 1.75 | |||||
| ER3 | 5.16 | 1.95 | |||||
| ER4 | 5.48 | 1.67 | |||||
| ER5 | 5.29 | 1.57 | |||||
| ER6 | 4.51 | 2.11 | |||||
| ER7 | 5.09 | 1.64 | |||||
| ER8 | 5.06 | 1.67 | |||||
| ER9 | 3.87 | 2.04 | |||||
| Key Results | KR1 | 4.64 | 1.56 | ||||
| KR2 | 5.35 | 1.64 | |||||
| KR3 | 5.61 | 1.22 | |||||
| KR4 | 5.67 | 1.42 | |||||
| KR5 | 5.22 | 1.76 | |||||
| KR6 | 5.38 | 1.38 |
A The elements have been summarized to make their comprehension easier. The complete list of items evaluated is shown in Appendix A; B SD is Standard Deviation (source: authors’ own data).
Table 2.
Bivariate Pearson correlation matrix (Critical Factors and Results).
| Leadership | Alliances and Resources | Personnel Management | Process Management | Continuous Improvement | |
|---|---|---|---|---|---|
| Customer Results | 0.235 ** | 0.658 ** | 0.456 ** | 0.573 ** | 0.774 ** |
| Employee Results | 0.454 * | 0.755 ** | 0.626 ** | 0.716 ** | 0.615 ** |
| Society Results | 0.689 | 0.565 ** | 0.365 * | 0.732 ** | 0.440 * |
| Key Results | 0.640 | 0.666 ** | 0.492 ** | 0.627 ** | 0.412 * |
* p-value < 0.05; ** p-value < 0.01 (source: authors’ own data).
Table 3.
Items Individual Reliability (source: authors’ own data).
| CI | PM | KR | CR | ER | SR | AR | PEM | L | |
|---|---|---|---|---|---|---|---|---|---|
| AR1 | 0 | 0 | 0 | 0 | 0 | 0 | 0.7388 | 0 | 0 |
| AR2 | 0 | 0 | 0 | 0 | 0 | 0 | 0.8199 | 0 | 0 |
| AR3 | 0 | 0 | 0 | 0 | 0 | 0 | 0.8693 | 0 | 0 |
| AR5 | 0 | 0 | 0 | 0 | 0 | 0 | 0.7243 | 0 | 0 |
| AR6 | 0 | 0 | 0 | 0 | 0 | 0 | 0.906 | 0 | 0 |
| AR7 | 0 | 0 | 0 | 0 | 0 | 0 | 0.929 | 0 | 0 |
| AR8 | 0 | 0 | 0 | 0 | 0 | 0 | 0.9185 | 0 | 0 |
| AR9 | 0 | 0 | 0 | 0 | 0 | 0 | 0.8325 | 0 | 0 |
| PEM10 | 0 | 0 | 0 | 0 | 0 | 0 | 0 | 0.7439 | 0 |
| PEM2 | 0 | 0 | 0 | 0 | 0 | 0 | 0 | 0.8636 | 0 |
| PEM5 | 0 | 0 | 0 | 0 | 0 | 0 | 0 | 0.9201 | 0 |
| PEM8 | 0 | 0 | 0 | 0 | 0 | 0 | 0 | 0.9237 | 0 |
| PEM9 | 0 | 0 | 0 | 0 | 0 | 0 | 0 | 0.7744 | 0 |
| PM1 | 0 | 0.8038 | 0 | 0 | 0 | 0 | 0 | 0 | 0 |
| PM2 | 0 | 0.9042 | 0 | 0 | 0 | 0 | 0 | 0 | 0 |
| PM3 | 0 | 0.8581 | 0 | 0 | 0 | 0 | 0 | 0 | 0 |
| PM4 | 0 | 0.8679 | 0 | 0 | 0 | 0 | 0 | 0 | 0 |
| PM7 | 0 | 0.8748 | 0 | 0 | 0 | 0 | 0 | 0 | 0 |
| L1 | 0 | 0 | 0 | 0 | 0 | 0 | 0 | 0 | 0.8135 |
| L10 | 0 | 0 | 0 | 0 | 0 | 0 | 0 | 0 | 0.7616 |
| L2 | 0 | 0 | 0 | 0 | 0 | 0 | 0 | 0 | 0.9162 |
| L3 | 0 | 0 | 0 | 0 | 0 | 0 | 0 | 0 | 0.8919 |
| L4 | 0 | 0 | 0 | 0 | 0 | 0 | 0 | 0 | 0.8028 |
| L6 | 0 | 0 | 0 | 0 | 0 | 0 | 0 | 0 | 0.8916 |
| L9 | 0 | 0 | 0 | 0 | 0 | 0 | 0 | 0 | 0.7764 |
| CI3 | 0.7928 | 0 | 0 | 0 | 0 | 0 | 0 | 0 | 0 |
| CI4 | 0.9116 | 0 | 0 | 0 | 0 | 0 | 0 | 0 | 0 |
| CI5 | 0.8933 | 0 | 0 | 0 | 0 | 0 | 0 | 0 | 0 |
| CI6 | 0.929 | 0 | 0 | 0 | 0 | 0 | 0 | 0 | 0 |
| CI7 | 0.8664 | 0 | 0 | 0 | 0 | 0 | 0 | 0 | 0 |
| CI8 | 0.7133 | 0 | 0 | 0 | 0 | 0 | 0 | 0 | 0 |
| KR3 | 0 | 0 | 0.9083 | 0 | 0 | 0 | 0 | 0 | 0 |
| KR4 | 0 | 0 | 0.9051 | 0 | 0 | 0 | 0 | 0 | 0 |
| KR5 | 0 | 0 | 0.753 | 0 | 0 | 0 | 0 | 0 | 0 |
| KR6 | 0 | 0 | 0.9485 | 0 | 0 | 0 | 0 | 0 | 0 |
| CR1 | 0 | 0 | 0 | 0.7892 | 0 | 0 | 0 | 0 | 0 |
| CR2 | 0 | 0 | 0 | 0.756 | 0 | 0 | 0 | 0 | 0 |
| CR4 | 0 | 0 | 0 | 0.9771 | 0 | 0 | 0 | 0 | 0 |
| CR5 | 0 | 0 | 0 | 0.8875 | 0 | 0 | 0 | 0 | 0 |
| CR6 | 0 | 0 | 0 | 0.9428 | 0 | 0 | 0 | 0 | 0 |
| ER3 | 0 | 0 | 0 | 0 | 0.923 | 0 | 0 | 0 | 0 |
| ER4 | 0 | 0 | 0 | 0 | 0.8731 | 0 | 0 | 0 | 0 |
| ER5 | 0 | 0 | 0 | 0 | 0.743 | 0 | 0 | 0 | 0 |
| ER6 | 0 | 0 | 0 | 0 | 0.8682 | 0 | 0 | 0 | 0 |
| ER7 | 0 | 0 | 0 | 0 | 0.8457 | 0 | 0 | 0 | 0 |
| ER8 | 0 | 0 | 0 | 0 | 0.7431 | 0 | 0 | 0 | 0 |
| SR3 | 0 | 0 | 0 | 0 | 0 | 0.7512 | 0 | 0 | 0 |
| SR4 | 0 | 0 | 0 | 0 | 0 | 0.9286 | 0 | 0 | 0 |
| SR5 | 0 | 0 | 0 | 0 | 0 | 0.9593 | 0 | 0 | 0 |
| SR6 | 0 | 0 | 0 | 0 | 0 | 0.9392 | 0 | 0 | 0 |
| SR7 | 0 | 0 | 0 | 0 | 0 | 0.8681 | 0 | 0 | 0 |
| SR8 | 0 | 0 | 0 | 0 | 0 | 0.806 | 0 | 0 | 0 |
Table 4.
Construct reliability, convergent validity, and discriminant validity.
| AVE | α Cronbach | CI | PM | KR | CR | ER | SR | AR | PM | L | |
|---|---|---|---|---|---|---|---|---|---|---|---|
| CI | 0.73 | 0.9248 | 0.8544 | 0 | 0 | 0 | 0 | 0 | 0 | 0 | 0 |
| PM | 0.7437 | 0.9138 | 0.7993 | 0.8624 | 0 | 0 | 0 | 0 | 0 | 0 | 0 |
| KR | 0.7777 | 0.905 | 0.6142 | 0.7266 | 0.8819 | 0 | 0 | 0 | 0 | 0 | 0 |
| CR | 0.7651 | 0.923 | 0.7846 | 0.6255 | 0.4834 | 0.8747 | 0 | 0 | 0 | 0 | 0 |
| ER | 0.6979 | 0.9149 | 0.5812 | 0.7157 | 0.5226 | 0.3419 | 0.8354 | 0 | 0 | 0 | 0 |
| SR | 0.772 | 0.9411 | 0.4735 | 0.6659 | 0.5615 | 0.1048 | 0.7883 | 0.8786 | 0 | 0 | 0 |
| AR | 0.7149 | 0.9418 | 0.7525 | 0.8007 | 0.6771 | 0.7352 | 0.742 | 0.4968 | 0.8455 | 0 | 0 |
| PM | 0.7198 | 0.9037 | 0.5485 | 0.6528 | 0.4265 | 0.5846 | 0.6012 | 0.3398 | 0.7031 | 0.8484 | 0 |
| L | 0.7027 | 0.9285 | 0.3021 | 0.3307 | 0.0743 | 0.3337 | 0.4017 | 0.1247 | 0.5481 | 0.7359 | 0.8383 |
Bold numbers show the square root of AVE in order to evaluate the discriminant validity (source: authors’ own data); AVE: Average Variance Extracted.
Table 5.
Results of the Structural Model.
| Hypotheses | Expected Sign | Path Coefficient | Supported | R2 | |
|---|---|---|---|---|---|
| Leadership → Personnel Management | H1 | + | 0.7359 *** | Yes | 0.5415 |
| Leadership → Alliances and Resources | H2 | + | 0.5481 *** | Yes | 0.3005 |
| Alliances and Resources → Process Management | H5 | + | 0.6759 *** | Yes | 0.6571 |
| Personnel Management → Process Management | H3 | + | 0.1776 * | Yes | |
| Alliances and Resources → Continuous Improvement | H6 | + | 0.3445 ** | Yes | 0.676 |
| Personnel Management → Continuous Improvement | H4 | + | −0.0618 | No | |
| Process Management → Continuous Improvement | H7 | + | 0.5638 *** | Yes | |
| Continuous Improvement → Key Results | H15 | + | 0.0927 | No | 0.531 |
| Process Management → Key Results | H11 | + | 0.6524 *** | Yes | |
| Continuous Improvement → Customer Results | H12 | + | 0.7884 *** | Yes | 0.6156 |
| Process Management → Customer Results | H8 | + | −0.0047 | No | |
| Continuous Improvement → Employee Results | H13 | + | 0.0253 | No | 0.5125 |
| Process Management → Employee Results | H9 | + | 0.6955 *** | Yes | |
| Continuous Improvement → Society Results | H14 | + | −0.1625 | No | 0.4529 |
| Process Management → Society Results | H10 | + | 0.7958 *** | Yes | |
R2: R-squared; *** p-value < 0.001; ** p-value < 0.01; * p-value < 0.0 (source: authors’ own data).
© 2017 by the authors. Licensee MDPI, Basel, Switzerland. This article is an open access article distributed under the terms and conditions of the Creative Commons Attribution (CC BY) license (http://creativecommons.org/licenses/by/4.0/).
Share and Cite
MDPI and ACS Style
Álvarez-García, J.; Del Río-Rama, M.D.l.C.; Miras-Rodríguez, M.D.M. How Do Quality Practices Affect the Results?: The Experience of Thalassotherapy Centres in Spain. Sustainability 2017, 9, 671. https://doi.org/10.3390/su9040671
AMA Style
Álvarez-García J, Del Río-Rama MDlC, Miras-Rodríguez MDM. How Do Quality Practices Affect the Results?: The Experience of Thalassotherapy Centres in Spain. Sustainability. 2017; 9(4):671. https://doi.org/10.3390/su9040671
Chicago/Turabian StyleÁlvarez-García, José, María De la Cruz Del Río-Rama, and María Del Mar Miras-Rodríguez. 2017. "How Do Quality Practices Affect the Results?: The Experience of Thalassotherapy Centres in Spain" Sustainability 9, no. 4: 671. https://doi.org/10.3390/su9040671
Note that from the first issue of 2016, this journal uses article numbers instead of page numbers. See further details here.