
Neighborhood Walking and Social Capital: The Correlation between Walking Experience and Individual Perception of Social Capital


1
Department of Urban and Regional Development, Mokpo National University, 1666, Yeongsan-ro, Cheonggye-myeon, Muan-gun, Jeollanam-do 58554, Korea
2
Goyang Research Institute, 60, Taegeuk-ro, Ilsandong-gu, Goyang-si, Gyeonggi-do 10393, Korea
*
Author to whom correspondence should be addressed.
Sustainability 2017, 9(5), 680; https://doi.org/10.3390/su9050680
Submission received: 20 January 2017
/
Revised: 9 April 2017
/
Accepted: 13 April 2017
/
Published: 27 April 2017
(This article belongs to the Section Sustainable Urban and Rural Development)
Abstract
:The purpose of this study was to analyze the relationship between people’s actual walking experience and their social capital levels in order to examine the possibility of restoring weakened social functions of streets and public spaces in a walking-friendly urban environment. Based on the survey data of 591 residents of Seoul, we empirically analyzed the relationship between walking experience for various purposes and individual perceptions of social capital using one-way ANOVA and OLS regression models. As a result of the analysis, we found that the levels of neighborly trust and networking of people who experienced leisure walking were higher than those of people who did not, while there was no difference in the level of social capital according to walking experiences for other purposes. This result is significant in that it shows the basis for the restoration of the social function of neighborhoods through social capital formation of people as an effect of walking. Hence, it is important to create a walking environment that supports leisure activities.
1. Introduction
In car-oriented cities, environmental problems caused by fossil energy consumption, increase in social costs due to traffic congestion, and personal health problems such as adult diseases caused by the prevalent use of private vehicles and a sedentary lifestyle are becoming common [1]. In order to solve such an urban problem, cities around the world are considering various policies that encourage walking and cycling and that make streets better for walking than driving. In 2013, the government of Seoul announced a people-oriented urban transportation policy that included elements such as expanding walkways, installing pedestrian-only streets, and introducing complete streets that pedestrians, bicyclists, and vehicles can use together, so as to create pedestrian-friendly spaces [2].
In this way, the interest in a walking-friendly environment has been focused on finding physical environment factors with which to create it. Many studies have been actively conducted to verify the relationship between the physical environment of the city and the walking of individuals, especially in North American cities where the obesity of adults is one of serious problems, and private car dependency is high. The results of these studies converge on the conclusion that high population density, mixed land use, and small blocks are the main physical factors of a walking-friendly environment [1,3].
In recent years, there has been an active debate on healthy cities that encourage people to walk, ride a bike, and use public transportation to prevent diseases such as adult-onset diabetes and adult obesity [4]. In healthy city discussions, a good walking environment is the most basic requirement, so it is closely related to urban design, urban planning, and traffic planning. In these areas, the effects of a good walking environment on improvement in health status are presented.
It is good for us to find the value of a walking-friendly environment in this healthy city concept, but we need to look back at the point where the discussion about the walking environment fundamentally started. In the streets of car-oriented cities, only the function of movement was emphasized, and various social functions previously performed on the streets or public spaces gradually disappeared [5]. It is, therefore, necessary to analyze whether the diverse social functions which are gradually disappearing from streets or public spaces can be restored through a method of urban design that pursues various interactions between spaces and people by creating good walking environments. For this purpose, this study analyzes the correlation between personal walking experience in public space and the level of personal perception of social interaction.
Although walking can be divided by purpose into utilitarian walking with the purpose of traveling and recreational walking with the purpose of taking a leisurely stroll and exercising [6], it is very difficult to distinguish them completely. This study limits walking to that which occurred in the residents’ neighborhood, and then divides it into three types according to the purpose and discretion: overall walking, shopping walking, and leisure walking.
Research subjects were limited to the residents of Seoul, and in 2013, and an online survey was conducted using the self-reporting method for the respondents’ walking experiences for a week and their perceptions of social capital. Therefore, in this study, the spatial range is limited to the city of Seoul, and the temporal frame is 2013. One-way ANOVA and OLS regression models were performed using the survey data to verify the research hypothesis; R 3.3.1 [7] and Stata 12 [8] were used in this process.
2. Literature Review
2.1. Walkable City and Restoration of Social Functions
The city, before the industrial revolution started with the invention of the steam engine, was built up to the physical limitations of a person, so its physical size and configuration were determined to the extent that a person could walk; there was, therefore, little discrepancy between the physical areas of people’s daily life, work, and other activities [9]. However, as the use of automobiles became more common due to industrialization, the urban structure created at a human scale was rapidly restructured into an automobile-oriented one, and such spaces which were conveniently for drivers—superblocks, walkways, separate roads, and cul-de-sacs—were created. Carmona et al. [7] explained this phenomenon as an erosion of traditional lattice structures. This means that the street space, where various public activities occurred as a part of everyday life, has lost its social function and has become a space for moving quickly from one place to another.
In general, in the field of walking research, empirical research has been proceeding by a social ecological model or a behavioral model of the environment. In the previous studies, the density, diversity, design, distance to destination, and distance to transportation—which are called ‘the five Ds’—are suggested as factors of the built environment influencing the level of walking of the individual [5,10,11]. For example, studies using social ecological models showed that an increase of the number of walkers and the duration of walking reduced car ownership, congestion costs, and energy consumption in the mid-to-long term, leading to an increase in people’s health status [8].
They explained the effects of walking by analyzing the relationship between a health index like BMI and walking, focusing on health problems as an important effect of walking, especially in North American cities where adult diseases such as obesity are one of important issues [12,13,14,15]. On the other hand, there is a lack of research on the effects of the walking environment on the recovery of the social functions of streets, which is importantly considered in urban design. The study of Saelens and Handy [16] dealt with the secondary effects of walking, but it was at the declarative level; there is still a lack of research dealing with the direct relationship between walking and its secondary effects. Therefore, it is necessary to analyze whether there is a possibility that the social function of streets is recovered when walking is increased in the actual urban environment, before studying an effect of urban form and land use to make a walking-friendly city.
2.2. Social Capital as Measure of Social Functions
A measurement for the restoration of social function is needed for the empirical analysis of the possibility of its recovery on the streets through improvement of the walking activities of the neighborhood’s residents. In this study, we used the concept of social capital as the indicator.
The concept of social capital, which De Tocqueville [17] used to describe the tendency of people to unite for common interests in traditional American society [18], has emerged as a major object of discussions since Bourdieu’s systematic analysis [19]. After Bourdieu’s definition of social capital [20], which is that it is the sum of the actual and potential resources accumulated in an individual or group through a continuous network is formed through mutual relations among people, various definitions have been made by various scholars. Although Kleinhans et al. [21] argued that social capital is a multidimensional concept and therefore cannot be defined or measured as a single term, the definitions of representative scholars that are widely used in academia are as follows.
According to Coleman [22], social capital is defined as a complex element that promotes individual behavior in a social structure, and its specific components are social relations and norms. Fukuyama [23] argued that trust between the members of society is the most important definition and component of social capital, and Putnam [24] argued that social capital is trust, norms, and networks that increase the overall efficiency of society by strengthening the cooperative spirit of people.
In addition to these representative definitions, various scholars have discussed multiple aspects of social capital in the process of discussing it. Social capital can be divided into the categories of bonding social capital and bridging social capital: bonding social capital focuses on solidarity between similar members, and bridging social capital emphasizes the diverse connections among members [25].
In the representative definition of social capital, we adopted trust and networking as the social capital components that are consistent with social function recovery through the improvement of walking. Appropriate measures were selected to meet the research questions since one of the major study subjects is the walking that takes place in a neighborhood, and we used the social capital concept as a surrogate variable for the recovery of social function. We consequently measured the level of trust of neighbors, general trust, and the size of networks. General trust is a measure related to determining whether neighborly trust affects general trust in society as a whole. General and neighborly trust index are ones of bonding types of social capital. Lastly, the size of a network is limited to the network related to neighbors, not to general personal connections. The neighborly network index can be seen as a bridging type of social capital.
2.3. The Relationship between Walkability and Social Capital
We reviewed the concept and the literature and related discussions of walkability and social capital as an effective indicator for measuring the recovery of social function through the improvement of walking. Theoretically, according to Lin’s claim that social capital is formed by the interaction and relations among people in social space [26], it can be concluded that urban transformation into car-oriented cities has reduced the level of social capital in society because it reduces the social interactions which are daily activities in traditional cities. There are, of course, many different elements causing the decline of the level of social capital in modern society, so we cannot attribute it entirely to a decline in walkability. However, given the fact that social capital is fundamentally formed through the relationships between people and that such relationships traditionally took place in streets with active walking, the importance of the relationship between walking and social capital cannot be overlooked.
There are a few empirical studies supporting this theoretical discussions. First, we can predict the positive relationship between walking and social capital from the results of Wen et al. [27], Mendes de Leon et al. [28], and Wood et al. [29], which revealed the positive relationship between walking and social cohesion and sense of community, concepts similar to social capital. There are also studies focusing on the physical walking environment. According to Leyden [30] and Rogers et al. [31], people living in neighborhoods with good walking environments showed higher levels of social capital. These results can give us a great deal of insight into the relationship between walking and social capital.
However, there is also a limitation in that the effects of walking behaviors, which is premised to be between the walking environment and social capital, was overlooked in those studies. In order to grasp the specific relationships between walking and social capital and to actually lead to a meaningful urban design implication in addition to the results of the previous studies, it is thought that an approach to evaluate the effect of the actual walking behaviors as a medium between the walking environment and social capital, is needed. Therefore, the research question is set up in the context of the relationship between the walking that takes place for various purposes and individual perceptions of social capital.
3. Materials and Methods
3.1. Research Questions
Based on the literature review, the research questions can be specified as follows (see Figure 1).
First, this study analyzes whether there is a difference in the level of social capital between the people who walked in the neighborhood and those who did not walk. It is expected that the people who walked in their neighborhood will have been more active in the streets or the public space than those who did not walk. Interaction with other people will have naturally increased, and then eventually their level of perceptions of social capital would increase.
Second, this study analyzes whether walking experience according to the type of walking leads to a difference of social capital level with dividing the walking in the neighborhood according to its purpose. Walking in the neighborhood can be classified into two types according to its purpose and characteristics: walking for traveling and discretionary walking for purposes such as shopping and leisure. The shortest distance to the destination is generally important in walking for traveling, so the possibility of contact with others in the neighborhood or the public space would be low. On the other hand, the possibility of interaction would be great in discretionary walking. Therefore, it is expected that people engaged in discretionary walking would have a higher level of perceptions of social capital compared to those who did not. The analysis is performed on overall walking and discretionary walking for the purpose of shopping and leisure.
Third, this study analyzes whether there is a difference in average trust level according to the number of times people walk and the length of time they do so in the neighborhood. For example, some people may walk a short distance several times in everyday life, or they may walk for a long time in a single outing, as when taking a stroll. Therefore, this study analyzes whether there is a difference in trust level according to the number and duration of walking experiences in the neighborhood, and it discusses the conditions under which the possibility of their interaction is high. Neighborly network variables were excluded from this analysis because it is difficult to obtain meaningful results. In contrast to the trust level measured by the seven-point scale, the number of neighbors was measured by open questions, so the deviation is very large.
3.2. Data and Methodology
There is no social survey data in Korea that is suitable for analyzing the relationship between walking experience and level of social capital. In order to verify the research problem, this study constructed the dataset through an online survey of the residents of Seoul. The online survey was conducted from 6–11 December 2013 and was based on a self-reporting questionnaire on the level of trust, neighborly network, and walking experiences in respondents’ neighborhoods during the last week.
In order to specify respondents, we divided the neighborhoods of Seoul into neighborhoods with good environments and with bad environments for walking. In this process, variables such as the degree of housing type mixing, the degree of land use mixing, and intersection density were used as surrogate variables to represent walking environments. After selecting 94 out of 424 dongs-an administrative district unit in urban areas of Korea—in Seoul, we conducted an online survey of the randomly selected residents of those neighborhoods. As a result, we obtained a total of 591 samples with a response rate of 23.6%.
Using this survey data, we first looked at the characteristics of walking experience in the neighborhood for a week by age and gender based on the number of walks and duration of walking. This was a step that can be used to determine whether the results of the survey show general characteristics of walking, and it is an exploratory step to analyze the respondents’ walking characteristics at the same time. After the group had been classified into the walking group and the non-walking group according to walking experience over a week in the neighborhood, the difference in the average level of perceptions of social capital between groups was verified through one-way ANOVA. In this process, general trust, neighborly trust, and neighborly network were used as social capital indicators.
However, due to the nature of self-reporting questionnaire surveys which depend on respondents’ memories, problems caused by outliers may arise. From a total of 591 samples, 100 samples were chosen through a random selection process, 50 of the walking ones and 50 of the non-walking ones—people who walked less than ten minutes or did not walk at all—in order to remove outliers and adjust the number of samples in the one-way ANOVA equally.
After one-way ANOVA analysis, based on its results, OLS regression analysis was performed using 591 full samples. By analyzing the relationship between the main variables revealed through the ANOVA analysis, we statistically verified the correlation between personal walking experience and individual perceptions of social capital.
3.3. Survey Design and Characteristics of Respondents
A total of 591 valid samples were randomly collected from adults living in Seoul for the survey. In particular, to secure the diversity of the walking environments in the neighborhoods where the respondents reside, the survey area was limited by the housing type and land use characteristics of the neighborhood. Table 1 shows the basic information of the respondents.
The questionnaire consisted of questions about general trust, neighborly trust, networks with neighbors, and walking experience according to walking purposes. Three questions concerning the level of trust were included using a seven-point scale, and there were six open questions asking the number and duration of walks overall as well as for shopping and leisure. Walking experiences that lasted at least ten minutes were only counted toward the number of walking experiences, and walking time is recorded in five minutes increments (see Table 2).
The reason for accepting only walking for at least ten minutes or more is as follows. Ten minutes is a standard of measurement in the International Physical Activity Questionnaire (IPAQ), designed by the World Health Organization (WHO) to measure the health of residents, as well as in the Neighborhood Environment Walkability Survey (NEWS), a tool for assessing an area’s general walking conditions. In particular, this standard is meaningful in this study because it is difficult to expect that social contact, such as social interaction with friends and neighbors, occurs in a short walk near one’s house.
4. Results
4.1. Characteristics of the Number and Duration of Walking in Neighborhoods
Out of the total 591 samples, 532 had been walking for at least ten minutes in their neighborhood in the past seven days, accounting for about 90 percent of the total. However, when purposes of walking were divided into shopping and leisure, fewer people experienced walking; 485 people (82 percent) walked for the purpose of shopping and 491 (83 percent) for leisure (see Table 3).
The characteristics of walking experiences lasting over ten minutes in the past seven days in their neighborhoods were shown in Table 4. It is estimated that the people walked 14.29 times and spend 55.36 min on walking in their neighborhood during the week. Depending on the purpose of walking, we could find that there was a slight difference between walking for leisure and shopping.
First of all, the number of times walking for leisure purposes (12.16 times) was more than that for shopping (9.46 times). The walking time for leisure purposes (54.39 min) was also longer than that for shopping (51.16 min).
Table 5 showed the distribution of the number of walking experiences and the duration. It could be found that most of the walking frequencies were distributed within twenty times, and the durations were within 100 min. This pattern appeared in walking for both leisure and shopping purposes.
The number and duration of walking experiences in the neighborhood differed depending on gender and age, and Table 6 showed those differences. In the case of men, the number of walking decreased as the age bracket increases, but women showed the opposite trend. Women showed the same tendencies regarding the walking duration, but in the case of men, the relation between walking duration and age showed the same trend as the relation between the number of walking experiences and age, only in walking for leisure purposes.
4.2. Difference in Level of Individual Perceptions of Social Capital According to Walking Experience
In order to analyze the differences in individual perceptions of social capital according to walking experiences, each sample needed to be grouped by the level of walking. However, grouping by the quantities of walking duration and number of walking experiences was unreasonable, because their distribution didn’t follow a normal distribution and was cut off from 0, based on the results of descriptive statistics of the number and duration of walking in the neighborhood. Therefore, this analysis was performed by grouping them into the categories of those who experienced walking in the past seven days and those who did not.
To elaborate the analysis, sampling was performed with a total of 100 cases of 50 people who experienced walking and 50 people who did not. With sampling, the variations of sampled data tended to be smaller than variations of the whole sample data, excepting the neighborly network index. In conclusion, it could be expected that the problem caused by outliers had been partially removed through the sampling process (see Table 7).
Bartlett’s test was performed to confirm the homogeneous variance assumption before one-way ANOVA. Through the results of Bartlett’s test for the social capital variables among the groups which were classified by whether they walked or not, we could confirm homogeneous variance in all cases except for the neighborly network variable.
As shown in Table 8, the social capital index of the group who walked was mostly higher than that of the group who did not. The level of general trust, neighborly trust, and the neighborly network of the group of residents who walked were greater than those of the group of residents who did not walk. The average level of general trust of the group who walked for leisure and the average level of neighborly trust and neighborly networks of the group who walked for shopping were higher than those who did not walk, but the difference was not significant. Table 8 also showed the results of the one-way ANOVA for checking the statistically significant difference in individual perceptions of social capital at the 5% level, according to whether the participants walked. Figure 2a,b depicted the difference in trust level between those who did and did not walk according to overall and leisure walking purposes.
As a result of the analysis, it was found that there was no statistically significant difference in the level of general trust according to whether people walked for all walking purposes.
The results of the analysis on the neighborly trust variable showed that there was a difference according to the walking experiences for overall and leisure purposes. In the case of shopping walking, there wasn’t a statistically significant difference of the level of neighborly trust. Both of leisure and shopping walking are ones of discretionary walking, but people who walk for shopping are more objective than those who walk leisurely. Therefore, leisure walking experience tend to be more influential to the level of neighborly trust than shopping walking.
The results of the analysis on the neighborly network variable showed that there was a statistically significant difference according to walking experiences for only leisure purposes. It means that people who walked for leisure purposes have more interaction with neighbors than those who did not.
4.3. Correlations between Walking Experience and Individual Perceptions of Social Capital Using Linear Regression Model
Analysis results of correlations between walking experience and individual perception of social capital in neighborhood area for a full sample of 591 are shown in Table 9. The reason to adopt OLS linear regression model was to figure out a direction of correlation between walking experiences and the individual perceptions of social capital. Since the previous results of one-way ANOVA showed statistically significant differences for neighborly trust and neighbor size as indicators of individual perceptions of social capital, total four linear models with two models each for neighborly trust and neighbor size were considered. In the linear model of neighborly trust and neighbor size, socio-economic characteristics such as the residence period, gender, job, age, income level, marital status, housing type, and religion were set as confounding variables. The dummy variables of overall walking and leisure walking in the past seven days were set as verification variables which correlated with indicators of social capital.
The linear model with overall walking suggested that the variables explained about 6.3% of the neighborly trust and the model with leisure walking suggested about 5.9% of the trust. In both models, people who walked more than at least ten minutes showed a higher level of neighborly trust than people who did not walk at all in their neighborhood area: p-value was less than 1% significant level for total walking experience and the p-value was less than a 5% significance level for leisure walking experience. On the other hand, the linear model with overall walking suggested that the variables explained about 5.4% of the neighbor network size and the model with leisure walking suggested about 6.9% of the neighbor network size. In the case of neighbor network size, leisure walking experience was only a statistically significant variable. People who walked more than at least ten minutes for leisure had more neighbors than people who did not walk at all in their neighborhood area: the p-value was a less than 1% significance level for leisure walking experience.
This analysis confirms the directionality of the correlation between walking and social capital perceptions, which could be not verified in the previous one-way ANOVA. People who walked more than ten minutes for any purpose in their neighborhood have a higher level of trust in their neighbors than those who did not. The level of trust in neighbors was also found to be significant not only for leisure walking but also walking itself. On the other hand, the number of communicating neighbors increased when people walked for leisure purposes in neighborhood areas. The walking experience in neighborhood areas increased the level of trust in neighbors, which can be understood as an increase of the level of neighborly trust at the individual level without the social event. On the other hand, the results of the neighbor size model can be interpreted that the number of neighbors is related depending on the purpose of walking. This result indicates that in order to increase the social exchange of people themselves, it is necessary to create an urban environment that encourages walking for leisure purposes.
4.4. Differences in Trust Level According to Walking Behavior Characteristics
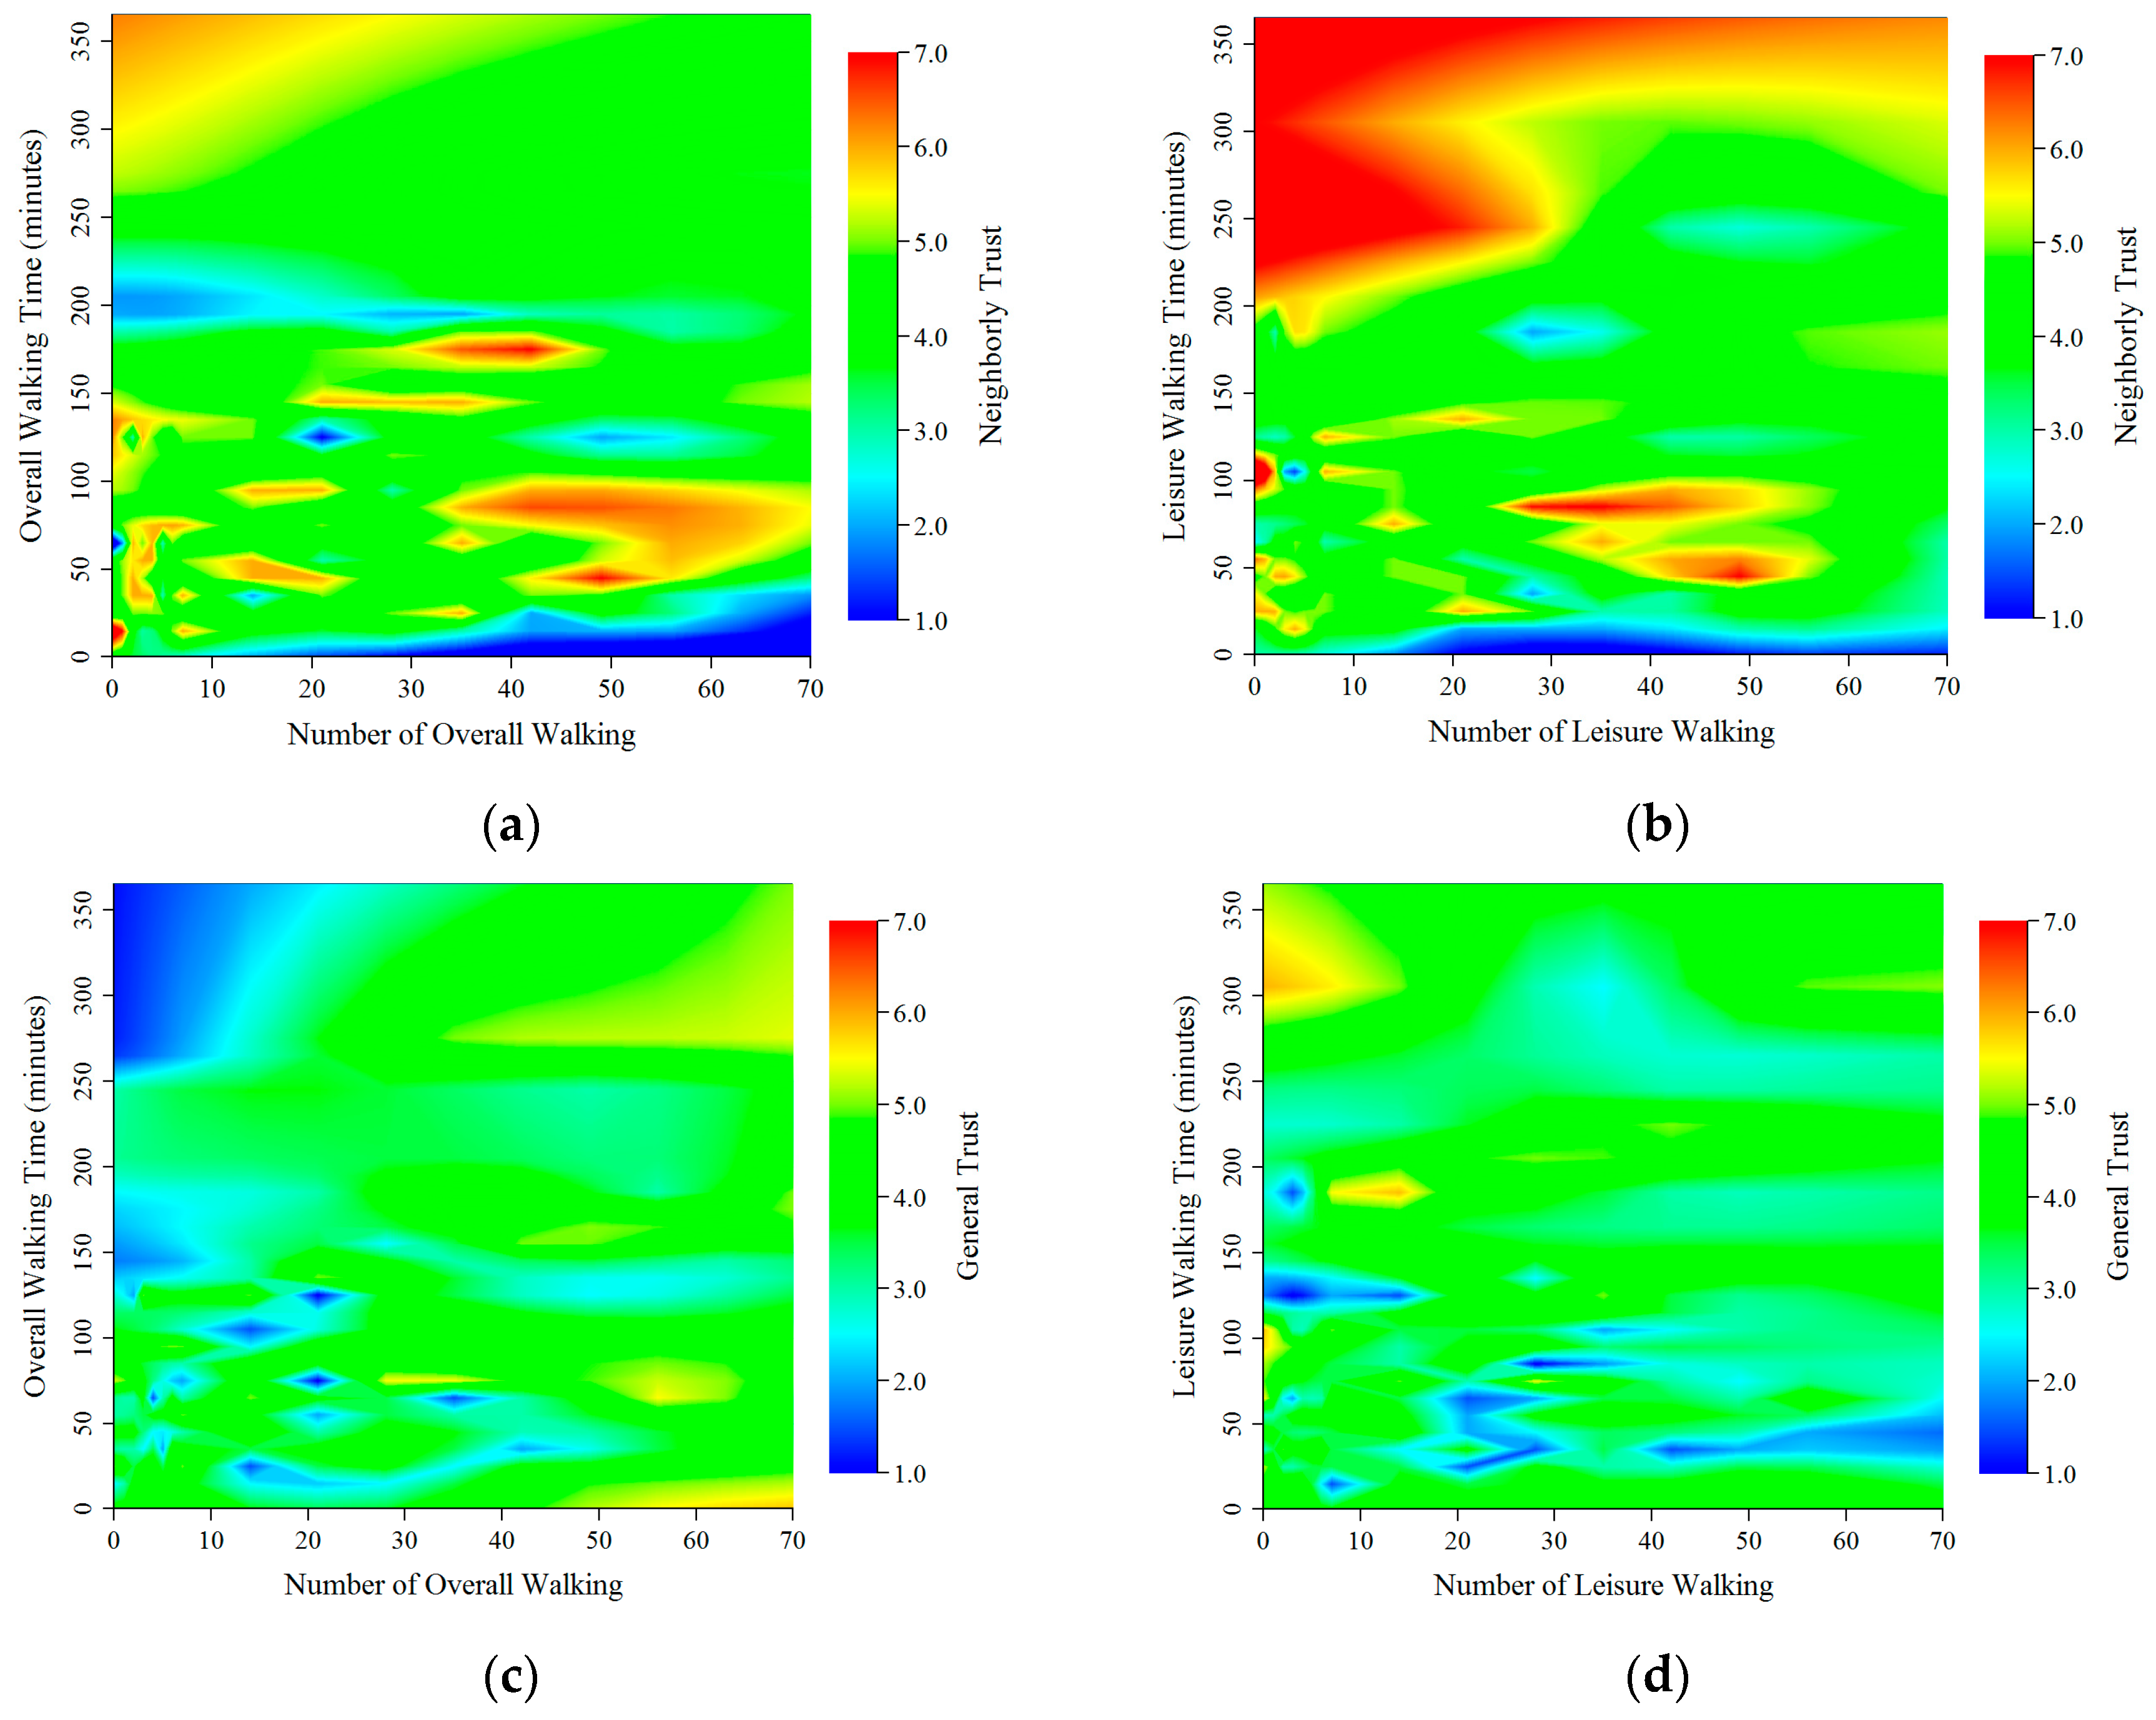
Figure 3a,b showed the level of neighborly trust, and Figure 3c,d showed the level of general trust of those who walked in total and who experienced leisure walking, respectively. The x-axis was the number of walking, and the y-axis was the walking duration. As described above, because the distributions of the walking frequencies and durations were right-skewed, it was difficult to analyze the linear relationship between the level of trust and the level of walking. For this reason, we assumed that the level of walking was described by the plane of the number and the duration of walking experiences, and the trust variables were plotted on that plane. Through this process, the nonlinear relationship between the level of walking and the level of trust could be explored.
The results showed that the nonlinear relationship between the level of walking for leisure purposes and neighborly trust was the most significant. The greater the walking time for leisure purposes, the greater the level of neighborly trust, but such a relationship was not clear when the number of walking experiences was high. This is because if walking time is constant, the possibility of building a relationship with a neighbor in a single walking experience becomes lower as the number of walking experiences increases.
On the other hand, when walking time is not sufficient, it can be seen that as the number of walking increases, the neighborly trust can both increase and decrease. This is because the relationship between the number of walking and duration is random. In order to find more clear evidence, it is necessary to deepen the study considering the nonlinear relationship between the number of walking experience, the walking duration, and trust in neighbors.
In the case of overall walking, it also showed a similar tendency to that of leisure walking. However, a nonlinear relationship is not apparent compared to leisure walking because it includes information about walking for other purposes.
The results for the general trust variables were weaker than those for the neighborly trust variables. The level of general trust increases along with increasing walking duration and the number of walking, but the relationship showed a random or opposite tendency depending on the section. The absolute level of trust was also lower than that of the neighborly trust. These results were in line with the results of the one-way ANOVA and OLS regression models.
5. Discussion
We conducted an online-survey to examine the relationship between walking experience in neighborhoods and individual perceptions of social capital. The number and duration of their walking experiences that were over ten minutes in the past a week in their neighborhoods were measured. At the same time, the level of general trust, neighborly trust, and the neighborly network were measured as individual perceptions of social capital indicators. Based on the survey data, the characteristics of walking behaviors according to purpose, gender, and age were examined, and the differences in perceptions of social capital levels according to an individual walking level were analyzed.
The main results of this study are summarized as follows. The level of neighborly trust and the neighborly network of people who experienced leisure walking were higher than those who did not. However, there was no difference in the level of individual perceptions of social capital between people who walked for shopping and people who did not.
The results of this study showed the importance of walkable environments in social capital formation in neighborhoods, like those of Leyden [30] and Rogers et al. [31]. These results can be interpreted in the same context as the claims of Jarema et al. [32], which indicate that while walking in the neighborhood, the frequency of chance encounters increases, and then these chance encounters create social ties and lead to higher levels of social capital.
We verified the relationship between walking and individual perceptions of social capital, and our results can contribute to extending the discussions of Leyden [30], and Rogers et al. [31] regarding which walkable environment is effective for improving social interactions and which types of social capital are achieved by making walkable spaces. Because the approaches of Leyden [30] and Rogers et al. [31] focused on the physical environments of walkable neighborhoods, their results did not prove that actual walking behaviors lead to individual perceptions of social capital, and they have limitations regarding which types of walking are closely related to social capital.
We can now think about what kind of walking environment can be helpful for social function on the streets, based on the results of this study. We found that the people who had walked for leisure had higher levels of neighborly trust and neighborly networks than those who did not. This result implies that the possibility of chance encounters between people increases in leisure-walking-friendly neighborhoods and it can be associated with improvements in the level of individual perceptions of social capital. This argument is in line with the importance of triangulation proposed by W. Whyte [33], which is one of the key elements in increasing the possibility of human interaction in public spaces. Walking quickly or walking to a fixed destination is not likely to lead to a chance encounter in open spaces, as argued by Whyte [33] and Gehl [34]. In this context, it also can be explained why the different results are derived in shopping walking model as compared with leisure walking model, though shopping walking is classified as a recreational purpose like leisure walking. Shopping walking is more likely to have fixed destinations than leisure walking, so the discretion of shopping walking will be lower than leisure walking.
The results of this study imply that the possibility of this chance encounter leads to the interchange of neighbors and forming a neighborly trust. Neighborhood interchanges and neighborly trust ultimately can contribute to the formation of various types of social capital. Therefore, it is very important to create leisure-walking-friendly neighborhood environments for socially interactive cities. This claims can also be linked to various urban issues. For example, a change of microclimatic conditions of public spaces might be one of the urban issues. In recent years, climate change is one of the international issues and is predicted to dramatically change microclimatic conditions in neighborhood areas in South Korea: It is expected to be hotter in summer and colder in winter. If any, this change might reduce the opportunity for a chance encounter connected to social ties by making the micro-climate of urban streets unfriendly to outdoor activities. It is thought that creating a micro-climate friendly spaces for leisure walking purposes—such as making urban streets sunny, planting trees, establishing fountains, and providing shelter from cold winds—is very closely related to improving leisure walking. In other words, it is necessary to contemplate various urban design techniques that can encourage people to walk for leisure.
In the future, there is a need for more interest and empirical research about the effects of walking on social functions, such as interactions between people, as well as health- and energy-saving effects. In this study, we used general and neighborly trust and neighborly network variables as social capital indicators, but it is also necessary to consider the walking itself and walking environment as important factors in social function recoveries, such as mental health and social interaction enhancement.
6. Conclusions
This study began with the question of whether the loss of social functioning, which is one of problems in car-oriented cities, can be restored by encouraging walking. While the previous studies on walking have been mainly focused on issues such as healthy cities, commercial activation, and energy saving, the purpose of this study was to find empirical evidence from a new perspective on the relationship between walking and social function. Therefore, the results of this study are meaningful in that this study showed the correlations between walking experiences and social capital. This study also indicated that social functions can be restored by making streets and urban spaces suitable for leisure activities rather than just walking for movement.
Acknowledgments
This research was supported by the Basic Science Research Program through the National Research Foundation of Korea (NRF) funded by the Ministry of Education (NRF-2015R1D1A1A01060650).
Author Contributions
Heechul Kim and Seungho Yang conceived and designed the study; Heechul Kim and Seungho Yang performed the data collection; Heechul Kim analyzed the data and discussed the implications; Heechul Kim and Seungho Yang wrote the paper.
Conflicts of Interest
The authors declared no potential conflicts of interest with respect to the research, authorship, and/or publication of this article.
References
- Kim, H.; Ahn, K.; Kwon, Y. The effect of residential environmental factors on personal walking probability—Focused on seoul. J. Urban Des. Inst. Korea 2014, 15, 5–18. [Google Scholar]
- Seoul Metropolitan Government. Seoul Traffic Vision 2030. Available online: http://english.seoul.go.kr/policy-information/traffic/seoul-traffic-vision-2030/ (accessed on 9 April 2017).
- Ewing, R.; Cervero, R. Travel and the built environment. J. Am. Plan. Assoc. 2010, 76, 265–294. [Google Scholar] [CrossRef]
- Giles-Corti, B.; Vernez-Moudon, A.; Reis, R.; Turrell, G.; Dannenberg, A.L.; Badland, H.; Foster, S.; Lowe, M.; Sallis, J.F.; Stevenson, M. City planning and population health: A global challenge. Lancet 2016, 388, 2912–2924. [Google Scholar] [CrossRef]
- Carmona, M. Public Places, Urban Spaces: The Dimensions of Urban Design; Routledge: Abingdon, UK, 2010. [Google Scholar]
- Krizek, K.J.; Handy, S.L.; Forsyth, A. Explaining changes in walking and bicycling behavior: Challenges for transportation research. Environ. Plan. B Plan. Des. 2009, 36, 725–740. [Google Scholar] [CrossRef]
- R Core Team. The R Foundation for Statistical Computing. Available online: https://www.R-project.org/ (accessed on 9 April 2017).
- StataCorp. Stata Statistical Software: Release 12; StataCorp LP: College Station, TX, USA, 2011. [Google Scholar]
- Oh, S.; Namgung, J. Pedestrian City: 12 Guidelines for Better Pedestrian Environment; Architecture & Urban Research Institute: Sejong-si, Korea, 2011. [Google Scholar]
- Cervero, R.; Kockelman, K. Travel demand and the 3ds: Density, diversity, and design. Transp. Res. D Transp. Environ. 1997, 2, 199–219. [Google Scholar] [CrossRef]
- Lee, C.; Moudon, A.V. Physical activity and environment research in the health field: Implications for urban and transportation planning practice and research. J. Plan. Lit. 2004, 19, 147–181. [Google Scholar] [CrossRef]
- Doyle, S.; Kelly-Schwartz, A.; Schlossberg, M.; Stockard, J. Active community environments and health: The relationship of walkable and safe communities to individual health. J. Am. Plan. Assoc. 2006, 72, 19–31. [Google Scholar] [CrossRef]
- Ewing, R.; Schmid, T.; Killingsworth, R.; Zlot, A.; Raudenbush, S. Relationship between urban sprawl and physical activity, obesity, and morbidity. Am. J. Health Promot. 2003, 18, 47–57. [Google Scholar] [CrossRef] [PubMed]
- Frank, L.D.; Engelke, P. Multiple impacts of the built environment on public health: Walkable places and the exposure to air pollution. Int. Reg. Sci. Rev. 2005, 28, 193–216. [Google Scholar] [CrossRef]
- Smith, K.R.; Brown, B.B.; Yamada, I.; Kowaleski-Jones, L.; Zick, C.D.; Fan, J.X. Walkability and body mass index: Density, design, and new diversity measures. Am. J. Prev. Med. 2008, 35, 237–244. [Google Scholar] [CrossRef] [PubMed]
- Saelens, B.E.; Handy, S.L. Built environment correlates of walking: A review. Med. Sci. Sports Exerc. 2008, 40, S550. [Google Scholar] [CrossRef] [PubMed]
- Tocqueville, A.H.C.C. Democracy in America, tr. by H. Reeve; Saunders and Otley: London, UK, 1835. [Google Scholar]
- Wilson, P.A. Building social capital: A learning agenda for the twenty-® first century. Urban Stud. 1997, 34, 745–760. [Google Scholar] [CrossRef]
- Ko, E. Effect of Neighborhood Environments on Social Diversity and Residents’ Social Capital: A case study of Seoul. Ph.D. Thesis, Seoul National University, Seoul, Korea, 2014. [Google Scholar]
- Bourdieu, P. The forms of capital (1986). In Cultural Theory: An Anthology; Wiley-Blackwell: Malden, MA, USA, 2011; pp. 81–93. [Google Scholar]
- Kleinhans, R.; Priemus, H.; Engbersen, G. Understanding social capital in recently restructured urban neighbourhoods: Two case studies in rotterdam. Urban Stud. 2007, 44, 1069–1091. [Google Scholar] [CrossRef]
- Coleman, J.S.; Coleman, J.S. Foundations of Social Theory; Harvard University Press: Cambridge, MA, USA, 1994. [Google Scholar]
- Fukuyama, F. Trust: The Social Virtues and the Creation of Prosperity; JSTOR: New York, NY, USA, 1995. [Google Scholar]
- Putnam, R.D. Bowling Alone: The Collapse and Revival of American Community; Simon and Schuster: London, UK, 2001. [Google Scholar]
- Yang, S.; Kim, S.; Ahn, K.; Kown, Y. Effects of spatial polarization of income on residents’ social capital. J. Urban Des. Inst. Korea 2014, 15, 19–32. [Google Scholar]
- Lin, N. Social Capital: A Theory of Social Structure and Action; Cambridge University Press: Cambridge, UK, 2002; Volume 19. [Google Scholar]
- Wen, M.; Kandula, N.R.; Lauderdale, D.S. Walking for transportation or leisure: What difference does the neighborhood make? J. Gen. Intern. Med. 2007, 22, 1674–1680. [Google Scholar] [CrossRef] [PubMed]
- Mendes de Leon, C.F.; Cagney, K.A.; Bienias, J.L.; Barnes, L.L.; Skarupski, K.A.; Scherr, P.A.; Evans, D.A. Neighborhood social cohesion and disorder in relation to walking in community-dwelling older adults a multilevel analysis. J. Aging Health 2009, 21, 155–171. [Google Scholar] [CrossRef] [PubMed]
- Wood, L.; Frank, L.D.; Giles-Corti, B. Sense of community and its relationship with walking and neighborhood design. Soc. Sci. Med. 2010, 70, 1381–1390. [Google Scholar] [CrossRef] [PubMed]
- Leyden, K.M. Social capital and the built environment: The importance of walkable neighborhoods. Am. J. Public Health 2003, 93, 1546–1551. [Google Scholar] [CrossRef] [PubMed]
- Rogers, S.H.; Halstead, J.M.; Gardner, K.H.; Carlson, C.H. Examining walkability and social capital as indicators of quality of life at the municipal and neighborhood scales. Appl. Res. Qual. Life 2011, 6, 201–213. [Google Scholar] [CrossRef]
- Jarema, P.; Halstead, J.; Conway, K. In Civic engagement and land use policy change: Does social capital affect ecosystem service flows. In Proceedings of the 2009 Northeast Agriculture and Resource Economics Annual Conference, Burlington, VT, USA, 7–9 June 2009; pp. 7–9. [Google Scholar]
- Whyte, W.H. The Social Life of Small Urban Spaces; Conservation Foundation: Washington, DC, USA, 1980. [Google Scholar]
- Gehl, J. Life between Buildings: Using Public Spaces; Van Nostrand Reinhold: New York, NY, USA, 1987. [Google Scholar]
Figure 1.
The conceptual framework of the association between walking experience and social capital: Starred variables will be considered for linear regression models.
Figure 1.
The conceptual framework of the association between walking experience and social capital: Starred variables will be considered for linear regression models.
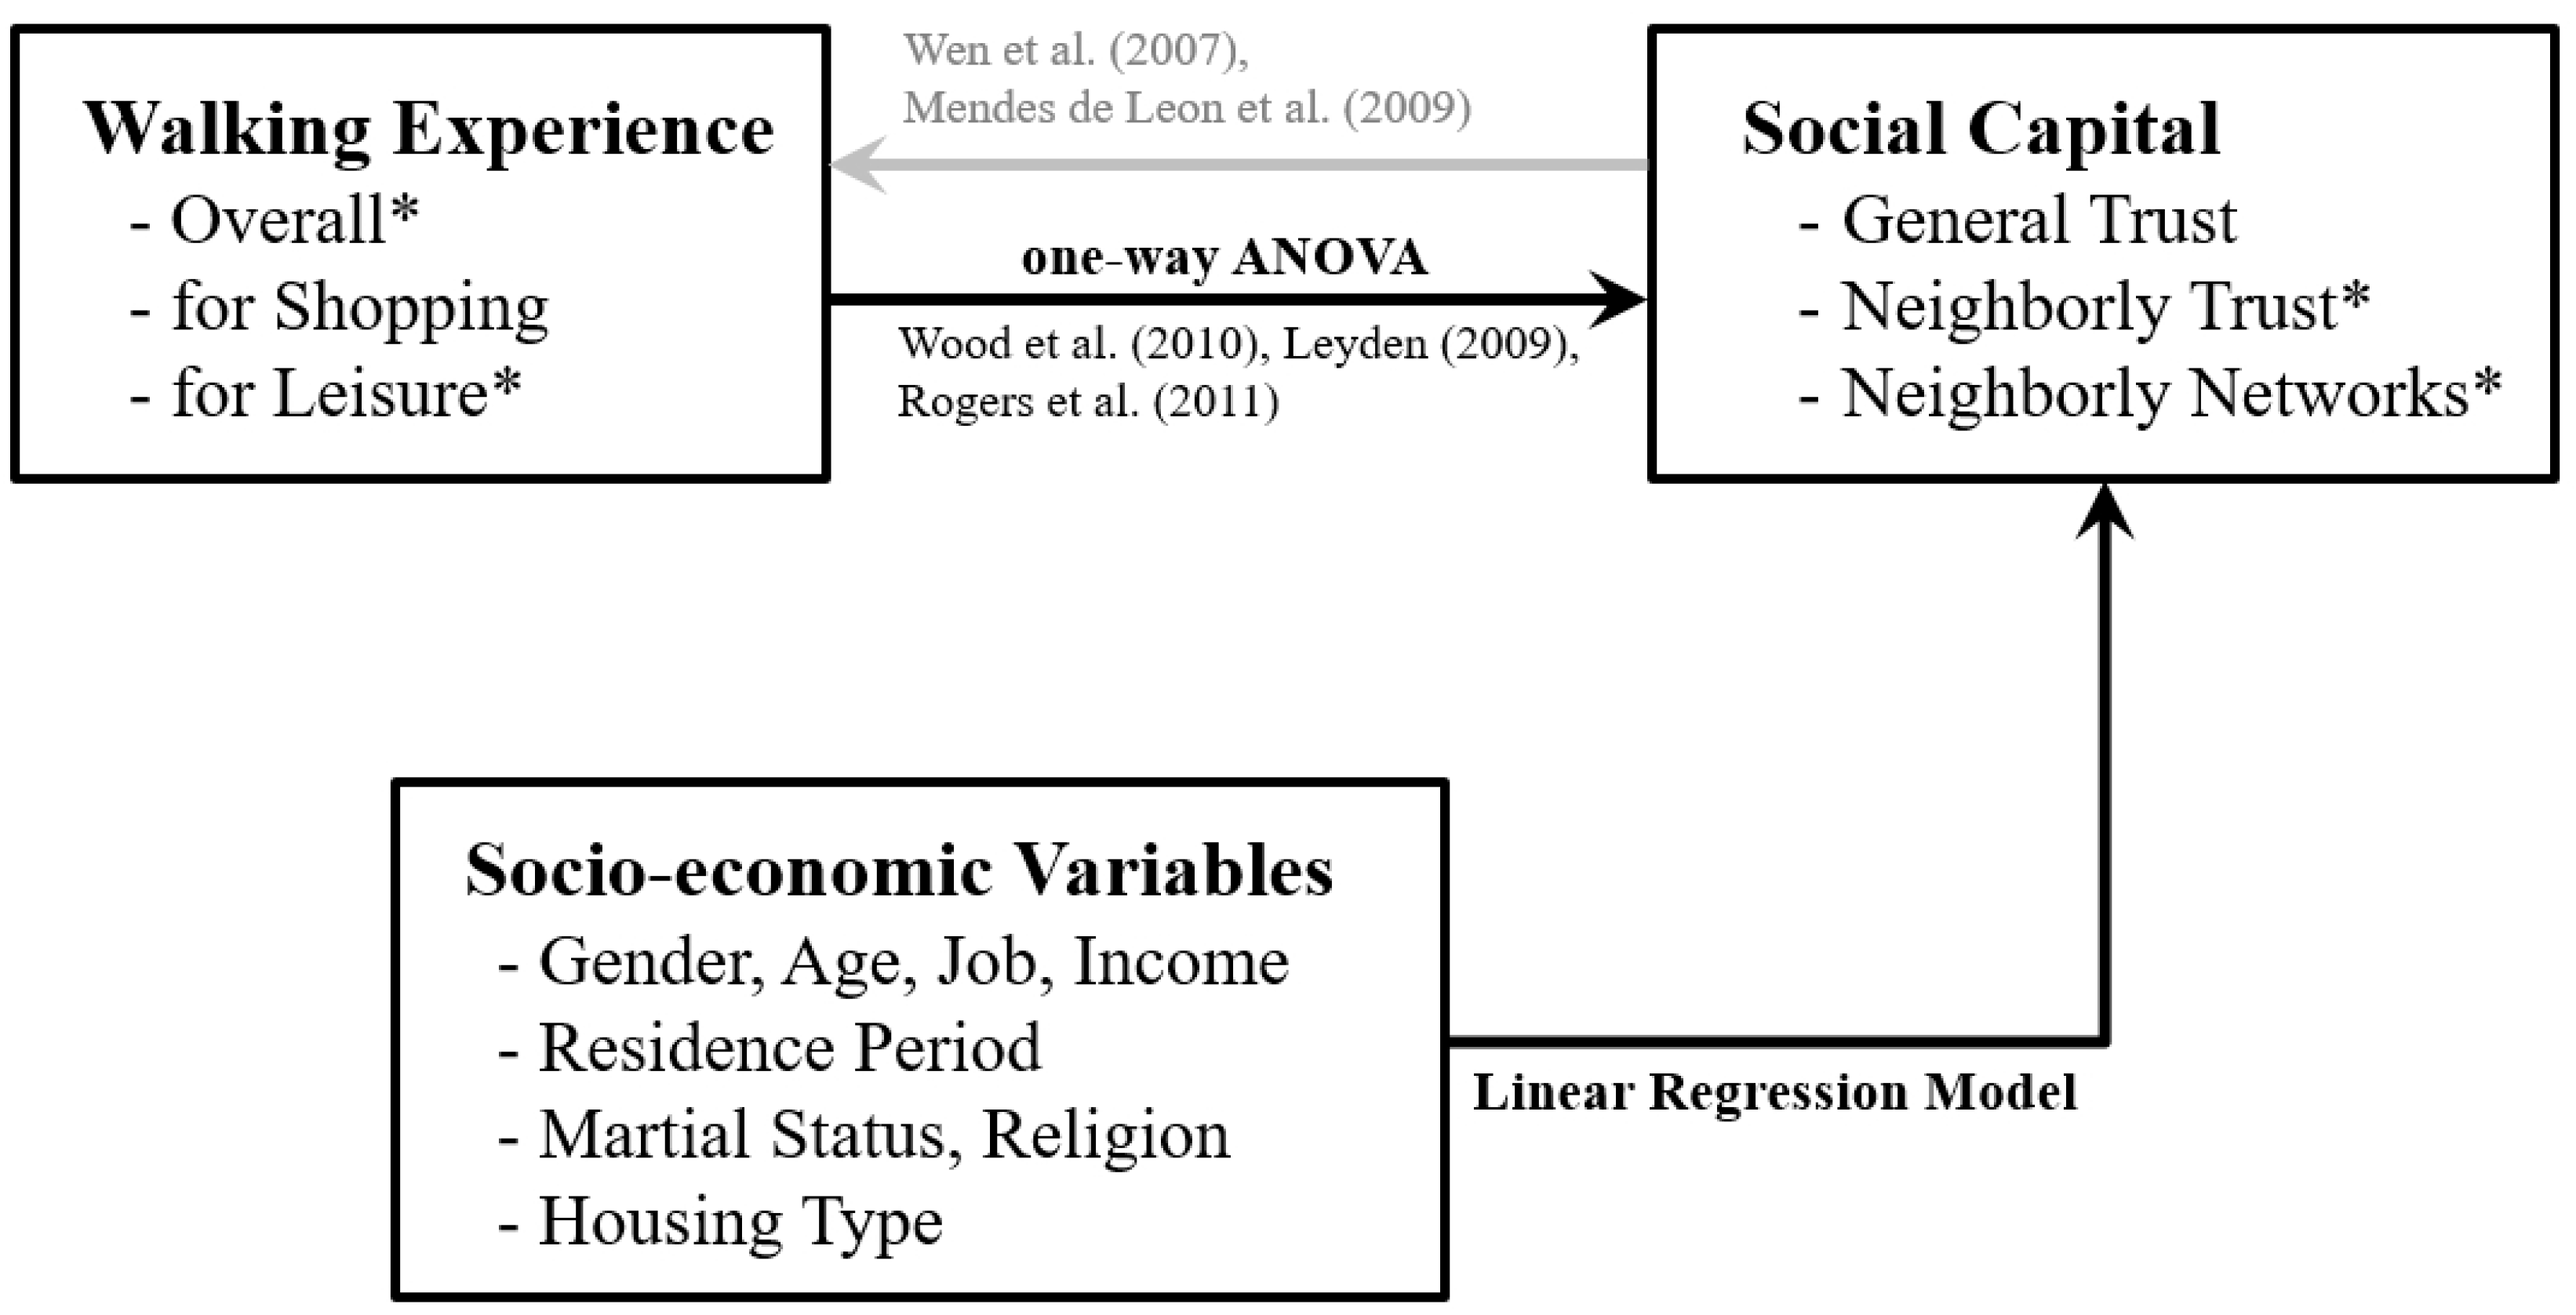
Figure 2.
(a) Difference in the trust level according to overall walking experience. (b) Difference in the trust level according to leisure walking experience.
Figure 2.
(a) Difference in the trust level according to overall walking experience. (b) Difference in the trust level according to leisure walking experience.
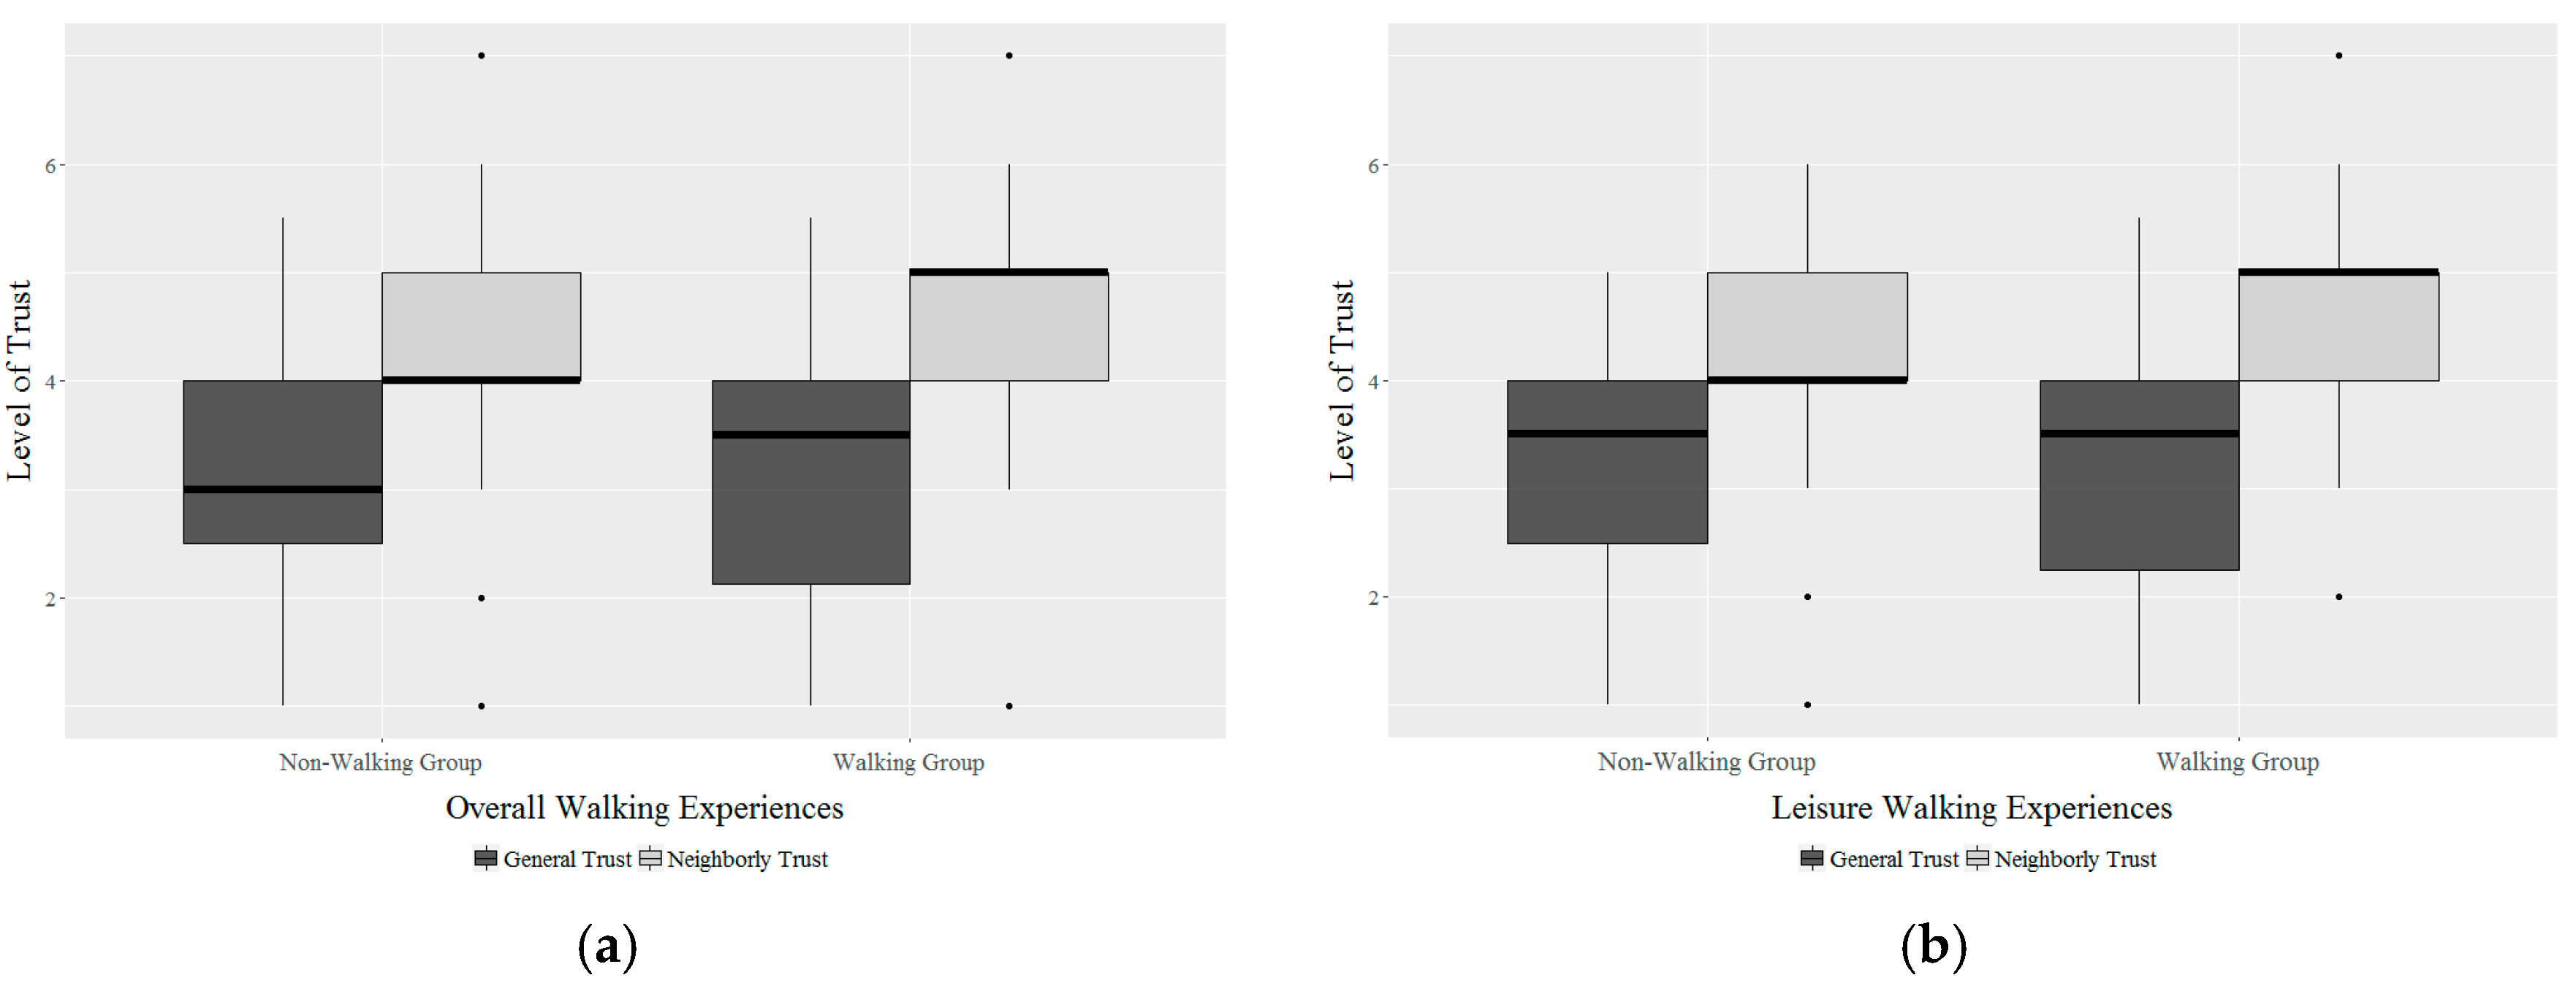
Figure 3.
(a) Relationship between overall walking behavior characteristics and neighborly trust; (b) Relationship between leisure walking behavior characteristics and neighborly trust; (c) Relationship between overall walking behavior characteristics and general trust; (d) Relationship between leisure walking behavior characteristics and general trust.


Table 1.
General information of survey respondents.
| Category | Characteristics | Frequency (Person) | Ratio (%) |
|---|---|---|---|
| Gender | Male | 304 | 51.4 |
| Female | 287 | 48.6 | |
| Age | 20s | 156 | 26.4 |
| 30s | 225 | 38.1 | |
| 40s | 137 | 23.2 | |
| 50s | 62 | 10.5 | |
| 60s | 11 | 1.9 | |
| Marital status | Married | 343 | 58.0 |
| Unmarried | 248 | 42.0 | |
| Occupation | Labor | 11 | 1.9 |
| Housekeeper | 63 | 10.7 | |
| Professional | 387 | 65.5 | |
| Sale service | 39 | 6.6 | |
| Student | 56 | 9.5 | |
| Other | 35 | 5.9 | |
| Monthly income | Less than $1000 | 16 | 2.7 |
| $1000–$2000 | 46 | 7.8 | |
| $2000–$3000 | 91 | 15.4 | |
| $3000–$4000 | 116 | 19.6 | |
| $4000–$5000 | 101 | 17.1 | |
| $5000–$6000 | 94 | 15.9 | |
| $6000–$7000 | 58 | 9.8 | |
| More than $7000 | 69 | 11.7 | |
| Housing type | Apartment | 309 | 52.3 |
| Other | 282 | 47.7 |
Table 2.
Composition of the questionnaire.
| Category | Contents | Connected Variables |
|---|---|---|
| Social capital indicators | How much do you trust your neighbors? (seven-point scale) | Neighborly trust |
| How much do you trust strangers? (seven-point scale) | General trust | |
| Do you trust people overall? (seven -point scale) | ||
| How many neighbors can you open your mind to or ask for help? | Neighborly networks | |
| Walking indicators | How many times did you walk in the neighborhood for at least ten minutes? | Total walking experiences |
| How many minutes did you walk in the neighborhood when walking for at least ten minutes? | ||
| How many times did you walk for shopping in the neighborhood for at least ten minutes? | Shopping walking experiences | |
| How many minutes did you walk for shopping in the neighborhood when walking for at least ten minutes? | ||
| How many times did you walk for leisure in the neighborhood for at least ten minutes? | Leisure walking experiences | |
| How many minutes did you walk for leisure in the neighborhood when walking for at least ten minutes? |
Table 3.
Walking experiences by purpose (person).
| Walking Purpose | Overall | Leisure | Shopping |
|---|---|---|---|
| Experienced | 532 | 485 | 491 |
| Did not experience | 59 | 106 | 100 |
| Total | 591 | 591 | 591 |
Table 4.
Walking level characteristics (minutes, times).
| Walking Behaviors | Mean | Median | SD | |
|---|---|---|---|---|
| Overall | Walking time | 55.36 | 45 | 46.67 |
| Number of walking | 14.29 | 14 | 13.27 | |
| Leisure | Walking time | 54.39 | 45 | 48.82 |
| Number of walking | 12.16 | 7 | 13.07 | |
| Shopping | Walking time | 51.16 | 32 | 45.93 |
| Number of walking | 9.46 | 7 | 10.75 | |
Table 5.
The number of samples by the number of walking and the duration.
| The Number of Walking | |||||||||
| Class | 0–10 | 11–20 | 21–30 | 31–40 | 41–50 | 51–60 | 70– | ||
| Leisure walking | 234 | 111 | 93 | 16 | 22 | 2 | 7 | ||
| Shopping walking | 300 | 105 | 60 | 9 | 10 | 5 | 2 | ||
| Walking Duration (Minutes) | |||||||||
| Class | 0–100 | 101–200 | 201–300 | 300– | |||||
| Leisure walking | 406 | 69 | 6 | 4 | |||||
| Shopping walking | 412 | 73 | 6 | 0 | |||||
Table 6.
Number and duration of walking experiences by gender, age, and walking purpose.
| Gender | Age | n | Overall | Shopping | Leisure | |||
|---|---|---|---|---|---|---|---|---|
| Number | Duration | Number | Duration | Number | Duration | |||
| Male | 20s | 53 | 18.358 | 59.434 | 11.566 | 55.094 | 15.906 | 50.849 |
| 30s | 118 | 15.703 | 55.212 | 10.627 | 51.314 | 13.568 | 52.924 | |
| 40s | 84 | 14.381 | 50.714 | 7.810 | 41.369 | 11.845 | 56.786 | |
| 50s | 40 | 13.125 | 66.500 | 7.975 | 48.000 | 12.125 | 73.250 | |
| 60s | 9 | 11.222 | 59.444 | 6.778 | 57.778 | 9.778 | 92.222 | |
| Female | 20s | 103 | 14.262 | 48.252 | 8.757 | 46.408 | 10.553 | 46.019 |
| 30s | 107 | 11.907 | 53.084 | 9.953 | 54.159 | 9.925 | 47.804 | |
| 40s | 53 | 11.981 | 63.585 | 8.170 | 58.962 | 10.528 | 56.792 | |
| 50s | 22 | 17.000 | 63.182 | 11.455 | 68.864 | 17.636 | 73.636 | |
| 60s | 2 | 17.500 | 95.000 | 17.500 | 65.000 | 38.500 | 95.000 | |
Table 7.
Differences in descriptive statistics due to the sampling process.
| Measurement Index | Raw Data (n = 591) | Sampling Data (n = 100) | |||||||
|---|---|---|---|---|---|---|---|---|---|
| Mean | SD | Min | Max | Mean | SD | Min | Max | ||
| Overall | No. of Walking | 14.3 | 13.3 | 0 | 70 | 7.4 | 12.0 | 0 | 70 |
| Time (minutes) | 55.4 | 46.7 | 0 | 365 | 48.7 | 40.5 | 0 | 205 | |
| Shopping | No. of Walking | 9.5 | 10.8 | 0 | 70 | 6.5 | 9.5 | 0 | 56 |
| Time (minutes) | 51.2 | 45.9 | 0 | 275 | 35.2 | 44.3 | 0 | 225 | |
| Leisure | No. of Walking | 12.2 | 13.1 | 0 | 70 | 7.8 | 10.5 | 0 | 49 |
| Time (minutes) | 54.4 | 48.8 | 0 | 365 | 37.8 | 38.3 | 0 | 165 | |
| General trust (seven-point scale) | 3.4 | 1.1 | 1 | 7 | 3.2 | 1.1 | 1 | 5.5 | |
| Neighborly trust (seven-point scale) | 4.5 | 1.1 | 1 | 7 | 4.4 | 1.2 | 1 | 7 | |
| Neighborly networks (No. of people) | 2.5 | 3.2 | 0 | 50 | 2.7 | 5.5 | 0 | 50 | |
Table 8.
Results of one-way ANOVA of ANOVA of social capital level difference by walk walking experience.
Table 8.
Results of one-way ANOVA of ANOVA of social capital level difference by walk walking experience.
| Social Capital | Walking Purpose | Bartlett’s Test | One-Way ANOVA | |||
|---|---|---|---|---|---|---|
| Pr (>) | Differences | F-Value | Pr (>F) | |||
| General trust | Overall | 0.763 | 0.382 | 0.13 | 0.319 | 0.574 |
| Shopping | 0.016 | 0.900 | 0.23 | 3.425 | 0.067 | |
| Leisure | 2.094 | 0.148 | −0.02 | 0.007 | 0.932 | |
| Neighborly trust | Overall | 1.889 | 0.169 | 0.54 ** | 5.176 | 0.025 |
| Shopping | 0.057 | 0.810 | −0.04 | 0.032 | 0.857 | |
| Leisure | 0.756 | 0.384 | 0.52 ** | 6.358 | 0.013 | |
| Neighborly networks | Overall | 28.907 | 0.000 | 0.84 | 0.571 | 0.452 |
| Shopping | 41.671 | 0.000 | −0.08 | 0.006 | 0.941 | |
| Leisure | 0.076 | 0.783 | 1.04 ** | 5.136 | 0.026 | |
** Significant at the 0.05 significance level; Differences meant the differences of average score which were calculated by subtracting score of those who didn’t walk from score of those who walked.
Table 9.
Results of Linear Regression Model.
| Walking Experiences & Confounding Variables | Model 1: Neighborly Trust | Model 2: Neighborly Trust | Model 3: Neighbor Size | Model 4: Neighbor Size | ||||||||||||
|---|---|---|---|---|---|---|---|---|---|---|---|---|---|---|---|---|
| coeff. | std.error | t-Value | Pr (>|t|) | coeff. | std.error | t-Value | Pr (>|t|) | coeff. | std.error | t-Value | Pr (>|t|) | coeff. | std.error | t-Value | Pr (>|t|) | |
| Walking in past seven days: Yes or No | ||||||||||||||||
| For overall walking | - | - | - | - | 0.398 | 0.148 | 2.685 | 0.007 *** | - | - | - | - | 0.563 | 0.439 | 1.282 | 0.200 |
| For leisure walking | 0.248 | 0.117 | 2.112 | 0.035 ** | - | - | - | - | 1.119 | 0.344 | 3.253 | 0.001 *** | - | - | - | - |
| Residence period (years) | 0.007 | 0.004 | 1.711 | 0.088 * | 0.008 | 0.004 | 1.763 | 0.078 * | 0.044 | 0.013 | 3.475 | 0.001 *** | 0.045 | 0.013 | 3.524 | 0.000 *** |
| Gender (men = 1, women = 0) | 0.238 | 0.101 | 2.364 | 0.018 ** | 0.260 | 0.100 | 2.593 | 0.010 *** | 0.859 | 0.295 | 2.913 | 0.004 *** | 0.920 | 0.297 | 3.096 | 0.002 *** |
| Job (reference = professional occupation) | ||||||||||||||||
| Labor | −0.471 | 0.336 | −1.400 | 0.162 | −0.400 | 0.336 | −1.190 | 0.234 | −1.110 | 0.986 | −1.126 | 0.261 | −0.950 | 0.995 | −0.955 | 0.340 |
| Housekeeper | 0.311 | 0.168 | 1.853 | 0.064 * | 0.324 | 0.168 | 1.934 | 0.054 * | 1.024 | 0.493 | 2.078 | 0.038 ** | 1.055 | 0.497 | 2.124 | 0.034 ** |
| Other | −0.376 | 0.194 | −1.937 | 0.053 * | −0.363 | 0.194 | 0.398 | 0.061 * | 0.489 | 0.569 | 0.860 | 0.390 | 0.429 | 0.573 | 0.749 | 0.454 |
| Sale service | 0.302 | 0.181 | 1.667 | 0.096 * | 0.300 | 0.181 | 1.659 | 0.098 * | 0.374 | 0.532 | 0.703 | 0.483 | 0.330 | 0.536 | 0.615 | 0.539 |
| Students | 0.289 | 0.183 | 1.583 | 0.114 | 0.238 | 0.181 | 1.313 | 0.190 | −0.407 | 0.535 | −0.761 | 0.447 | −0.612 | 0.536 | −1.142 | 0.254 |
| Age (reference = over 60) | ||||||||||||||||
| 20–29 | −0.325 | 0.364 | −0.892 | 0.373 | −0.260 | 0.364 | −0.715 | 0.475 | 2.123 | 1.067 | 1.990 | 0.047 ** | 2.230 | 1.077 | 2.070 | 0.039 ** |
| 30–39 | −0.247 | 0.344 | −0.717 | 0.474 | −0.194 | 0.345 | −0.562 | 0.574 | 1.147 | 1.010 | 1.135 | 0.257 | 1.158 | 1.021 | 1.135 | 0.257 |
| 40–49 | −0.332 | 0.345 | −0.963 | 0.336 | −0.276 | 0.345 | −0.800 | 0.424 | 0.583 | 1.013 | 0.576 | 0.565 | 0.647 | 1.023 | 0.633 | 0.527 |
| 50–59 | −0.149 | 0.357 | −0.417 | 0.677 | −0.105 | 0.356 | −0.294 | 0.769 | 1.208 | 1.046 | 1.154 | 0.249 | 1.327 | 1.054 | 1.258 | 0.209 |
| Income level (reference = under 2k dollar/month) | ||||||||||||||||
| 2k–4k | 0.143 | 0.158 | 0.907 | 0.365 | 0.174 | 0.158 | 1.097 | 0.273 | 0.907 | 0.464 | 1.957 | 0.051 * | 0.934 | 0.469 | 1.992 | 0.047 ** |
| 4k–6k | 0.247 | 0.164 | 1.503 | 0.133 | 0.280 | 0.164 | 1.705 | 0.089 * | 1.127 | 0.482 | 2.339 | 0.020 ** | 1.186 | 0.486 | 2.438 | 0.015 ** |
| Over 6k | 0.273 | 0.176 | 1.550 | 0.122 | 0.296 | 0.176 | 1.682 | 0.093 * | 1.350 | 0.517 | 2.613 | 0.009 *** | 1.340 | 0.522 | 2.567 | 0.011 ** |
| Marital status (married = 1, single = 0) | 0.119 | 0.111 | 1.078 | 0.282 | 0.117 | 0.111 | 1.062 | 0.289 | 0.745 | 0.325 | 2.290 | 0.022 ** | 0.738 | 0.328 | 2.251 | 0.025 ** |
| Housing type (APT = 1, non-APT = 0) | 0.083 | 0.094 | 0.878 | 0.380 | 0.085 | 0.094 | 0.908 | 0.364 | −0.155 | 0.276 | −0.562 | 0.574 | −0.168 | 0.278 | −0.605 | 0.545 |
| Religion (religious = 1, other = 0) | 0.243 | 0.092 | 2.652 | 0.008 *** | 0.271 | 0.091 | 2.986 | 0.003 *** | 0.360 | 0.269 | 1.341 | 0.181 | 0.476 | 0.268 | 1.773 | 0.077 * |
| Constant | 3.903 | 0.412 | 9.483 | <0.001 *** | 3.642 | 0.435 | 8.370 | <0.001 *** | −2.157 | 1.207 | −1.787 | 0.074 * | −1.896 | 1.289 | −1.471 | 0.142 |
(1) * significant at p < 0.1, ** significant at p < 0.05, *** significant at p < 0.01; (2) Model 1: R-squared = 0.087, Adjusted R-squared = 0.059, F-statistic = 3.045, degree of freedom = 572, Pr (>|F|) < 0.001, max of VIF = 2.308; (3) Model 2: R-squared = 0.092, Adjusted R-squared = 0.063, F-statistic = 3.211, degree of freedom = 572, Pr (>|F|) < 0.001, max of VIF = 2.297; (4) Model 3: R-squared = 0.098, Adjusted R-squared = 0.069, F-statistic = 3.441, degree of freedom = 572, Pr (>|F|) < 0.001, max of VIF = 2.308; (5) Model 4: R-squared = 0.084, Adjusted R-squared = 0.054, F-statistic = 2.900, degree of freedom = 572, Pr (>|F|) < 0.001, max of VIF = 2.290; (6) Number of Sample = 591.
© 2017 by the authors. Licensee MDPI, Basel, Switzerland. This article is an open access article distributed under the terms and conditions of the Creative Commons Attribution (CC BY) license (http://creativecommons.org/licenses/by/4.0/).
Share and Cite
MDPI and ACS Style
Kim, H.; Yang, S. Neighborhood Walking and Social Capital: The Correlation between Walking Experience and Individual Perception of Social Capital. Sustainability 2017, 9, 680. https://doi.org/10.3390/su9050680
AMA Style
Kim H, Yang S. Neighborhood Walking and Social Capital: The Correlation between Walking Experience and Individual Perception of Social Capital. Sustainability. 2017; 9(5):680. https://doi.org/10.3390/su9050680
Chicago/Turabian StyleKim, Heechul, and Seungho Yang. 2017. "Neighborhood Walking and Social Capital: The Correlation between Walking Experience and Individual Perception of Social Capital" Sustainability 9, no. 5: 680. https://doi.org/10.3390/su9050680
Note that from the first issue of 2016, this journal uses article numbers instead of page numbers. See further details here.