
Workers’ Age and the Impact of Psychological Factors on the Perception of Safety at Construction Sites

ErgoMechanics Laboratory Industrial and Management Engineering, Hanyang University, Ansan 426-791, Korea
*
Author to whom correspondence should be addressed.
Sustainability 2017, 9(5), 745; https://doi.org/10.3390/su9050745
Submission received: 27 February 2017
/
Revised: 26 April 2017
/
Accepted: 29 April 2017
/
Published: 4 May 2017
Abstract
:The safety of construction workers is always a major concern at construction sites as the construction industry is inherently dangerous with many factors influencing worker safety. Several studies concluded that psychological factors such as workload, organizational relationships, mental stress, job security, and job satisfaction have significant effects on workers’ safety. However, research on psychological factors that are characteristic of different age groups have been limited. The aim of this study was to examine the impact of psychological factors on the perception of worker safety for two different age groups. After an extensive literature review, different psychological factors were identified, and a hypothetical research model was developed based on psychological factors that could affect workers’ perception of safety. A survey instrument was developed, and data were collected from seven different construction sites in Pakistan. Structural equation modeling (SEM) was employed to test the hypothetical model for both age groups. The results revealed that workload and job satisfaction are significantly dominant factors on workers’ perception of safety in older workers, whereas organizational relationships, mental stress, and job security are dominant factors for younger workers at construction sites.
1. Introduction
The construction industry is considered as one of the riskiest industries because of its high frequency of work-related injuries and fatalities [1,2]. Internationally, a large number of deaths and injuries are reported in this industry that is 30–40% of all collective industries [3]. US Bureau of Labor Statistics also reported that 183,000 workers were injured and 775 workers died on construction sites in 2012, which makes a rate of 9.5 deaths per 100,000 workers [4]. The main factors that cause accidents are taking less safety measures during work and worker’s attitude towards safety [5]. Most of the work in the construction industry is uncertain and complex in nature. These differences affect the nature of work, worker’s behavior, critical site conditions, and safety management on construction sites, resulting in more accidents than in other industries [6].
The construction industry has a major impact on the health and safety of workers. In developing countries, it is considered the most important industry for contributing to the economy of the country [7]. Pakistan is a developing country and major construction development is going on across the country. According to the Federal Bureau Statistics report published in 2011, the construction industry of Pakistan employees 16% of the direct workforce and 30–40% of the indirect workforce of country in term of raw material, mechanical works, electrical works, plumbing works, wood works, HVAC, interior finishing etc. [8]. Pakistan has a high percentage of workers belonging to the construction industry. However, safety is neglected at construction sites, accidents are not regularly reported to the official government department, and statistics concerning these accidents are not maintained [9,10].
Accidents occur due to many factors. However, the majority of the time they are classified as a result of unsafe circumstances at job sites or the poor attitude of workers toward safety precautions [11,12]. Frequent causes of job accidents include the attitudes of workers, working conditions, working procedures, workload, job insecurity, job satisfaction, role clarity, and mental stress. Psychological factors can be explained as the interactions between a worker and the work environment, working conditions, workload, organizational relationships, co-workers, supervisors, and managers. Psychological factors have a strong relationship with the perception of personal safety and safety performance. Workers who are conscious of personal safety have fewer accidents than those who neglect safety [13]. Eighty percent of reported accidents occur as a result of poor worker behavior [14], and psychological factors are strongly related to worker attitude, perception towards safety, satisfaction, performance, commitment, and motivation [13], but are also related to worker organizations, supervisors, work environments, and organizational relationships [15]. Sawacha et al. [13] have explained that psychological factors include personal care, safety training, supervisor behavior, co-worker behavior, and the impacts of health and safety.
Worker safety issues are important [16], and a safety focus on construction sites is not common globally due to cultural differences, demographics, and regulations. Safety management systems are not extensively implemented in developing countries such as Pakistan [17]. Perception of worker safety and individual safety behavior is affected by demographic factors such as gender, age, experience, education, employment level, marital status, and number of dependents in family [18]. It was observed that the age of a worker and the risk of an accident are inversely related [19,20,21], possibly because older workers are more experienced, have good work knowledge, and better skills compared to younger workers [22]. Several studies revealed that psychological factors have significant effects on the perception of safety for workers at construction sites [13,23,24,25,26,27]. However, there is a lack of studies that investigates the effect of psychological factors on the perception of worker safety for different age groups of workers at construction sites. This study examined the impact of psychological factors on the perception of worker safety for two different age groups of construction workers.
2. Literature Review
Perception of worker safety is related to attitudes towards safety. Accident frequency is more related to workers’ attitude and behavior than to work experience or age. Choudhry and Fang [28] conducted research on accident victims at a construction site to investigate the causes of unsafe working behavior. They conducted in-depth interviews and obtained information about each accident, any resulting injuries as described by the worker, and the demographics of the participants. They concluded that older workers are more safety conscious and young workers face more accidents than older workers. Older workers are more experienced than younger workers, allowing them to be careful and confident in their work, which it reduces any contingency [29]. Butani [30] found a strong relationship between work experience and age. He concluded that old and young workers have the same accident rate, but the accident rate is different when they are categorized as experienced and inexperienced workers, with inexperienced workers having more accidents.
Siu, Phillips and Leung [23] examined the relationship between age and worker safety in terms of occupational injuries, accident rates, and perception of worker safety in the construction industry in Hong Kong. It was concluded that older workers are more safety conscious than younger workers. Older workers are more satisfied with their work and they always encourage general housekeeping and monitor safety equipment to avoid any kind of accident, damage or loss. This study found that age does not have a linear relationship with accidents, but it has a curvilinear effect on accidents, in which the frequency of accidents increased with age, and then decreased. It may be assumed that older workers are more confident and experienced in their work leading to fewer accidents. Studies of safety perceptions confirm that younger workers have a less positive attitude toward safety than older workers [31].
Gyekye and Salminen [32] used ANOVA to investigate the relationship between workers’ age and perception of safety. Their results revealed a positive relationship between age and perception of safety. Older workers had good perceptions of safety, fewer accidents, and were more flexible with safety procedures. Older workers had good working skills, organizational knowledge, and good safety procedure knowledge, which increases their confidence and job satisfaction [33]. Stoilkovska, et al. [34] used age as a moderate variable among workers of different sectors in the construction industry to find that how workers feel that how safety is important in their organization and how job satisfaction affects the perception of safety.
However, the issue of age and perception of safety is still under investigation because different studies have reported different results: Fredin, et al. [35], Buskin and Paulozzi [36], Ore and Stout [37], and Lowery, et al. [38] all found more accidents among older workers. Jackson and Loomis [21] found higher accident rates among younger workers, and Kisner and Fosbroke [39] found the same accident rates between younger and older workers. Still, it remains a question whether psychological factors have an impact on workers’ perception of safety in different age group of workers or not at construction sites. The aim of this study was to investigate the impact of psychological factors on the workers’ perception of safety for two different age group of workers at construction sites.
3. Research Approach and Construction of the Hypothetical Model
A survey based questionnaire was developed to obtain data from construction site workers. The first part of the questionnaire focused on demographics of workers and the second part consisted of 36 items based on psychological factors that may have an impact on the perception of worker safety in the construction industry (Appendix A). The response of each participant was recorded on a five-point Likert-type scale. All scales used in this study were adopted from previous research. Job satisfaction questions were adopted from Brayfield and Rothe [40] and Macdonald and Maclntyre [41], mental stress questions were adopted from Lovibond [42], workload questions were adopted from Caplan [43] and Rizzo, et al. [44], organizational relationship questions were adopted from Macdonald and Maclntyre [41] and Settoon and Mossholder [45], job security section was adopted from Hellgren, et al. [46], and questions related to workers’ perceptions of safety were adopted from Hayes, et al. [47]. These scales are extensively used in previous studies and it was confirmed that these all scales have good reliability in term of internal consistency and test-retest reliability [48,49,50,51,52,53,54,55,56].
The main objective of this research was to compare the effect of psychological factors for different ages of workers regarding their perception of safety in the construction industry. The first group was workers age 18–35 years old (Group-A). The second group was workers over 35 years of age (Group-B). Siu, Phillips and Leung [23] found 34.7 years to be the mean age of workers in the construction industry. Workers below this age are considered young workers, while those above 34.7 years of age are considered old workers. That is why workers were divided into two groups above and below 35 years of age in this study.
In order to find the impact of psychological factors on the perception of safety, the structural equation modeling (SEM) technique was used for this study. The purpose of using the SEM technique is to find the relationship between latent variables [57]. As SEM cannot find relationships between latent variables alone, theoretical observations and researcher judgment are very important for developing the hypothetical model [58]. For this type of comparison study between two groups, it is assumed that the measuring scale (e.g., questionnaire) and the construction of a hypothetical model (which is termed the baseline model) should be exactly the same for both groups [59]. After the development of the baseline model, the goodness of fit (GoF) is tested separately for both models (Group A and Group B). Once the recommended values of GoF are achieved for both models separately, further analysis was done for both models separately.
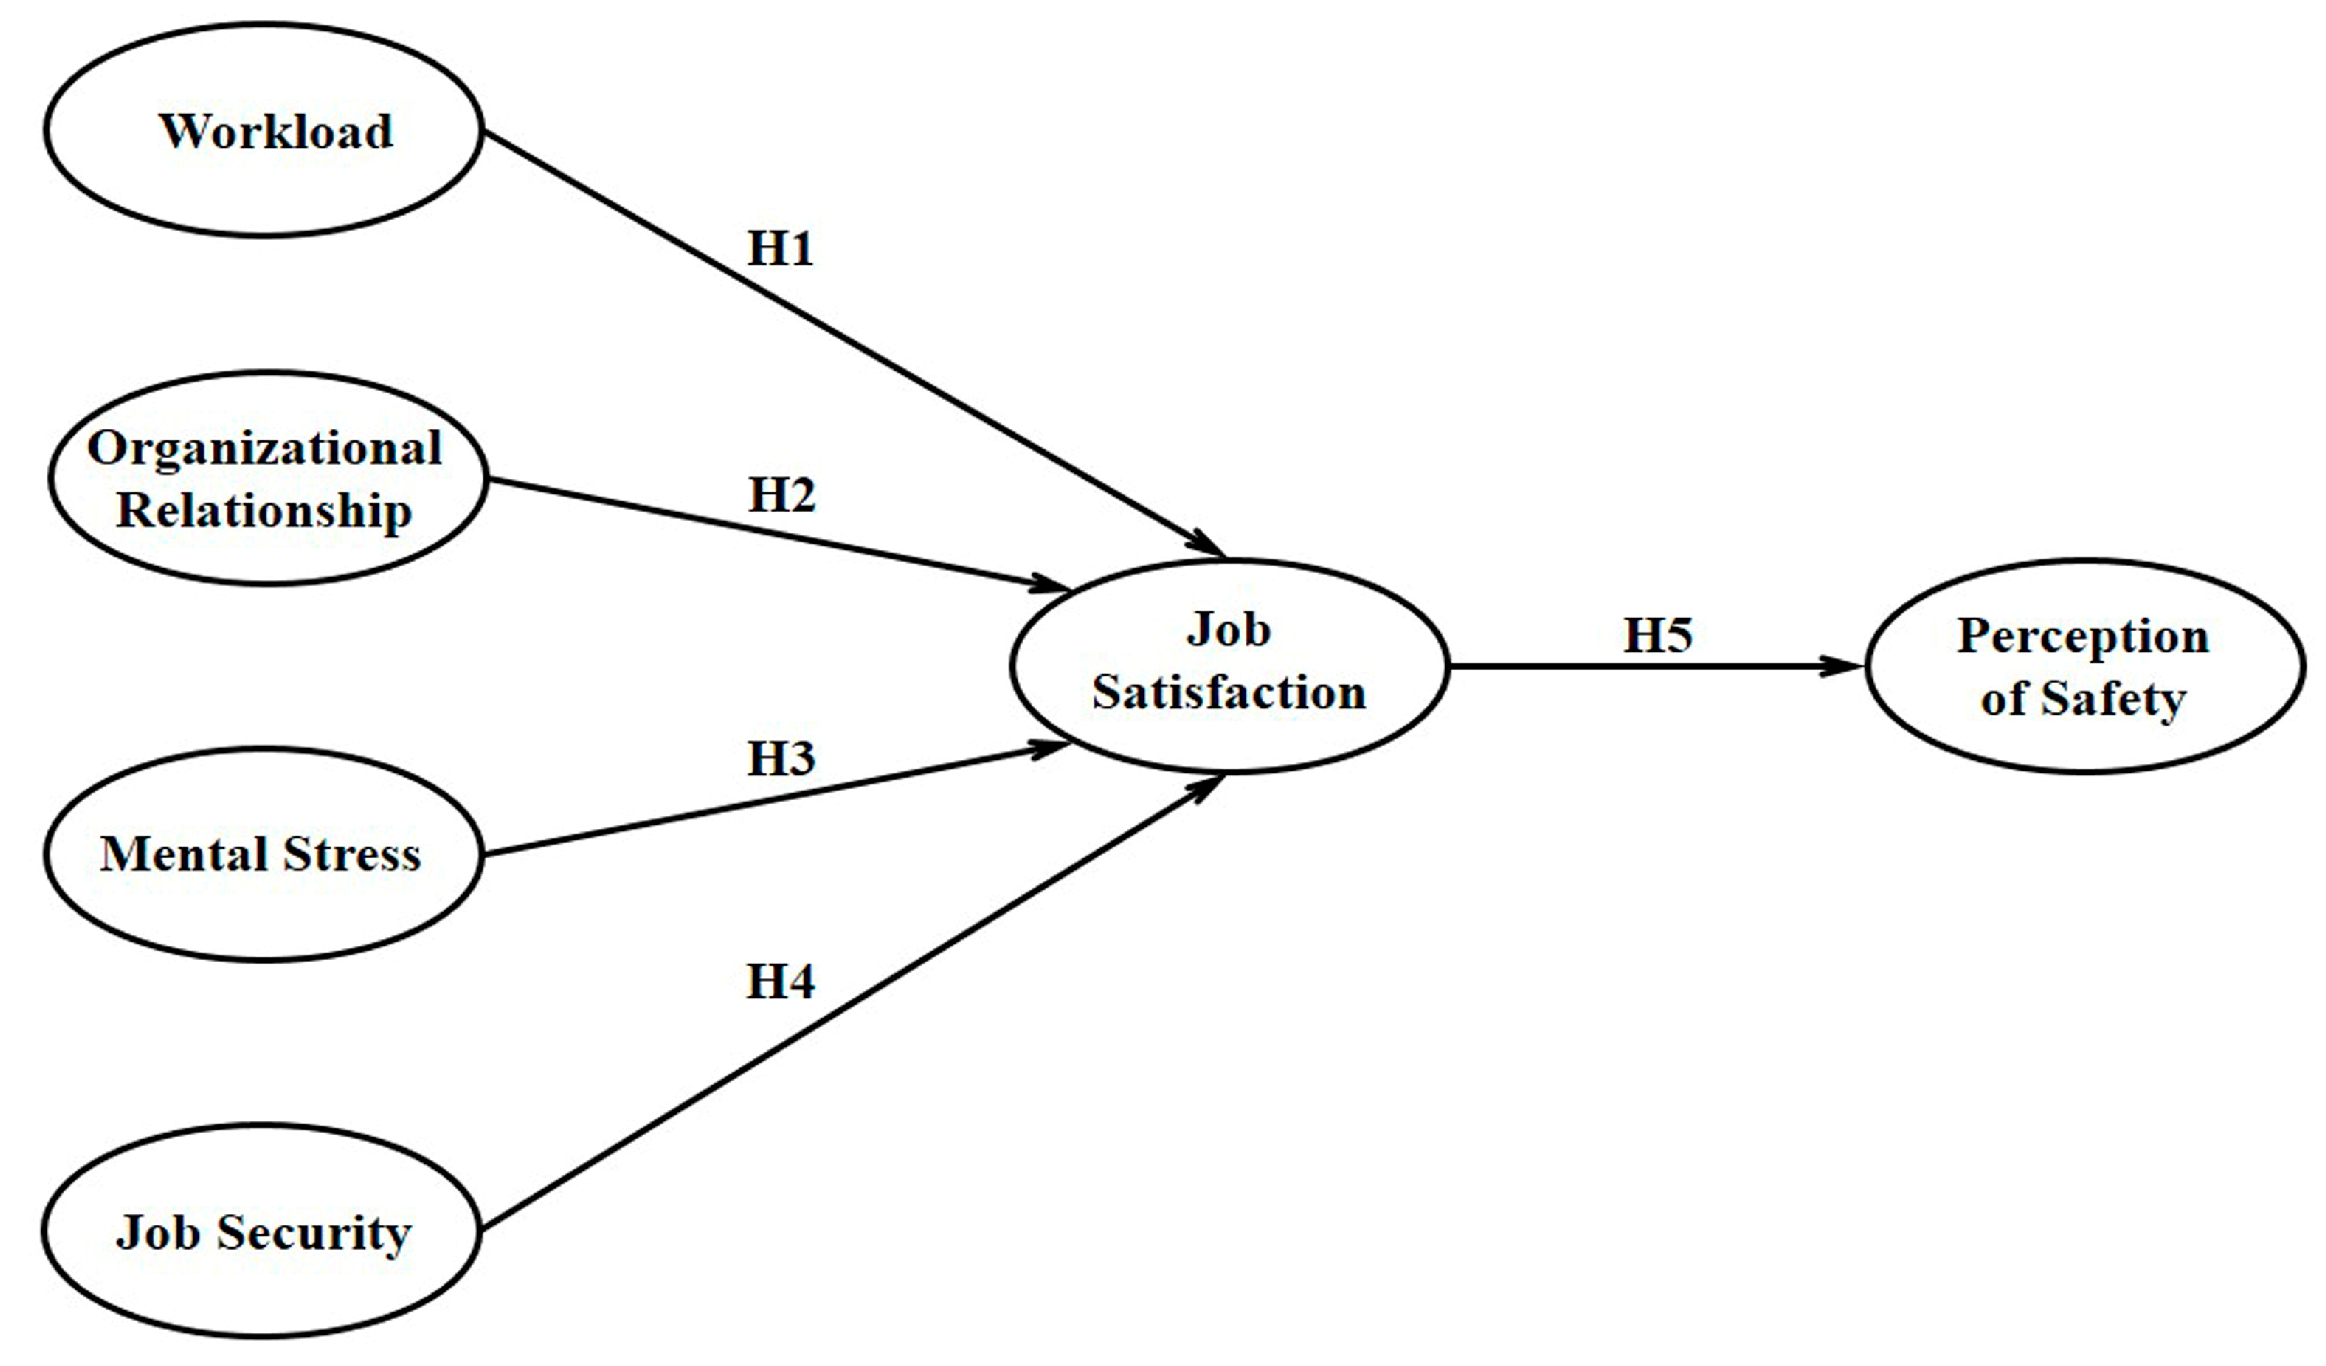
Psychological factors that could impact on the workers’ perception of safety at construction sites were selected and their relationships were hypothesized. Initially, the baseline hypothetical structural model was developed as explained by Hair et al. [60] to show the effect of psychological factors on the perception of safety as shown in Figure 1 (Indicators and error terms have been omitted; only latent variables and their relationships are shown here).
The constructs (latent variables) were selected based on psychological factors that could impact the perception of safety of workers at construction sites. The baseline hypothetical structural model included the five psychological factors as explained previously. It was hypothesized that these psychological factors have an impact on the perception of personal safety at construction sites, whether directly or indirectly. Based on previous studies, possible casual relationships among psychological factors and perception of safety were identified. It is hypothesized that workload, organizational relationships, mental stress, and job security have a direct effect on job satisfaction and an indirect effect on the perception of safety. Job satisfaction has a direct effect on the perception of safety and it is a mediator between psychological factors and the perception of safety. Occupational injuries and industrial accidents are likely to be mediated by job satisfaction [61], and job satisfaction is also mediated by psychological capital and the perception of workers’ safety [62]. The initial hypothetical model contained six latent variables, and each latent variable consisted of six indicators based on questionnaire items shown in Figure 2. A detailed formulation of all hypotheses is explained here:
3.1. Workload → Job Satisfaction (H1)
Workload is associated with amount of work, nature of the job, and completion time. The construction industry is a project-based industry and has very tight working schedules, long and irregular working hours, and poor work-life balance that leads to having working stress among workers, which further leads to lower job satisfaction [63,64]. Overload and poor working environment reduce workers’ job satisfaction [65]. Job satisfaction relies upon different factors and workload is one of them [66], workload and working environment are negatively related to job satisfaction [67]. When job satisfaction is reduced, it has an unfavorable impact on worker’s behavior and performance in the workplace, which can become a reason for accidents [68].
3.2. Organizational Relationship → Job Satisfaction (H2)
There are several psychological links between worker job satisfaction and organizational relationships. An organizational relationship is the worker’s emotional relations and his psychological attachment to an organization [69]. An organizational relationship is the worker’s feelings toward the organization. It has a meaningful impact on job satisfaction. A worker’s relationship with his organization has various aspects, including sense of management care, management support, and coworkers’ relationships, which affect the worker perception toward safety [70]. Workers are required to work together as a team in order to achieve their tasks and workers are more conscious of personal and co-workers’ safety if they receive support from co-workers and supervisors [71]. Workers who feels management’s support and contribution for their well-being are more satisfied with their job. Organizational communication and commitment are the main factors that effect workers’ perception of safety [72,73].
3.3. Mental Stress → Job Satisfaction (H3)
Job related mental stress includes poor attitude, difficulty in concentrating, sleep disorders, bad attitude and behavior with coworkers, friends and family [74]. Here, mental stress may be termed as mental health and it can be elucidated as the psychological health of the worker in the organization. Mental stress is negatively associated with job satisfaction [75] and is a leading problem at construction sites [76]. That is why mental stress is an essential factor that should be considered in the workplace for the health, comfort, and safety of workers [68]. Mental stress has a significant impact on the performance of workers, which leads to job dissatisfaction as well as personal safety becoming a major cause of accidents in the workplace [77].
3.4. Job Security → Job Satisfaction (H4)
Job security is normally measured as the risk of losing one’s current job in the near future, and it is a principal element of job satisfaction [78]. Workers who feel secure in their job are more likely to be more satisfied with their job and follow the rules and safety procedures in the workplace. Job security is negatively associated with workers’ attitude and behavior [46] which causes job dissatisfaction. It also has a significant psychological impact on the perception of personal safety [79].
3.5. Job Satisfaction → Perception of Safety (H5)
Job satisfaction is a psychological state that is defined for different aspects of the job situation [40]. Job satisfaction decreases due to the working environment, poor working conditions, organizational relationships, mental health, job security, etc., which affects the performance of workers in terms of increased errors, decreased productivity, and increased accident rates [80]. Workers who are more satisfied with their job are more safety conscious and have fewer accidents than dissatisfied workers [80,81]. Increasing the level of job satisfaction is more positive toward safety [34]. Thus, job satisfaction has a significant impact on workers’ perception of safety [61]. Psychological factors and workers’ perception of safety is mediated by job satisfaction [62].
4. Methodology
4.1. Data Collection
In the data collection stage, a survey was conducted on seven different construction projects in Pakistan. The survey was divided into two groups. Sample A for Group A was obtained from young workers (18–35 years of age), and Sample B for Group B was obtained from old workers (above 35 years of age). A two-part questionnaire-based survey was developed to obtain data. The first part of the survey consisted of questions related to demographic information, and the second part consisted of 36 statements focused on the psychological factors and their effects on the perception of personal safety of construction workers. The response of each worker was recorded on a five-point Likert-type scale. In total, 450 questionnaires were distributed among construction workers, including project managers, construction managers, site engineers, site supervisors, and workers representing different construction trades (carpenters, steel fixers, masons, scaffolders, electricians, and painters) at different construction sites. Demographics of the workers such as gender, age, education level, employment status, and employment level is shown in Table 1. A total of 275 workers returned their questionnaires, among which 10 questionnaires were rejected due to being incomplete. Therefore, a total of 265 questionnaires were analyzed for this study. The response rate was 61.11%. The age of the worker was recorded through their responses. Frequency of workers and their classification by age group are presented in Table 2, which is extracted from the demographics of the workers. The usable responses were divided into Sample A (Group A, 18–35 years age, n = 145, 54.7%) and Sample B (Group B, over 35 years, n = 120, 45.3%). It is also necessary to obtain a significant number of responses to perform statistical analysis and obtain significant results. These samples are significant for both groups for further analysis, since the minimum recommended value is 100 samples per evaluation for SEM analysis [82].
4.2. Data Analysis
All statistical analysis was done using AMOS version 22. A two-step method was employed in SEM [83]. In the first step, the hypothetical model was developed based on past empirical findings, theoretical expectations, and researcher judgments. The second step was the statistical analysis of the structural model. As explained in the previous section, the baseline hypothetical statistical model consists of six latent variables. Each latent variable consists of six indicators. The baseline model was statistically analyzed separately for both models (Model A for young workers and Model B for old workers). In SEM, the confirmatory factor analysis (CFA) is the initial step, in which the relationship between a latent variable and its indicators was analyzed with the maximum likelihood method at a 95% confidence interval. CFA is a technique used to develop a strong measurement model. If any indicator does not show a significant relationship with their latent variable, it is eliminated in this process [84]. When testing Model A and Model B separately, Model A was analyzed first. Initially, model-A consisted of 36 indicators, but the number of indicators was reduced to 24 indicators because indicators which have weak factor loadings were eliminated [85]. Similarly, Model B consisted of 36 indicators but after analysis its indicators were reduced to 27 because nine indicators did not show strong factor loading to their latent variables. Indicators which have weak relationships with latent variables were eliminated [85] to achieve the recommended goodness-of-fit (GoF) of the baseline models. By employing GoF indices the model refinement is performed to achieve the recommended value of GoF indices. GoF of both models were analyzed, as it is necessary to ensure the recommended GoF indices for the adequacy and strength of the measurement model [60]. GoF indices measures normed Chi-square (X 2/DF), root mean square error of approximation (RMSEA), comparative fit index (CFI), goodness of fit index (GFI), parsimonious goodness of fit index (PGFI), parsimonious normal fit index (PNFI), and Tucker-Lewis index (TLI). The GoF values for both models were obtained according to the recommended model fit indices [60,86,87,88]. The values of the model fit indices for both models (Model A and Model B), and the recommended values are shown in Table 3.
5. Results and Discussion
Prior to further analysis, it is necessary to examine the measurement properties in order to assure the reliability and validity of model [89]. First, Cronbach’s reliability test was conducted, as it is necessary to check the reliability and adequacy of the data [85]. A value above 0.7 is commonly recommended for Cronbach’s reliability to ensure the data reliability [90]. The reliability values of all the constructs are shown in Table 2. As all values were above 0.70, good reliability was shown for both data sets, and these data sets were accepted for further analysis. After Cronbach’s reliability test, average variance extracted (AVE) and composite reliability (CR) are measuring parameters to ensure the internal consistency of data and quality of measurement [89,91]. Formulation of calculating AVE and CR is shown in Equations (1) and (2). The recommended values of AVE and CR are greater than 0.5, but AVE value greater than 0.4 can be considered if the value of CR is greater than 0.6 [89], values of AVE and CR are shown in Table 4.
where n = number of items, λ = Standardized factor loading, δ = Error variance.
It is also necessary to validate the interrelationship among the latent variables/constructs of the hypothetical model. Therefore, Pearson correlation analysis was used to validate these relationships [89]. The correlations of both models (Model A and Model B) are presented in Table 5. Correlations among the constructs of hypothetical model supported the convergent validity as all constructs showed significant correlations.
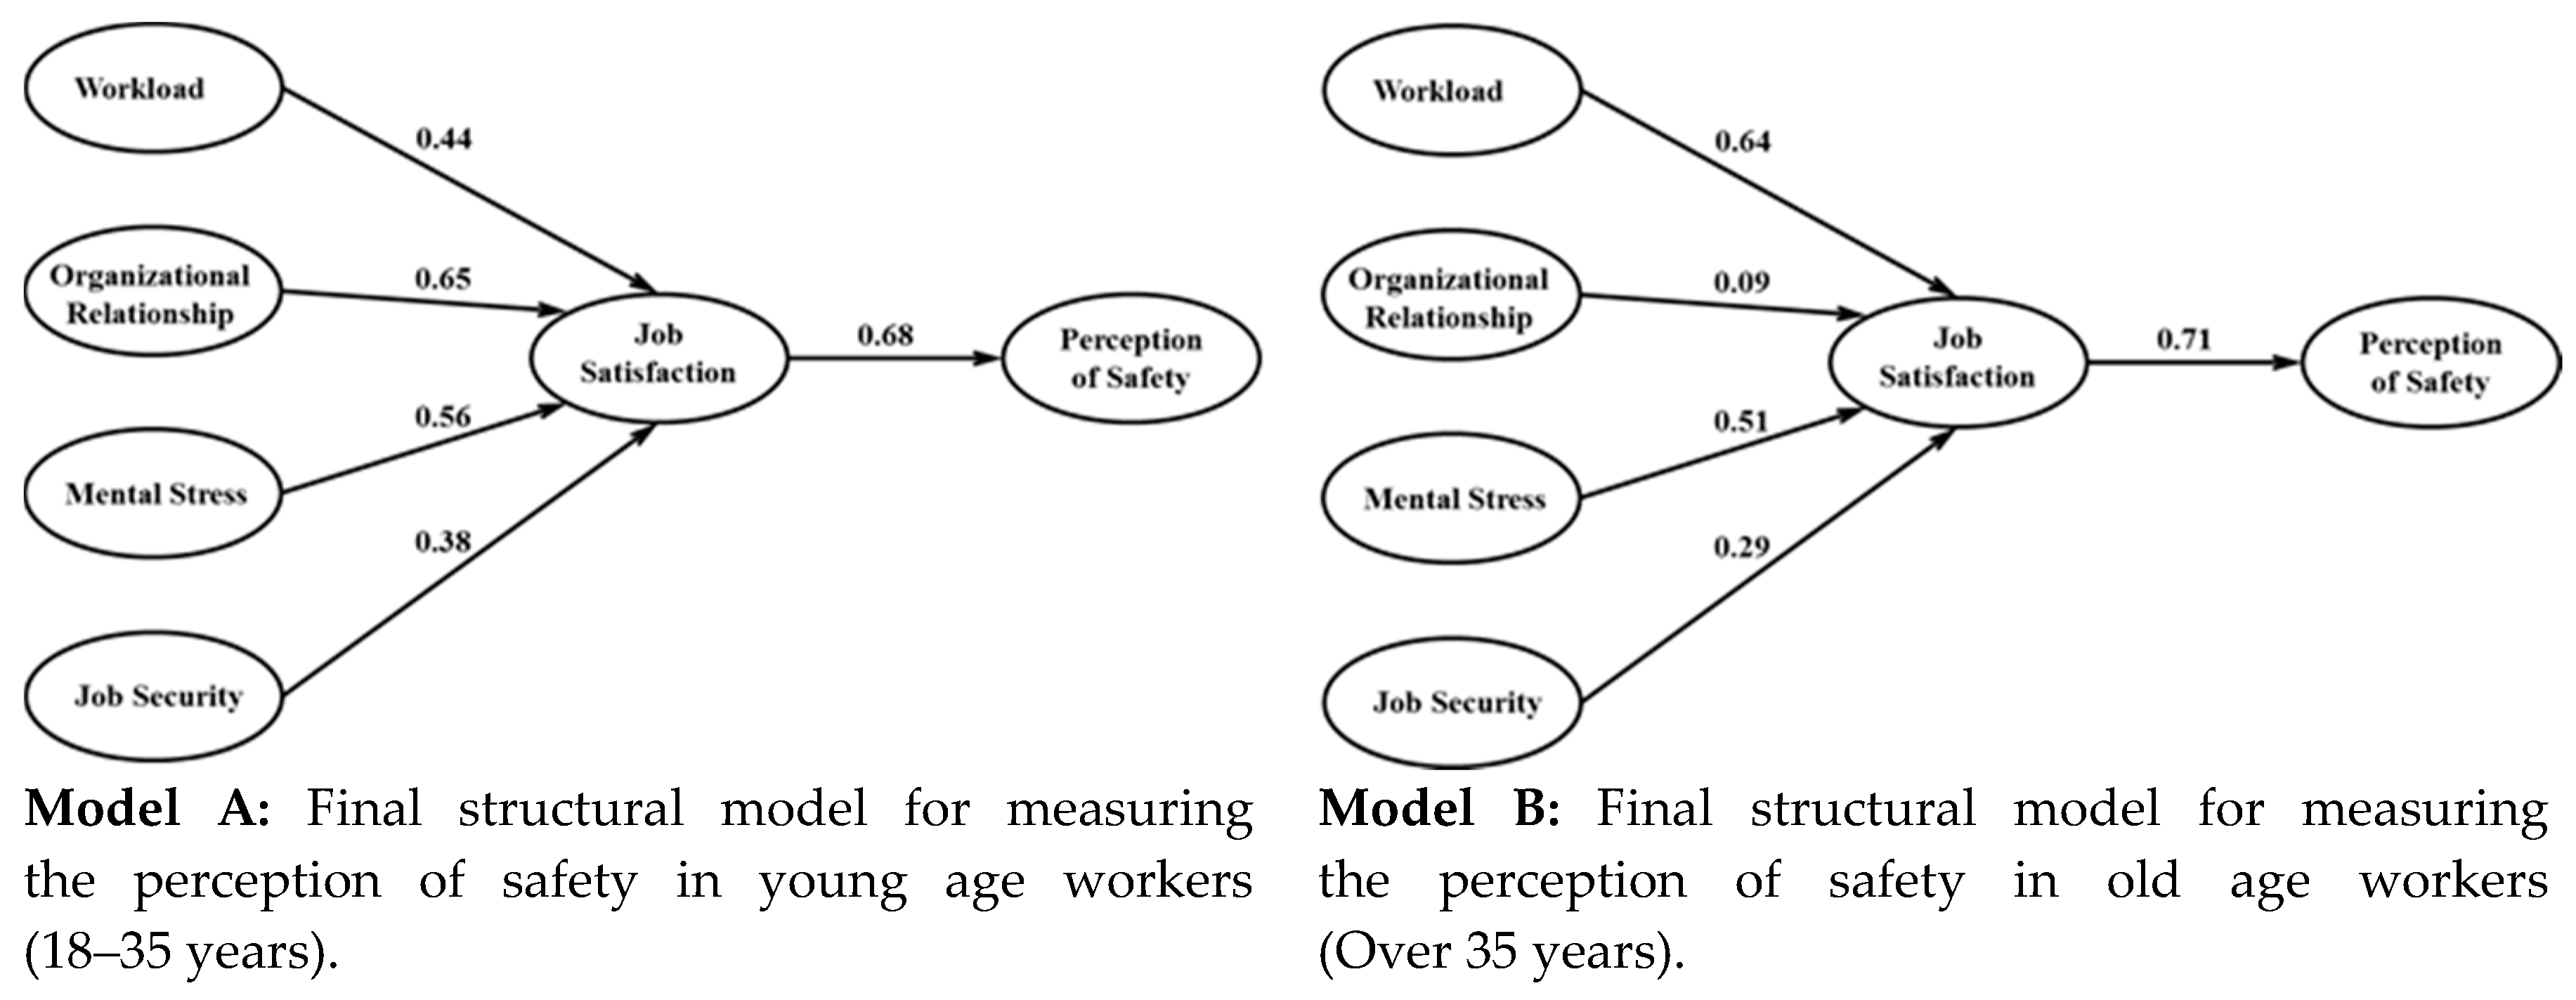
After the reliability tests of both the models, Model A and Model B, were evaluated separately using SEM techniques in order to inspect the relationship between latent variables. After evaluation, both models were compared in order to find the perception of safety in both age groups of workers. Both models shown in Figure 3 confirmed that all the hypothesized directions were correct because all hypotheses have positive effects.
Model A and Model B were analyzed separately to inspect the predicted directions and the relationship between latent variables. Direct and indirect effects of all latent variables are measured as shown in Table 6. It can be observed that in the baseline model, workload has a direct effect on job satisfaction and an indirect effect on the perception of safety. The results for Model A and Model B show that the workload has a more direct effect on job satisfaction as well as an indirect effect on older workers’ perception of safety than that of younger workers. Organizational relationship has a direct effect on job satisfaction and an indirect effect on perception of safety. The results of this relationship show that the organizational relationship has a strong, significant, and direct impact on job satisfaction as well as an indirect impact on workers’ perception of safety among young workers. Therefore, in older workers, this impact is very low. In other words, it can be said that this impact can be neglected in older workers. Mental stress has a direct effect on job satisfaction and an indirect effect on the perception of safety. The result of this relationship shows that mental stress has a significant effect on job satisfaction and that there is a slight difference between young and older workers. Mental stress also has an indirect effect on the perception of safety. Indirect effects suggest that there is a slight difference between younger and older workers. Overall mental stress has more effect on young workers than on older workers’ perception of safety. Job security has a direct effect on job satisfaction and an indirect effect on perception of safety. The results of this analysis show that job security has a more direct effect on job satisfaction among young workers than among older workers. Similarly, the indirect effect of job security on the perception of safety is higher in young workers than in older workers. Job satisfaction is used here as a mediator between psychological factors and the perception of safety. The effects of job satisfaction over perception of safety show that perception of safety is more influential for older workers than younger workers. The influence difference between young and old workers is not as large, but this study confirms that the perception of safety is more influenced by psychological factors for older workers than younger workers.
Safety at the construction site is an important phenomenon, and workers’ perception of safety has been considered as a major guide towards safety performance. It is also observed that a negative perception of safety due to the different psychological factors: workers engage in more unsafe acts, which leads to increased accidents. This study examined the impact of psychological factors on the perception of safety in different age groups of workers. All the hypotheses used in this study confirmed the previous study. Workload, organizational relationship, mental stress, and job security have an impact on job satisfaction [63,65,71,75,76,77,78], which reduces workers’ perception of safety [34,68,73,77,79]. In this study, different psychological factors are covered, which are closely related to the environment and culture of the construction industry in Pakistan. The major findings of this study suggest that workload and job satisfaction are more important factors for older workers than for younger workers. In young workers, organizational relationships, mental stress, and job security are dominant factors. The practical implications of this study for personal workplace safety and management are that organizational support and concern of workers satisfaction and well-being will not only decrease the number of accidents and injuries at the construction sites, but also increase efficiency and productivity.
Some potential limitations also exist in this study. Due to the limited sample size, this study is limited to these two age group of categories, as minimum sufficient sample size for SEM is 100 samples per category [82] and both categories have sufficient sample size. In future, to enhance the results of mediation and indirect effects, an approach can be used proposed by [92]. Further, this study may also be extended to more categories such as more age group categories, categories based on employment level, employment status, etc.
6. Conclusions
Workers’ safety is always a complex phenomenon at construction sites and safety focus on global construction sites is not common due to demographics and cultural differences. Perception of workers’ safety is also affected by demographic factors such as age, experience, educational level, etc. This study examined psychological factors affecting the perception of safety in different age groups of workers in the construction industry in Pakistan. Previous research has measured the impact of psychological factors on the perception of worker safety, but this study is a unique contribution to measure the impact of psychological factors over perception of safety using the SEM technique in different age groups of workers. It is observed that perception of safety is not common in different age groups of workers. Workload and job satisfaction are more important factors for older workers, while organizational relationships, mental stress, and job satisfaction are more influential factors for younger workers. This study concluded that organizational relationships, mental stress, and job security are appropriate areas of focus for younger workers, while workload and job satisfaction should be areas of focus for older workers to increase their perception toward safety.
Acknowledgments
The authors would like to acknowledgement the Higher Education Commission (HEC) of Pakistan and the Government of Pakistan for granting a scholarship to Muhammad Dawood Idrees to pursue his MS leading to a PhD degree from Hanayang University, Korea.
Author Contributions
Muhammad Dawood Idrees designed this study, collected, analyzed, interpreted the data, and drafted the manuscript; Maria Hafeez collected the data and critically revised the manuscript; Professor Jung-Yong Kim supervised the overall study from design to final manuscript.
Conflicts of Interest
The authors declare no conflict of interest.
Appendix A

Table A1.
Survey instrument for psychological factors and safety perception.
| Questionnaire items | Strongly Disagree | Disagree | Neutral | Agree | Strongly Agree | |
|---|---|---|---|---|---|---|
| 1 | I always enjoy my work more than my spare time | ❑1 | ❑2 | ❑3 | ❑4 | ❑5 |
| 2 | I feel well satisfied with my present job | ❑1 | ❑2 | ❑3 | ❑4 | ❑5 |
| 3 | I dislike my work (R) | ❑1 | ❑2 | ❑3 | ❑4 | ❑5 |
| 4 | My job is very uninteresting (R) | ❑1 | ❑2 | ❑3 | ❑4 | ❑5 |
| 5 | My wages are good | ❑1 | ❑2 | ❑3 | ❑4 | ❑5 |
| 6 | I get benefit/Incentives of my good works/efforts | ❑1 | ❑2 | ❑3 | ❑4 | ❑5 |
| 7 | I feel sad and depressed (R) | ❑1 | ❑2 | ❑3 | ❑4 | ❑5 |
| 8 | I feel that life wasn’t worthwhile (R) | ❑1 | ❑2 | ❑3 | ❑4 | ❑5 |
| 9 | I find myself getting upset easily (R) | ❑1 | ❑2 | ❑3 | ❑4 | ❑5 |
| 10 | I remain in a state of nervous tension (R) | ❑1 | ❑2 | ❑3 | ❑4 | ❑5 |
| 11 | I find myself getting agitated (R) | ❑1 | ❑2 | ❑3 | ❑4 | ❑5 |
| 12 | I feel scared without any reason (R) | ❑1 | ❑2 | ❑3 | ❑4 | ❑5 |
| 13 | I have sufficient time to complete my task | ❑1 | ❑2 | ❑3 | ❑4 | ❑5 |
| 14 | My tasks are too easy or boring (R) | ❑1 | ❑2 | ❑3 | ❑4 | ❑5 |
| 15 | I have right amount of work to do | ❑1 | ❑2 | ❑3 | ❑4 | ❑5 |
| 16 | I am well aware of task/work | ❑1 | ❑2 | ❑3 | ❑4 | ❑5 |
| 17 | I receive orders from multiple boss/supervisors (R) | ❑1 | ❑2 | ❑3 | ❑4 | ❑5 |
| 18 | I do not know that, what is the use of my work (R) | ❑1 | ❑2 | ❑3 | ❑4 | ❑5 |
| 19 | My coworkers help me in heavy workloads | ❑1 | ❑2 | ❑3 | ❑4 | ❑5 |
| 20 | My coworkers help me in my work when I’m running behind | ❑1 | ❑2 | ❑3 | ❑4 | ❑5 |
| 21 | My coworkers listen my concerns | ❑1 | ❑2 | ❑3 | ❑4 | ❑5 |
| 22 | If I am having a bad day my coworkers try to cheer me up | ❑1 | ❑2 | ❑3 | ❑4 | ❑5 |
| 23 | I believe management is sincere with me | ❑1 | ❑2 | ❑3 | ❑4 | ❑5 |
| 24 | I get along with supervisors | ❑1 | ❑2 | ❑3 | ❑4 | ❑5 |
| 25 | I am worried about losing my job in the near future (R) | ❑1 | ❑2 | ❑3 | ❑4 | ❑5 |
| 26 | My pay development is promising | ❑1 | ❑2 | ❑3 | ❑4 | ❑5 |
| 27 | I am worried that I will have to leave my job (R) | ❑1 | ❑2 | ❑3 | ❑4 | ❑5 |
| 28 | My job / department future is uncertain (R) | ❑1 | ❑2 | ❑3 | ❑4 | ❑5 |
| 29 | I am worry about getting less stimulating tasks in future (R) | ❑1 | ❑2 | ❑3 | ❑4 | ❑5 |
| 30 | I believe that organization will need myself in future also | ❑1 | ❑2 | ❑3 | ❑4 | ❑5 |
| 31 | Regardless the situation I always follow all safety procedures | ❑1 | ❑2 | ❑3 | ❑4 | ❑5 |
| 32 | Always wear safety equipment when requires by practice | ❑1 | ❑2 | ❑3 | ❑4 | ❑5 |
| 33 | Keep my work area clean | ❑1 | ❑2 | ❑3 | ❑4 | ❑5 |
| 34 | Report safety situation to my supervisor when I feel any safety problems | ❑1 | ❑2 | ❑3 | ❑4 | ❑5 |
| 35 | Safety is my first priority always | ❑1 | ❑2 | ❑3 | ❑4 | ❑5 |
| 36 | Safety is for secures me from any kind of injury | ❑1 | ❑2 | ❑3 | ❑4 | ❑5 |
References
- Sacks, R.; Rozenfeld, O.; Rosenfeld, Y. Spatial and temporal exposure to safety hazards in construction. J. Constr. Eng. Manag. 2009, 135, 726–736. [Google Scholar] [CrossRef]
- Demirkesen, S.; Arditi, D. Construction safety personnel’s perceptions of safety training practices. Int. J. Proj. Manag. 2015, 33, 1160–1169. [Google Scholar] [CrossRef]
- Building and Wood Workers’ International (BWI). 2017. Available online: http://www.bwint.org/default.asp?Language=EN (accessed on 7 April 2017).
- Pegula, S.M. An Analysis of Fatal Occupational Injuries at Road Construction Sites, 2003–2010. 2017. Available online: http://www.bls.gov/opub/mlr/2013 (accessed on 7 April 2017).
- Kartam, N.A. Integrating safety and health performance into construction CPM. J. Constr. Eng. Manag. 1997, 123, 121–126. [Google Scholar] [CrossRef]
- Buchholz, B.; Paquet, V.; Punnett, L.; Lee, D.; Moir, S. PATH: A work sampling-based approach to ergonomic job analysis for construction and other non-repetitive work. Appl. Ergon. 1996, 27, 177–187. [Google Scholar] [CrossRef]
- Farooqui, R.U.; Arif, F.; Rafeeqi, S. Safety performance in construction industry of Pakistan. In Proceedings of the First International Conference on Construction in Developing Countries (ICCIDC-I), Karachi, Pakistan, 4–5 August 2008. [Google Scholar]
- Choudhry, R.M.; Hinze, J.W.; Arshad, M.; Gabriel, H.F. Subcontracting practices in the construction industry of Pakistan. J. Constr. Eng. Manag. 2012, 138, 1353–1359. [Google Scholar] [CrossRef]
- Farooqui, R.; Ahmed, S.; Panthi, K. Developing safety culture in Pakistan construction industry—An assessment of perceptions and practices among construction contractors. In Proceedings of the Fourth International Conference on Construction in the 21st Century: Accelerating Innovation in Engineering, Management and Technology (CITC IV 2007), Gold Coast, Australia, 11–13 July 2007. [Google Scholar]
- Raheem, A.A.; Issa, R.R. Safety implementation framework for Pakistani construction industry. Saf. Sci. 2016, 82, 301–314. [Google Scholar] [CrossRef]
- Tam, C.M.; Ng, J.W. From Attitude to Culture: Effect of Safety Climate on Construction Safety; Hong Kong Polytechnic University: Hong Kong, China, 2005. [Google Scholar]
- Yeoum, S.J.; Lee, Y.H. A Study On Prediction Modeling of Korea Millitary Aircraft Accident Occurrence. Int. J. Ind. Eng. Theory Appl. 2014, 20, 562–573. [Google Scholar]
- Sawacha, E.; Naoum, S.; Fong, D. Factors affecting safety performance on construction sites. Int. J. Proj. Manag. 1999, 17, 309–315. [Google Scholar] [CrossRef]
- Fleming, M.; Lardner, R. Strategies to Promote Safe Behaviour as Part of a Health and Safety Management System; HSE Books: Edinburgh, UK, 2002.
- Parker, C.P.; Baltes, B.B.; Young, S.A.; Huff, J.W.; Altmann, R.A.; Lacost, H.A.; Roberts, J.E. Relationships between psychological climate perceptions and work outcomes: A meta-analytic review. J. Organ. Behav. 2003, 24, 389–416. [Google Scholar] [CrossRef]
- Topf, M.D. The Safety Net A look at demographic and social challenges facing the new breed and the old guard of safety professionals. Occup. Hazards 2000, 62, 49–52. [Google Scholar]
- Koehn, E.E.; Kothari, R.K.; Pan, C.-S. Safety in developing countries: Professional and bureaucratic problems. J. Constr. Eng. Manag. 1995, 121, 261–265. [Google Scholar] [CrossRef]
- Hinze, J. Construction Safety; Prentice Hall: Upper Saddle River, NJ, USA, 1997. [Google Scholar]
- Salminen, S. Work-related accidents among young workers in Finland. Int. J. Occup. Saf. Ergon. 1996, 2, 305–314. [Google Scholar] [CrossRef] [PubMed]
- Rabi, A.Z.; Jamous, L.W.; Abudhaise, B.A.; Alwash, R.H. Fatal occupational injuries in Jordan during the period 1980 through 1993. Saf. Sci. 1998, 28, 177–187. [Google Scholar] [CrossRef]
- Jackson, S.A.; Loomis, D. Fatal occupational injuries in the North Carolina construction industry, 1978–1994. Appl. Occup. Environ. Hyg. 2002, 17, 27–33. [Google Scholar] [CrossRef] [PubMed]
- Frone, M.R. Predictors of work injuries among employed adolescents. J. Appl. Psychol. 1998, 83, 565. [Google Scholar] [CrossRef] [PubMed]
- Siu, O.-L.; Phillips, D.R.; Leung, T.-W. Age differences in safety attitudes and safety performance in Hong Kong construction workers. J. Saf. Res. 2003, 34, 199–205. [Google Scholar] [CrossRef]
- May, D.R.; Gilson, R.L.; Harter, L.M. The psychological conditions of meaningfulness, safety and availability and the engagement of the human spirit at work. J. Occup. Organ. Psychol. 2004, 77, 11–37. [Google Scholar] [CrossRef]
- Idris, M.A.; Dollard, M.F.; Coward, J.; Dormann, C. Psychosocial safety climate: Conceptual distinctiveness and effect on job demands and worker psychological health. Saf. Sci. 2012, 50, 19–28. [Google Scholar] [CrossRef]
- Fang, D.; Wu, H. Development of a Safety Culture Interaction (SCI) model for construction projects. Saf. Sci. 2013, 57, 138–149. [Google Scholar] [CrossRef]
- Cigularov, K.P.; Adams, S.; Gittleman, J.L.; Haile, E.; Chen, P.Y. Measurement equivalence and mean comparisons of a safety climate measure across construction trades. Accid. Anal. Prev. 2013, 51, 68–77. [Google Scholar] [CrossRef] [PubMed]
- Choudhry, R.M.; Fang, D. Why operatives engage in unsafe work behavior: Investigating factors on construction sites. Saf. Sci. 2008, 46, 566–584. [Google Scholar] [CrossRef]
- Gherardi, S.; Nicolini, D. Learning the trade: A culture of safety in practice. Organization 2002, 9, 191–223. [Google Scholar] [CrossRef]
- Butani, S.J. Relative risk analysis of injuries in coal mining by age and experience at present company. J. Occup. Accid. 1988, 10, 209–216. [Google Scholar] [CrossRef]
- Cleveland, J.N.; Shore, L.M. Self-and supervisory perspectives on age and work attitudes and performance. J. Appl. Psychol. 1992, 77, 469. [Google Scholar] [CrossRef] [PubMed]
- Gyekye, S.A.; Salminen, S. Age and workers’ perceptions of workplace safety: A comparative study. Int. J. Aging Hum. Dev. 2009, 68, 171–184. [Google Scholar] [CrossRef] [PubMed]
- White, A.T.; Spector, P.E. An investigation of age-related factors in the age-job-satisfaction relationship. Psychol. Aging 1987, 2, 261. [Google Scholar] [CrossRef] [PubMed]
- Stoilkovska, B.B.; Pančovska, V.Ž.; Mijoski, G. Relationship of safety climate perceptions and job satisfaction among employees in the construction industry: The moderating role of age. Int. J. Occup. Saf. Ergon. 2015, 21, 440–447. [Google Scholar] [CrossRef] [PubMed]
- Fredin, H.; Gerdman, P.; Thorson, J. Industrial accidents in the construction industry. Scand. J. Public Health 1974, 2, 67–77. [Google Scholar]
- Buskin, S.E.; Paulozzi, L.J. Fatal injuries in the construction industry in Washington State. Am. J. Ind. Med. 1987, 11, 453–460. [Google Scholar] [CrossRef] [PubMed]
- Ore, T.; Stout, N.A. Traumatic occupational fatalities in the US and Australian construction industries. Am. J. Ind. Med. 1996, 30, 202–206. [Google Scholar] [CrossRef]
- Lowery, J.T.; Borgerding, J.A.; Zhen, B.; Glazner, J.E.; Bondy, J.; Kreiss, K. Risk factors for injury among construction workers at Denver International Airport. Am. J. Ind. Med. 1998, 34, 113–120. [Google Scholar] [CrossRef]
- Kisner, S.M.; Fosbroke, D.E. Injury hazards in the construction industry. J. Occup. Environ. Med. 1994, 36, 137–143. [Google Scholar] [CrossRef]
- Brayfield, A.H.; Rothe, H.F. An index of job satisfaction. J. Appl. Psychol. 1951, 35, 307. [Google Scholar] [CrossRef]
- Macdonald, S.; Maclntyre, P. The generic job satisfaction scale: Scale development and its correlates. Empl. Assist. Q. 1997, 13, 1–16. [Google Scholar] [CrossRef]
- Lovibond, P.F. Long-term stability of depression, anxiety, and stress syndromes. J. Abnorm. Psychol. 1998, 107, 520. [Google Scholar] [CrossRef] [PubMed]
- Caplan, R.D. Organizational Stress and Individual Strain: A Social-Psychological Study of Risk Factors in Coronary Heart Disease among Administrators, Engineers, and Scientists; The university of Michigan: Ann Arbor, ML, USA, 1971. [Google Scholar]
- Rizzo, J.R.; House, R.J.; Lirtzman, S.I. Role conflict and ambiguity in complex organizations. Adm. Sci. Q. 1970, 15, 150–163. [Google Scholar] [CrossRef]
- Settoon, R.P.; Mossholder, K.W. Relationship quality and relationship context as antecedents of person-and task-focused interpersonal citizenship behavior. J. Appl. Psychol. 2002, 87, 255. [Google Scholar] [CrossRef] [PubMed]
- Hellgren, J.; Sverke, M.; Isaksson, K. A two-dimensional approach to job insecurity: Consequences for employee attitudes and well-being. Eur. J. Work Organ. Psychol. 1999, 8, 179–195. [Google Scholar] [CrossRef]
- Hayes, B.E.; Perander, J.; Smecko, T.; Trask, J. Measuring perceptions of workplace safety: Development and validation of the work safety scale. J. Saf. Res. 1998, 29, 145–161. [Google Scholar] [CrossRef]
- Bono, J.E.; Judge, T.A. Self-concordance at work: Toward understanding the motivational effects of transformational leaders. Acad. Manag. J. 2003, 46, 554–571. [Google Scholar] [CrossRef]
- Bérubé, N.; Donia, M.B.; Gagné, M.; Houlfort, N.; Lvina, E. Validation Evidence for the Work Domain Satisfaction Scale in Two Languages. Int. J. Psychol. Stud. 2016, 8, 26. [Google Scholar] [CrossRef]
- Yeoh, T.E.S. Validation of the Facet Satisfacton Scale (Fss): An Evaluative Approach to Assessing Facet Job Satisfaction; University of North Texas: Denton, TX, USA, 2011. [Google Scholar]
- Akin, A.; Çetın, B. The Depression Anxiety and Stress Scale (DASS): The study of Validity and Reliability. Educ. Sci. Theory Pract. 2007, 7, 241–268. [Google Scholar]
- Smith, C.S.; Tisak, J.; Schmieder, R.A. The measurement properties of the role conflict and role ambiguity scales: A review and extension of the empirical research. J. Organ. Behav. 1993, 14, 37–48. [Google Scholar] [CrossRef]
- Wallace, J.C.; Johnson, P.D.; Frazier, M.L. An examination of the factorial, construct, and predictive validity and utility of the regulatory focus at work scale. J. Organ. Behav. 2009, 30, 805–831. [Google Scholar] [CrossRef]
- Otto, K.; Hoffmann-Biencourt, A.; Mohr, G. Is there a buffering effect of flexibility for job attitudes and work-related strain under conditions of high job insecurity and regional unemployment rate? Econ. Ind. Democr. 2011, 32, 609–630. [Google Scholar] [CrossRef]
- Nielsen, M.B.; Eid, J.; Hystad, S.W.; Sætrevik, B.; Saus, E.-R. A brief safety climate inventory for petro-maritime organizations. Saf. Sci. 2013, 58, 81–88. [Google Scholar] [CrossRef]
- Lecours, A.; Therriault, P.-Y. French transcultural validation of the Compliance with Safety Behavior Scale. Work 2016, 55, 805–815. [Google Scholar] [CrossRef] [PubMed]
- Yuluğkural, Y.; Yörür, B.; Akman, G.; Aladağ, Z. Assessment of model validity of analytic network process using structural equations modelling: An application of supplier evaluation problem. Eur. J. Ind. Eng. 2013, 7, 55–77. [Google Scholar] [CrossRef]
- Garson, G.D. Structural equation modeling. In Statnotes: Topics in Multivariate Analysis; North Carolina State University: Raleigh, NC, USA, 2009. [Google Scholar]
- Byrne, B.M. Testing for multigroup equivalence of a measuring instrument: A walk through the process. Psicothema 2008, 20, 872–882. [Google Scholar] [PubMed]
- Hair, J.F.; Black, W.C.; Babin, B.J.; Anderson, R.E.; Tatham, R.L. Multivariate Data Analysis; Pearson Prentice Hall: Upper Saddle River, NJ, USA, 2006; Volume 6. [Google Scholar]
- Ayim Gyekye, S. Workers’ perceptions of workplace safety and job satisfaction. Int. J. Occup. Saf. Ergon. 2005, 11, 291–302. [Google Scholar] [CrossRef] [PubMed]
- Bergheim, K.; Nielsen, M.B.; Mearns, K.; Eid, J. The relationship between psychological capital, job satisfaction, and safety perceptions in the maritime industry. Saf. Sci. 2015, 74, 27–36. [Google Scholar] [CrossRef]
- Love, P.E.; Edwards, D.J. Taking the pulse of UK construction project managers’ health: Influence of job demands, job control and social support on psychological wellbeing. Eng. Constr. Archit. Manag. 2005, 12, 88–101. [Google Scholar] [CrossRef]
- Yip, L.-P. Job Burnout among Construction Professionals in Hong Kong: A Moderator Model with Coping Strategies. Ph.D. Thesis, The University of Hong Kong, Hong Kong, China, 2007. [Google Scholar]
- Aktepe, A.; Ersoz, S. A quantitative performance evaluation model based on a job satisfaction-performance matrix and application in a manufacturing company. Int. J. Ind. Eng. 2012, 19, 264–277. [Google Scholar]
- Goetz, K.; Musselmann, B.; Szecsenyi, J.; Joos, S. The influence of workload and health behavior on job satisfaction of general practitioners. Fam. Med. 2013, 45, 95–101. [Google Scholar] [PubMed]
- Vinokur-Kaplan, D. Job satisfaction among social workers in public and voluntary child welfare agencies. Child Welf. J. Policy Pract. Prog. 1991, 70, 81–91. [Google Scholar]
- Paul, P.; Maiti, J. Development and test of a sociotechnical model for accident/injury occurrences in underground coalmines. J. S. Afr. Inst. Min. Metall. 2005, 105, 43–53. [Google Scholar]
- Eslami, J.; Gharakhani, D. Organizational commitment and job satisfaction. ARPN J. Sci. Technol. 2012, 2, 85–91. [Google Scholar]
- Masia, U.; Pienaar, J. Unravelling safety compliance in the mining industry: Examining the role of work stress, job insecurity, satisfaction and commitment as antecedents. SA J. Ind. Psychol. 2011, 37, 1–10. [Google Scholar] [CrossRef]
- Turner, N.; Stride, C.B.; Carter, A.J.; McCaughey, D.; Carroll, A.E. Job Demands–Control–Support model and employee safety performance. Accid. Anal. Prev. 2012, 45, 811–817. [Google Scholar] [CrossRef] [PubMed]
- Shore, L.M.; Shore, T.H. Perceived organizational support and organizational justice. In Organizational Politics, Justice, and Support: Managing the Social Climate of the Workplace; Cropanzano, R.S., Kacmar, K.M., Eds.; Quorum Books: Westport, CT, USA, 1995; pp. 149–164. [Google Scholar]
- Hassan, C.C.; Basha, O.; Hanafi, W.W. Perception of building construction workers towards safety, health and environment. J. Eng. Sci. Technol. 2007, 2, 271–279. [Google Scholar]
- Nahar, L.; Hossain, A.; Rahman, A.; Bairagi, A. The Relationship of Job Satisfaction, Job Stress, Mental Health of Government and Non-Government Employees of Bangladesh. Psychology 2013, 4, 520. [Google Scholar] [CrossRef]
- Ahsan, N.; Abdullah, Z.; Fie, D.G.; Alam, S.S. A study of job stress on job satisfaction among university staff in Malaysia: Empirical study. Eur. J. Soc. Sci. 2009, 8, 121–131. [Google Scholar]
- Guthrie, R.; Ciccarelli, M.; Babic, A. Work-related stress in Australia: The effects of legislative interventions and the cost of treatment. Int. J. Law Psychiatry 2010, 33, 101–115. [Google Scholar] [CrossRef] [PubMed]
- Monk, T.; Folkard, S. Shiftwork and Performance. In Hours of Work—Temporal Factors in Work Scheduling; John Wiley & Sons: Hoboken, NJ, USA, 1985; pp. 239–252. [Google Scholar]
- Artz, B.; Kaya, I. The impact of job security on job satisfaction in economic contractions versus expansions. Appl. Econ. 2014, 46, 2873–2890. [Google Scholar] [CrossRef]
- Dekker, S.W.; Schaufeli, W.B. The effects of job insecurity on psychological health and withdrawal: A longitudinal study. Aust. Psychol. 1995, 30, 57–63. [Google Scholar] [CrossRef]
- Probst, T.M.; Brubaker, T.L. The effects of job insecurity on employee safety outcomes: Cross-sectional and longitudinal explorations. J. Occup. Health Psychol. 2001, 6, 139. [Google Scholar] [CrossRef] [PubMed]
- Blair, E. Effective Safety Cultures: Myths, Magic, and Reality. In Proceedings of the ASSE Professional Development Conference and Exposition, Denver, CO, USA, 22–25 June 2003. [Google Scholar]
- Bagozzi, R.P.; Yi, Y. Specification, evaluation, and interpretation of structural equation models. J. Acad. Mark. Sci. 2012, 40, 8–34. [Google Scholar] [CrossRef]
- Xiong, B.; Skitmore, M.; Xia, B.; Masrom, M.A.; Ye, K.; Bridge, A. Examining the influence of participant performance factors on contractor satisfaction: A structural equation model. Int. J. Proj. Manag. 2014, 32, 482–491. [Google Scholar] [CrossRef]
- Mainul Islam, M.; Faniran, O.O. Structural equation model of project planning effectiveness. Constr. Manag. Econ. 2005, 23, 215–223. [Google Scholar] [CrossRef]
- Doloi, H.; Iyer, K.; Sawhney, A. Structural equation model for assessing impacts of contractor’s performance on project success. Int. J. Proj. Manag. 2011, 29, 687–695. [Google Scholar] [CrossRef]
- Larsson, S.; Pousette, A.; Törner, M. Psychological climate and safety in the construction industry-mediated influence on safety behaviour. Saf. Sci. 2008, 46, 405–412. [Google Scholar] [CrossRef]
- Molenaar, K.; Washington, S.; Diekmann, J. Structural equation model of construction contract dispute potential. J. Constr. Eng. Manag. 2000, 126, 268–277. [Google Scholar] [CrossRef]
- Ong, T.F.; Musa, G. Examining the influences of experience, personality and attitude on SCUBA divers’ underwater behaviour: A structural equation model. Tour. Manag. 2012, 33, 1521–1534. [Google Scholar] [CrossRef]
- Fornell, C.; Larcker, D.F. Evaluating structural equation models with unobservable variables and measurement error. J. Mark. Res. 1981, 18, 39–50. [Google Scholar] [CrossRef]
- Pallant, J. SPSS Survival Manual; McGraw-Hill Education: New York, NY, USA, 2013. [Google Scholar]
- Hair, J.F.; Black, B.; Anderson, R.; Tatham, R. Multivariate Data Analysis: Text and Readings; Prentice Hall: Upper Saddle River, NJ, USA, 1995; Volume 4. [Google Scholar]
- Pituch, K.A.; Stapleton, L.M.; Kang, J.Y. A comparison of single sample and bootstrap methods to assess mediation in cluster randomized trials. Multivar. Behav. Res. 2006, 41, 367–400. [Google Scholar] [CrossRef] [PubMed]
Figure 1.
Baseline hypothetical structural model for the perception of safety.

Figure 2.
Baseline hypothetical structural equation model for the perception of safety (latent variables with their indicators).
Figure 2.
Baseline hypothetical structural equation model for the perception of safety (latent variables with their indicators).
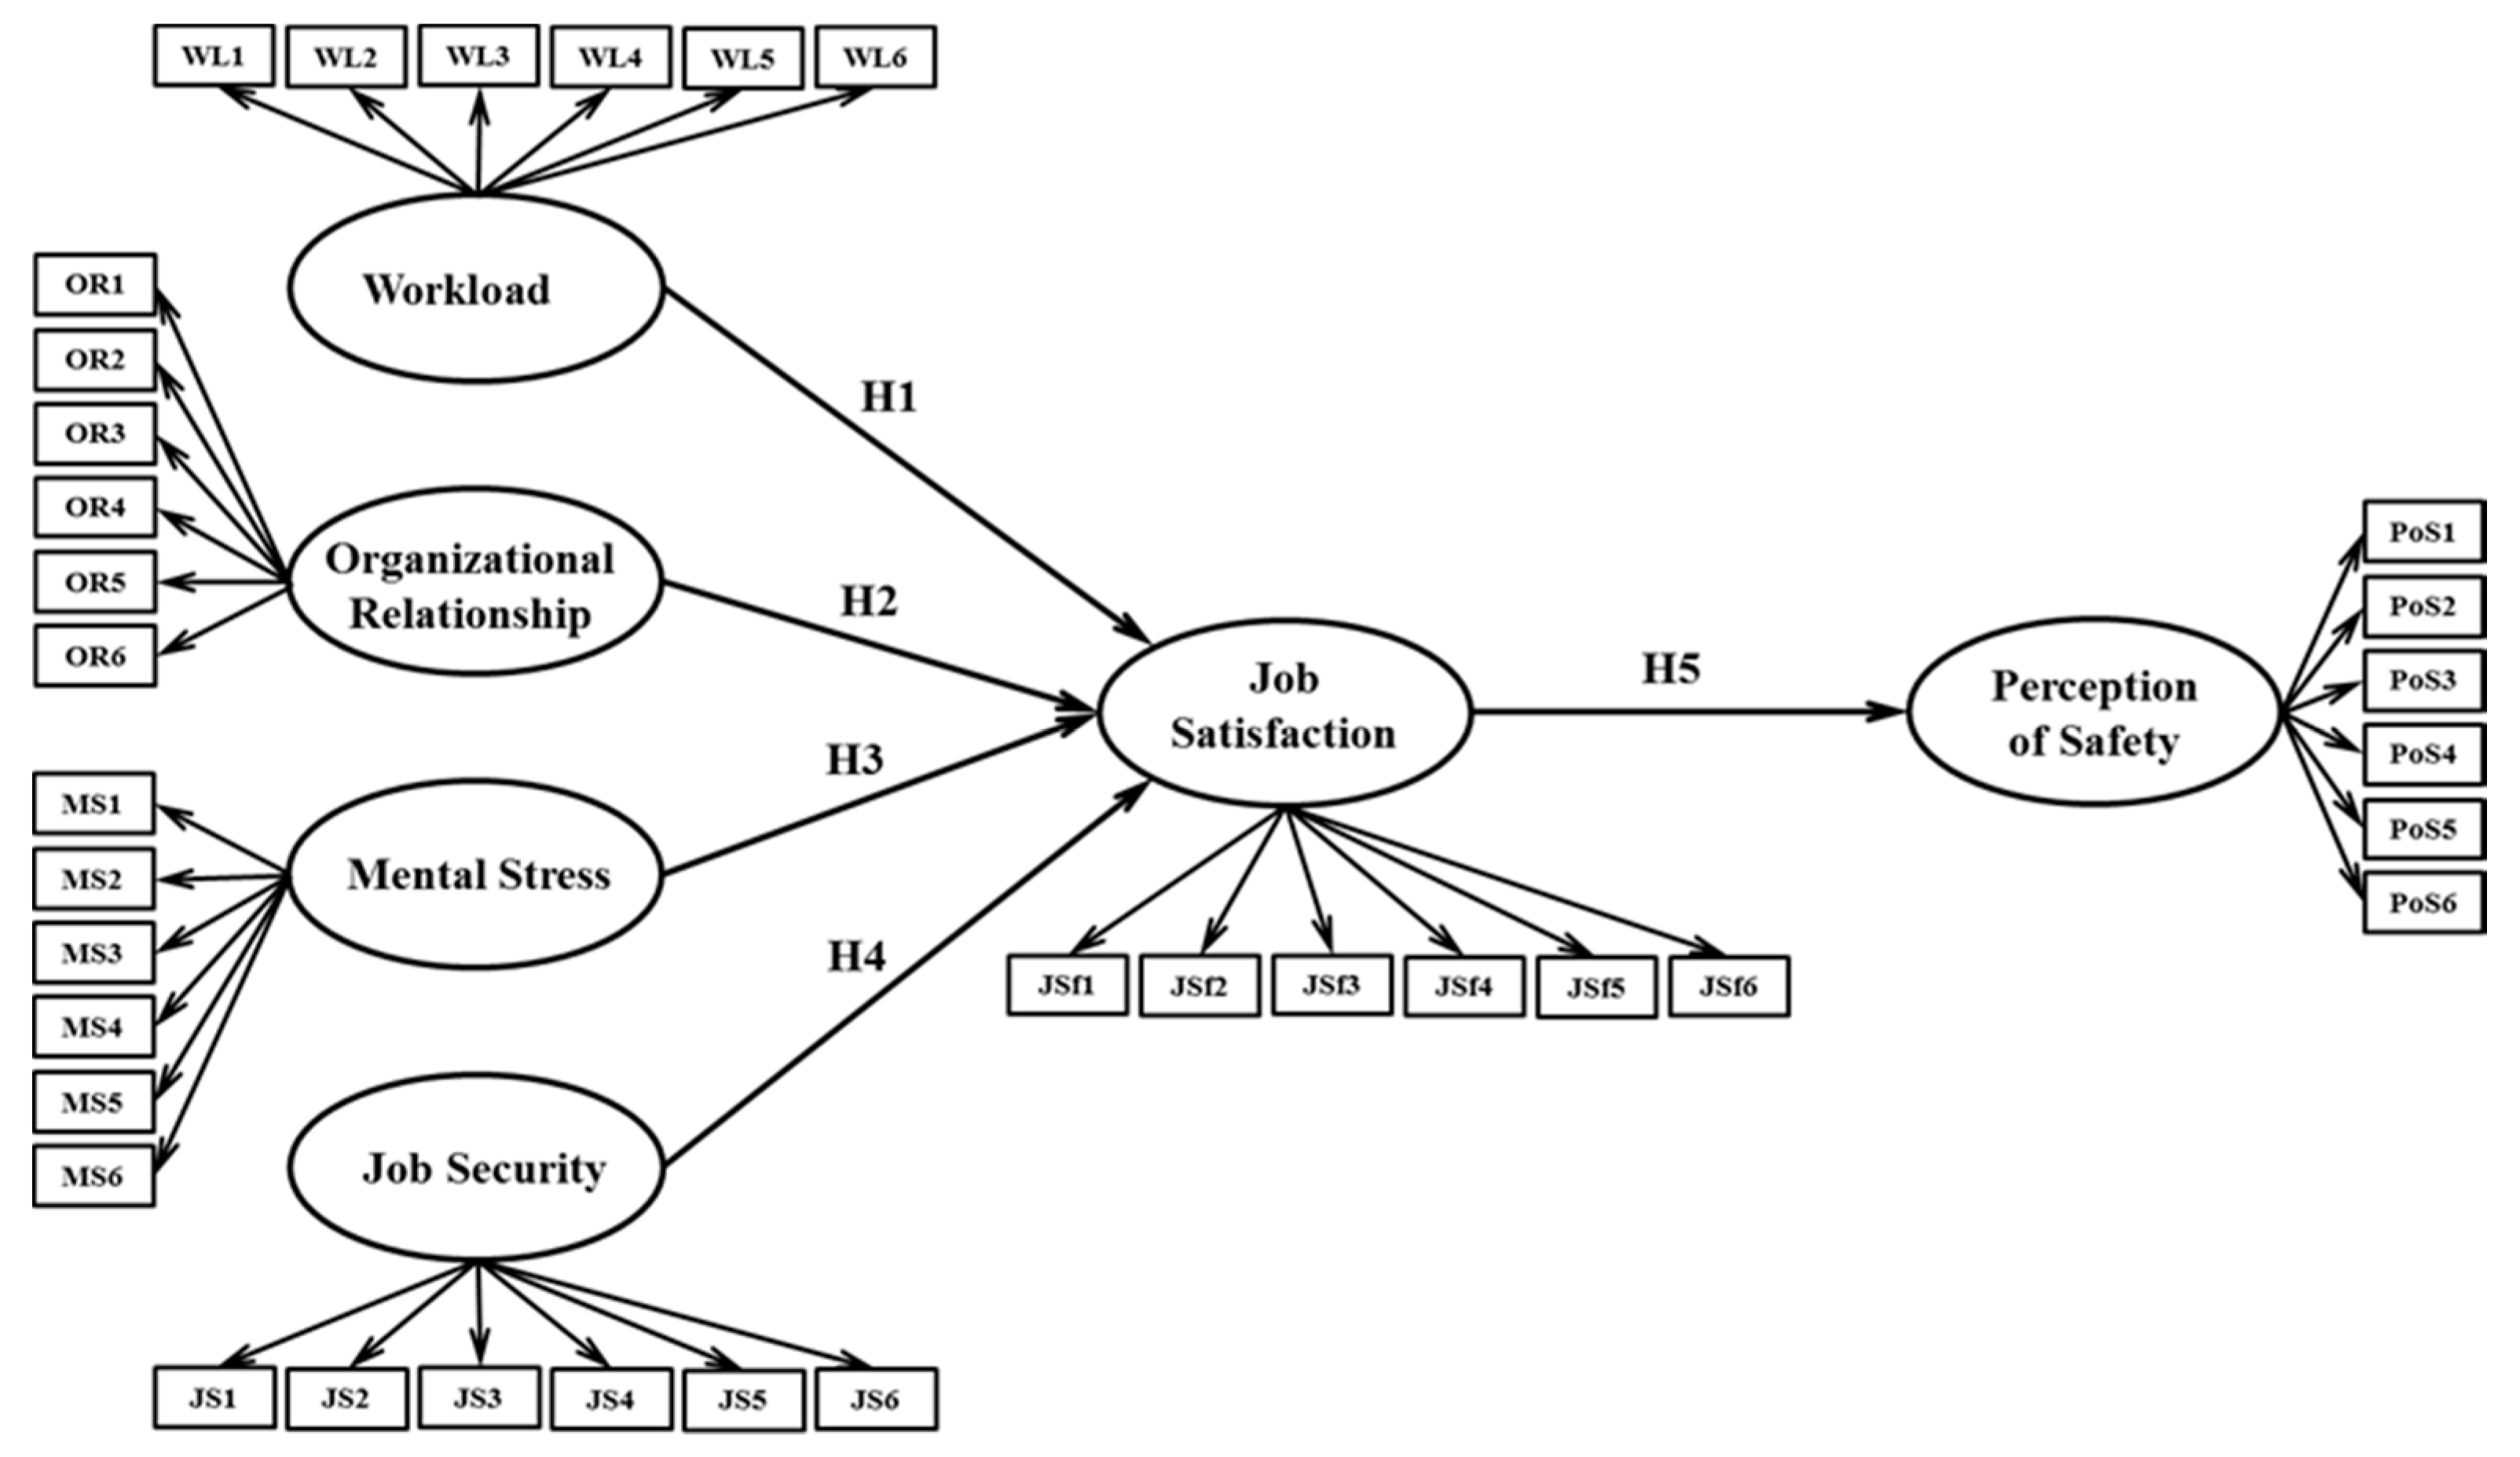
Figure 3.
Final Structural models for both age groups (Model A and Model B).

Table 1.
Demographics of participants (n = 265).
| Item | Category | Frequency | % |
|---|---|---|---|
| Gender | Male | 265 | 100.00 |
| Female | 0 | 0.00 | |
| Age (Years) | 18–25 | 69 | 26.03 |
| 26–35 | 76 | 28.67 | |
| 36–45 | 93 | 35.09 | |
| 46–55 | 25 | 9.43 | |
| Above-55 | 2 | 0.75 | |
| Education | Nothing | 76 | 28.67 |
| Primary School | 35 | 13.20 | |
| Secondary School | 21 | 7.92 | |
| Matric or equivalent | 18 | 6.79 | |
| Intermediate/Diploma | 73 | 27.54 | |
| University/Degree | 42 | 15.84 | |
| Household | Single | 72 | 27.16 |
| Married | 184 | 69.43 | |
| Living with parents | 9 | 3.39 | |
| Employment level | Labor/Worker/Helper | 135 | 50.94 |
| Supervisor | 71 | 26.79 | |
| Site Engineer | 43 | 16.22 | |
| Site/Project Manager | 16 | 6.03 | |
| Part time/Full time | Full time | 265 | 100.00 |
| Part time | 0 | 0.00 | |
| Employment status | Permanent | 185 | 69.81 |
| Temporary | 80 | 30.18 |
Table 2.
Ages of participants (n = 265).
| Item | Category | Frequency | Total | % | |
|---|---|---|---|---|---|
| Age (years) | Young workers (Group-A, 18–35 years age) | 18–25 | 69 | 145 | 54.7% |
| 26–35 | 76 | ||||
| Old workers (Group-B, over-35 years) | 36–45 | 93 | 120 | 45.3% | |
| 46–55 | 25 | ||||
| Above-55 | 2 | ||||
Table 3.
GoF indices of Model A and Model B, initial and final models, and recommended values.
| Fit Index | Model A (Young Workers) | Model B (Old Workers) | Recommended Value | Suggested by Author | ||
|---|---|---|---|---|---|---|
| Initial Model | Final Model | Initial Model | Final Model | |||
| X2/DF | 2.12 | 1.79 | 2.59 | 1.72 | From 1.0 to 2.0 | Larsson, Pousette [86] |
| RMSEA | 0.088 | 0.074 | 0.116 | 0.078 | Less than 0.08 | Hair, Black [60] |
| CFI | 0.73 | 0.91 | 0.65 | 0.89 | 0 (no fit) to 1 (perfect fit) | Molenaar, Washington [87] |
| GFI | 0.68 | 0.83 | 0.61 | 0.78 | 0 (no fit) to 1 (perfect fit) | |
| TLI | 0.71 | 0.88 | 0.62 | 0.88 | 0 (no fit) to 1 (perfect fit) | |
| PGFI | 0.59 | 0.64 | 0.53 | 0.62 | Greater than 0.5 | Ong and Musa [88] |
| PNFI | 0.55 | 0.68 | 0.49 | 0.67 | Greater than 0.5 | |
Table 4.
Validity and reliability tests.
| Constructs/Latent Variables | Model A (Young Workers) | Model B (Old Workers) | ||||
|---|---|---|---|---|---|---|
| α | AVE | CR | α | AVE | CR | |
| Job Satisfaction | 0.85 | 0.42 | 0.68 | 0.81 | 0.49 | 0.75 |
| Mental Stress | 0.90 | 0.44 | 0.69 | 0.85 | 0.54 | 0.82 |
| Workload | 0.85 | 0.49 | 0.80 | 0.82 | 0.45 | 0.76 |
| Organizational Relationship | 0.88 | 0.51 | 0.67 | 0.86 | 0.59 | 0.84 |
| Job Security | 0.85 | 0.55 | 0.86 | 0.86 | 0.66 | 0.91 |
| Perception of Safety | 0.86 | 0.53 | 0.71 | 0.86 | 0.56 | 0.83 |
Table 5.
Constructs/latent variables correlations.
| Constructs | Correlations | |||
|---|---|---|---|---|
| Model A | Model B | |||
| Job security | <--> | Job satisfaction | 0.837 | 0.661 |
| Job security | <--> | Perception of safety | 0.809 | 0.362 |
| Job security | <--> | Mental stress | 0.806 | 0.431 |
| Job security | <--> | Organizational relationship | 0.767 | 0.198 |
| Job security | <--> | Workload | 0.830 | 0.629 |
| Mental stress | <--> | Job satisfaction | 0.869 | 0.650 |
| Mental stress | <--> | Perception of safety | 0.799 | 0.547 |
| Mental stress | <--> | Organizational relationship | 0.682 | 0.185 |
| Mental stress | <--> | Workload | 0.776 | 0.578 |
| Organizational relationship | <--> | Job satisfaction | 0.924 | 0.337 |
| Organizational relationship | <--> | Perception of safety | 0.676 | 0.246 |
| Organizational relationship | <--> | Workload | 0.877 | 0.265 |
| Workload | <--> | Job satisfaction | 0.850 | 0.936 |
| Workload | <--> | Perception of safety | 0.835 | 0.720 |
| Job satisfaction | <--> | Perception of safety | 0.754 | 0.790 |
Table 6.
Direct, indirect, and total effects of Path coefficients.
| Path | Model A (Young Workers) | Model B (Old Workers) | ||||
|---|---|---|---|---|---|---|
| Direct Effect | Indirect Effect | Total Effect | Direct Effect | Indirect Effect | Total Effect | |
| Workload → Job satisfaction Workload → Perception of safety | 0.44 - | - 0.30 | 0.44 0.30 | 0.64 - | - 0.45 | 0.64 0.45 |
| Org. relationship → Job satisfaction Org. relationship → Perception of safety | 0.65 - | - 0.44 | 0.65 0.44 | 0.09 - | - 0.06 | 0.09 0.06 |
| Mental stress → Job satisfaction Mental stress → Perception of safety | 0.56 - | - 0.38 | 0.56 0.38 | 0.51 - | - 0.36 | 0.51 0.36 |
| Job security → Job satisfaction Job security → Perception of safety | 0.38 - | - 0.26 | 0.38 0.26 | 0.29 - | - 0.20 | 0.29 0.20 |
| Job satisfaction → Perception of safety | 0.68 | - | 0.68 | 0.71 | - | 0.71 |
© 2017 by the authors. Licensee MDPI, Basel, Switzerland. This article is an open access article distributed under the terms and conditions of the Creative Commons Attribution (CC BY) license (http://creativecommons.org/licenses/by/4.0/).
Share and Cite
MDPI and ACS Style
Idrees, M.D.; Hafeez, M.; Kim, J.-Y. Workers’ Age and the Impact of Psychological Factors on the Perception of Safety at Construction Sites. Sustainability 2017, 9, 745. https://doi.org/10.3390/su9050745
AMA Style
Idrees MD, Hafeez M, Kim J-Y. Workers’ Age and the Impact of Psychological Factors on the Perception of Safety at Construction Sites. Sustainability. 2017; 9(5):745. https://doi.org/10.3390/su9050745
Chicago/Turabian StyleIdrees, Muhammad Dawood, Maria Hafeez, and Jung-Yong Kim. 2017. "Workers’ Age and the Impact of Psychological Factors on the Perception of Safety at Construction Sites" Sustainability 9, no. 5: 745. https://doi.org/10.3390/su9050745
Note that from the first issue of 2016, this journal uses article numbers instead of page numbers. See further details here.