
Urban Flood Adaptation through Public Space Retrofits: The Case of Lisbon (Portugal)


Universidade de Lisboa, Faculdade de Arquitetura, CIAUD, Centro de Investigação em Arquitetura, Urbanismo e Design, Rua Sá Nogueira, Pólo Universitário do Alto da Ajuda, Lisbon 1349-063, Portugal
*
Author to whom correspondence should be addressed.
Sustainability 2017, 9(5), 816; https://doi.org/10.3390/su9050816
Submission received: 8 March 2017
/
Revised: 22 April 2017
/
Accepted: 5 May 2017
/
Published: 13 May 2017
(This article belongs to the Section Sustainable Urban and Rural Development)
Abstract
:A “Conceptual Framework of flood adaptation measures applicable in the design of public spaces” was previously created with the objective of increasing the rate of successful flood adaptation endeavors, fulfill municipal goals for more adaptive cities and facilitate the initial brainstorming phases of a public space design process. This research aims to assess the relevance and applicability of this Conceptual Framework on the particular municipal context of Lisbon. The paper starts by demonstrating the city’s existing vulnerabilities and projected climate change scenarios, where it is possible to confirm that floods are indeed a recurrent phenomenon that will aggravate in the near and distant future. Subsequently, municipal endeavors up to the present time are analyzed with the purpose of assessing if the Conceptual Framework provides additional types of flood adaptation measures that may be considered. In a final stage, additional types of adaptation measures highlighted by the Conceptual Framework are assessed with regard to their application and infrastructural relevance. In light of the presented results, which confirm the infrastructural benefits of the additional measures proposed, new discussions emerge specifically regarding Lisbon’s municipal flood adaptation management and its relation with public space design.
1. Introduction
In light of several experienced natural catastrophes, such as 2005’s Hurricane Katrina affecting New Orleans, the 2005 cyclone affecting Mumbai or the 2007 heavy rains in Jakarta, cities are among the areas most vulnerable to the impacts of climate extremes [1]. This is because most cities are located in vulnerable areas such as coastlines, mouths of major rivers or low-lying areas of estuaries and deltas, such as Lisbon [2]. As a direct cause of their physical location, these cities are at a greater risk of climate hazards such as coastal storms, cyclones, flooding and coastal erosion [3]. Cities are also particularly vulnerable, as they are home to the majority of the world’s population and where most of the world’s built assets and economic activities are held. Fortunately, cities are as vulnerable as they are powerful [4], in the sense that as centers of communication, business, innovation and culture, they are the economic drivers of their respective countries and major authorities for future planning agendas.
Flood events are a recurring phenomenon disrupting cities on a regular basis; they can cause environmental damage, displace population and even result in the loss of lives. Floods can also seriously compromise economic activities and development. Changing this rising tendency is a massive challenge, particularly when considering the results of continued research on climate change projections that point towards a greater number of flood events per year. Considering the findings of the Intergovernmental Panel on Climate Change (IPCC), flood events are likely to increase not only due to projected sea level rise (SLR), but also due to more intense and frequent extreme precipitation events in many regions [5].
Flooding is a recurrent phenomenon in the city of Lisbon. Beyond the occurrences of torrential precipitation combined with the soil-sealing characteristics of most of the contemporary urban fabric, floods in Lisbon are aggravated by other specific factors. In particular, these include Lisbon’s land morphology, the influence of the Tagus estuary dynamics (tides, storm surges, winds and undulation) and the fragile characteristics and conditions of the existing drainage infrastructure. Additionally, scientific evidence highlights variations in atmospheric pressure and the consequent increase of storm surge magnitudes, the increase of the average sea level (ASL) and the increase of extreme precipitation events.
Because conventional flood management infrastructure is mostly designed in accordance with statistical recurrence criteria, originating from available historic meteorological data, the same method may not be able to cope with the expected unprecedented flood events. Indeed, projections have indicated a tendency towards an increase in the intensity of the precipitation events together with a decrease of the return period for some regions [6]. As such, although we have always lived and will continue to live with a changing climate, our cities and infrastructure are not prepared to face the projected exceptional changes for the next 100 years [7], making most of the existing infrastructure inadequate. On the other hand, altering the existing flood management systems from one moment to another in order to respond to predicted climate change scenarios would entail large investments, that are very likely unaffordable for municipalities in the short run.
Flood management practices are therefore currently facing an urgent need to reassess and improve its methods. The challenge put forward by climate change is pushing infrastructure to its limits, forcing flood management practices to move beyond modernist/sectorial paradigms and welcoming multidisciplinary and interdisciplinary approaches—multidisciplinary in the sense that it needs to involve the expertise of several disciplines, such as urban planning, engineering, architecture, landscape architecture, climatology, among others; and interdisciplinary in the sense of practices that effectively integrate disciplines through productive professional collaboration.
Adaptation to projected flood events is therefore gaining relevance as one of the biggest challenges of the next century. It is along these lines that the design of public spaces finds a niche of potentiality for climate change adaptation. One may identify a wide range of current and past situations where a public space is combined with one or more flood-risk management measures [8,9]. Examples include the Westzeedijk in Rotterdam, the Netherlands, a gentle slope levee from the 12th century that is integrated within today’s urban fabric; or the retention and infiltration basins within parks, such as Parque da Cidade in Porto, Portugal. Other recent examples where public spaces and flood-risk management measures are explicitly integrated with climate change adaptation purposes [10] include the floating square over the Yongning River in Taizhou, China, or the Bemthemplein square in Rotterdam. These examples [11], and others like them, can be seen as encouraging promoters of new approaches, new solutions and, eventually, new paradigms [12].
In contrast with cities such as Rotterdam, New York or London, which have matured their relationship with water through the design of public spaces that bring together society and flood-risk management infrastructure [13], Lisbon is still in the process of acknowledging the bountiful and resilient capacities of water. In general terms, Lisbon’s present relationship between urban planning and flood management infrastructure consists of immediate actions, manipulated by political priorities, whereby strategies are generally only devised when the consequences are already deeply complicated. This type of approach is particularly deceptive in light of projected scenarios. Estimated projections are indicative rather than definite, yet are nonetheless reliable. The fundamental ideas that infrastructure should be integrated into urban planning [14] and that urbanism should adequately consider estimated projections as drivers of change [15] are not new. What is proposed in this study is that significant developments in the urban flood adaptation agenda may be achieved by promoting urban flood adaptation through public space retrofits.
2. Methodology
This paper is focused on assessing the relevance and applicability of the “Conceptual Framework of flood adaptation measures applicable in the design of public spaces” [11] (hereafter referred to as “Conceptual Framework”) in a particular municipal context. The city of Lisbon as a “working case” [16] is chosen for this purpose.
The relevance of this Conceptual Framework is specifically assessed through the identification of Lisbon Municipality’s recognized vulnerabilities and strategic policies in the face of the past, present and projected future flooding events. If using the Conceptual Framework is justified, its applicability is therefore assessed. More specifically, additional adaptation measures potentially highlighted by the Conceptual Framework are subsequently evaluated through a practice-based analysis on specific public spaces. In this sense, three illustrative preliminary designs are tested for three specific public spaces within the city of Lisbon, more specifically within the Alcântara Upper Basin. To further assess the infrastructural relevance of the proposed measures in a way that could be comparable with conventional engineering approaches, quantifiable estimates regarding source control volume capacity together with projected implementation scenarios are also developed.
In addition, it is intended to reinforce the contents of the Conceptual Framework in light of Lisbon’s municipal strategic policies in adaptation research and undertaken programs, as well as to prompt new discussions on flood management approaches and their relation with public space regeneration processes.
All of the above goals are developed through essential scientific, grey and technical literature review; field reconnaissance; preliminary study designs; spatial analysis and quantitative analysis. While AutoCAD software was used in the development of the preliminary study designs, ArcMap software was used for quantitative spatial analysis.
Lisbon is selected as a working case given that it is often the stage of urban flooding, which, in light of climate change projections are likely to worsen. Lisbon is also a large city both in terms of area and population; as the capital city, it is strategically important within the region and country. Moreover, it is a city with a relatively recent master plan (2012) wherein climate change adaptation strategies and measures have been specifically addressed.
3. Flooding in Lisbon: Existing Vulnerabilities and Projected Events
3.1. Brief Overview of Lisbon’s Floods
In contrast to the typical river floods that result from several days or weeks of prolonged rainfall, Lisbon floods are generally defined as urban floods, which can be created in just a few minutes. These floods are typically associated with the phenomena of torrential precipitation accompanied by thunderstorms [17] falling over an urban fabric that is almost entirely impermeable and with channeled temporary and permanent water streams. When combined, these factors give rise to the term “flash floods” that occur every year in the city of Lisbon.
Beyond (1) torrential precipitation [18] and (2) incorrect land use practices that generally lead to the exacerbated soil-sealing characteristics of much of contemporary urban fabric [19], these floods may be aggravated by other factors. In the case of Lisbon, these include (3) land morphology, (4) the influence of estuary dynamics, (5) the characteristics and condition of the drainage infrastructure and (6) future climate change impacts.
The flood-prone areas of Lisbon have long been identified. Most floods occur in the so-called “wet system,” composed of permanent and temporary streams, water bodies, wetlands and valley bottoms [20], but they also happen frequently at the city’s waterfront, which collects rainwater from upstream areas as well as from the Tagus estuary. The areas below the 5 m level, which correspond to about 6.1% of Lisbon’s area, are particularly vulnerable to estuary dynamics and its influence on the flow capacity of the drainage system. Estuary dynamics are namely subject to the changing amplitudes of tides, storm surges, winds and undulation. The effects of high tide in particular—when added to Lisbon’s characteristics of torrential rains, small basins, steep slopes and dense, strongly sealed urban fabric—often result in considerable waterfront floods that can undermine normal functioning of the city. More specifically, the level of the receiving waters in the Tagus estuary is mainly dependent on the ocean tide. If extreme precipitation occurs during high tide, the water body of the estuary will block the discharge of water. Additionally, estuary waters may enter the sewerage network, overloading the entire system along the riverfront. Due to the age of the historic city center drains, a common problem occurs when high tide and heavy rainfall coincide, rupturing the sewerage collectors due to excessive water pressure.
Lisbon’s floods are mostly tackled through the city’s underground drainage infrastructure, which is a particularly complex system with several structural deficiencies that include age-related defects to sewerage subsidence, improper or faulty connections, defective equipment, damaged surfaces, corrosion or collapse [21]. Hydraulic efficiency may be additionally disturbed by sediment accumulation and gutter obstructions, which may lead to sewerage blockage, which is a situation frequently observed in the flat marginal areas of the city [22]. Another distinctive factor of Lisbon’s drainage infrastructure is its reduced storage capacity. In addition to Lisbon’s characteristic land morphology and urban sealing indexes [23], the absence of upstream retention also significantly contributes to a high concentration of water in the low areas and main permanent or temporary streams (Figure 1).
In addition, while separate sewerage systems exist in some areas, most of these are connected to primary combined sewers. The occurrence of overloads in the combined sewerage collectors (Combined Sewage Overflows—CSO’s) is therefore particularly frequent in low-lying areas and the dissipation of the corresponding floods is highly dependent on the efficiency of the subsequent coastal discharge.
Lastly, it is important to highlight that as Lisbon is located in a region of high seismic activity it is vulnerable to hydrological disasters similar to the 1755 tsunami.
3.2. Projected Climate-Driven Changes in Lisbon’s Flood Events
Among the most important climate-driven projections related to the particular matter of flooding in Lisbon, the following must be taken into consideration: (1) variations in atmospheric pressure and the consequent increase of storm surge magnitudes, (2) the increase of the ASL, and (3) the changes in extreme precipitation events.
According to Santos et al., it is estimated that Portugal will have a greater frequency of low-pressure systems, leading to an increase in storm surges [26]. While it has been further concluded that there is a low probability of simultaneous occurrence of extreme storm surges and high tide conditions [27], the possible combination of these events should not be ignored. Although changes in the intensity and direction of wind patterns may increase wave height, wind and undulation are considered to be minor threats [28,29]. Regardless, their combined occurrence, with the likely storm surges and less likely progressive river flood of the Tagus (which, as previously outlined, results from rainfall over consecutive days), may also lead to significant risks.
With reference to SLR projections, empirical observations from the Cascais (oceanic) tide gauge, identified a constant SLR increase (from 1.3 mm/year between 1880 and 1990, to 2.1 mm/year throughout the 1990s, and 2.5 mm/year over the past decade), supporting the idea of an expected mean SLR between 0.60 and 1.00 m for 2100 [30]. These results are consistent with IPCC projections [31] and other sources [32,33,34] for this region.
Although the scientific community is confident about the results that refer to SLR, the same cannot be said when considering extreme storm and precipitation events. The most current and comprehensive analysis that can help to understand Lisbon’s situation regarding future precipitation extremes, namely CIRAC “Floods and Flood Risk Maps in Climate Change Scenarios” and PECAC “Cascais Strategic Plan for Climate Change” reports (Author’s translation from original text: “CIRAC—Cartas de Inundações e de Risco em Cenários de Alterações Climáticas”; “PECAC—Plano Estratégico de Cascais face às Alterações Climáticas”), point towards a high degree of confidence that flooding will increase and bring stronger impacts and more severe damages. According to the research report developed for Cascais, cumulative monthly precipitation is expected to reduce except for one of the four emissions scenarios (B2) [35] (information about Emission Scenarios in [36]). Since present emission rates are closer to the worst-case scenarios than to the best-case scenarios, the strong decrease of precipitation can be considered the most likely for the Lisbon case. However, while a decrease in precipitation involves a smaller number of consecutive days with rain, it could also imply an increase in the intensity of the precipitation event, and a decrease in the return period of the extreme event in every projected scenario [6,30,37]. Findings from the CIRAC research project indicate that extreme rainfall events will be more frequent, with increased precipitation in relatively short time intervals, consequently leading to an increased risk of flooding [38]. More recently, a doctoral study concluded that there will be an increase of precipitation in the city of Lisbon in light of the return periods considered in this research [39].
Invariably, future precipitation regimes are the subject in which most uncertainty exists. Indeed, climate models are unable to fully grasp the complexity of the hydrological cycle. As a consequence, one may often find contradictory studies that vary in accordance with the models, indexes or datasets used. What is particularly important to note is that while the increase of extreme precipitation will imply larger flow rates in shorter periods of time, mostly affecting the areas adjacent to streams, storm surges and SLR will hinder Lisbon’s coastal runoff by delaying the coastal outflow, which, in turn, will increase the duration of the floods together with the volume of water accumulated in low-lying areas.
Considering that the existing drainage system is already undersized for most registered precipitation events and that the effectiveness is additionally worsened when there is a coincidence with high tide, one can directly conclude that the simultaneous occurrence of projected SLR and intense rainfall episodes will significantly contribute to an increase in the frequency of impacts that affect Lisbon.
4. Assessment of the Conceptual Framework of Flood Adaptation Measures Applicable in the Design of Public Spaces, in the Lisbon Case
4.1. Current Municipal Adaptation Response
Instigated by recurrent flood episodes, which are likely to become worse when considering climate change projections, Lisbon has been directing specific efforts towards urban flood adaptation. Urban climate change adaptation is a fairly recent subject, a matter accompanied by major questions about the processes of selection and design of adaptation measures.
Regardless of the existing examples of implemented adaptation measures through private initiatives or other current sorts of synergies, the following analysis will focus on assessing the essential municipal intentions within the accompanying elements of its corresponding Master Plan (PDM). The 2012 PDM is the most up-to-date land management tool, and the only document determining the classification and qualification of land use. Most importantly, it is the instrument that configures urban planning intentions for the Lisbon of the future.
As such, with the purpose of assessing Lisbon’s municipal adaptation response, a contrasting analysis between the specific types of adaptation measures identified within Lisbon’s PDM (2012) and the existence of other possible measures presented by the Conceptual Framework is undertaken. More specifically, in a first stage, and following the same methodology as the one conducted for the creation of the Conceptual Framework [11], for each element of the PDM, all mentioned categories and types of adaptation measures, i.e., flood-tackling operational measures applicable in the design of a public space, are outlined. In a second stage, all the highlighted measures are synthetized into measures deemed essential. Finally, these measures are compared with the Conceptual Framework to identify additional, potentially relevant types of solutions.
Before assessing Lisbon’s municipal adaptation plans, it is important to note that the city’s Master Plan took into account findings from previously established strategies, reports and plans such as PVL—Green Master Plan for Lisbon (1997), PGDL 2006–2008—Drainage Master Plan 2006–2008, EEAL 2008—Lisbon’s Energy and Environment Strategy (2008), CEL 2012–2024—Lisbon Strategic Charter 2010–2024, and AAE 2011—Strategic Environmental Strategy’ (2011), among others. (Author’s translation from original text: “PVL—Plano Verde de Lisboa”; “PGDL 2006–2008—Plano Geral de Drenagem para Lisboa 2006–2008; “EEAL 2008—Estratégia Energético-Ambiental para Lisboa 2008”; “CEL 2012–2024—Carta Estratégica de Lisboa 2010–2024”; and “AAE 2011—Avaliação Ambiental Estratégica 2011”). In regard to climate change, ‘Lisbon’s Energy and Environment Strategy’ and the ‘Lisbon Strategic Charter 2010–2024,’ greatly influenced municipal adaptation undertakings by delineating the double approach to climate change of mitigation and adaptation.
In view of a comprehensive analysis in the identification of the specifically proposed flood adaptation measures, all constituent and accompanying elements of the PDM were analyzed, namely the Accompanying Documents: (1) Master Plan Report and (2) Environmental Report, Strategic Environmental Assessment (2011) and the Constituent Elements (3) Regulations, (4) Technical Guide and (5) Planning Maps. All information is accessible on the municipality website (www.cm-lisboa.pt).
Possibly as a result of diverging definitions in the Master Plan Report, it was possible to identify direct references to adaptation measures as well as indirect references. Indirect references include measures that, regardless of being considered as mitigation measures or not considered as either mitigation or adaptation measures in the Master Plan Report, are viewed as adaptation measures since they refer to flood-tackling operational measures applicable in a public space design that has addressed present and future climatic changes. In accordance, among the 16 adaptation measures specifically mentioned in the Master Plan Report, only five were considered as adaptation measures in the scope of this research. For example, the endorsement of renewable energy technologies or the promotion of pedestrian and bicycle circulation were considered as mitigation measures in this study, while retention basins or the goal to promote the collection and storage of rainwater were considered adaptation measures. Following the same line of reasoning, among the 26 mitigation measures identified in the report, four were considered to be adaptation and not mitigation measures, including the goal to promote source control interventions within the existing drainage network and the implementation of new tree alignments. Furthermore, within the main and accompanying reports of the plan, ten additional adaptation measures were identified regardless of their not being explicitly mentioned or related to climate change adaptation or mitigation measures: such as leaky wells, infiltration trenches or green walls. In the Constituent Elements of Regulations, 11 adaptation measures were identified and an additional four were identified in the Technical Guide. Within the Planning Maps, only three adaptation measures were disclosed with spatial representation.
The strong emphasis given to the source control strategy is thus evident, i.e., the type of adaptation measure: (1) harvest (mentioned more than nine times throughout the analyzed documents) such as green walls, green roofs or tree alignments; (2) store (mentioned more than 12 times) such as bioretention basins, cisterns or underground reservoirs; or (3) infiltrate (mentioned more that 16 times) such as permeable paving, infiltration trenches or leaky wells.
Albeit more discreetly present, one other strategy that can be recognized throughout the PDM’s constituent and accompanying documents is the (4) Convey Strategy (mentioned more than six times). In light of the overall guiding principles of the general plan, this former strategy is associated with the need to preserve and increase superficial and underground drainage storm flows, together with the “requalification and valorization of water courses and their respective margins” ([24], e.g., p. 93, author’s translation), here correlated to the types of measures of stream rehabilitation and restoration, within the previously mentioned Conceptual Framework. As a summary, Table 1 and Figure 2 present the essential flood adaptation measures proposed by Lisbon’s PDM (2012) [24].
When considering the most recent municipal climate change adaptation endeavors, one must also mention the updated Drainage Master Plan envisioned for 2017–2030, as well as the involvement of the municipality in the recent research project ClimAdapt.Local [40]. In brief, the Drainage Master Plan 2017–2030 reinforces the Convey Strategy through the replacement of the underground reservoirs planned in the PDM with the construction of deviation tunnels that lead pluvial waters from the upper drainage basins towards the river (Figure 2). On the other hand, the recent ClimAdapt.Local research project aims to develop the integration of municipal climate change adaptation strategies and measures that rather prioritize and bolster the source control strategy.
As can be noted, efforts continue mainly at the strategic level. With the exception of traditional solutions, such as underground reservoirs or deviation tunnels, the PDM is a long way off from concrete adaptation actions, specifically concerning detailed implementation designs.
Besides promoting action in line with municipal goals for more adapted cities, the following will focus upon the question of whether the highlighted Conceptual Framework can provide measures to be additionally considered.
4.2. Additionally Relevant Adaptation Measures Presented by the Conceptual Framework
When confronting the types of source control adaptation measures supported by the PDM with the types of measures highlighted in the Conceptual Framework, by having the three primary strategies of harvest, store or infiltrate, nine additional types of measures arise as potential solutions: inverted umbrellas, art installations, blue roofs, water plazas, cisterns, bioswales, bioretention planters, rain gardens and green gutters.
If further consideration is made on the measures entailing source control as a secondary strategy, a wider range of supplementary options arise, as highlighted in blue in Figure 3. For instance, the “floating platform” within the “floating structures” category encompasses “tolerate” as the primary infrastructural strategy and “harvest” as a secondary infrastructural strategy; “submergible parks” in the “wet-proof” category, encompasses tolerate as the primary infrastructural strategy and harvest, store, infiltrate and convey as secondary infrastructural strategies; or “multifunctional defense” within the “coastal defenses” category encompasses avoid as the primary infrastructural strategy and tolerate, harvest, store and infiltrate as secondary infrastructural strategies.
4.3. Identification of Potential Implementation Areas
In order to assess the applicability of the additional alternatives previously mentioned in the Lisbon case, as well as their overall infrastructural significance, a particular representative area was chosen for subsequent analysis. The area corresponds to the “Alcântara Upper Basin” (AUB), covering and area of almost 3000 ha; topographically, it is the highest portion of the Alcântara valley and significantly contributes to severe periodic downstream flooding. Even without considering the Lower Alcântara Basin, the AUB is still the biggest hydrographic basin affecting the city of Lisbon.
To identify the potential area for public space adaptation, an in-depth analysis is made using the most comprehensive spatial data available. In the case of Lisbon, the most up-to-date and detailed analysis of land use occupation corresponds to the “Map of Land Use and Land Cover for Continental Portugal 2007” (COS 2007). Because it is specifically focused on the “ground plane of public spaces” (as in [41]), the potential area of intervention is reduced, thereby contributing to the conservative nature of the developed estimate.
The nomenclature and structure of COS 2007 consists of a hierarchical system of occupation classes of land use at five levels of precision. However, as this analysis is focused on urban territories, only the occupation class, “1. Artificial territories”, is considered (Figure 4).
In searching potential areas for public space adaptation—i.e., impermeable public spaces that contribute to the overload of the sewerage and drainage system—the following two-stepped analysis was developed: (1) impermeable areas within each of the 16 identified COS sub-classes are identified; and (2) considering the COS sub-classes with higher percentages of impermeable areas, an estimation of the corresponding impermeable public spaces is developed through a spatial two-dimensional analysis of representative study areas.
The first analysis was developed through the use of GIS software ArcMap 10.1 (Esri, Redlands, CA, USA). Within the study area of the AUB land use occupation, class “1. Artificial territories” was “intersected” with the 100% impermeable area as indicated in the latest European Environmental Agency (EEA) soil-sealing raster information [23]. This raster data includes a continuous degree of soil sealing ranging from 0–100% in an aggregated spatial resolution of 20 × 20 m. The specific value of being 100% impermeable was used for the development of this research, and not “over 80%” or “over 90%”, to pursue the standards of a conservative analysis. Before the presented quantitative area results in Table 2, only the seven COS sub-classes with greater impermeable rates (outlined in grey) were chosen for subsequent analysis.
To estimate the potential areas for public space adaptation within each of the seven outlined COS sub-classes, three representative study areas for each sub-class were spatially outlined, analyzed and compared. For each of these areas, the percentage of impermeable public spaces was calculated by subtracting the areas of buildings, roads and railway lines with the respectively identified 100% impermeable area. The resulting comparison among the three representative areas for each of the six COS sub-classes enabled the conservative generalization arising out of the lowest identified percentage of impermeable public space. For example, for the COS sub-class 1.2.2.01.1 designated “Roads and associated spaces,” the percentage of existing impermeable public space was calculated for the streets (1) Av. Berna, (2) Av. dos Combatentes and (3) Av. Dos Condes de Carnide (Figure 5). Results corresponded to 12.95%, 27.23% and 16.41% of impermeable public spaces, respectively. As such, 13% was used as the general percentage of impermeable public spaces for all COS sub-class 1.2.2.01.1 “Roads and associated spaces”. Similarly, for the COS sub-class 1.2.1.04.1 designated “Public and private facilities”, the percentage of existing public space was calculated for three representative areas. Results corresponded to 81.41%, 69.04% and 71.60% of impermeable public spaces. Accordingly, 69% was used to determine the overall impermeable public spaces within COS sub-class 1.2.1.04.1 “Public and private facilities”. The same methodology was applied to the remaining sub-classes, giving rise to the impermeable public spaces for each class or, in other words, the “Potential Area for Public Space Adaptation” (Table 2).
In light of the presented analysis, the land use sub-class “Parking lot and courtyard areas” (1.1.1.03.1) is where most opportunities for public space adaptation lie; 67.97% of its respective total analyzed area (507,111.25 m2) is likely to be adequate for intervention.
Further significant opportunities for public space adaptation are evidenced in the land use classes of “Predominantly horizontal continuous urban fabric” (1.1.1.01.1), “Predominantly vertical continuous urban fabric” (1.1.1.01.1) and “Public and private facilities” (1.2.1.04.1), with a potential adaptation area of 44.63%, 41.83% and 39.03%, respectively. Comparatively, reduced opportunities can be observed in the land use classes of “Roads and associated spaces” (1.2.2.01.1) and “Rail network and associated spaces” (1.2.2.02.1). Moreover, there are no obvious opportunities in areas occupied by industry. Overall, the 35.63% of total percentage of potential area for Public Space Adaptation in relation to the total analyzed area (18,714,796.78 m2), is significant enough to be considered when analyzing available assets and opportunities regarding flood adaptation action.
4.4. Possible Designs and Their Infrastructural Significance
In order to assess the infrastructural significance of some of the highlighted types of adaptation measures that entail source control strategies applicable to the ground plane of public spaces, a basic premise was followed. This premise is the capacity of the adaptation measures to retain a minimum of 25 mm height of rainfall from “first flush” precipitation on a given impermeable area. This methodology is somewhat similar to New York City’s “Green Infrastructure Plan”, Philadelphia’s “Green Streets Program” or London’s “Drain London Programme”.
In the interest of verifying the applicability of the given premise in concrete situations within the city of Lisbon, and assess its infrastructural significance with quantifiable means, three preliminary study projects were developed. The first took place in a residential area at Carnide; the second, in a parking lot at Campolide; and a third, in part of the six-way street of Av. Berna (Figure 5).
These projects have included some of the additional measures previously identified as potentially adequate for Lisbon’s flood adaptation undertakings, namely: bioretention planters, bioswales with check dams, rain gardens and green gutters. Other types of adaptation measures, with primary capacities for source control, could have been used, such as cisterns, art installations or water plazas. Most of these additionally highlighted adaptation measures are not limited to the existence of large, unbuilt territories to justify their application, especially when compared to retention and infiltration basins or underground detention reservoirs. Indeed, the options used in the following illustrative designs and subsequent analyses entail small interventions that may be applied to all urban territories, whether compact or disperse.
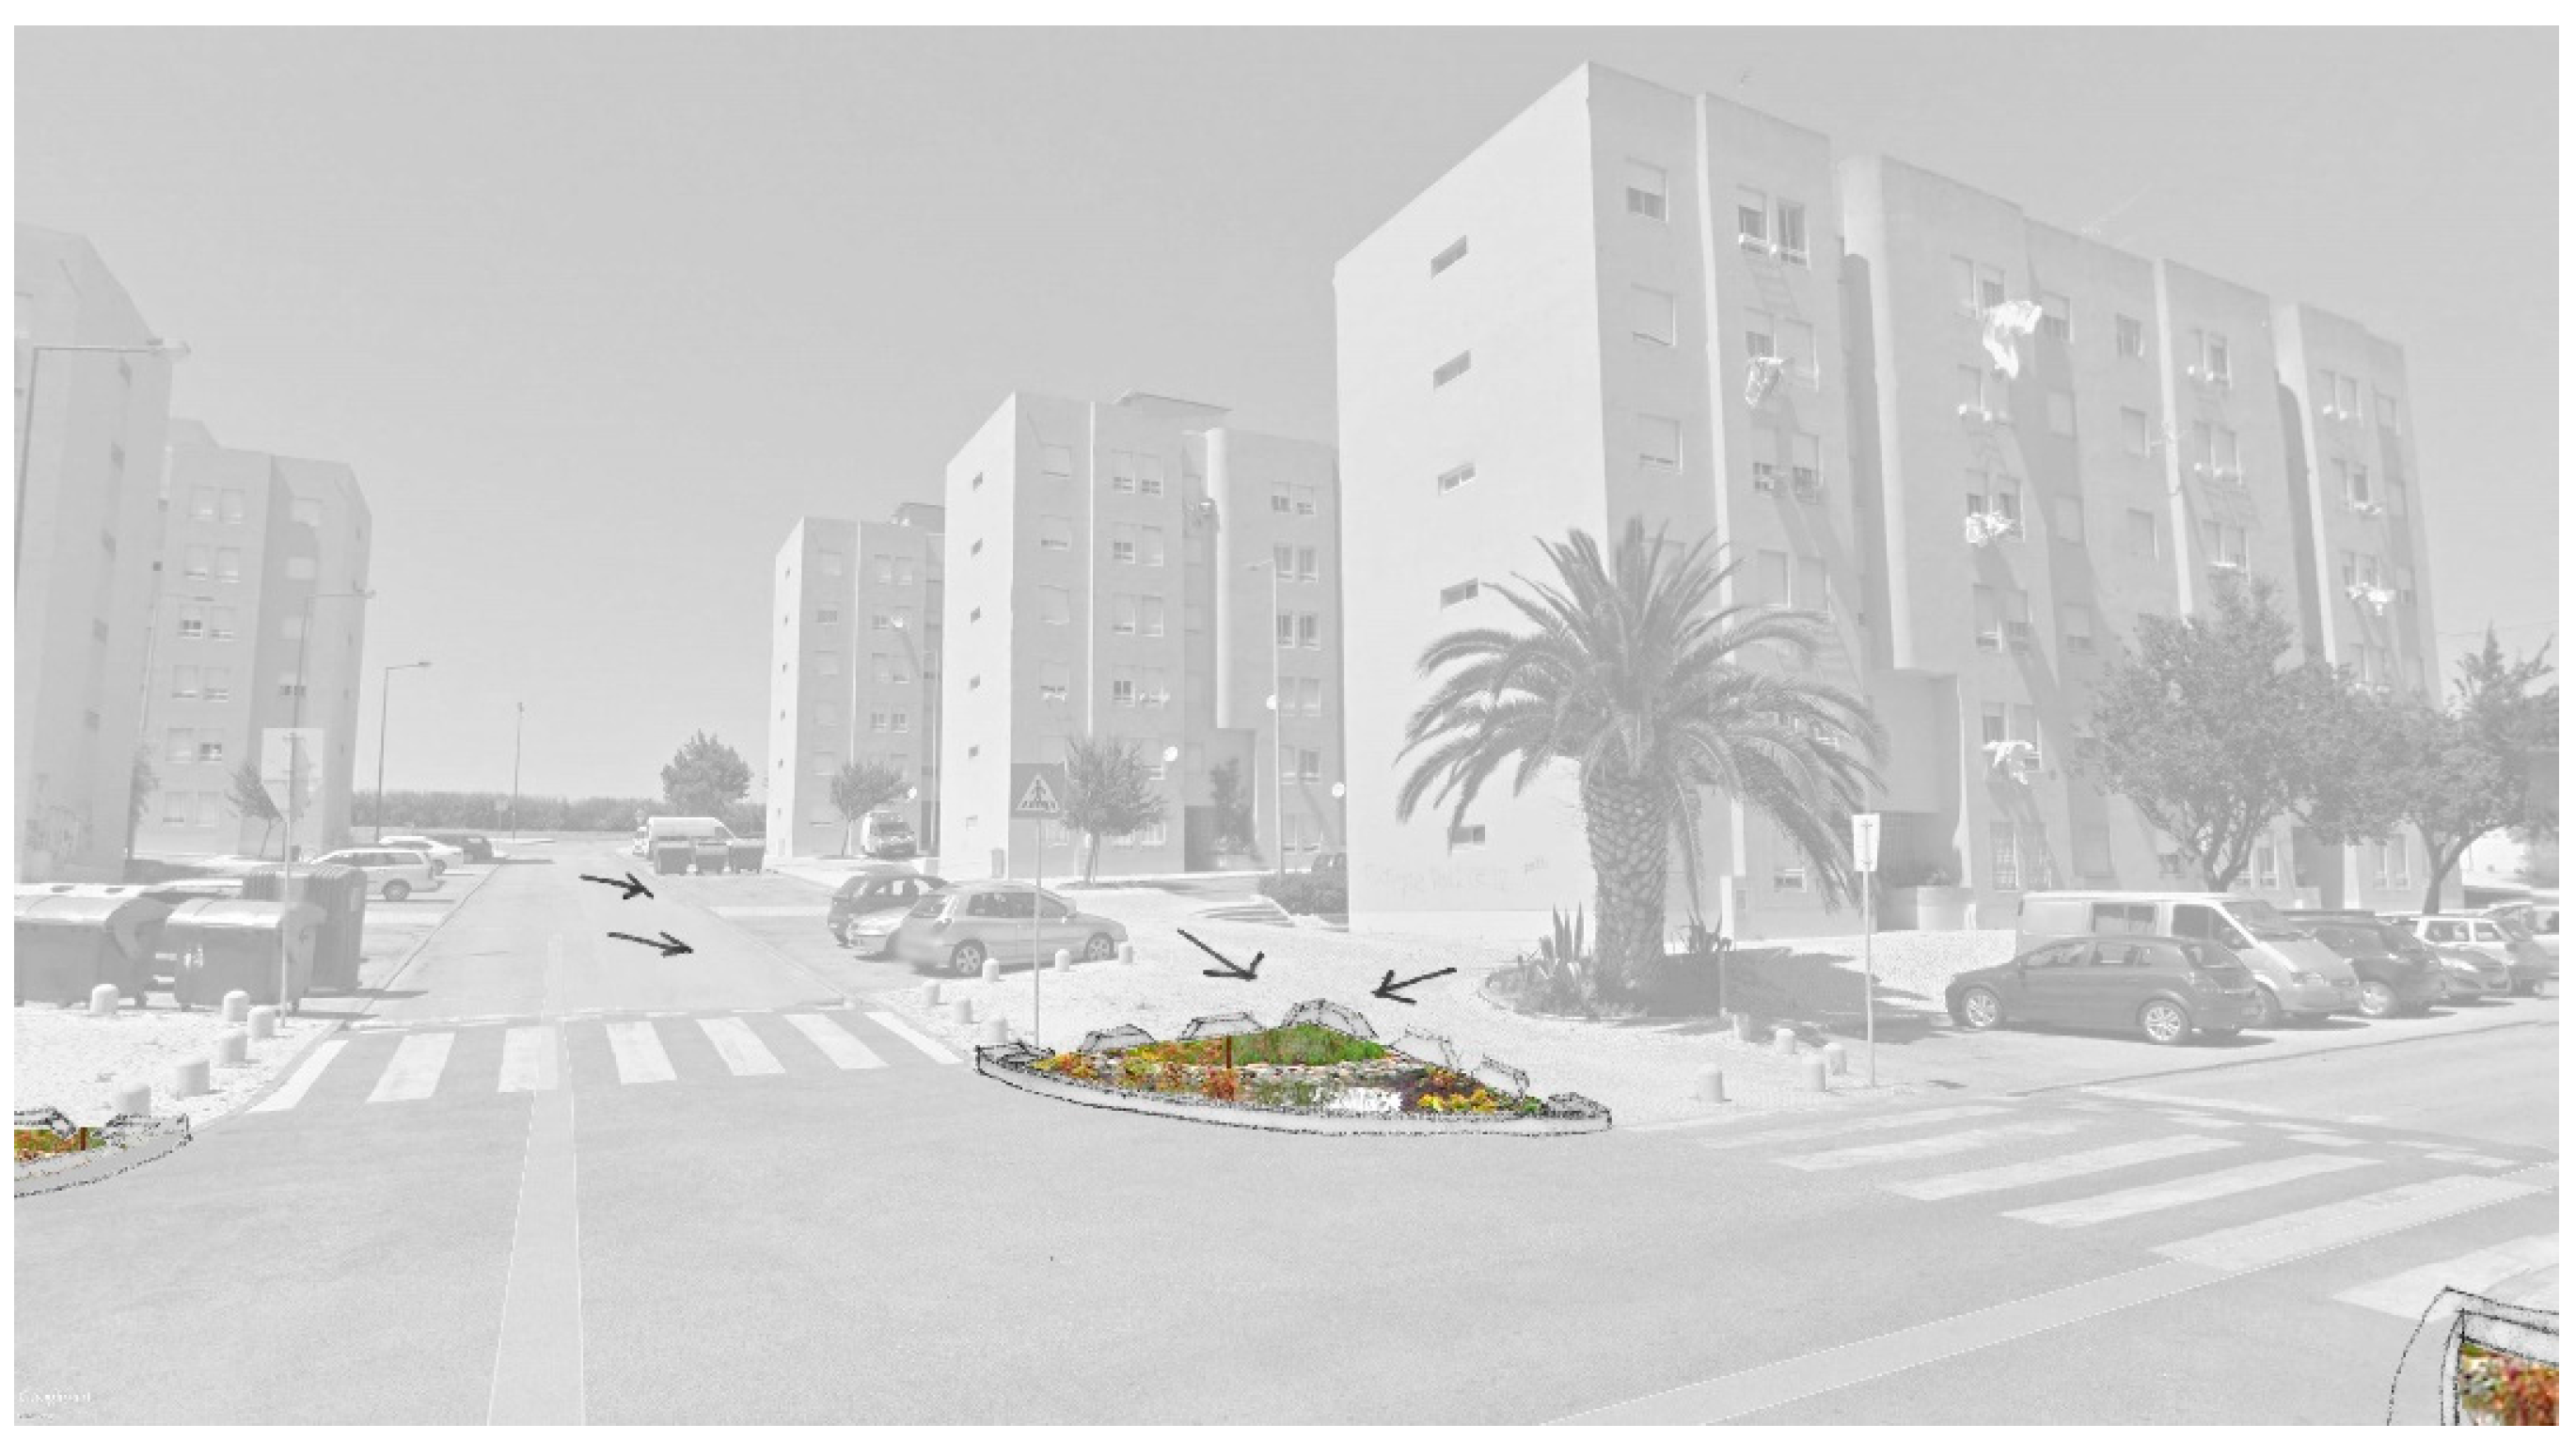
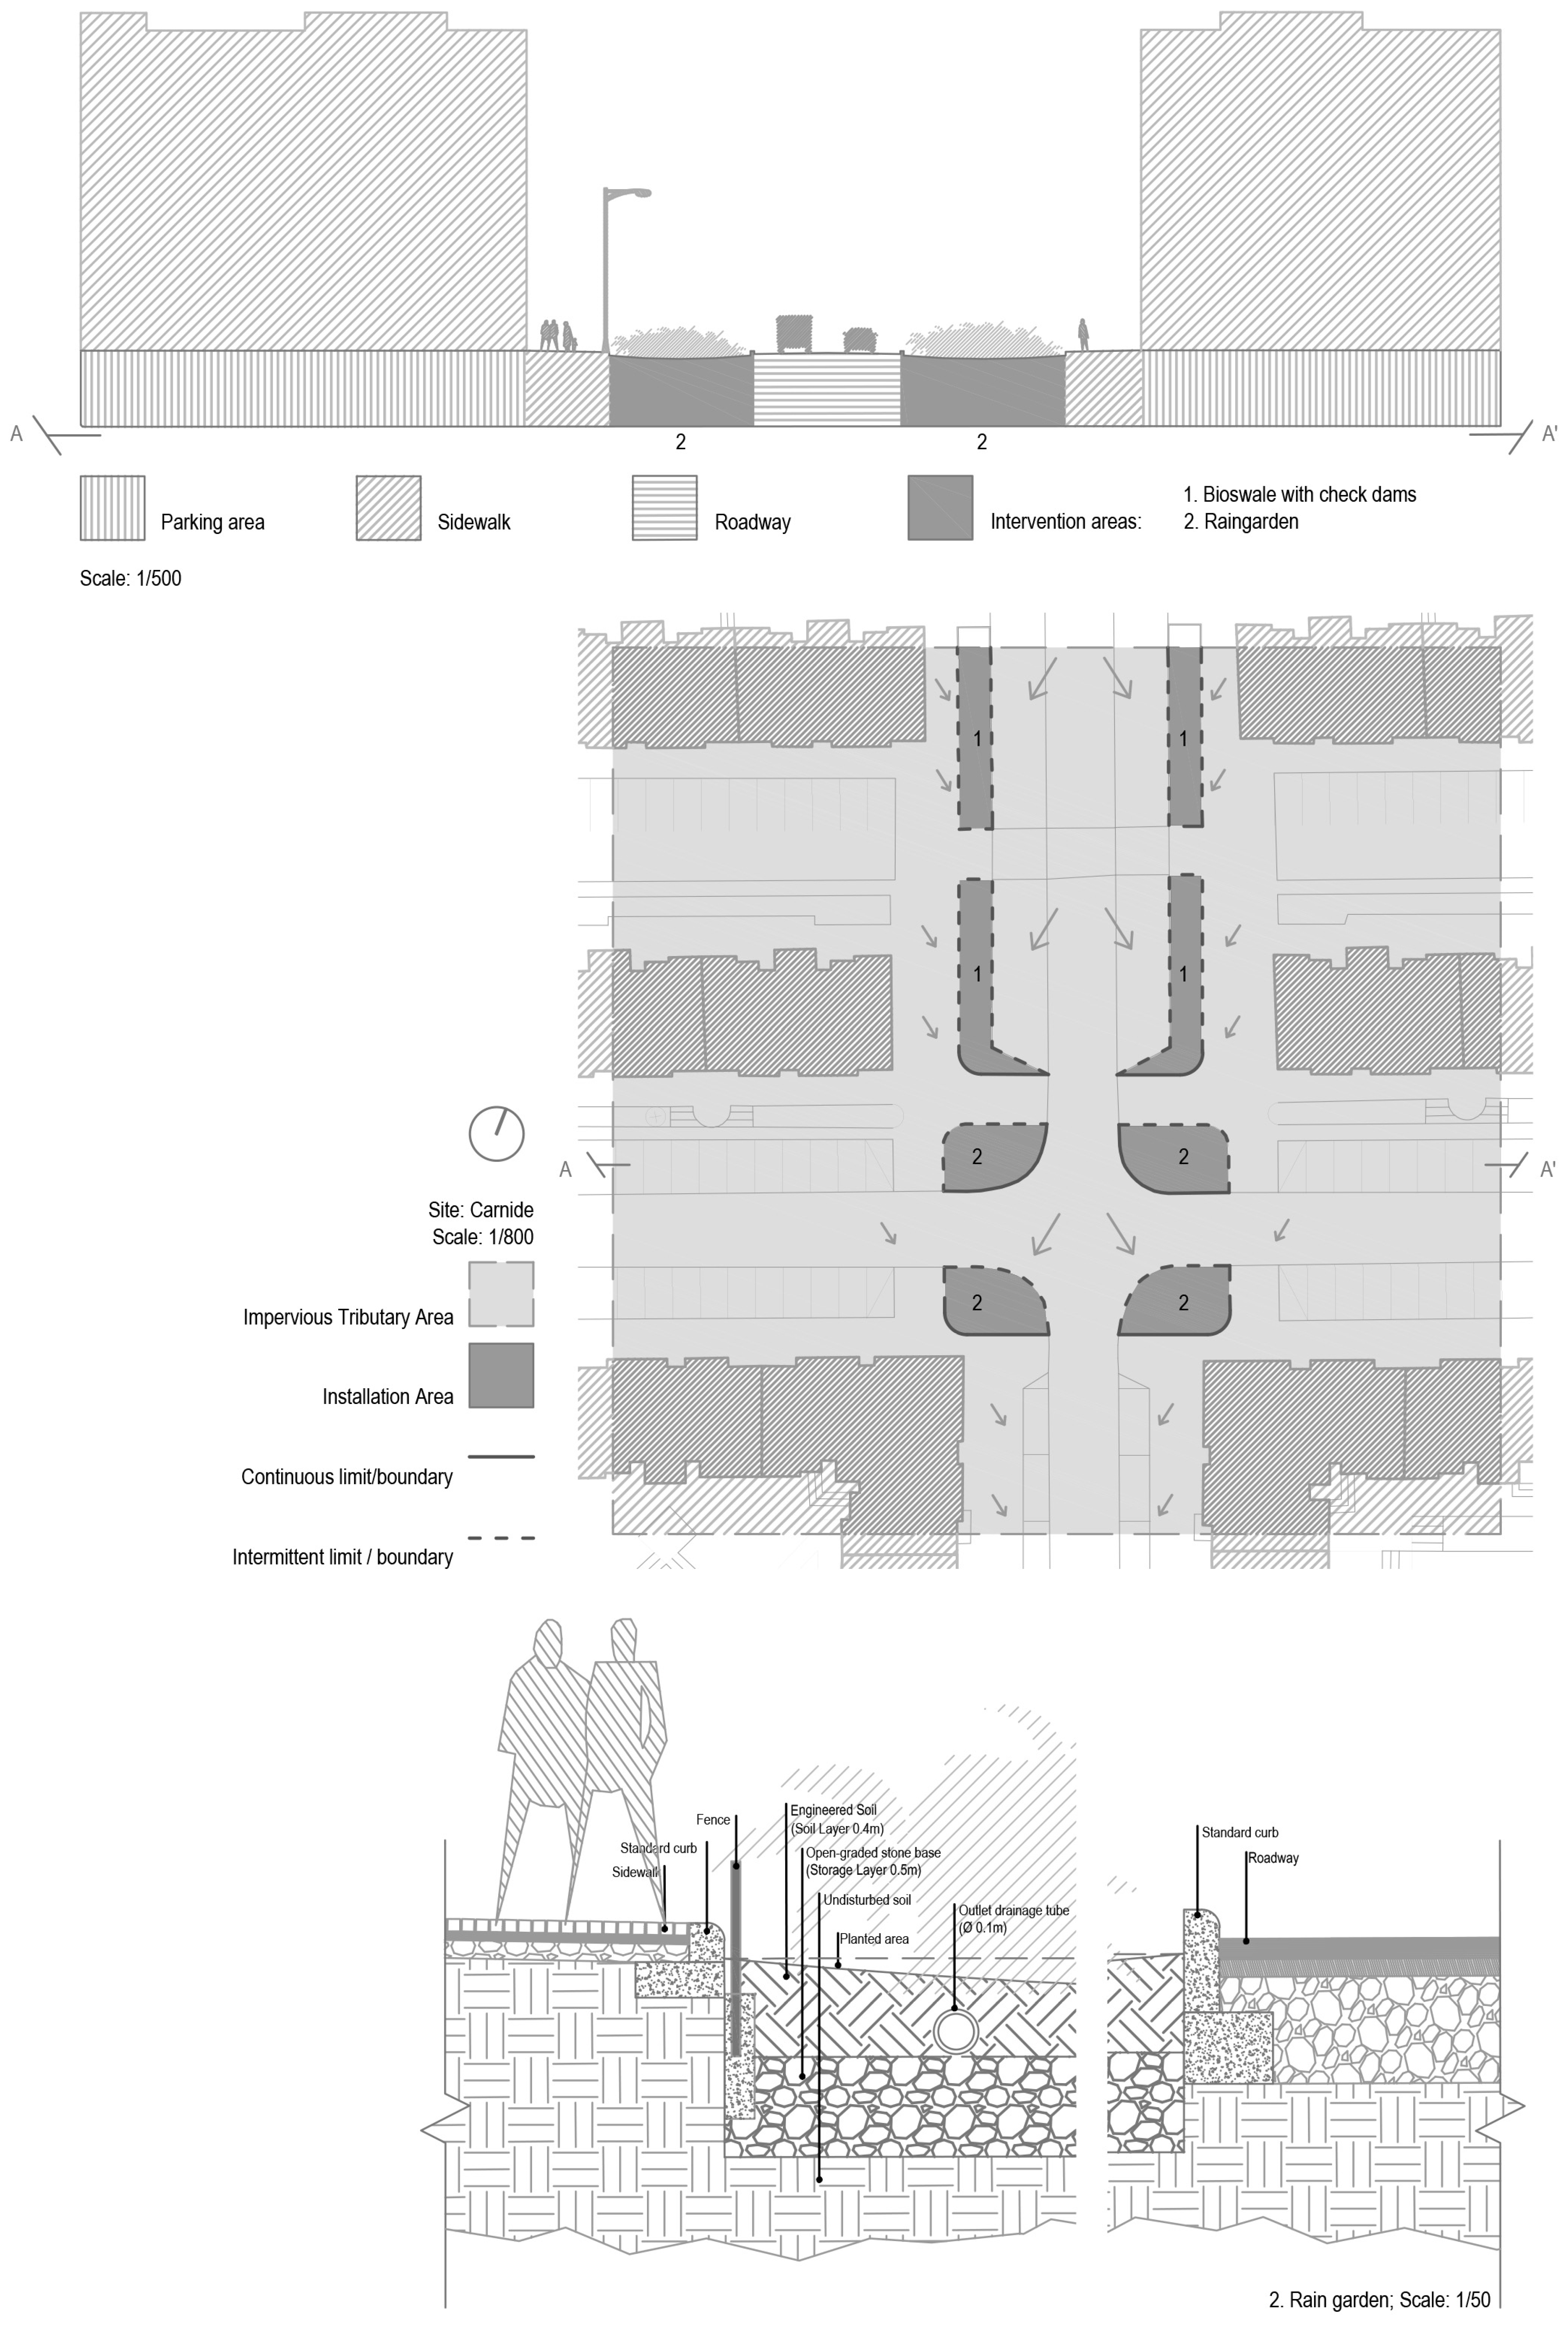
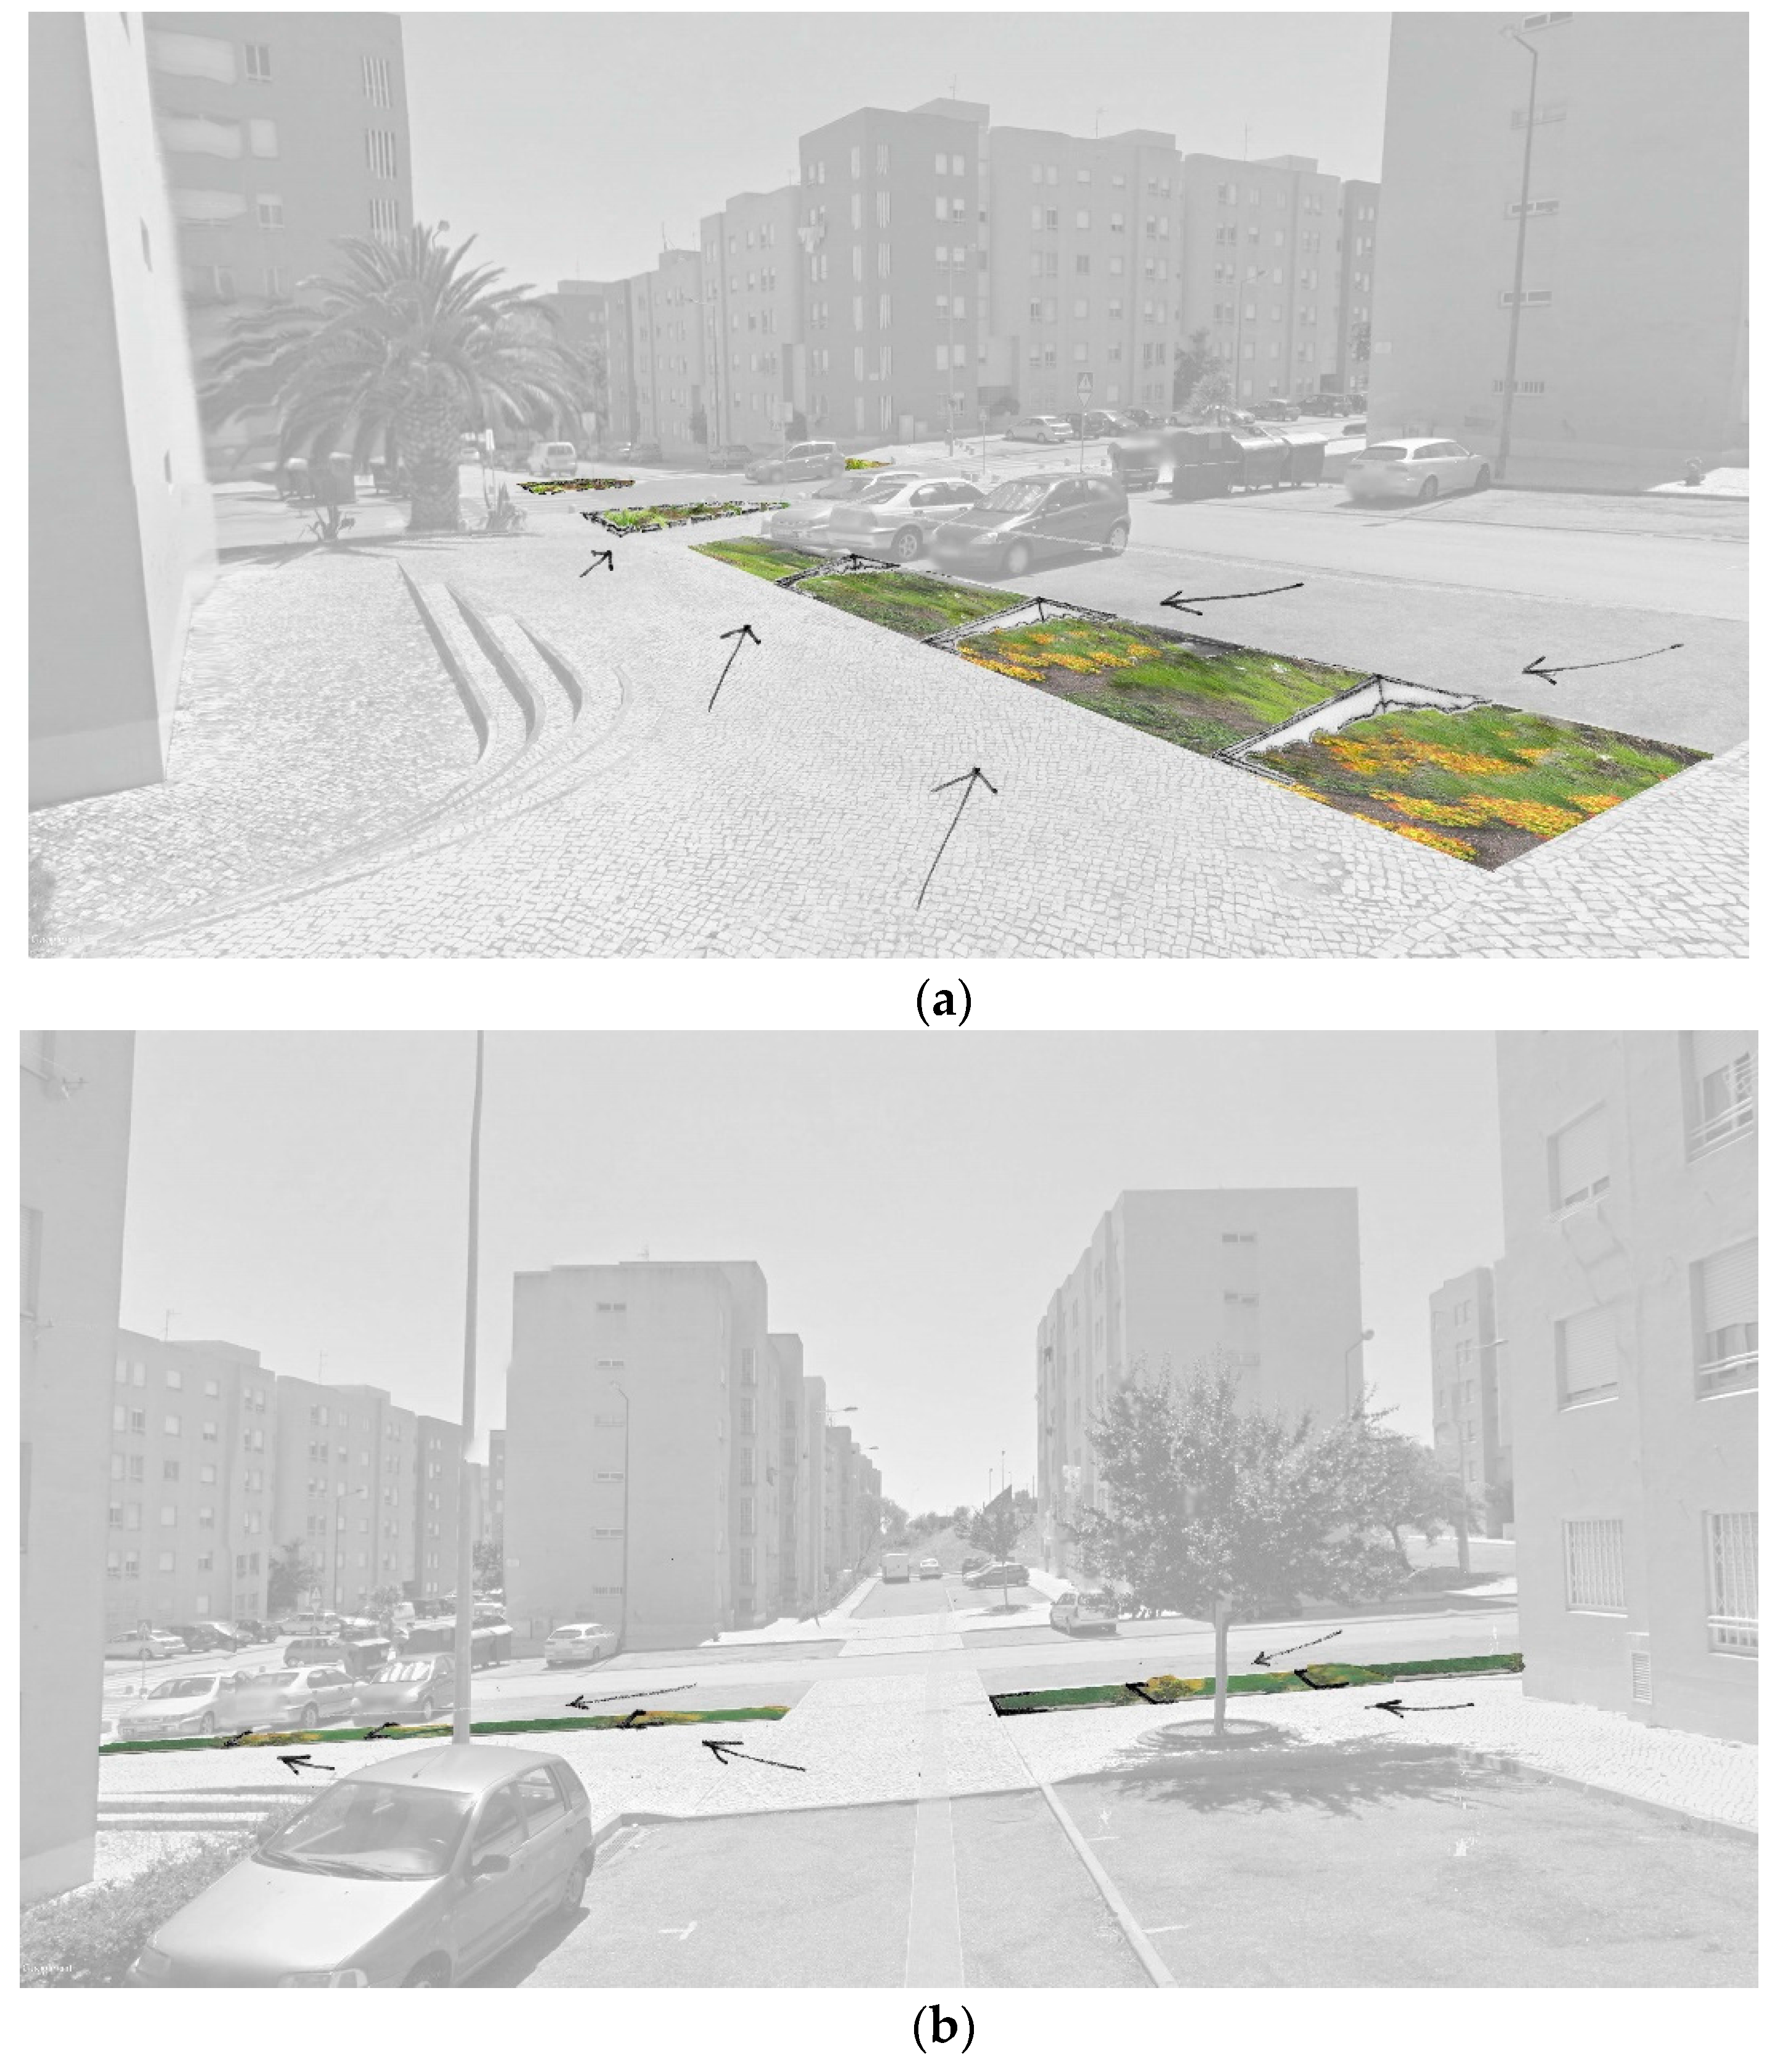
The first studied site consists of an impermeable tributary of 4581.43 m2 in a residential area of Carnide. In accordance with the expected retention of the first 2.5 cm of stormwater falling within this area, adaptation measures must specifically manage at least 114.54 m3 of stormwater volume. To this end, two adaptation measures are proposed: (1) bioswales with check dams and (2) rain gardens (Appendix A.1 —Preliminary design 1). The bioswales with check dams are designed to comprise a soil layer with 0.3 m depth and a storage layer of 0.2 m, while the rain gardens are designed to have a soil layer with 0.4 m depth and a storage layer with a depth of 0.5 m. In accordance with the expected storage capacity volume of each layer and standardized infiltration rate [42], the management of 119.20 m3 of stormwater is estimated. As the sum of infiltration volume and all storage volumes is greater than “2.5 cm stormwater volume within impermeable tributary area”, this proposed intervention fulfills the proposed objective. In this case, measures are implemented in 9% of the total impermeable area.
The second studied site encompasses a parking lot in Campolide with a total impermeable area of 2,456.41 m2. In this situation, the goal consists of managing at least 61.41 m3 of stormwater volume. For this purpose, bioretention planters are proposed in approximately half of the parking lot perimeter limit (Appendix A.2—Preliminary design (2), in a total area of 225.71 m2. More specifically it is proposed for the soil layer to have 0.45 m of depth and the storage layer 0.25 m. In accordance, it is estimated that 62.78 m3 of stormwater could be managed. The proposed to manage 61.41 m3 volume from first-flush stormwater at this site is thus accomplished by an intervention in solely 9% of the total impermeable area.
The third area corresponds to part of the six-way street of Av. de Berna and comprises an impermeable area of 5123.34 m2. In line with the initially presented premise, the goal therefore corresponds to the retention of at least 128.08 m3 of stormwater. In order to fulfill this objective, two types of adaptation measures are proposed: (1) bioswales and (2) green gutters (Appendix A.3—Preliminary design (3)). Bioswales are specifically designed to enable stormwater management of 119.78 m3, comprising a soil layer of 0.5 m of depth and a storage layer of 0.65 m. Green gutters are expected to manage 11.52 m3 of stormwater, comprising a soil layer and storage layer of 0.45 m of depth each. The total estimated stormwater volume managed corresponds to 131.30 m3, therefore achieving the proposed goal. In this intervention, measures are implemented in 5% of the total impermeable area.
When transposing the previously tested premise—i.e., to manage the first 25 mm of stormwater on a given impermeable area—into the entire study area of AUB, it can be seen that how a spatially and timely extensive approach of small scaled and conservative public space retrofits may have a considerable impact in urban flood adaptation undertakings. More specifically, if interventions are focused in solely 5% of all its impermeable public spaces, the management of around 8000.00 m3 of stormwater can be estimated, i.e., a total volume that does not enter the sewerage system and that therefore does not contribute to its overload. In the same line of reasoning, and as seen in Table 3, if interventions are applied to 15% of the existing impermeable public spaces, the volume of stormwater managed would be circa 24,500.00 m3. Furthermore, if interventions are applied to 25% of the existing impermeable public spaces, the volume of stormwater managed would be around 41,500.00 m3.
However, bearing in mind the known pressures and limitations of any urban system, and Lisbon in particular, the opportunity for a widespread implementation of these measures may only arise within a strategic approach that encompasses an extended timeframe. More specifically, the proposed types of measures must not only be extensively implemented along public space retrofits throughout the city, but are more likely to be implemented throughout and extensively within a timeframe. Accordingly, different scenarios were developed for the next 20, 50 and 100 years. The first 20 years were divided in four periods of 5 years and the next stages encompassed a period of 30 years (reaching the timeframe of 50 years from 2017) and a period of 50 years (reaching the timeframe of 100 years from 2017) (Table 3).
In light of these timeframes, different percentages for public space adaptation retrofits were anticipated for each range. The proposed scenarios maintained the widespread conservative approach in this exercise. For example, for the next 20 years (2017–2037), it is envisioned as possible to retrofit 15% of the potential areas for public space adaptation, i.e., retrofits in 15% of impermeable public spaces within each analyzed COS class. This scenario is further divided in four periods of 5 years, each entailing a percentage of impermeable public space adaptation of 2%, 3%, 5% and 5%. For the subsequent 30 years (2017–2067), it is projected that adaptation measures can be applied to more than 10% of the potential area for intervention. In the following 50 years (2017–2117), it is projected that adaptation measures can be applied to more than 20% of the potential areas for intervention. Considering the entire time-lapse for the next 100 years, from 2017 to 2117, slowly, through small interventions within a wider strategy, 45% of the existing impermeable public spaces can be retrofitted.
In addition, one must bear in mind that the percentage of adapted area does not correspond to the actual area of intervention, where adaptation measures are applied. In order to fulfill the premise to manage the first 25 mm of stormwater, the previous illustrative designs implied public space retrofits of around 9% of the total area under analysis. Recalling this fact, when adapting 45% of AUB impermeable tributary public spaces, only 9% of this area is expected to entail the concrete application of adaptation measures. In other words, as illustrated in Figure 6, implemented adaptation measures may cover 45% of an impermeable area by merely implementing adaptation measures in 9% of the given area.
Considering the infrastructural source control significance of each of the abovementioned scenarios: if adapting 5% of the impermeable public spaces of AUB, then a minimum of 8161.92 m3 of stormwater volume can be managed; if 45% of potential impermeable public spaces are adapted, around 75,000.00 m3 of stormwater volume can be managed. Likewise, even though adapting only 5% of impermeable public spaces would appear to provide insignificant outcomes, adapting 5% extensively along impermeable public space tributary areas and over an extended timeframe can nevertheless engenders important achievements in Lisbon’s flood adaptation actions.
5. Discussion
A volumetric analysis is particularly adequate to assess source control measures. As a common variable, volume retention capacity enables the comparison among different types of measures. More specifically, for the particular area under study of AUB, two underground reservoirs are proposed in Lisbon’s PDM. These two reservoirs were considered for the underground drainage branches of “Avenidas Novas” and “Campolide-Benfica,” each one enabling 13,400 and 38,100 m3 of stormwater storage, respectively. Both reservoirs would comprise a total potential storage of 51,500 m3. When comparing the storage volumes from these conceptualized reservoirs with the potential managed volumes estimated in Table 3, one can note a significant similarity in scale of managed volumes. Summarizing, if adapting 25% of the impermeable public spaces, it is possible to manage at least 40,900 m3 of stormwater volume. Moreover, if adapting 45% of the impermeable public spaces, it is possible to manage at least 74,000 m3 of stormwater volume.
Besides the similarity in scale of volume managed, the discrepancy in regard to the adjacent benefits provided by each of the proposed types of measure is noteworthy: Underground reservoirs vs. source control adaptation measures (such as the ones here considered: bioswales, rain gardens, bioretention planters, green gutters, among others). Through punctual interventions focused on a particular goal, conventional, rigid, mono-functional measures may be particularly effective. Undoubtedly, reservoirs for example can be built in just a few years and are able to retain considerable volumes of stormwater, regardless of the duration and proximity of rainstorms. In comparison, adaptive and flexible source control infrastructures, such as the ones proposed here, require an extensive spatial application that, in light of urban dynamics, are only likely to occur after a considerable period of time. Indeed, the types of proposed measures encompass only a natural storage capacity for stormwater volume, inevitably providing only enough confidence on the efficiency to store waters from first flushes. In opposition to the more conventional rigid engineering measures, however, the measures detailed here entail multiple co-benefits, which go from microclimatic amenity to the purification of polluted water, from the enrichment of biodiversity to the upgrading of pleasurable urban spaces. Moreover, the proposed measures are particularly flexible and adaptable in light of the expected (and continuously evolving) changes in weather regimes, a factor that may contribute to the limiting of “barriers and constraints on pro-ecological behavior” [43]. In addition, other advantages may arise from the complementarity amongst other comprehensive strategies supported by the municipality, namely by programs such as “Pavimentar Lisboa 2015–2020” or “Uma Praça em cada Bairro”.
The presented—openly exploratory—estimated calculations were particularly conservative, namely by the consideration of unambitious scenarios and the fact that, considering the available official spatial information, only “ground plane public spaces” as in [41] were included in the analysis. More specifically, types of measures such as green roofs or green walls were excluded, thus contributing to an underestimation. Indeed, improved and more comprehensive results could have been attained with available spatial information of higher quality and detail (encompassing, for instance, the following research: [44]).
The additional adaptation measures here analyzed, should therefore move beyond a rhetoric presence in reports and effectively enter the processes of concrete implementation action. Rigid engineering measures of individual nature, such as deviation tunnels and underground reservoirs, may be considered as fundamental in order to promptly solve Lisbon’s current flood problems. Yet, bearing in mind the uncertainties associated to climate change as well as the need to plan for more distant horizons, these conventional measures alone, i.e., isolated from complementary strategies of a more adaptive kind, can rapidly become inadequate. In line with Kim et al. [45], to promote an advanced management of urban drainage systems, conventional mono-functional infrastructural measures must be accompanied by other solutions, of a more local and eco-friendly nature, albeit extensively applied.
6. Final Considerations
One of the most strongly advocated strategies concerning urban floods presently in effect in Lisbon’s Municipal Master Plan is the “source control” strategy. Specific adaptation measures within the municipal-conducted strategy comprise: green walls, green roofs, tree alignments, bioretention basins, cisterns, underground reservoirs, infiltration trenches, leaky wells and permeable pavements. In the process of assessing the “Conceptual Framework of flood adaptation measures applicable in the design of public spaces” [11] in the Lisbon case, five additionally relevant measures under the same strategy were identified, namely: bioswales, bioretention planters, rain gardens, check dams and green gutters. Within the specific area of Alcântara Upper Basin, the capacity to retain first-flush stormwater was estimated for the proposed measures.
The presented results, from the designs and spatial analysis, enabled the verification that the efficiency of the types of adaptation measures here proposed can be compared with the conventional mono-functional types of infrastructure, when considering the wider time-frames particularly supported by climate change literature. In other words, one may conclude that when considering the extensive application of the additionally highlighted types of measures, both in space and time, the capacity to retain first-flush volumes to avoid sewerage overflow is significant and must be taken into account in municipal undertakings.
Regardless of the recognized necessity to further explore the pros and cons of both mentioned types of measures, this assessment does not intend to advocate adaptable measures, of a more ecological nature, over a rigid and strongly artificialized infrastructure. Rather, it aims to question current mainstream methodology and to reinforce the legitimacy of other possible types of source control measures so they may promptly enter current and future planning discussions.
Lisbon’s floods are not, and must not, be considered as exceptional events. As such, undertakings targeted at eradicating this phenomenon, which is further expected to become even more frequent and intense, can be counterproductive. By contrast, the aim to reduce vulnerabilities and improve the adaptive capacity of our territories, not only moderates potential hazards, but also exploits existing opportunities. By learning how to live with floods, beneficial outcomes may arise, namely from water purification processes, water storage and consumption, microclimatic amelioration, amongst others. Indeed, although technology and specialization are often presented before us as the only way of solving complex problems, bearing in mind their incapacity in acknowledging the wider network of relations between things, they may sometimes solve particular problems while creating others [46].
Finally, it should be noted that while this research is applied to a particular situation within Lisbon’s municipality, its findings inform climate change adaptation planning practices for the entire municipality. In the same line of reasoning, this study may also contribute to the discussion of alternative flood management practices within other municipal contexts.
Acknowledgments
This research was supported by the Portuguese Foundation for Science and Technology funded by ‘Quadro de Referência Estratégico Nacional—Programa Operacional Potencial Humano (QREN—POPH), Tipologia 4.1—Formação Avançada, comparticipado pelo Fundo Social Europeu e por fundos nacionais do Ministério da Ciência, Tecnologia e Ensino Superior (MCTES)’, under the individual doctoral grant (SFRH/BD/76010/2011); and by the Research Centre for Architecture, Urbanism and Design (CIAUD), University of Lisbon, Lisbon, Portugal, under the grant UID/EAT/04008/2013. Authors would further like to thank José Saldanha Matos for kindly sharing access to the Drainage Master Plan 2006–2008.
Author Contributions
Maria Matos Silva was responsible for the research concept, research design and questions, data collection, data analysis, writing the manuscript and selecting the references. João Pedro Costa contributed to results analysis and manuscript revision. The disclosed article introduces content that is developed in the doctoral thesis of Maria Matos Silva, with the title “Public space design and flooding: facing the challenges presented by climate change”, integrated within the University of Barcelona in the subject areas of Public Space and Urban Design. João Pedro Costa was the supervisor of the research and coordinates the research group on Urban Design and Climate Change Adaptation at CIAUD (Research Centre for Architecture, Urbanism and Design) at the Faculty of Architecture, University of Lisbon.
Conflicts of Interest
The authors declare no conflict of interest.
Abbreviations and Acronyms
ASL—Average Sea Level; AUB—Alcântara Upper Basin; CSO—Combined Sewage Overflows; IPCC—Intergovernmental Panel on Climate Change; Lisbon’s PDM—Lisbon’s Municipal Master Plan (Plano Director Municipal de Lisboa); SLR—Sea Level Rise.
Appendix A
Appendix A.1. Preliminary Design 1—Residential Area at Carnide
The first studied site consists on an impermeable tributary area of 4581.43 m2 in a residential area of Carnide. Two types of adaptation measures are proposed: (1) bioswales with check dams and (2) rain gardens.
The bioswales with check dams are designed longitudinally along both sides of the sloped street, between the parking area and the sidewalk. Each bioswale is expected to have the same length as the parking area, which is around 18 m; and a width of around 3 m (Figure A1). To maintain the material character of the existing streetscape, which is essentially composed of traditional Portuguese limestone paving and concrete curbs and boundaries, check dams are projected as small limestone barriers with a length of approximately 3 m and a depth of 0.5 m (Figure A2). No other additional peripheral boundaries are projected for this measure. Moreover, to promote water purification and infiltration, and to avoid mosquitos breeding, it is further envisioned for these bioswales with check dams to comprise appropriate native vegetation, specifically small bushes and grasses such as Eleocharis palustris (L.) R.S., Sparganium erectum L. or Polypogon monspeliensis (L.) Desf. Lastly, the bioswales with check dams are designed to comprise a soil layer with 0.3 m depth and a storage layer of 0.2 m. In accordance with the expected storage capacity volume of each layer (15–25% for soil; 33–50% for broken stone and 33–50% for pervious concrete, according to Green Streets Program, Philadelphia) and a standardized infiltration rate (if unknown, the infiltration rate of existing soil may be considered to be 0.508 cm/h, according to Green Streets Program, Philadelphia, PA, USA), it is estimated for the total storage capacity of this measure to be 42.49 m3.
Rain gardens are projected to be implemented in the underused sidewalk areas derived from the roadway crossing (Figure A3). Each rain garden, with an approximate area of 45 m2, will have a concave shape. Its central point will be 0.7 m below the level of the sidewalk and it will comprise a borderline boundary made out of concrete curbs. The curbs will be individually spaced apart in the borders that collect stormwater in order to enable water flows into the rain garden. The proposed curbs will also be slightly elevated in order to serve as a physical trespassing impediment for cars and people.
Envisioned to fulfill high rates of rainwater absorption, the projected rain gardens are to be planted with deep-rooted filtrating shrubs, perennials and trees—more specifically, vegetation such as Alisma plantago-aquatica L., Schoenus nigricans L., S. fluitans L., Iris pseudacorus L. or Typha latifolia L. The soil layer of the rain gardens will have a depth of 0.4 m and the storage layer a depth of 0.5 m. In accordance, it is estimated for the total storage capacity to be 76.71 m3.
By adding the two “Partial Stormwater Volumes Managed” (42.49 m3 + 76.71 m3) it is possible to estimate the “Total of Stormwater Volumes Managed” in this area of intervention, which is 119.20 m3. In other words, through an intervention in solely 9% of the total impermeable area, it is possible to manage 119.20 m3 of first-flush stormwater volumes. As this sum of managed volumes of stormwater is greater than the expected retention of the first 25 mm of stormwater volume falling over the selected impermeable area of intervention, i.e., greater that 114.54 m3, the designed intervention fulfills the proposed objective (Table A1).
Figure A1.
Design for preliminary study 1—Residential area at Carnide.

Figure A2.
Two perspectives (a,b), 3D sketch of the proposed ‘check dams’ measure (and likely stormwater flow directions) to be implemented in a residential area at Carnide, namely at Rua Professor Pais da Silva. Source: Author’s sketch.
Figure A2.
Two perspectives (a,b), 3D sketch of the proposed ‘check dams’ measure (and likely stormwater flow directions) to be implemented in a residential area at Carnide, namely at Rua Professor Pais da Silva. Source: Author’s sketch.

Figure A3.
3D sketch of the proposed rain gardens (and likely stormwater flow directions) to be implemented in a residential area at Carnide, namely at the intersection of Rua Professor Pais da Silva with Rua Professor Almeida Lima. Source: Author’s sketch.
Figure A3.
3D sketch of the proposed rain gardens (and likely stormwater flow directions) to be implemented in a residential area at Carnide, namely at the intersection of Rua Professor Pais da Silva with Rua Professor Almeida Lima. Source: Author’s sketch.

Table A1.
Worksheet for the calculation of managed stormwater volume in preliminary design 1—Residential area at Carnide.
Table A1.
Worksheet for the calculation of managed stormwater volume in preliminary design 1—Residential area at Carnide.
| Implementation Area | ||
| “Impervious Tributary Area” (m2) | 4581.4279 | |
| 0.025 m stormwater Volume (m3) | 114.5357 | |
| Stormwater Volume Managed | Bioretention Planters (0.3 m + 0.2 m depth) | Rain Garden (0.4 m + 0.5 m depth) |
| Installation Geometry | ||
| Installation Volume (m3) | 147.7712 | 176.7347 |
| Installation Area (m2) | 197.0282 | 196.3719 |
| Infiltration Data | ||
| Infiltration Design Rate (cm/h) | 0.5080 | 0.5080 |
| Infiltration Period (h) | 8 | 8 |
| Estimate Infiltration Volume (m3) | 8.0072 | 7.9806 |
| Soil Layer | ||
| Volume of Soil (m3) | 59.1085 | 78.5488 |
| Porosity of Soil (%) | 25% | 25% |
| Storage Volume of Planting Soil (m3) | 14.7771 | 19.6372 |
| Storage Layer | ||
| Volume of Storage Layer (m3) | 39.4056 | 98.1860 |
| Porosity of Storage Layer (%) | 50% | 50% |
| Storage Volume of Drainage Layer (m3) | 19.7028 | 49.0930 |
| Partial Stormwater Volume Managed (m3) | 42.4872 | 76.7107 |
| Estimated Total of Stormwater Volume Managed (m3) | 119.1979 | |
Appendix A.2. Preliminary Design 2—Parking Lot at Campolide
The second studied site encompasses a parking lot in Campolide with a total impermeable area of 2456.41 m2. Bioretention planters are proposed in approximately half of the parking lot perimeter limit, in a total area of 225.71 m2 (Figure A4). The proposed bioretention planters are vegetated depressed planters, whose ground base is approximately 0.4 m below the pre-existing street level. The proposed bioretention planters are surrounded by two different types of boundaries. When facing the parking lot and the car road, bioretention planters will be bordered by a permeable curb, i.e., by individual curbs linearly spaced apart, which allows stormwater to enter into the planter and serves as a physical obstacle (Figure A5). When facing the sidewalk, a metal barrier is proposed to avoid occasional stumbling into its lower sunken area. Moreover, these planters are composed by native small bushes and grasses or even trees, in order to facilitate water storage, as well as filtration and infiltration processes. These species may include Scipus lacustris L., Equisetum ramosissimum Desf., Polygonum hydropiper L. or Peucedanum lancifolium H. L. ex L. It is also proposed for the soil layer to have 0.45 m of depth and the storage layer to be 0.25 m in depth. In accordance, it is estimated that these measures are able to manage at least 62.78 m3 volume of stormwater. The abovementioned proposed goal of managing 61.41 m3 volume from first-flush stormwaters in this site is thus accomplished by an intervention in solely 9% of the total impermeable area (Table A2).
Figure A4.
Design for preliminary study 2—Parking lot at Campolide.
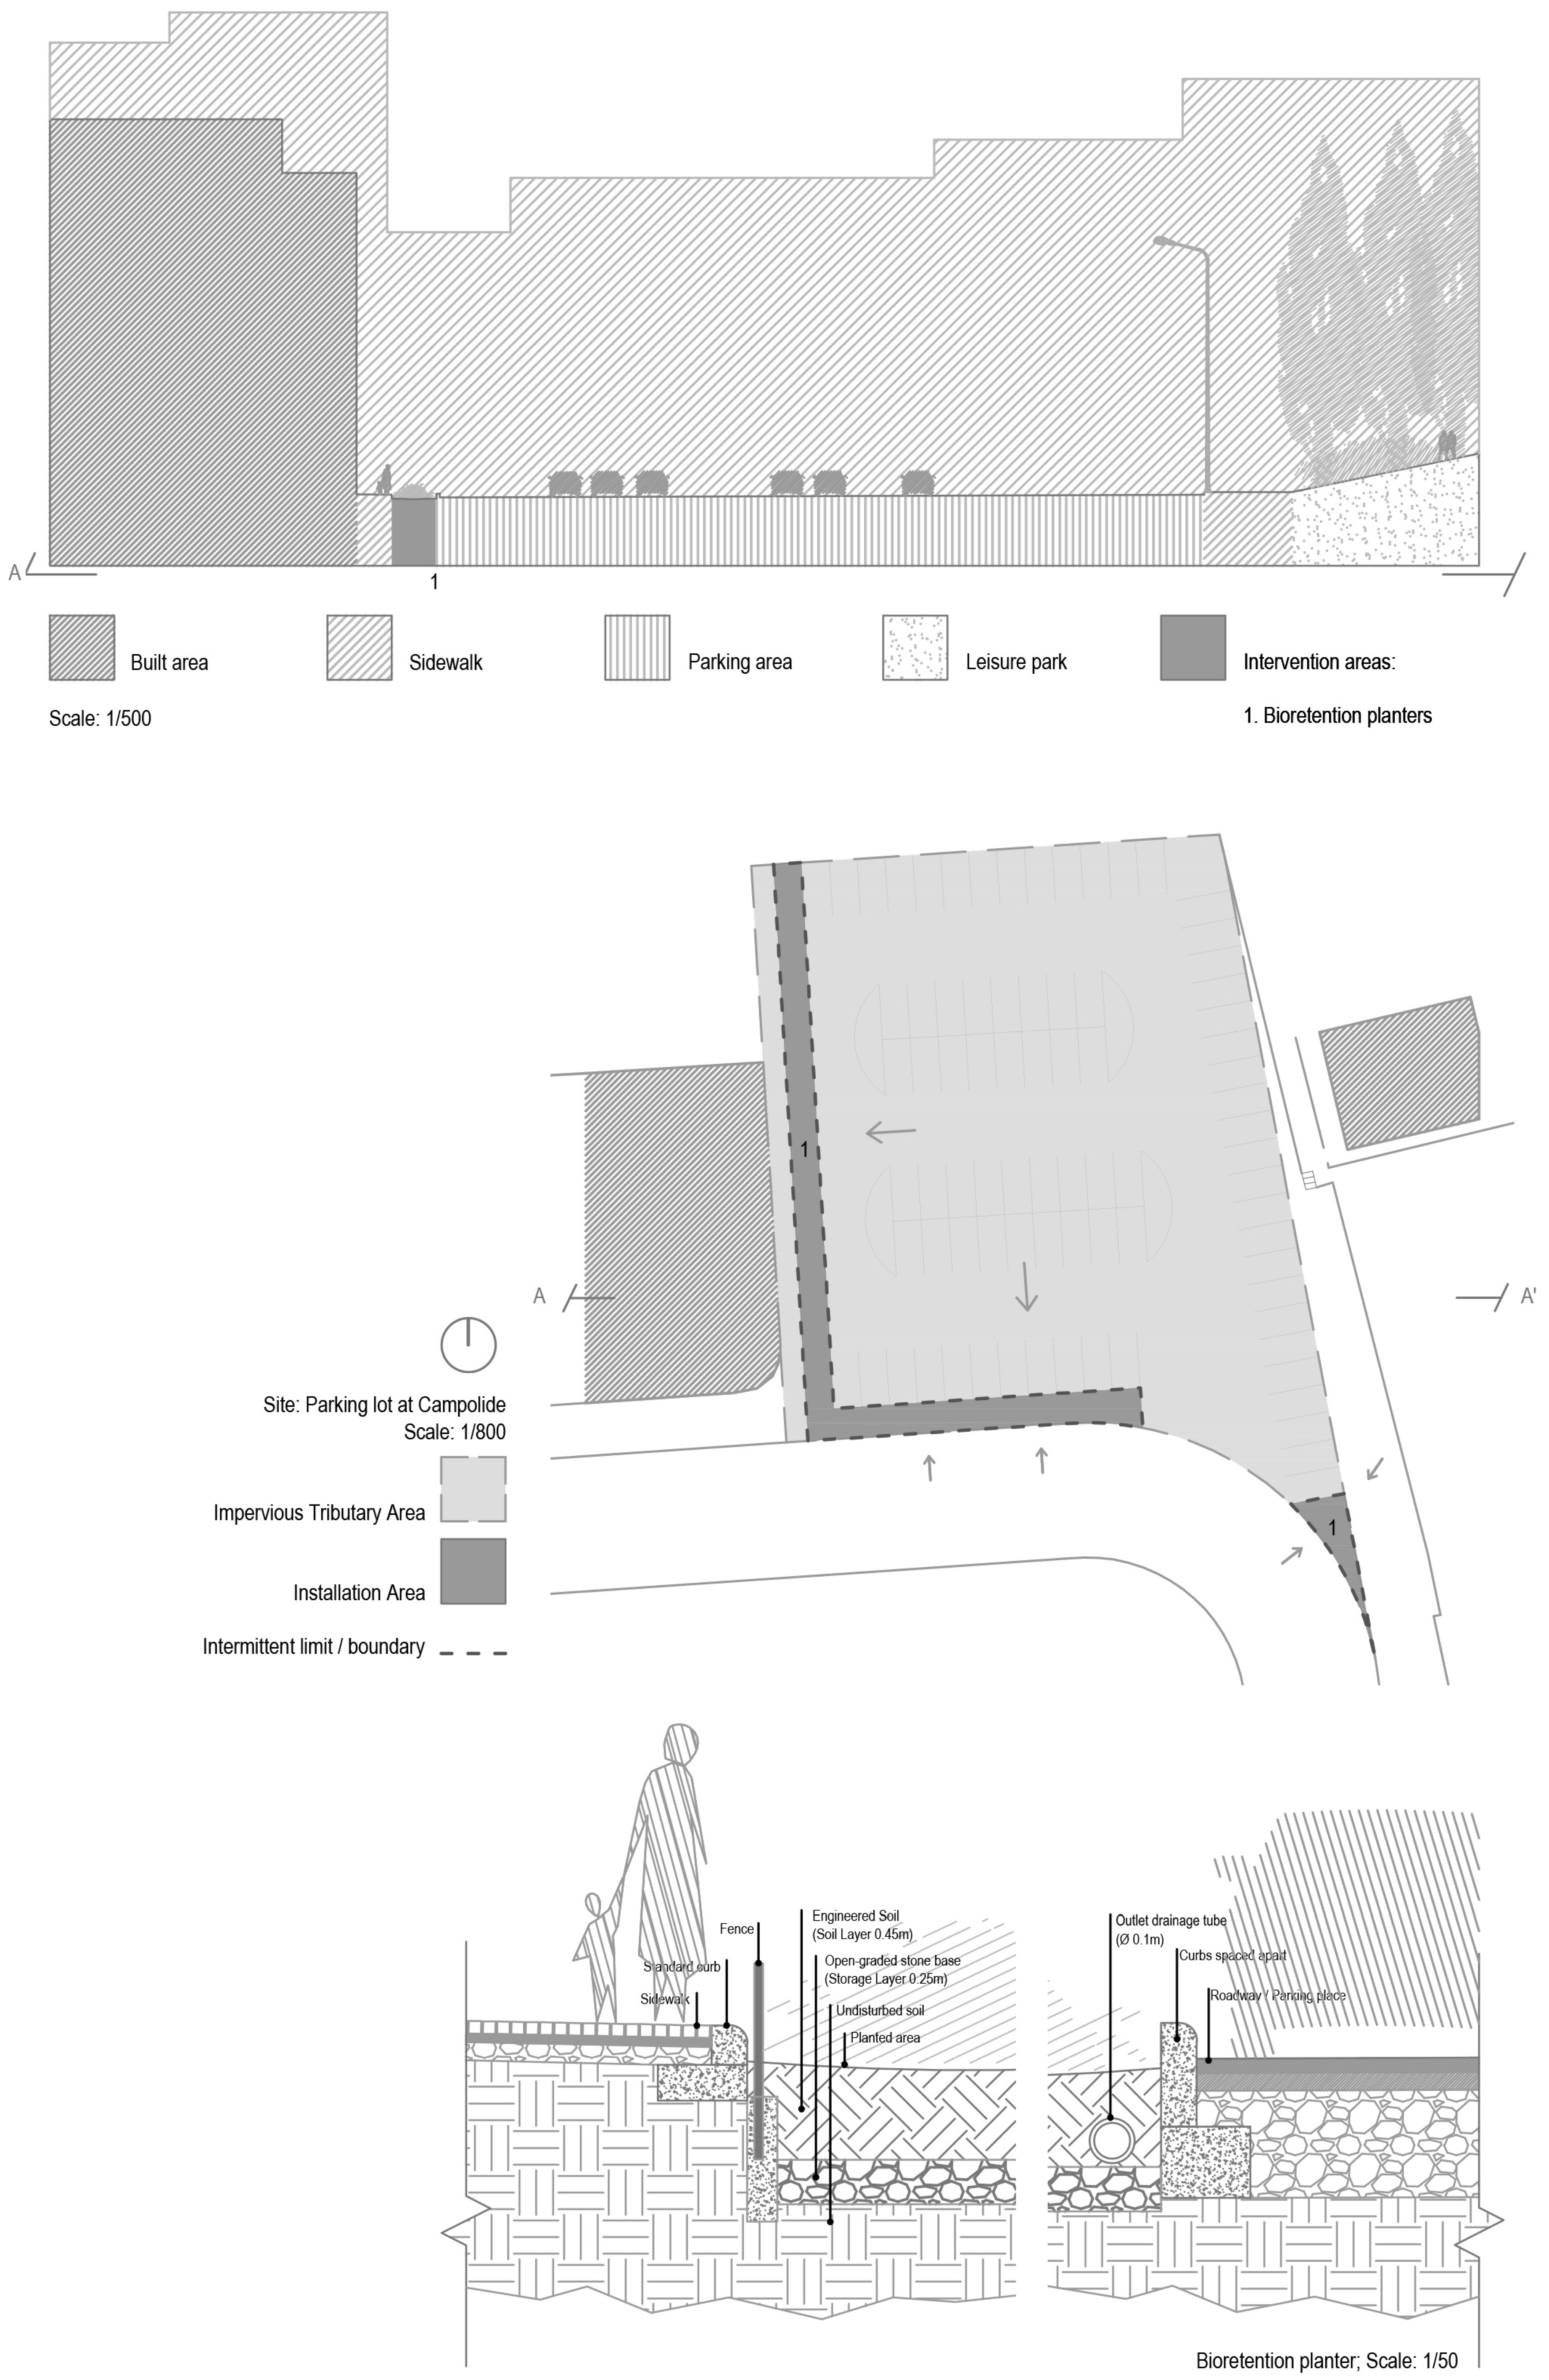
Figure A5.
3D sketches (a,b) of the proposed bioretention planters (and likely stormwater flow directions) to be implemented in a parking lot at Campolide, namely by the lower end of Rua de Campolide. Source: Author’s sketch.
Figure A5.
3D sketches (a,b) of the proposed bioretention planters (and likely stormwater flow directions) to be implemented in a parking lot at Campolide, namely by the lower end of Rua de Campolide. Source: Author’s sketch.
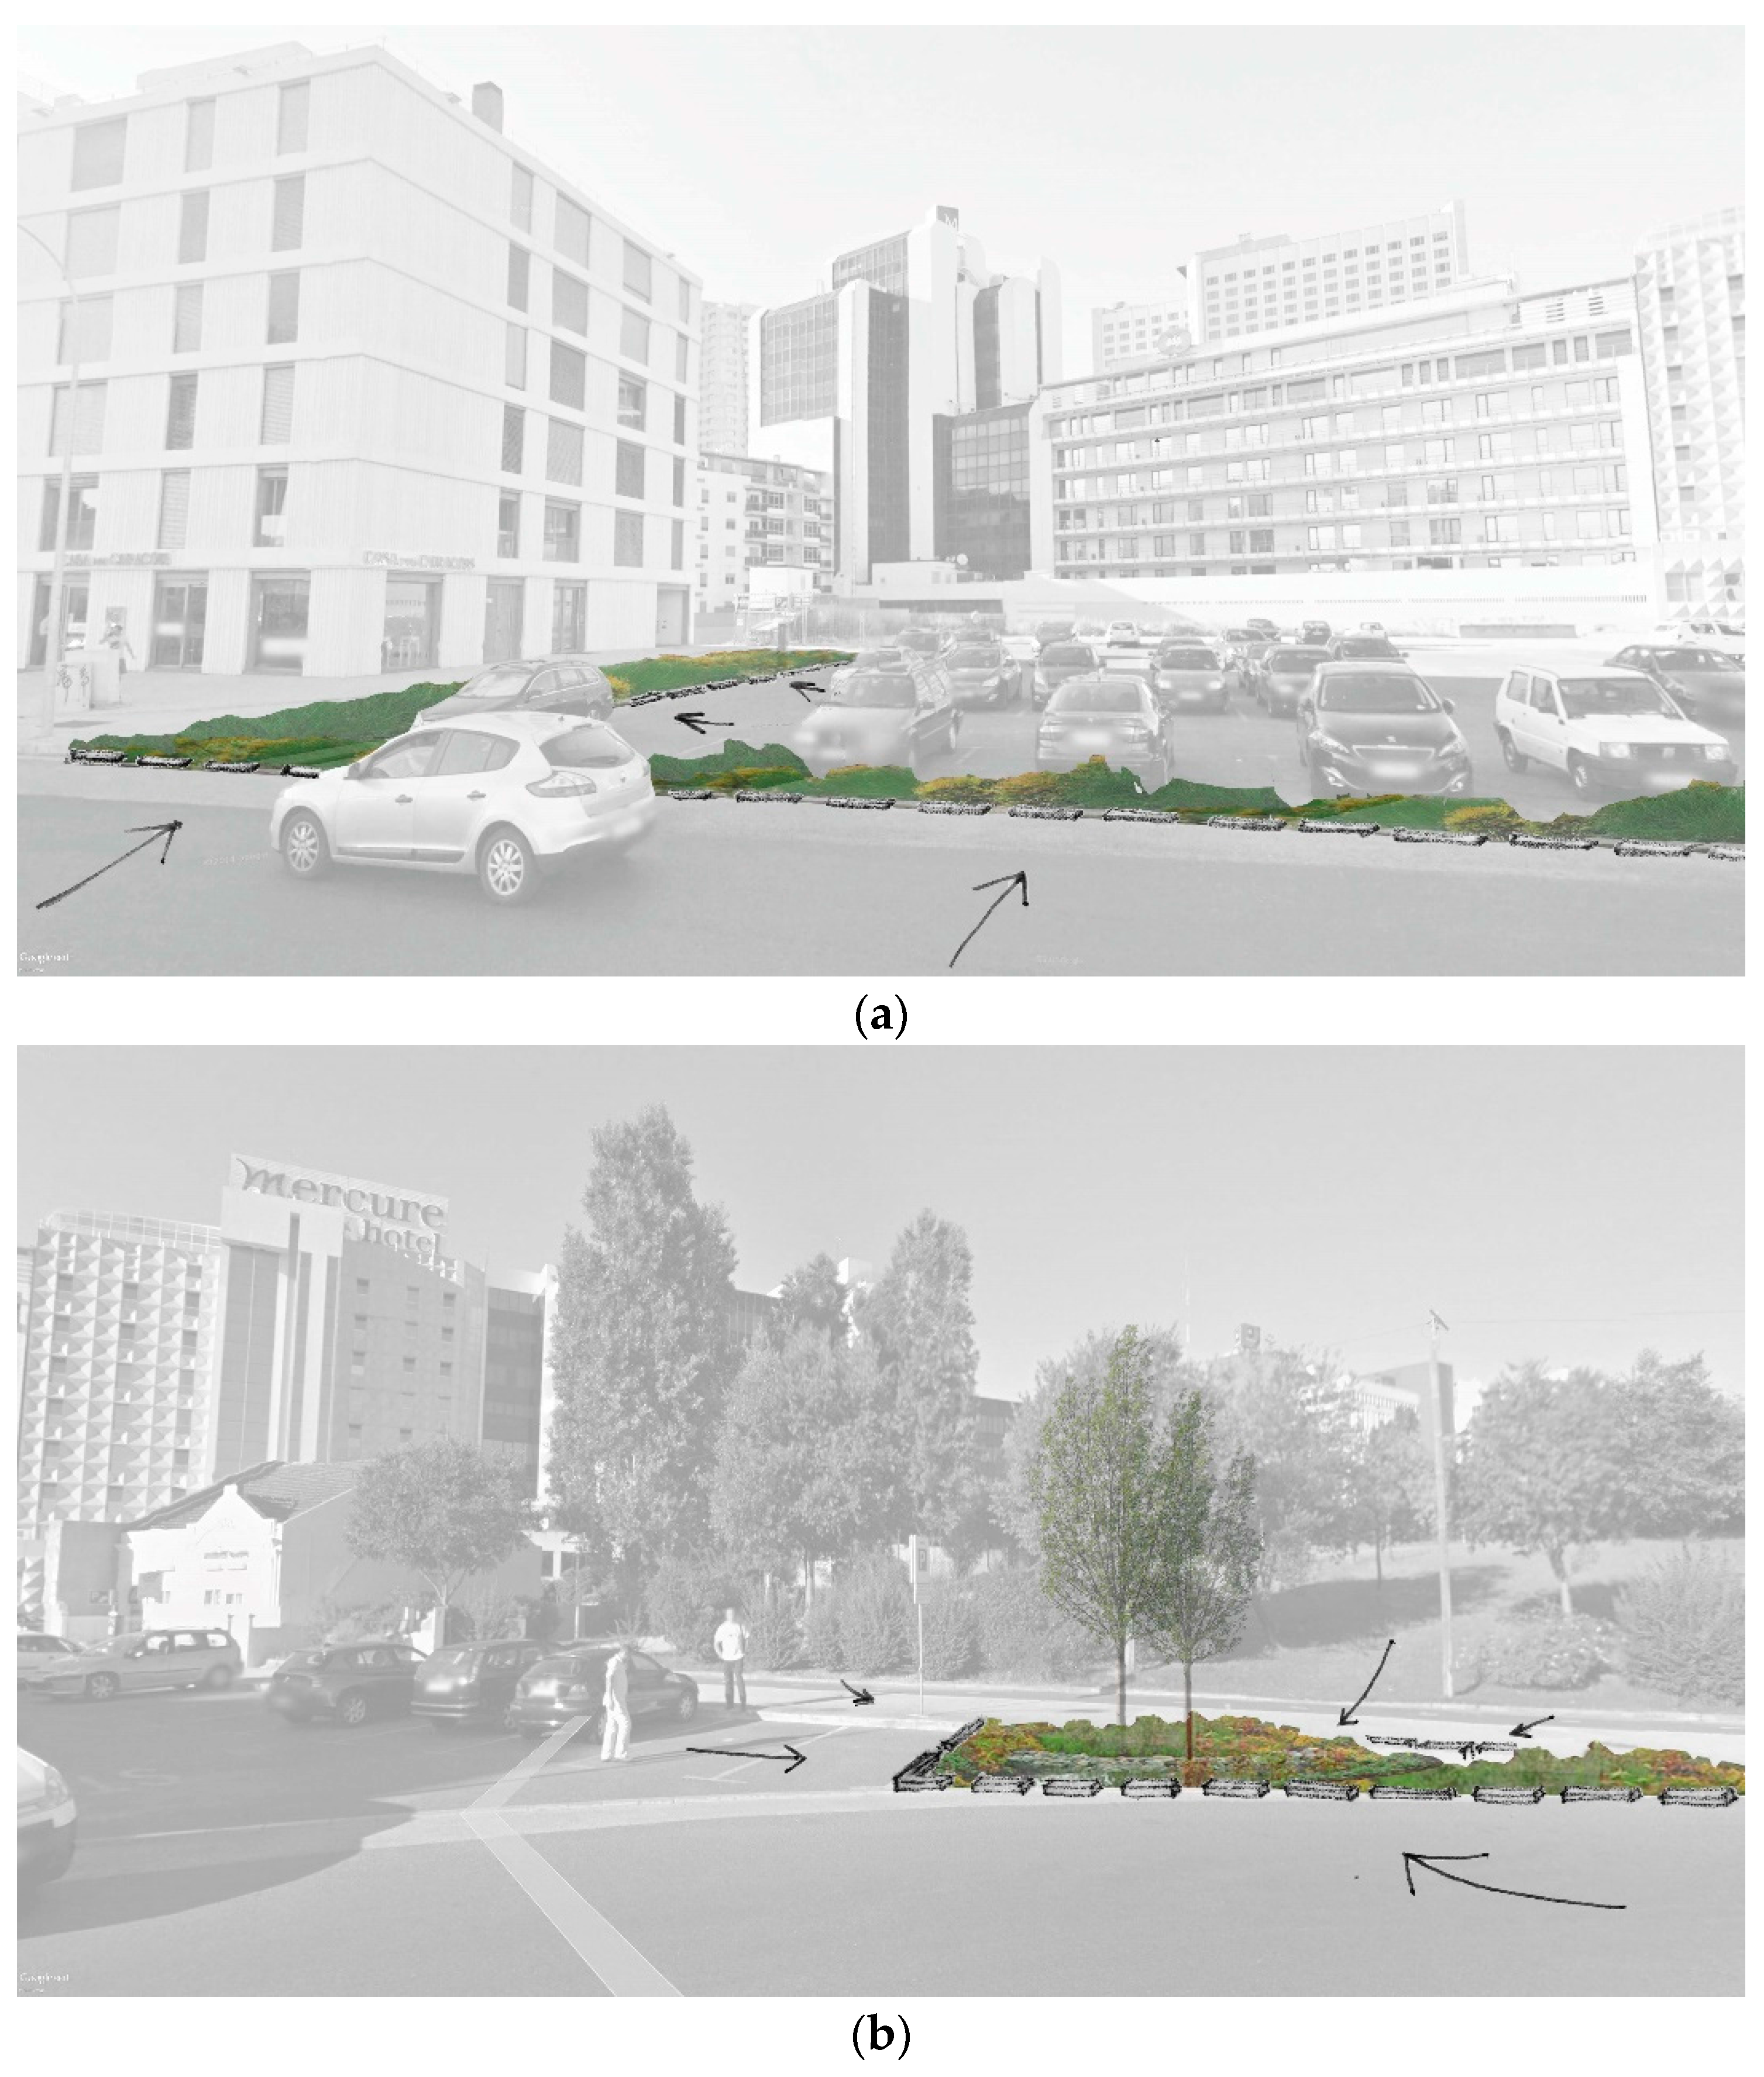
Table A2.
Worksheet for the calculation of managed stormwater volume in preliminary design 2—Parking lot at Campolide.
Table A2.
Worksheet for the calculation of managed stormwater volume in preliminary design 2—Parking lot at Campolide.
| Implementation Area | |
| “Impervious Tributary Area” (m2) | 2456.4092 |
| 0.025 m stormwater Volume (m3) | 61.4102 |
| Stormwater Volume Managed | Bioretention Planters (0.45 m + 0.25 m depth) |
| Installation Geometry | |
| Installation Volume (m3) | 158.0004 |
| Installation Area (m2) | 225.7148 |
| Infiltration Data | |
| Infiltration Design Rate (cm/h) | 0.5080 |
| Infiltration Period (h) | 8 |
| Estimate Infiltration Volume (m3) | 9.1730 |
| Soil Layer | |
| Volume of Soil (m3) | 101.5717 |
| Porosity of Soil (%) | 25% |
| Storage Volume of Planting Soil (m3) | 25.3929 |
| Storage Layer | |
| Volume of Storage Layer (m3) | 56.4287 |
| Porosity of Storage Layer (%) | 50% |
| Storage Volume of Drainage Layer (m3) | 28.2144 |
| Estimated Total of Stormwater Volume Managed | 62.7803 |
Appendix A.3. Preliminary Design 3—Part of the Six-Way Street of Av. Berna
The third area considered here corresponds to part of the six-way street of Av. de Berna and comprises an impermeable area of 5123.34 m2. For this area, two types of adaptation measures are proposed: (1) bioswales and (2) green gutters (Figure A6).
Bioswales are designed over the pre-existing central road spacer with an approximate width of 2 m. They are formed by a longitudinal depression designed to collect, convey and infiltrate runoff. This depressed linear channel is also bounded by concrete curbs individually spaced apart, so that stormwater can flow into them, and slightly elevated from the street level for safety purposes (Figure A7). In the proposed intervention, the existing trees Tipuana tipu, already carrying a significant size, are to be maintained. Yet additional plantation of native vegetation such as small bushes and grasses is proposed, e.g., Galium palustre L., Rumex conglomeratus M., S. fluitans L., Ranunculus repens L. or Juncus inflexus subsp. Inflexus. These bioswales are specifically designed to enable the stormwater management of a volume of 119.78 m3, comprising a 0.5 m soil layer and a storage layer with 0.65 m.
Green gutters which consist of a thin, shallow landscaped strip are proposed to be implemented between the sidewalk and the parking area at the north side of the road. Besides providing a tenuous physical separation between pedestrians and cars, this measure is envisioned to manage stormwater runoff mostly through the process of infiltration. It is therefore projected to be additionally composed by native grasses such as Antinoria agrostidea (DC.) Parl. Moreover, in this case, and unlike the previously proposed measures, an underdrain connected to the existing drainage system is unrequired. Overall, this measure is expected to manage 11.52 m3 of stormwater volume, comprising a soil layer and storage layer of 0.45 m depth each.
When adding the two “Partial Stormwater Volumes Managed” (119.78 m3 + 11.52 m3) it is possible to estimate the “Total of Stormwater Volumes Managed” for this area of intervention, which corresponds to 131.30 m3. In other words, through an intervention in solely 5% of the total impermeable area, it is possible to fulfill the above-mentioned goal to manage at least 128.08 m3 of stormwater volume from first flush (Table A3).
Figure A6.
Design for preliminary study 3—part of the six-way street of Av. Berna.
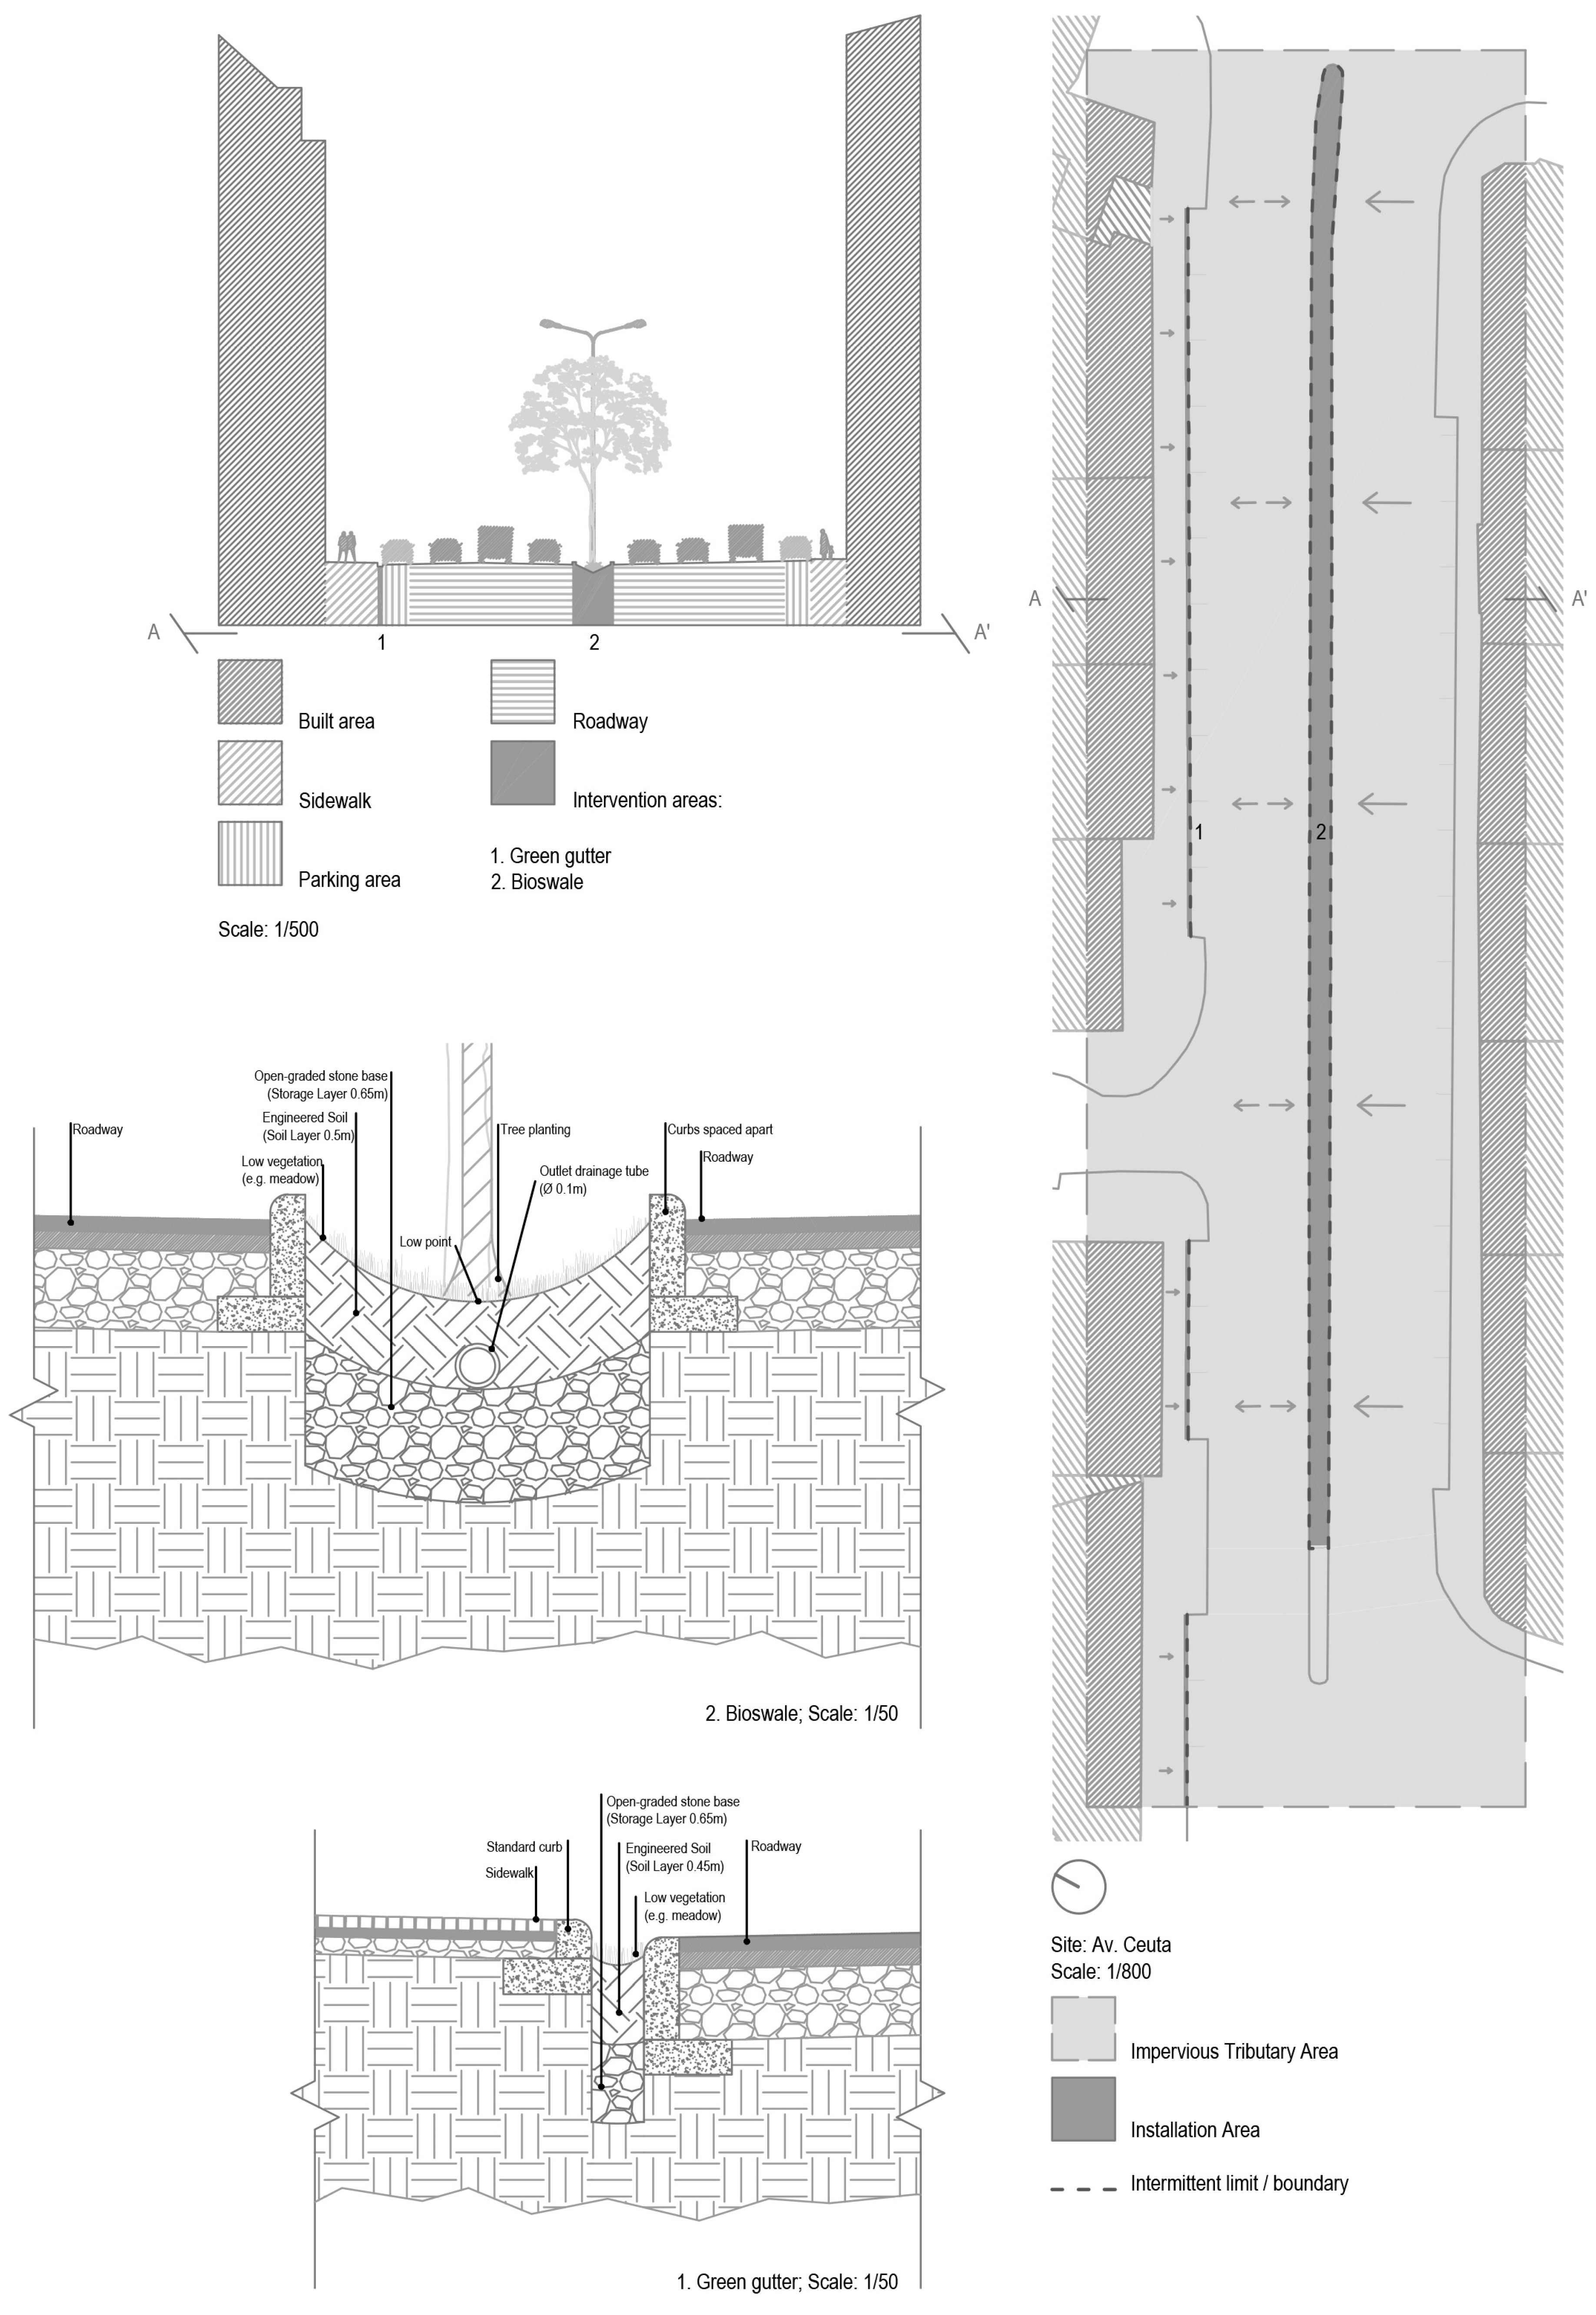
Figure A7.
Dd sketches (a,b) of the proposed bioswale and green gutter (and likely stormwater flow directions) to be implemented in Av. de Berna street. Source: Author’s sketch.
Figure A7.
Dd sketches (a,b) of the proposed bioswale and green gutter (and likely stormwater flow directions) to be implemented in Av. de Berna street. Source: Author’s sketch.
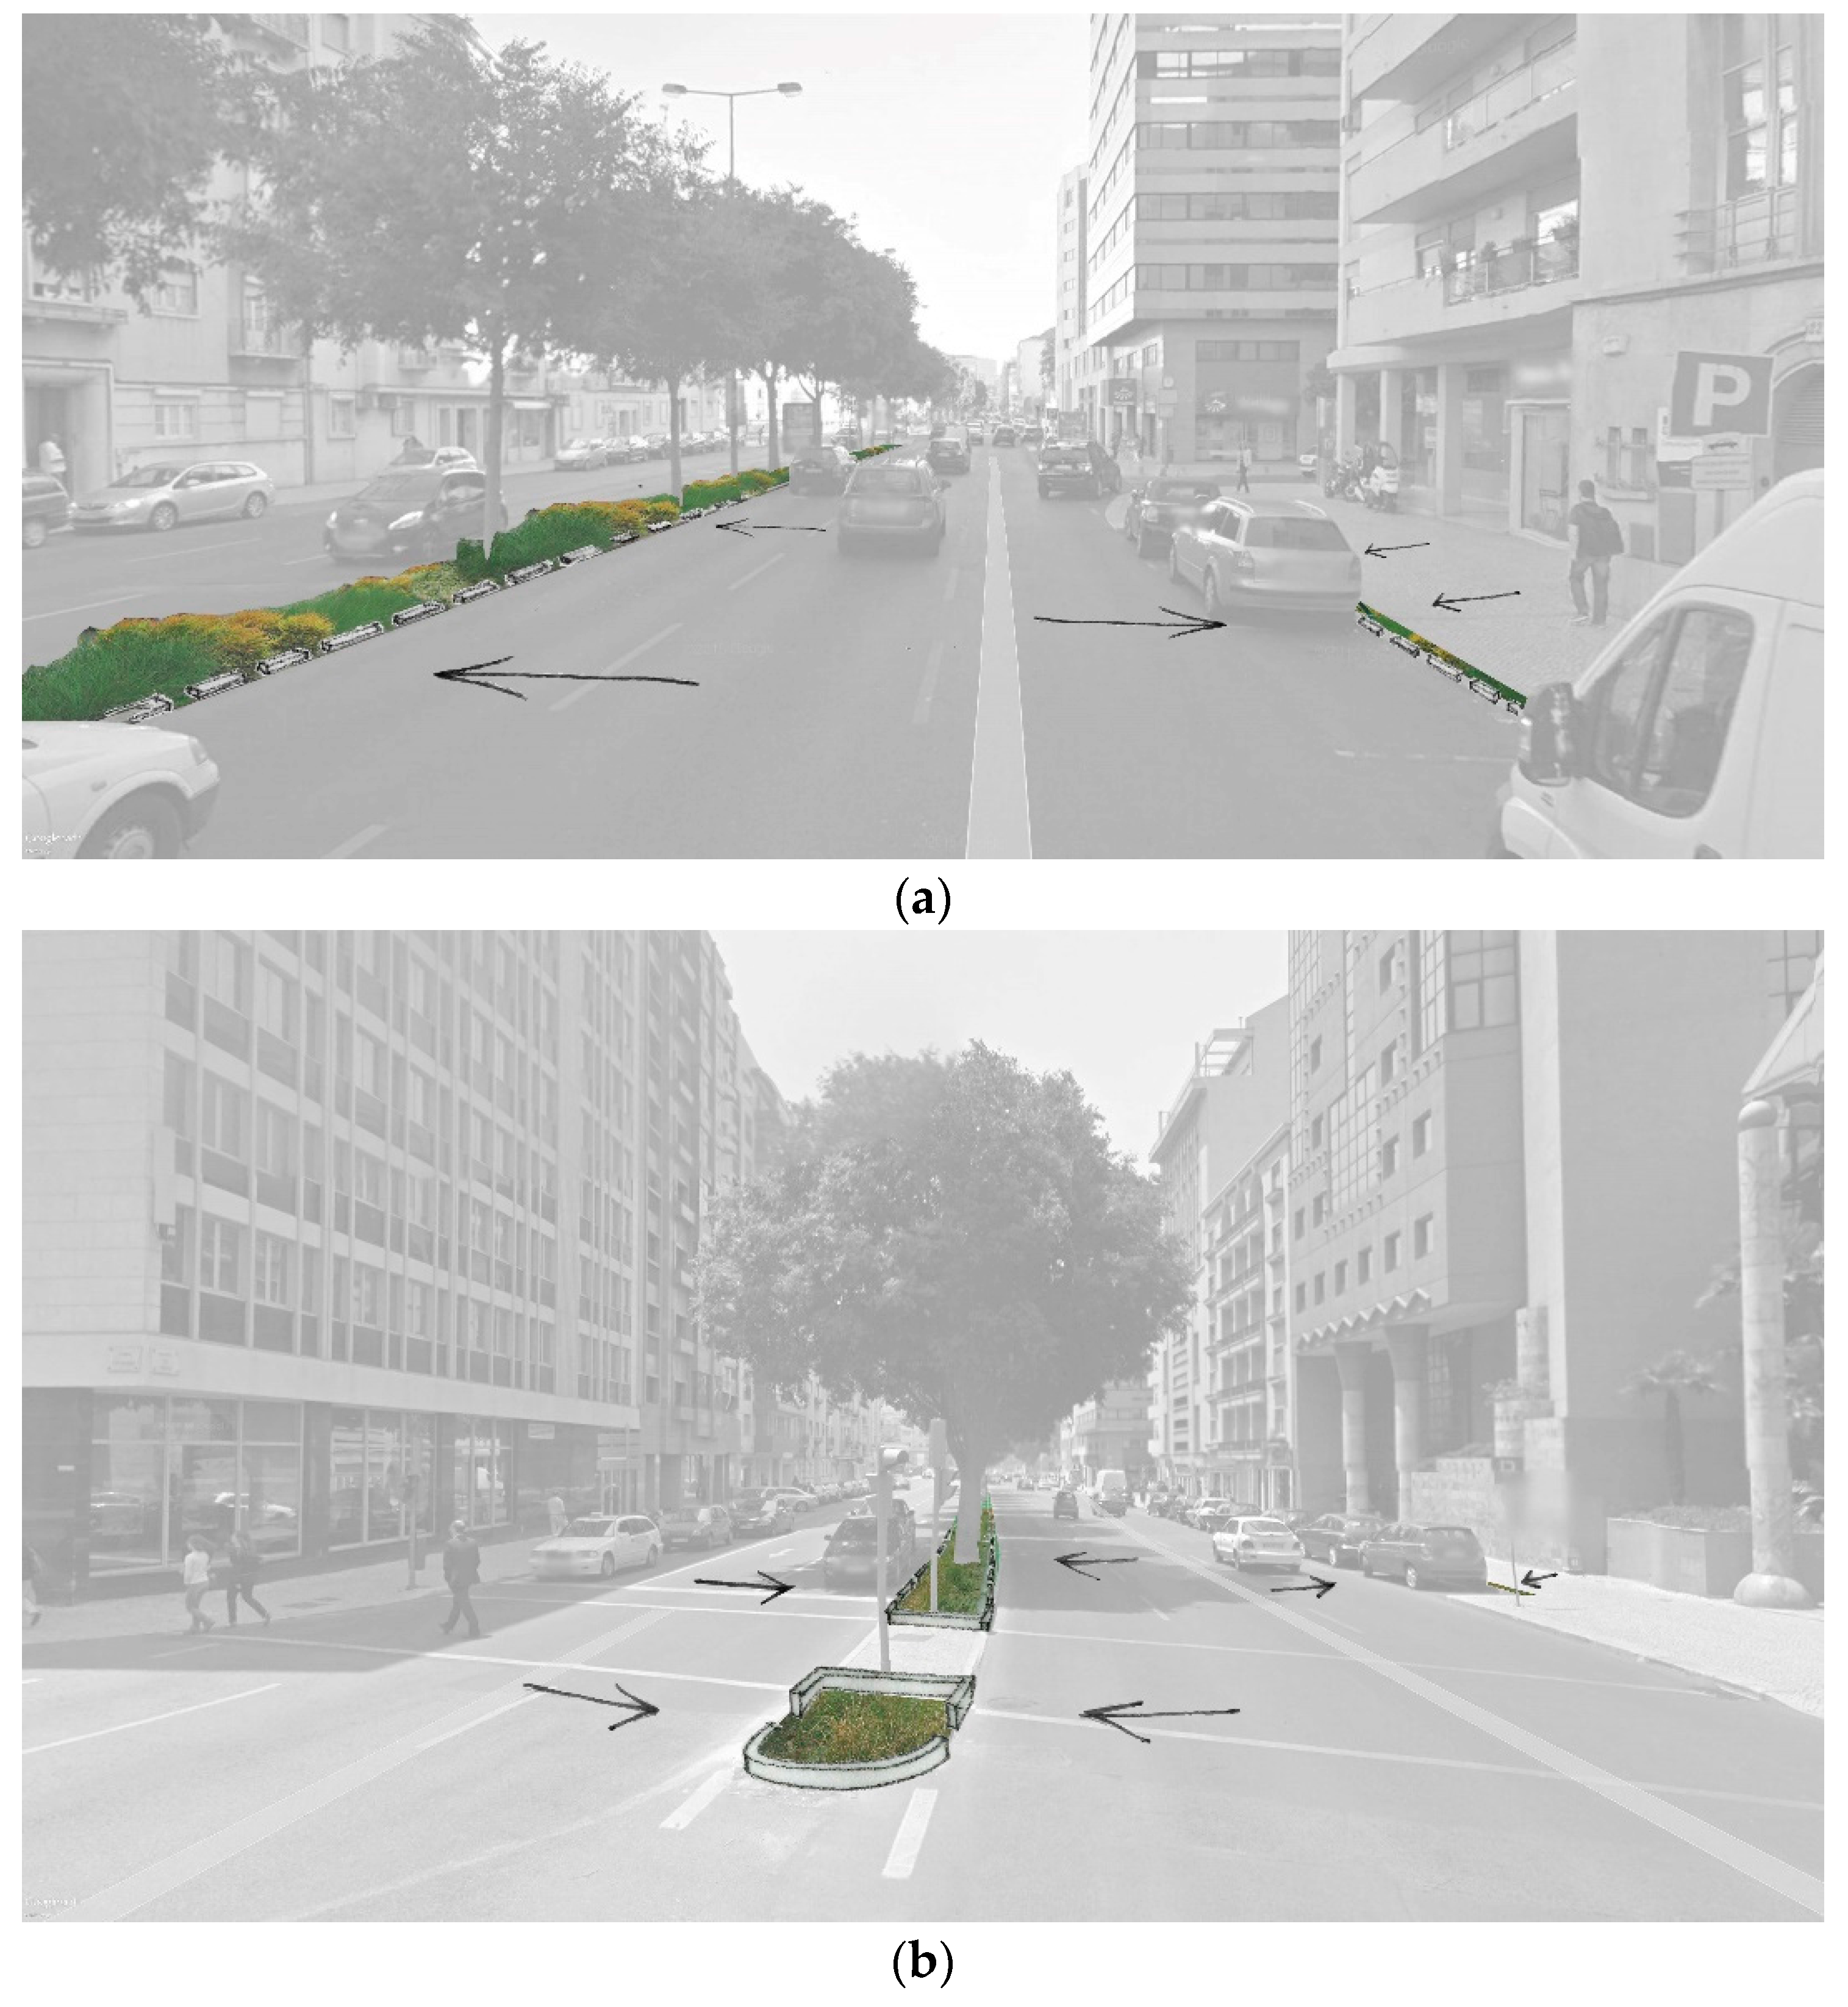
Table A3.
Worksheet for the calculation of managed stormwater volume in preliminary design 3—Part of the six-way street of Av. Berna.
Table A3.
Worksheet for the calculation of managed stormwater volume in preliminary design 3—Part of the six-way street of Av. Berna.
| Implementation Area | ||
| “Impervious Tributary Area” (m2) | 5123.3351 | |
| 0.025 m stormwater Volume (m3) | 128.0834 | |
| Stormwater Volume Managed | Green gutters (0.45 m + 0.45 m depth) | Bioswales (0.5 m + 0.65m depth) |
| Installation Geometry | ||
| Installation Volume (m3) | 27.4179 | 280.7558 |
| Installation Area (m2) | 30.4643 | 244.1355 |
| Infiltration Data | ||
| Infiltration Design Rate (cm/h) | 0.5080 | 0.5080 |
| Infiltration Period (h) | 8 | 8 |
| Estimate Infiltration Volume (m3) | 1.2381 | 9.9217 |
| Soil Layer | ||
| Volume of Soil (m3) | 13.7089 | 122.0678 |
| Porosity of Soil (%) | 25% | 25% |
| Storage Volume of Planting Soil (m3) | 3.4272 | 30.5169 |
| Storage Layer | ||
| Volume of Storage Layer (m3) | 13.7089 | 158.6881 |
| Porosity of Storage Layer (%) | 50% | 50% |
| Storage Volume of Drainage Layer (m3) | 6.8545 | 79.3440 |
| Partial Stormwater Volume Managed (m3) | 11.5198 | 119.7826 |
| Estimated Total of Stormwater Volume Managed (m3) | 131.3024 | |
Appendix A.4. Brief Discussion on the Preliminary Design Studies
Besides the presented ideas, other projects, with additional or alternative types of measures, could have been proposed for the same areas. Indeed, the three developed preliminary studies serve the primary purpose of exemplifying and illustrating how the proposed types of adaptation measures can be applied in specific situations within the city of Lisbon. They are not considered as sole solutions. For example, in the first project, green roofs could be proposed for the surrounding buildings. The collected stormwater, initially filtered by the green roof, could be further directed into cisterns that would water the bioswales and the rain gardens in the dry periods or simple serve to wash the streets. In the second project, the parking lot pavement could be additionally replaced by a permeable pavement, which would increase the amount of total stormwater volume managed. With regard to the third proposed design, although the sidewalk on the south side of the road is narrower, green gutters, as an example, could also be implemented here.
It is further important to note that, with the exception of the green gutters, all proposed types of measures are connected to the existing drainage network so that overflows are managed. In accordance, all of these measures are additionally composed by a raised drain that leads overflows into the sewerage system. In situations where a separate sewerage system is established, measures may further entail perforated pile lines along the bioretention layers which conduct the excess of filtered stormwater into the pluvial drainage outflows. Moreover, all types of proposed measures are inadequate to be placed adjacent to buildings to avoid the deterioration of their foundations, namely by permanent or temporary underground water stores and excess humidity.
References
- Costa, J.P.; João, F.D.S.; Filipe, D.S.; Luis, D.; Clara, M.; Maria, M.S.; Diamantino, O.; André, N.; Sónia, G.; Han, M.; et al. Climate Change Adaptation in Urbanised Estuaries. Contributes to the Lisbon Case; Faculdade de Ciências Sociais e Humanas da Universidade Nova de Lisboa: Óbidos, Portugal, 2014. [Google Scholar]
- Fernandes, A.; de Sousa, J.F.; Vicente, T.; Ferreira, J.C. Challenges to an integrated delta approach: The case of the tagus estuary. J. Coast. Res. 2013, 2, 1128–1133. [Google Scholar] [CrossRef]
- Meyer, H.; Nijhuis, S.; Pouderoijen, M.; Campanella, R.; Zagare, V.; Dijk, W.V.; Broesi, R.; Marchand, M.; Dieu, P.Q.; Le, T.; et al. Urbanized Deltas in Transition; Techne Press: Amsterdam, The Netherlands, 2014. [Google Scholar]
- C40CITIES. Why Cities? Ending Climate Change Begins in the City. 2014. Available online: http://www.c40.org/ending-climate-change-begins-in-the-city (accessed on 27 March 2015).
- Intergovernmental Panel on Climate Change (IPCC). Climate Change 2014: Synthesis Report; Contribution of Working Groups I, II and III to the Fifth Assessment Report of the Intergovernmental Panel on Climate Change; Pachauri, R.K., Meyer, L.A., Eds.; Core Writing Team: Geneva, Switzerland, 2014; p. 151. [Google Scholar]
- European Environment Agency (EEA). Climate Change, Impacts and Vulnerability in Europe 2012. An Indicator-Based Report; Report No. 12/2012; European Environment Agency: Copenhagen, Denmark, 2012; p. 300. [Google Scholar]
- Schiermeier, Q. Increased flood risk linked to global warming. Nature 2011, 470, 378–381. [Google Scholar] [CrossRef] [PubMed]
- Quintino, M.I. A Água Enquanto Matéria Construtora No Projecto de Arquitectura Paisagista; Instituto Superior de Agronomia, University of Lisbon: Portugal, Lisbon, 2011. [Google Scholar]
- Prominski, M.; Stokman, A.; Zeller, S.; Voermanek, D.S.A. River.Space.Design: Planning Strategies, Methods and Projects for Urban Rivers; Birkhauser: Basel, Switzerland, 2012. [Google Scholar]
- Matos Silva, M. Urban adaptation through flood risk management infrastructure and public space design. In Landscape: A Place of Cultivation; Silva, I.M.D., Marques, T.P., Andrade, G., Eds.; School of Sciences, University of Porto: Porto, Portugal, 2014; pp. 292–296. [Google Scholar]
- Matos Silva, M.; Costa, J. Flood adaptation measures applicable in the design of urban public spaces: Proposal for a conceptual framework. Water 2016, 8, 284. [Google Scholar] [CrossRef]
- Matos Silva, M.; Costa, J.P. Climate change and urbanism. A new role for public space design? In The Art of Urban Design in Urban Regeneration. Interdisciplinarity, Policies, Governance, Public Space; Remesar, A., Ed.; Publicacions i Edicions de la Universitat de Barcelona: Barcelona, Spain, 2016; pp. 62–86. [Google Scholar]
- Matos Silva, M.; Costa, J.P. Water & the city, climate change adaptation in practice: Territorial evaluation, spatial planning and project. In L’Aigua I L’espai Públic. Anàlisi Dels Efectes del Canvi Climàtic; Corbella, D., Ed.; Universitat de Barcelona Edicions: Barcelona, Spain, 2017; pp. 33–52. [Google Scholar]
- Meyer, H. City and Port—Transformation of Port Cities. London, Barcelona, New York, Rotterdam; International Books: Utrecht, The Netherlands, 1999. [Google Scholar]
- Costa, J.P. Urbanismo e Adaptação às Alterações Climáticas, as Frentes de Água; Livros Horizonte: Lisboa, Portugal, 2013. [Google Scholar]
- Costa, J.P. La Ribera Entre Proyectos. Formación y transformación del Territorio Portuario, a Partir del Caso de Lisboa. Ph.D. Thesis, TU Catalonia, Barcelona Technical Superior Scholl of Architecture, Barcelona, Spain, 2007. [Google Scholar]
- Einfalt, T.; Hatzfeld, F.; Wagner, A.; Seltmann, J.; Castro, D.; Frerichs, S. Urbas: Forecasting and management of flash floods in urban areas. Urb. Water J. 2009, 6, 369–374. [Google Scholar] [CrossRef]
- Oliveira, P. Inundações na Cidade de Lisboa—Estudo de Hidrogeografia Urbana; Universidade de Lisboa: Lisboa, Portugal, 2003. [Google Scholar]
- Deasy, C.; Titman, A.; Quinton, J.N. Measurement of flood peak effects as a result of soil and land management, with focus on experimental issues and scale. J. Environ. Manag. 2014, 132, 304–312. [Google Scholar] [CrossRef] [PubMed]
- Cunha, N.S.; Magalhães, M.R.; Domingos, T.; Abreu, M.M.; Küpfer, C. The land morphology approach to flood risk mapping: An application to portugal. J. Environ. Manag. 2017, 193, 172–187. [Google Scholar] [CrossRef] [PubMed]
- Cardoso, M.A. Avaliação do Desempenho de Sistemas de Drenagem Urbana. Ph.D. Thesis, Instituto Superior Técnico, Universidade Técnica de Lisboa, Lisboa, Portugal, 2008. [Google Scholar]
- ChiRoN (Information Systems); Engidro (Engineering Studies); Hydra (Hydraulics and Environment); Emarlis. Plano Geral de Drenagem de Lisboa. Fase a: Relatório; Miraflores, Oeiras, Portugal, 2006; p. 108. Available online: http://www.ordemengenheiros.pt/pt/atualidade/noticias/plano-geral-de-drenagem-da-camara-municipal-de-lisboa-2016-2030-em-debate-na-regiao-sul/.
- Copernicus; European Environment Agency (EEA). Raster Dataset of Built-Up and Non Built-Up Areas including Continuous Degree of Soil Sealing Ranging from 0–100% in Aggregated Spatial Resolution (100 × 100 m and 20 × 20 m). Available online: https://www.arcgis.com/home/item.html?id=6467475da74a408bbfa9de256fb31116 (accessed on 10 May 2017).
- Câmara Municipal de Lisboa. Plano Director Municipal de Lisboa; 2nd Serie; No. 168 de 30 de agosto de 2012; Departamento de Planeamento e Reabilitação Urbana, Ed.; Lisboa, Portugal, 2012. [Google Scholar]
- De Matos, J.S.; Monteiro, A.J.; de Oliveira, R.P. Plano Geral de Drenagem de Lisboa 2016–2030; Câmara Municipal de Lisboa: Lisboa, Portugal, 2015; p. 345. [Google Scholar]
- Santos, F.D.; Forbes, K.; Moita, R. Climate Change in Portugal Scenarios, Impacts and Adaptation Measures—Siam I; Gradiva-Publicações: Lisboa, Spain, 2002. [Google Scholar]
- Santos, F.D.; Miranda, P.; Valente, M.A.; Tomé, A.R.; Trigo, R.; Coelho, M.F.E.S.; Aguiar, A.; Azevedo, E.B.; Cunha, L.V.d.; Ribeiro, L.; et al. Alterações Climáticas em Portugal. Cenários, Impactos e Medidas de Adaptação—Siam II; Gradiva-Publicações: Lisboa, Spain, 2006. [Google Scholar]
- Dias, L.; Santos, F.D. Climate change scenarios, lisbon and the tagus estuary. In Climate Change Adaptation in Urbanised Estuaries Contributes to the Lisbon Case; Costa, J.P., Sousa, J.F.D., Eds.; Várzea da Rainha Impressores: Óbidos, Portugal, 2014; pp. 157–173, in press. [Google Scholar]
- Oliveira, P.E.; Ramos, C. Inundações na cidade de lisboa durante o século XX e seus factores agravantes. Finisterra 2002, XXXVII, 33–54. [Google Scholar]
- Plano Estratégico de Cascais Face às Alterações Climáticas (PECAC). Plano Estratégico de Cascais Face às Alterações Climáticas; Santos, F.D., Aguiar, R., Eds.; Câmara Municipal de Cascais: Cascais, Portugal, 2010; p. 59. [Google Scholar]
- Intergovernmental Panel on Climate Change (IPCC). Climate Change 2007: The Physical Science Basis; Contribution of Working Group I to the Fourth Assessment Report of the Intergovernmental Panel on Climate Change; Cambridge University Press: Cambridge, UK; New York, NY, USA, 2007. [Google Scholar]
- Schaeffer, M.; Hare, W.; Rahmstorf, S.; Vermeer, M. Long-term sea-level rise implied by 1.5 °C and 2 °C warming levels. Nat. Clim. Chang. 2012, 2, 867–870. [Google Scholar] [CrossRef]
- Rahmstorf, S. A new view on sea level rise Nat. Rep. Clim. Chang. 2010, 4, 44–45. [Google Scholar] [CrossRef]
- Antunes, C. Monitorização da Variação do Nível Médio do Mar. In Proceedings of the 1as Jornadas de Engenharia Hidrográfico, Lisbon, Portugal, 21–22 June 2010; Instituto Hidrográfico: Lisbon, 2010; pp. 273–276. [Google Scholar]
- Aguiar, R. Plano Estratégico de Cascais Face às Alterações Climáticas (Pecac); Câmara Municipal de Cascais: Lisabon, Portugal, 2010; p. 27. [Google Scholar]
- Intergovernmental Panel on Climate Change (IPCC). Special Report on Emissions Scenarios (Sres)—Summary for Policymakers; Intergovernmental Panel on Climate Change: Geneva, Switzerland, 2000. [Google Scholar]
- Intergovernmental Panel on Climate Change (IPCC). Managing the Risks of Extreme Events and Disasters to Advance Climate Change Adaptation—Summary for Policymakers; Cambridge University Press: Cambridge, UK; New York, NY, USA, 2012; p. 19. [Google Scholar]
- Centre for Climate Change Impacts Adaptation & Modelling (CCIAM). Cartas de Inundações e de Risco em Cenários de Alterações Climáticas (Cirac); Associação Portuguesa Seguradores (APS), Gráfica Maiadouro: Lisboa, Portugal, 2014; p. 67. [Google Scholar]
- Dias, L. As Alterações Climátocas, as Inundações e a Cidade; Faculty of Architecture, University of Lisbon: Lisbon, Portugal, 2016. [Google Scholar]
- Santos, F.D.; Dias, L.; Karadzic, V.; Lourenço, T.C.; Calheiros, T. Climadapt.Local—Estratégias Municipais de Adaptação às Alterações Climáticas; Managed by the Portuguese Environment Agency (APA) and financed by FPC (85%) and EEAGrants (15%): Climate Change, Impacts, Adaptation and Modelling (CCIAM); Faculty of Sciences University of Lisbon: Lisboa, Spain, 2015. [Google Scholar]
- Brandão, P.; Carrelo, M.; Águas, S. O Chão da Cidade. Guia de Avaliação do Design de Espaço Publico; Centro Português de Design: Lisboa, Portugal, 2002; p. 199. [Google Scholar]
- City of Philadelphia. Green Streets Design Manual; Mayor’s Office of Transportation and Utilities: Philadelphia, PA, USA, 2014; p. 96. [Google Scholar]
- Gaspar, R. Understanding the reasons for behavioral failure: A process view of psychosocial barriers and constraints to pro-ecological behavior. Sustainability 2013, 5, 2960–2975. [Google Scholar] [CrossRef]
- Santos, T.; Tenedório, J.; Gonçalves, J. Quantifying the city’s green area potential gain using remote sensing data. Sustainability 2016, 8, 1247. [Google Scholar] [CrossRef]
- Kim, H.; Lee, D.-K.; Sung, S. Effect of urban green spaces and flooded area type on flooding probability. Sustainability 2016, 8, 134. [Google Scholar] [CrossRef]
- Wiesner, J.B.; York, H.F. The test ban and security. Survival 1965, 7, 13–21. [Google Scholar] [CrossRef]
Figure 1.
Delimitation of the main underground drainage basins of Lisbon’s municipality over the city’s land morphology. Source: Adapted from [24,25].
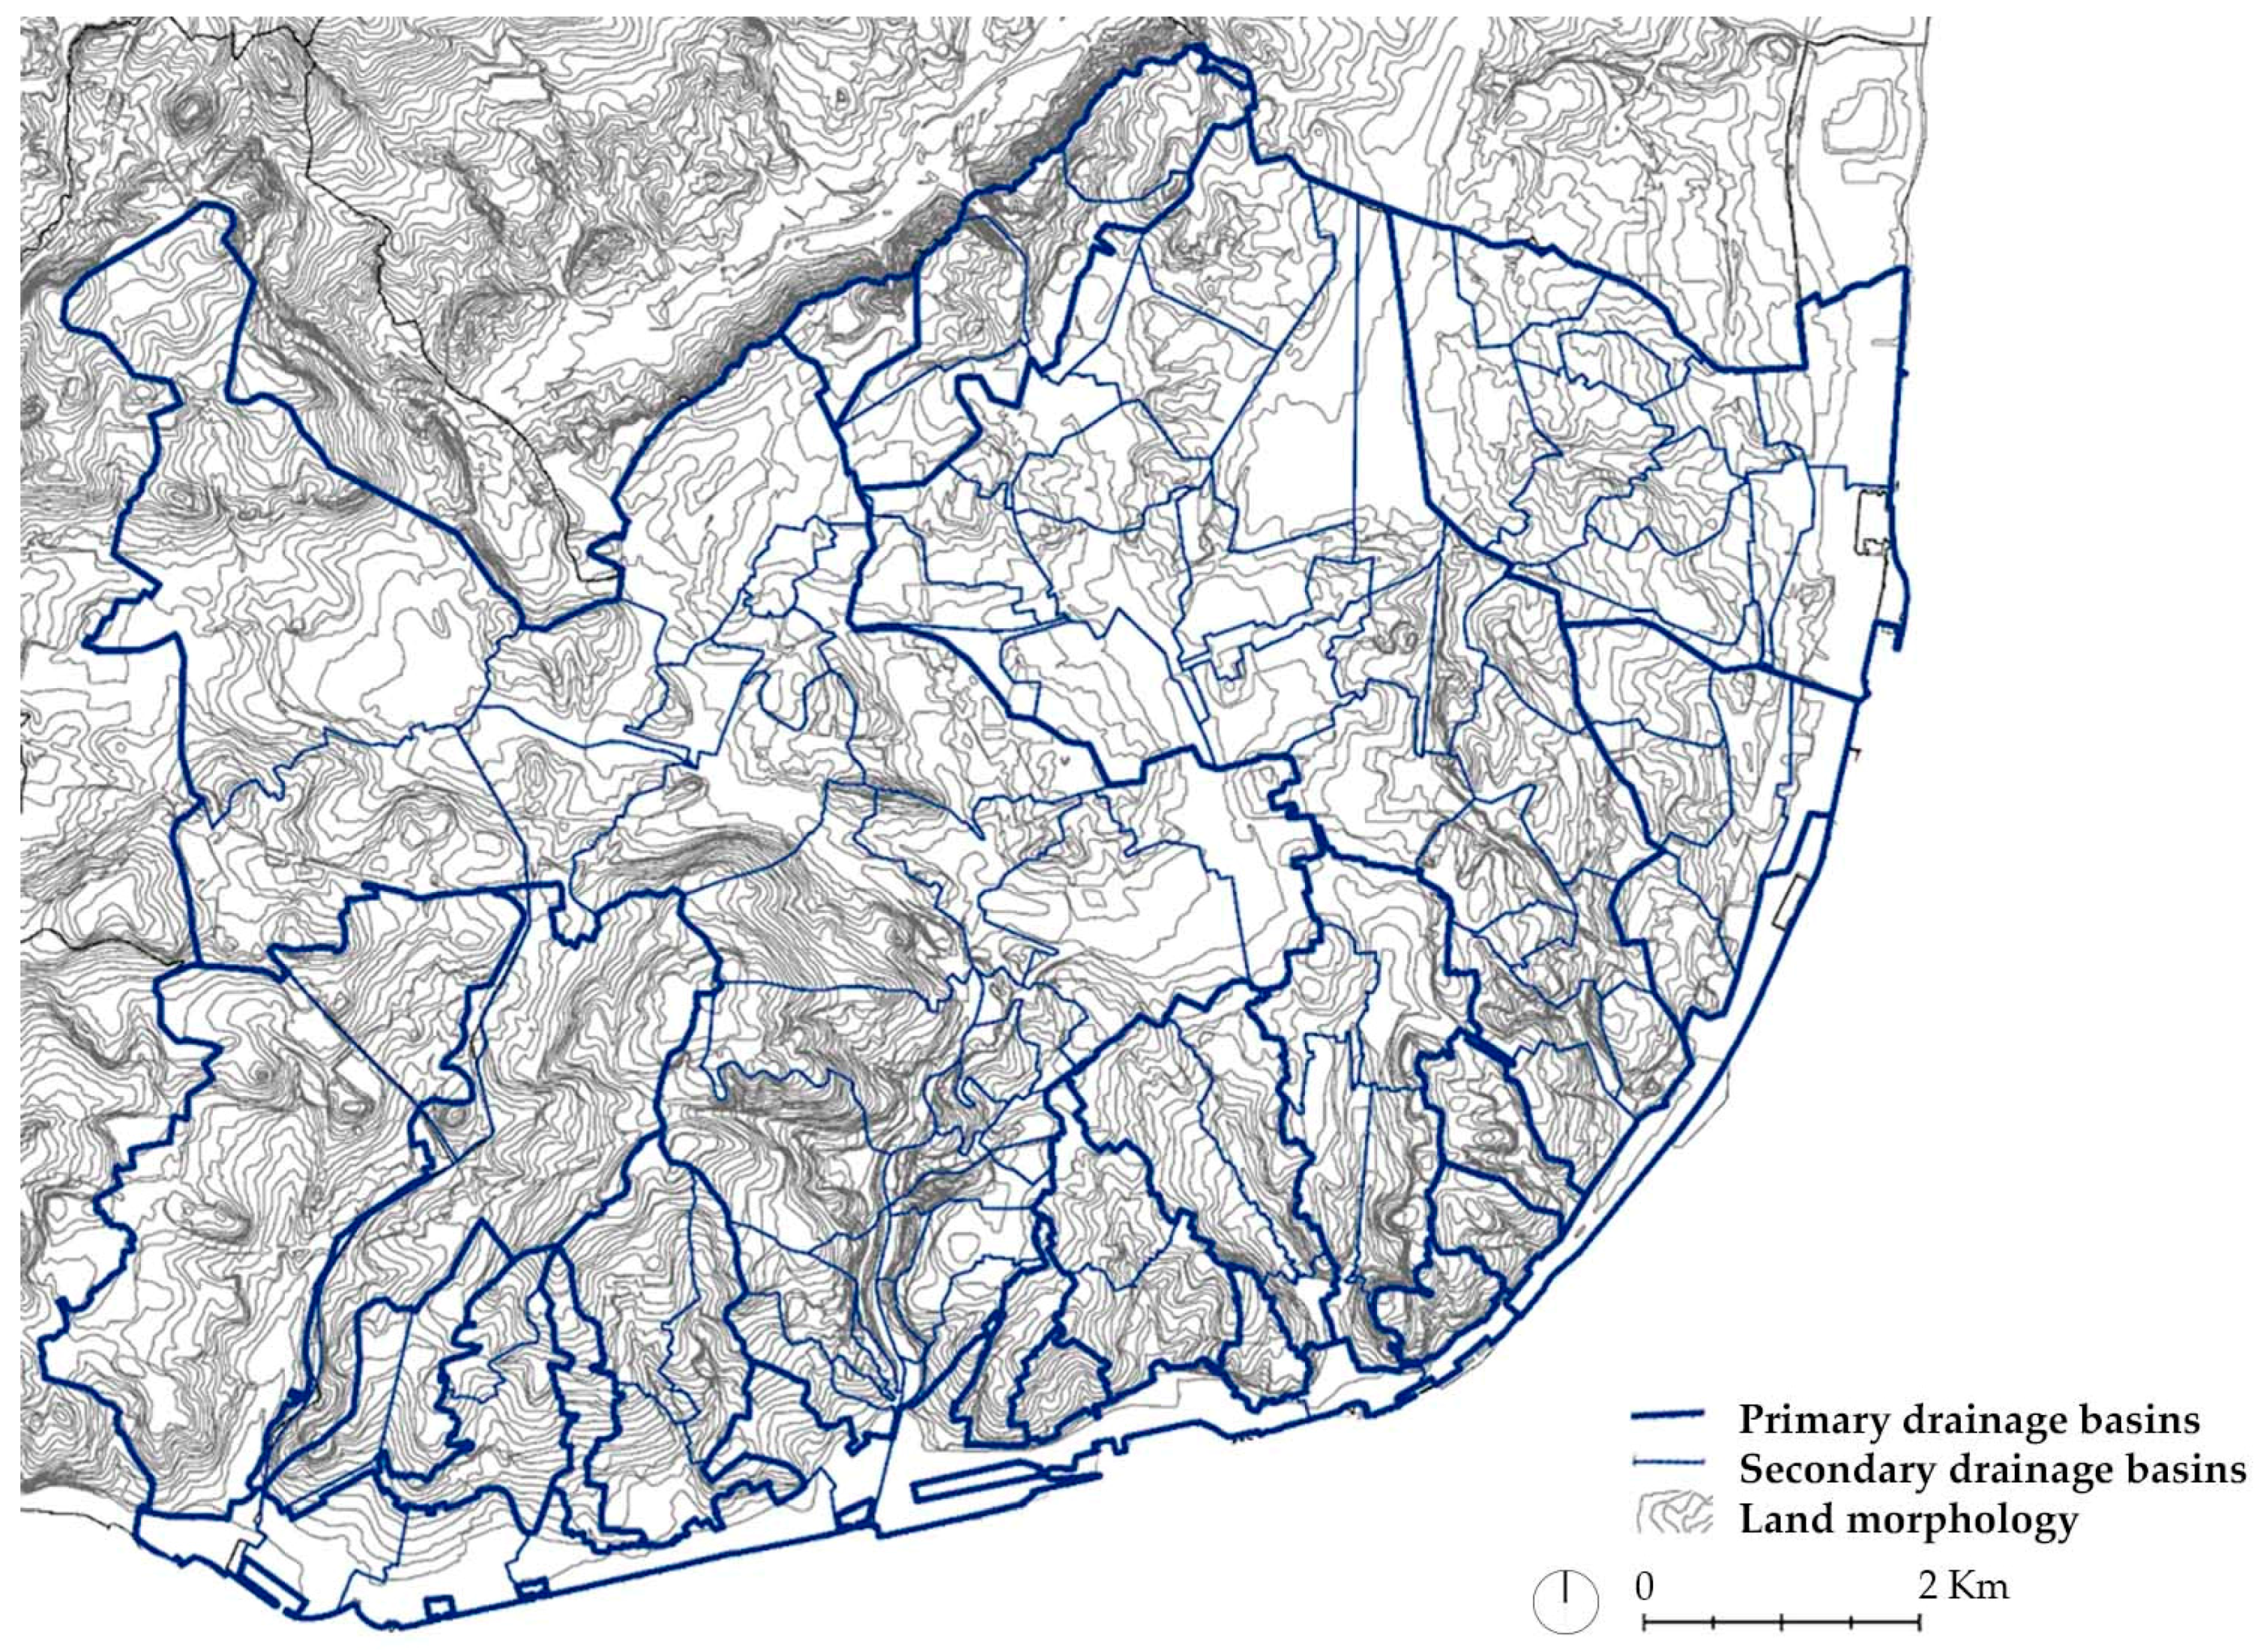
Figure 2.
Planned interventions for the improvement of the drainage system within Lisbon’s Municipal Master Plan in effect; and Recommended deviation tunnels within the updated General Drainage Master Plan 2016–2030. Source: Author’s elaboration from [24,25].
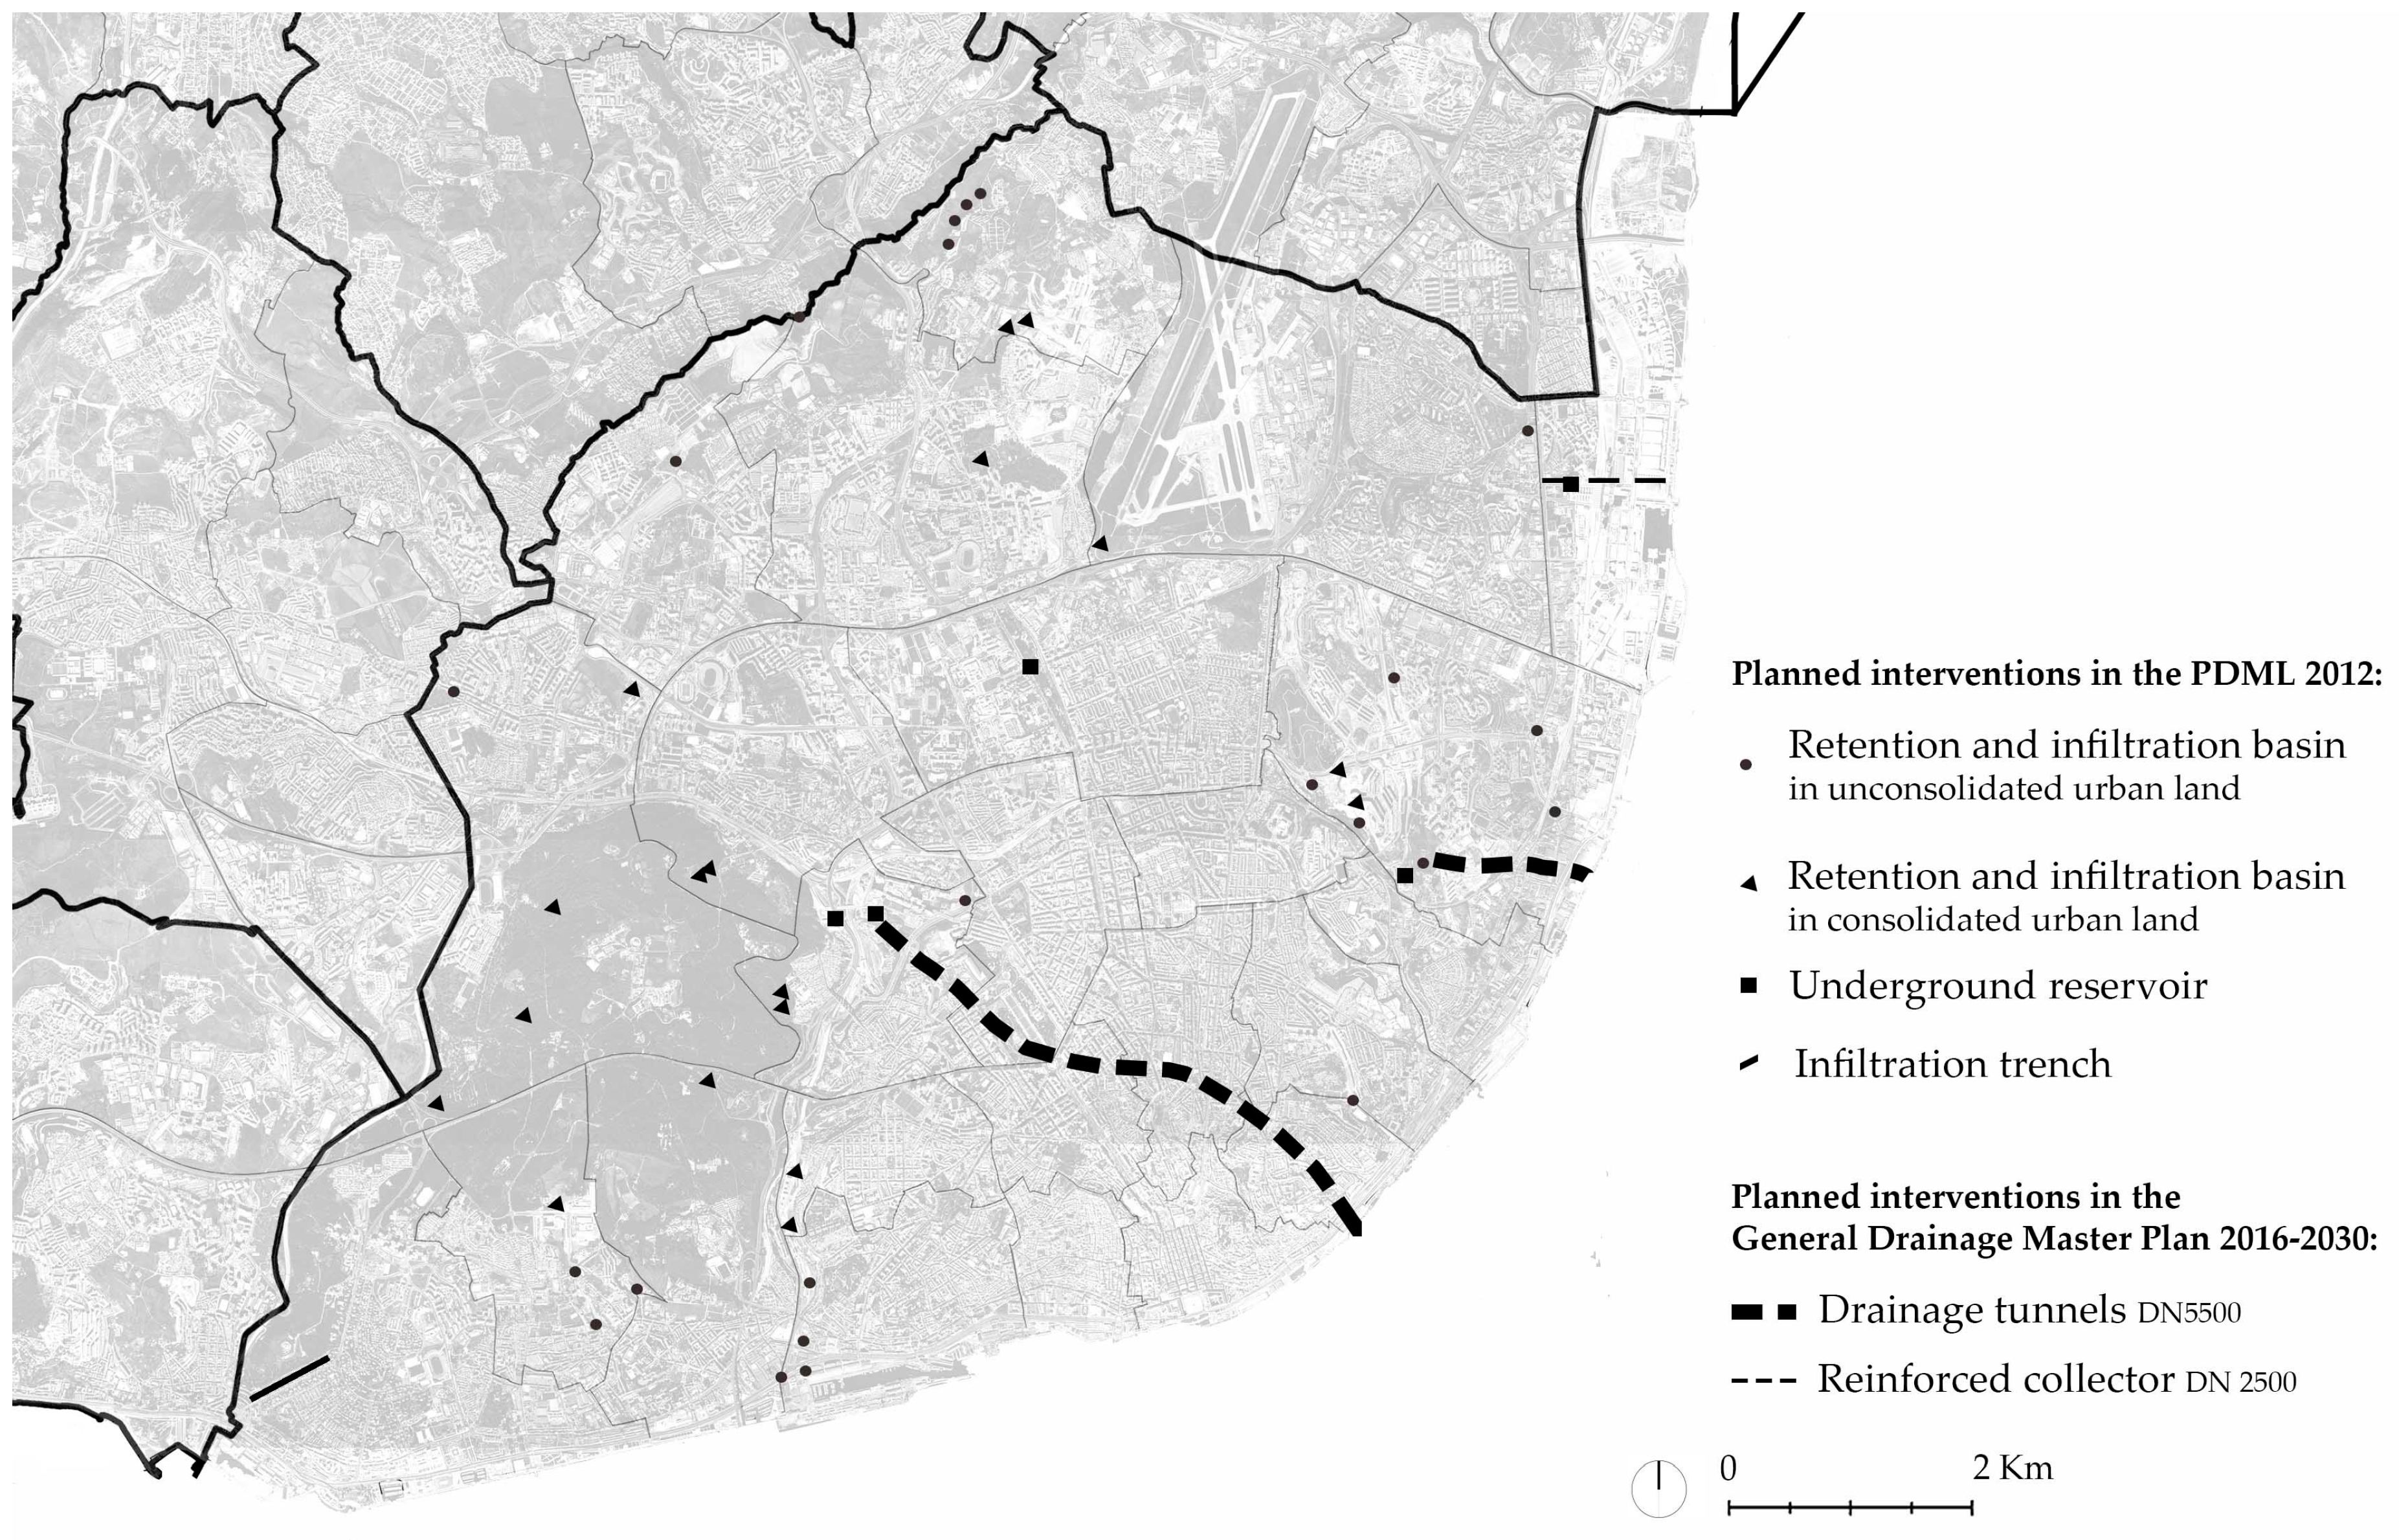
Figure 3.
In blue are the highlighted categories and types of measures within the proposed Conceptual Framework, which encompass the infrastructural strategies to Harvest, Store and Infiltrate floodwaters, i.e., source control strategies. Source: Author’s design. For a more detailed understanding of the development and use of this figure, please consult the following publication: [11]. Legend: 1. Green walls; 2. Inverted umbrellas; 3. Art installations; 4. Green roofs; 5. Blue roofs; 6. Artificial detention basins; 7. Water plazas; 8. Underground reservoirs; 9. Cisterns; 10. Wet bioretention basins; 11. Dry bioretention basins; 12. Bioswales; 13. Bioretention planters; 14. Rain gardens; 15. Open cell pavers; 16. Interlocking pavers; 17. Porous paving; 18. Infiltration trenches; 19. Green gutter; 20. Stream rehabilitation; 21. Stream restoration; 22. Daylighting streams; 23. Street channels; 24. Extended channels; 25. Enlarged canals; 26. Check dams; 27. Floating pathway; 28. Floating platform; 29. Floating islands; 30. Submergible parks; 31. Submergible pathways; 32. Cantilevered pathways; 33. Elevated promenades; 34. Multifunctional defenses; 35. Breakwaters; 36. Embankments; 37. Sculptured walls; 38. Glass walls; 39. Demountable barriers. Gentle slope levees.
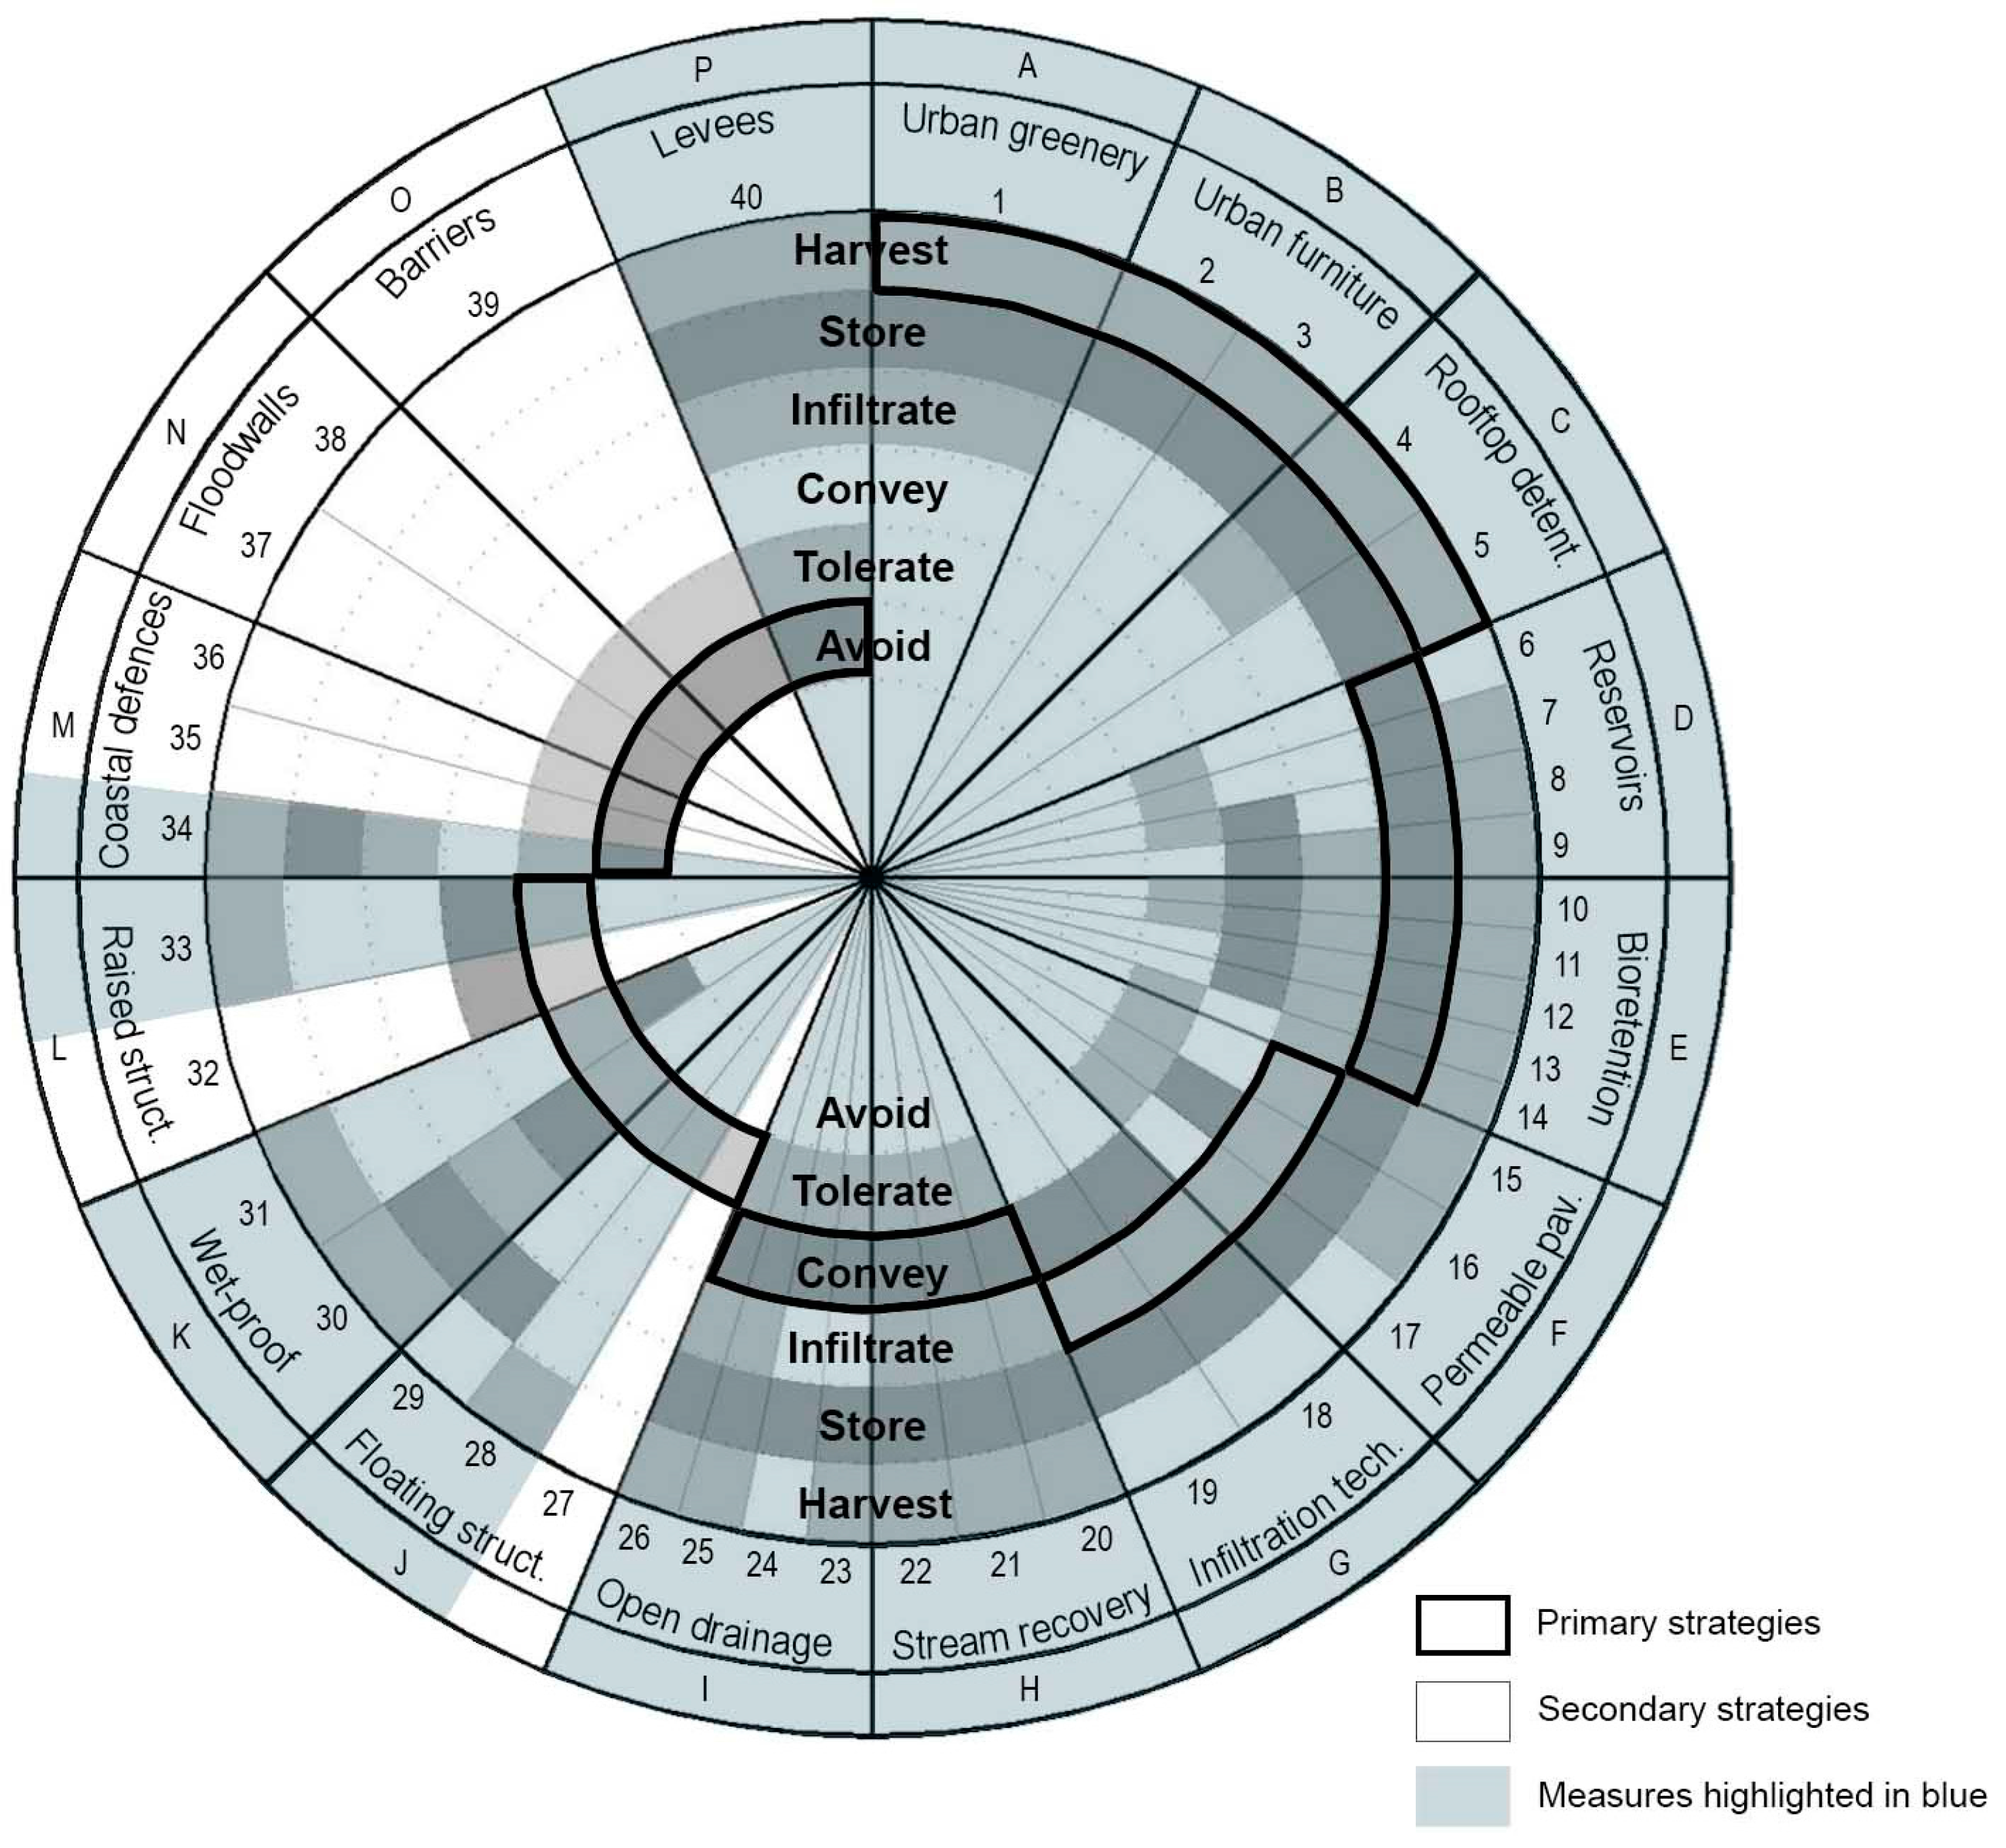
Figure 4.
Alcântara Upper Basin land use occupation class “1. Artificial territories” and its corresponding fifth level of precision (COS 2007). Please compare the legend of this image with Table 2. Source: spatial information combined by the author.
Figure 4.
Alcântara Upper Basin land use occupation class “1. Artificial territories” and its corresponding fifth level of precision (COS 2007). Please compare the legend of this image with Table 2. Source: spatial information combined by the author.
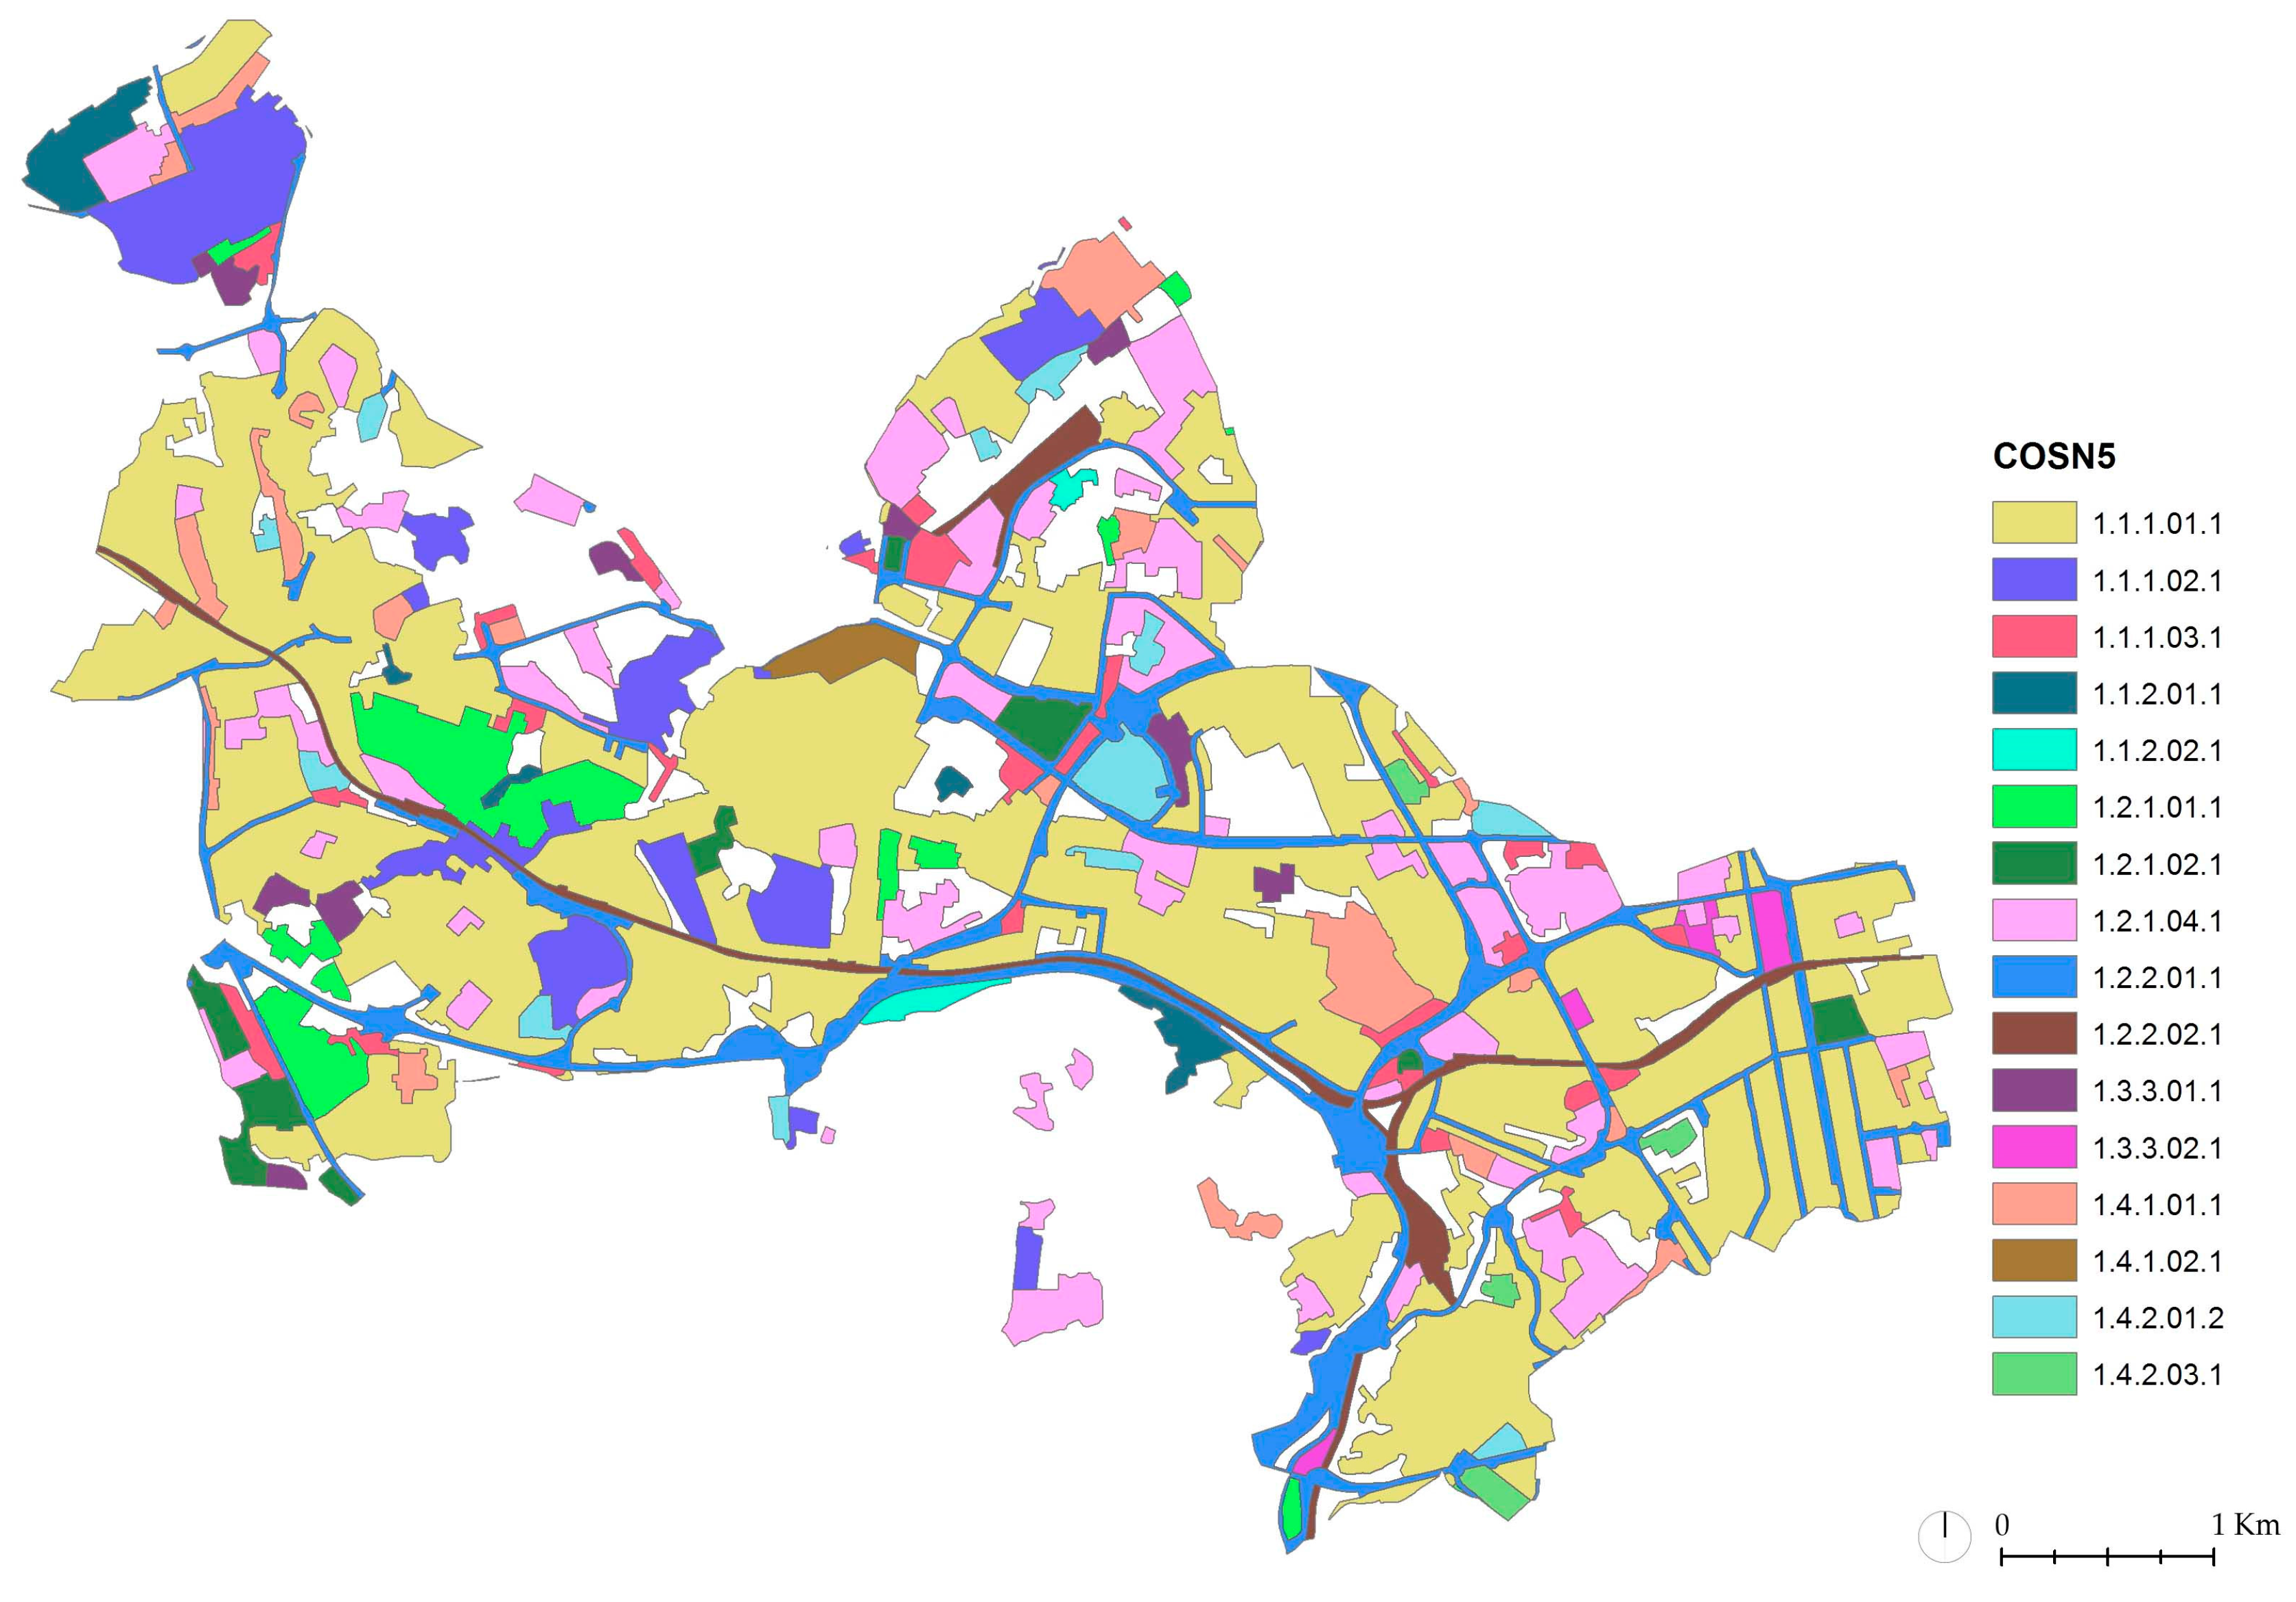
Figure 5.
Identification of the COS occupation class “1. Artificial territories” within the delimited study area “Alcântara Upper Basin”; the location of the presented illustrative designs: (1) residential area at Carnide; (2) parking lot at Campolide and (3) part of the six-way street of Av. Berna. Source: spatial information combined by the author.
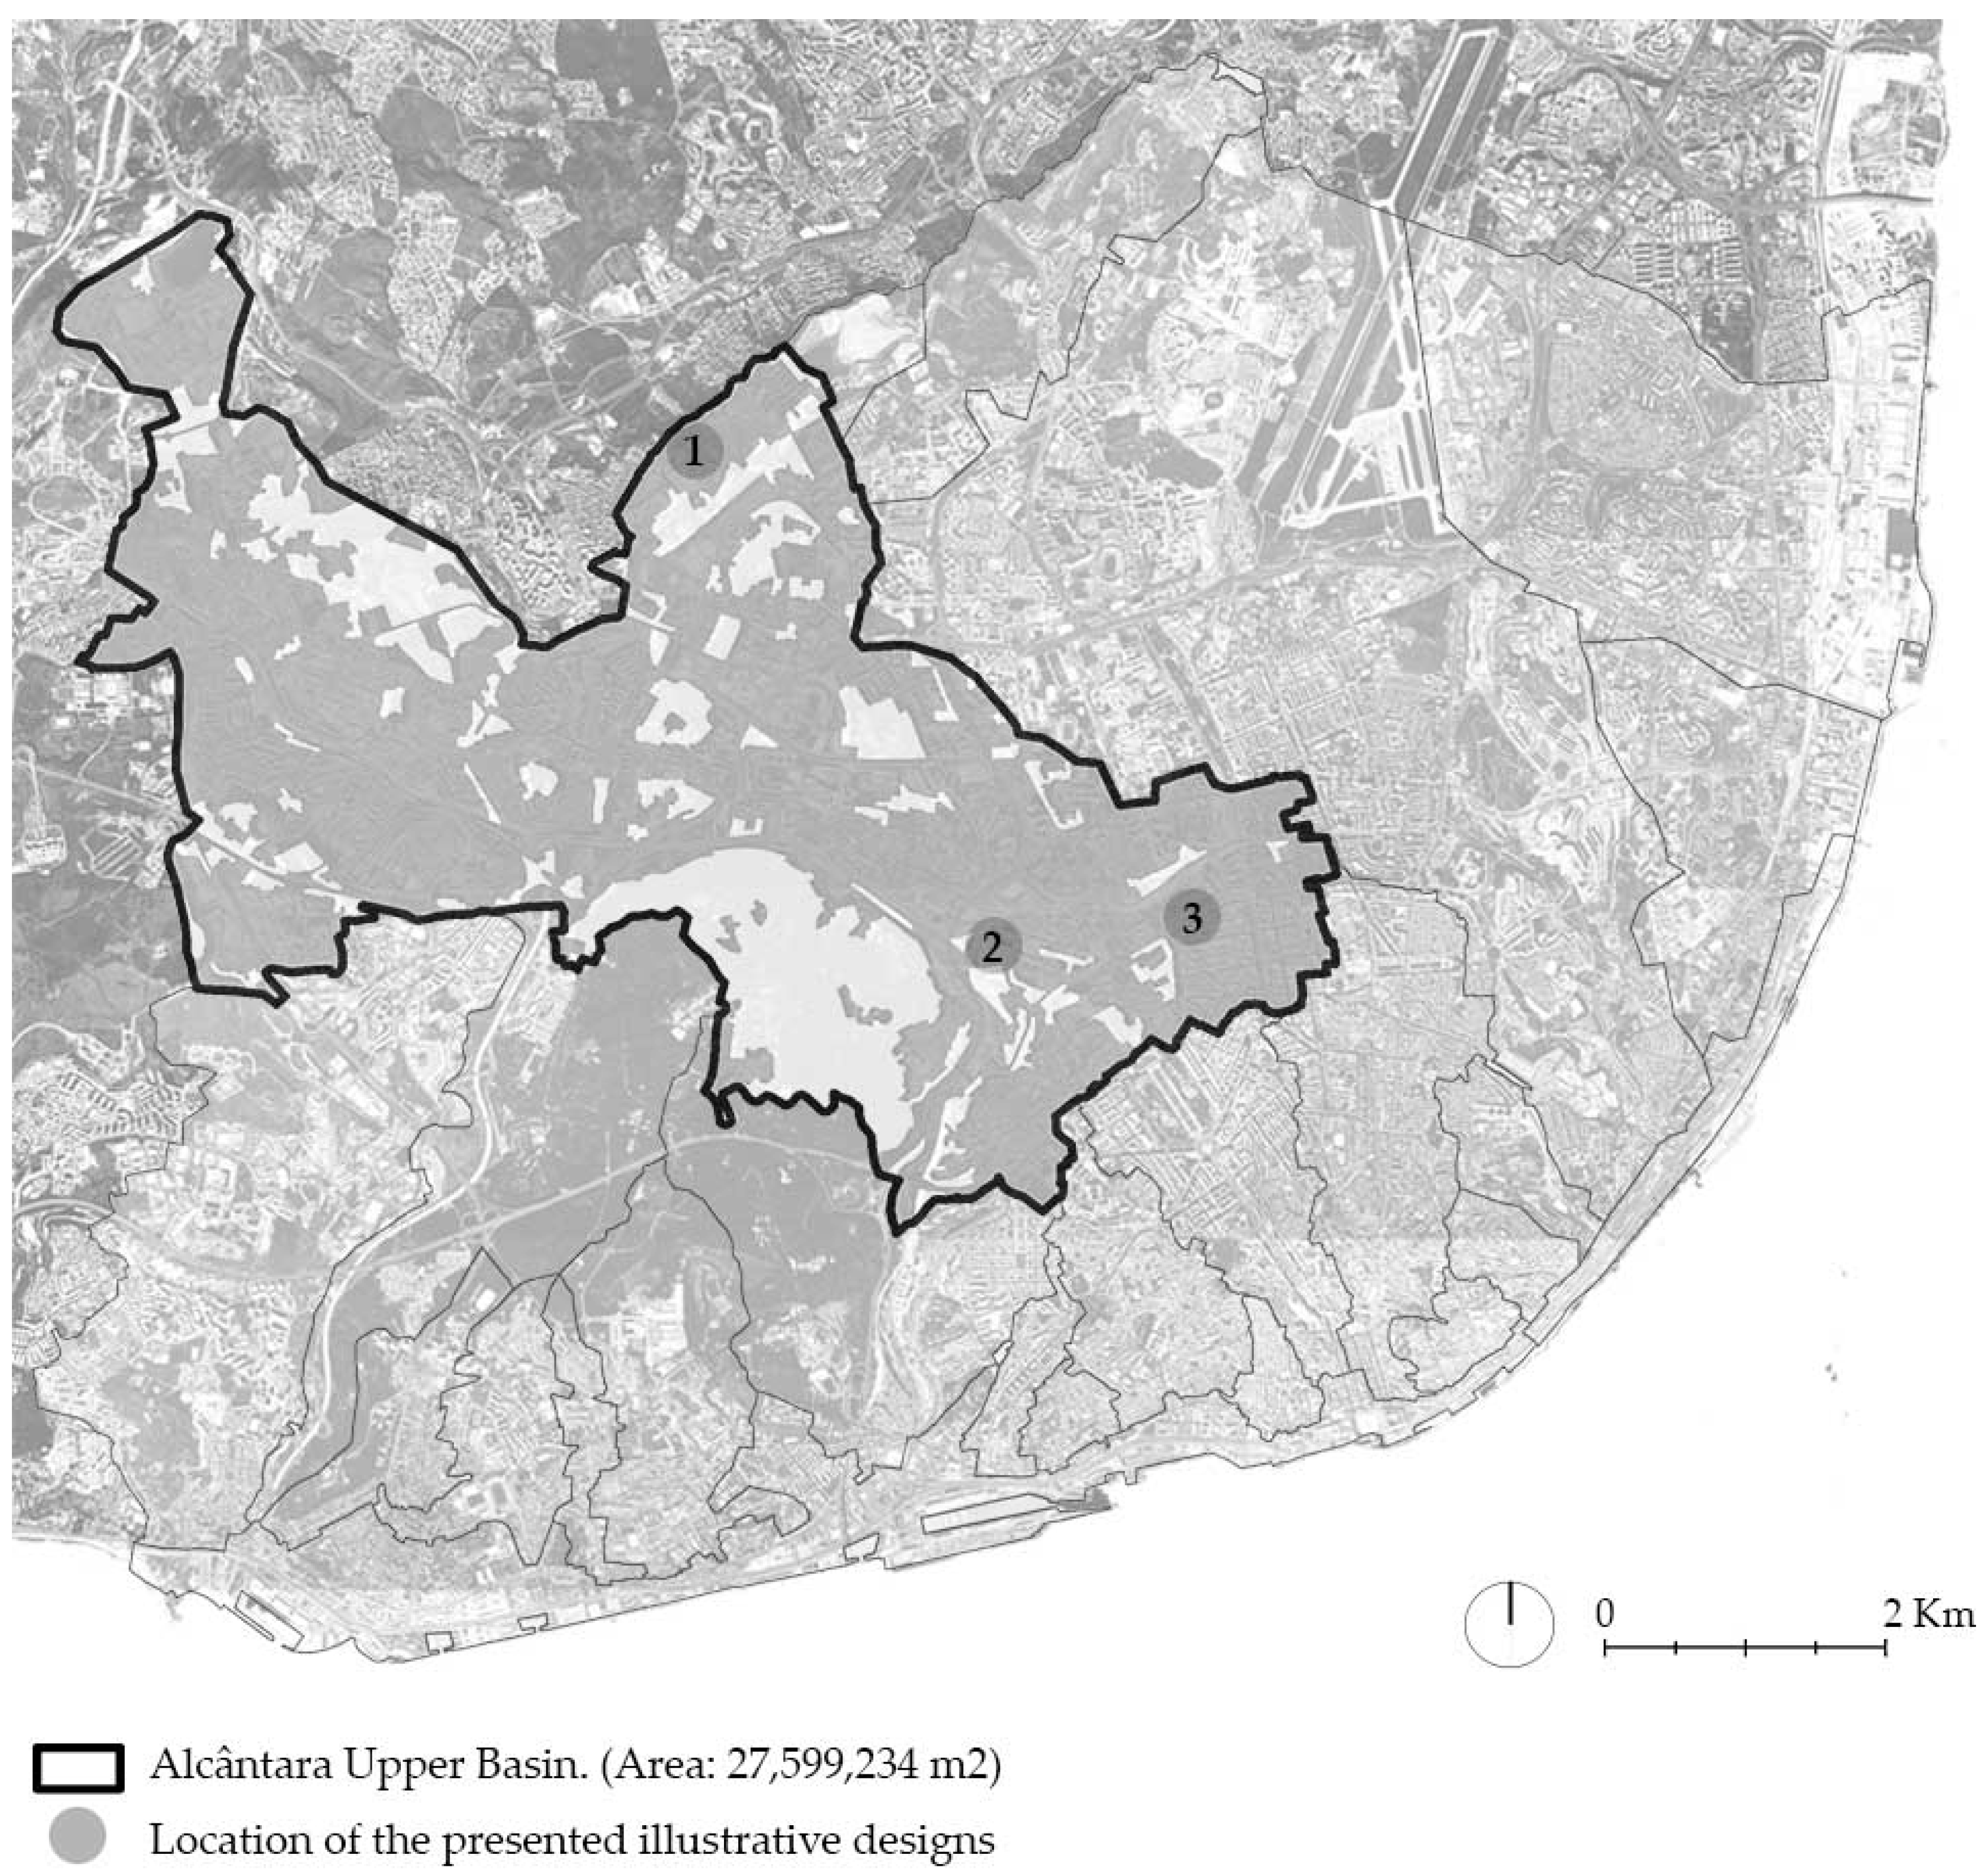
Figure 6.
Spatial analysis of the areas entailed in each proposed scenario and the corresponding potential areas for the installation of adaptation measures. Source: developed by the author.
Figure 6.
Spatial analysis of the areas entailed in each proposed scenario and the corresponding potential areas for the installation of adaptation measures. Source: developed by the author.
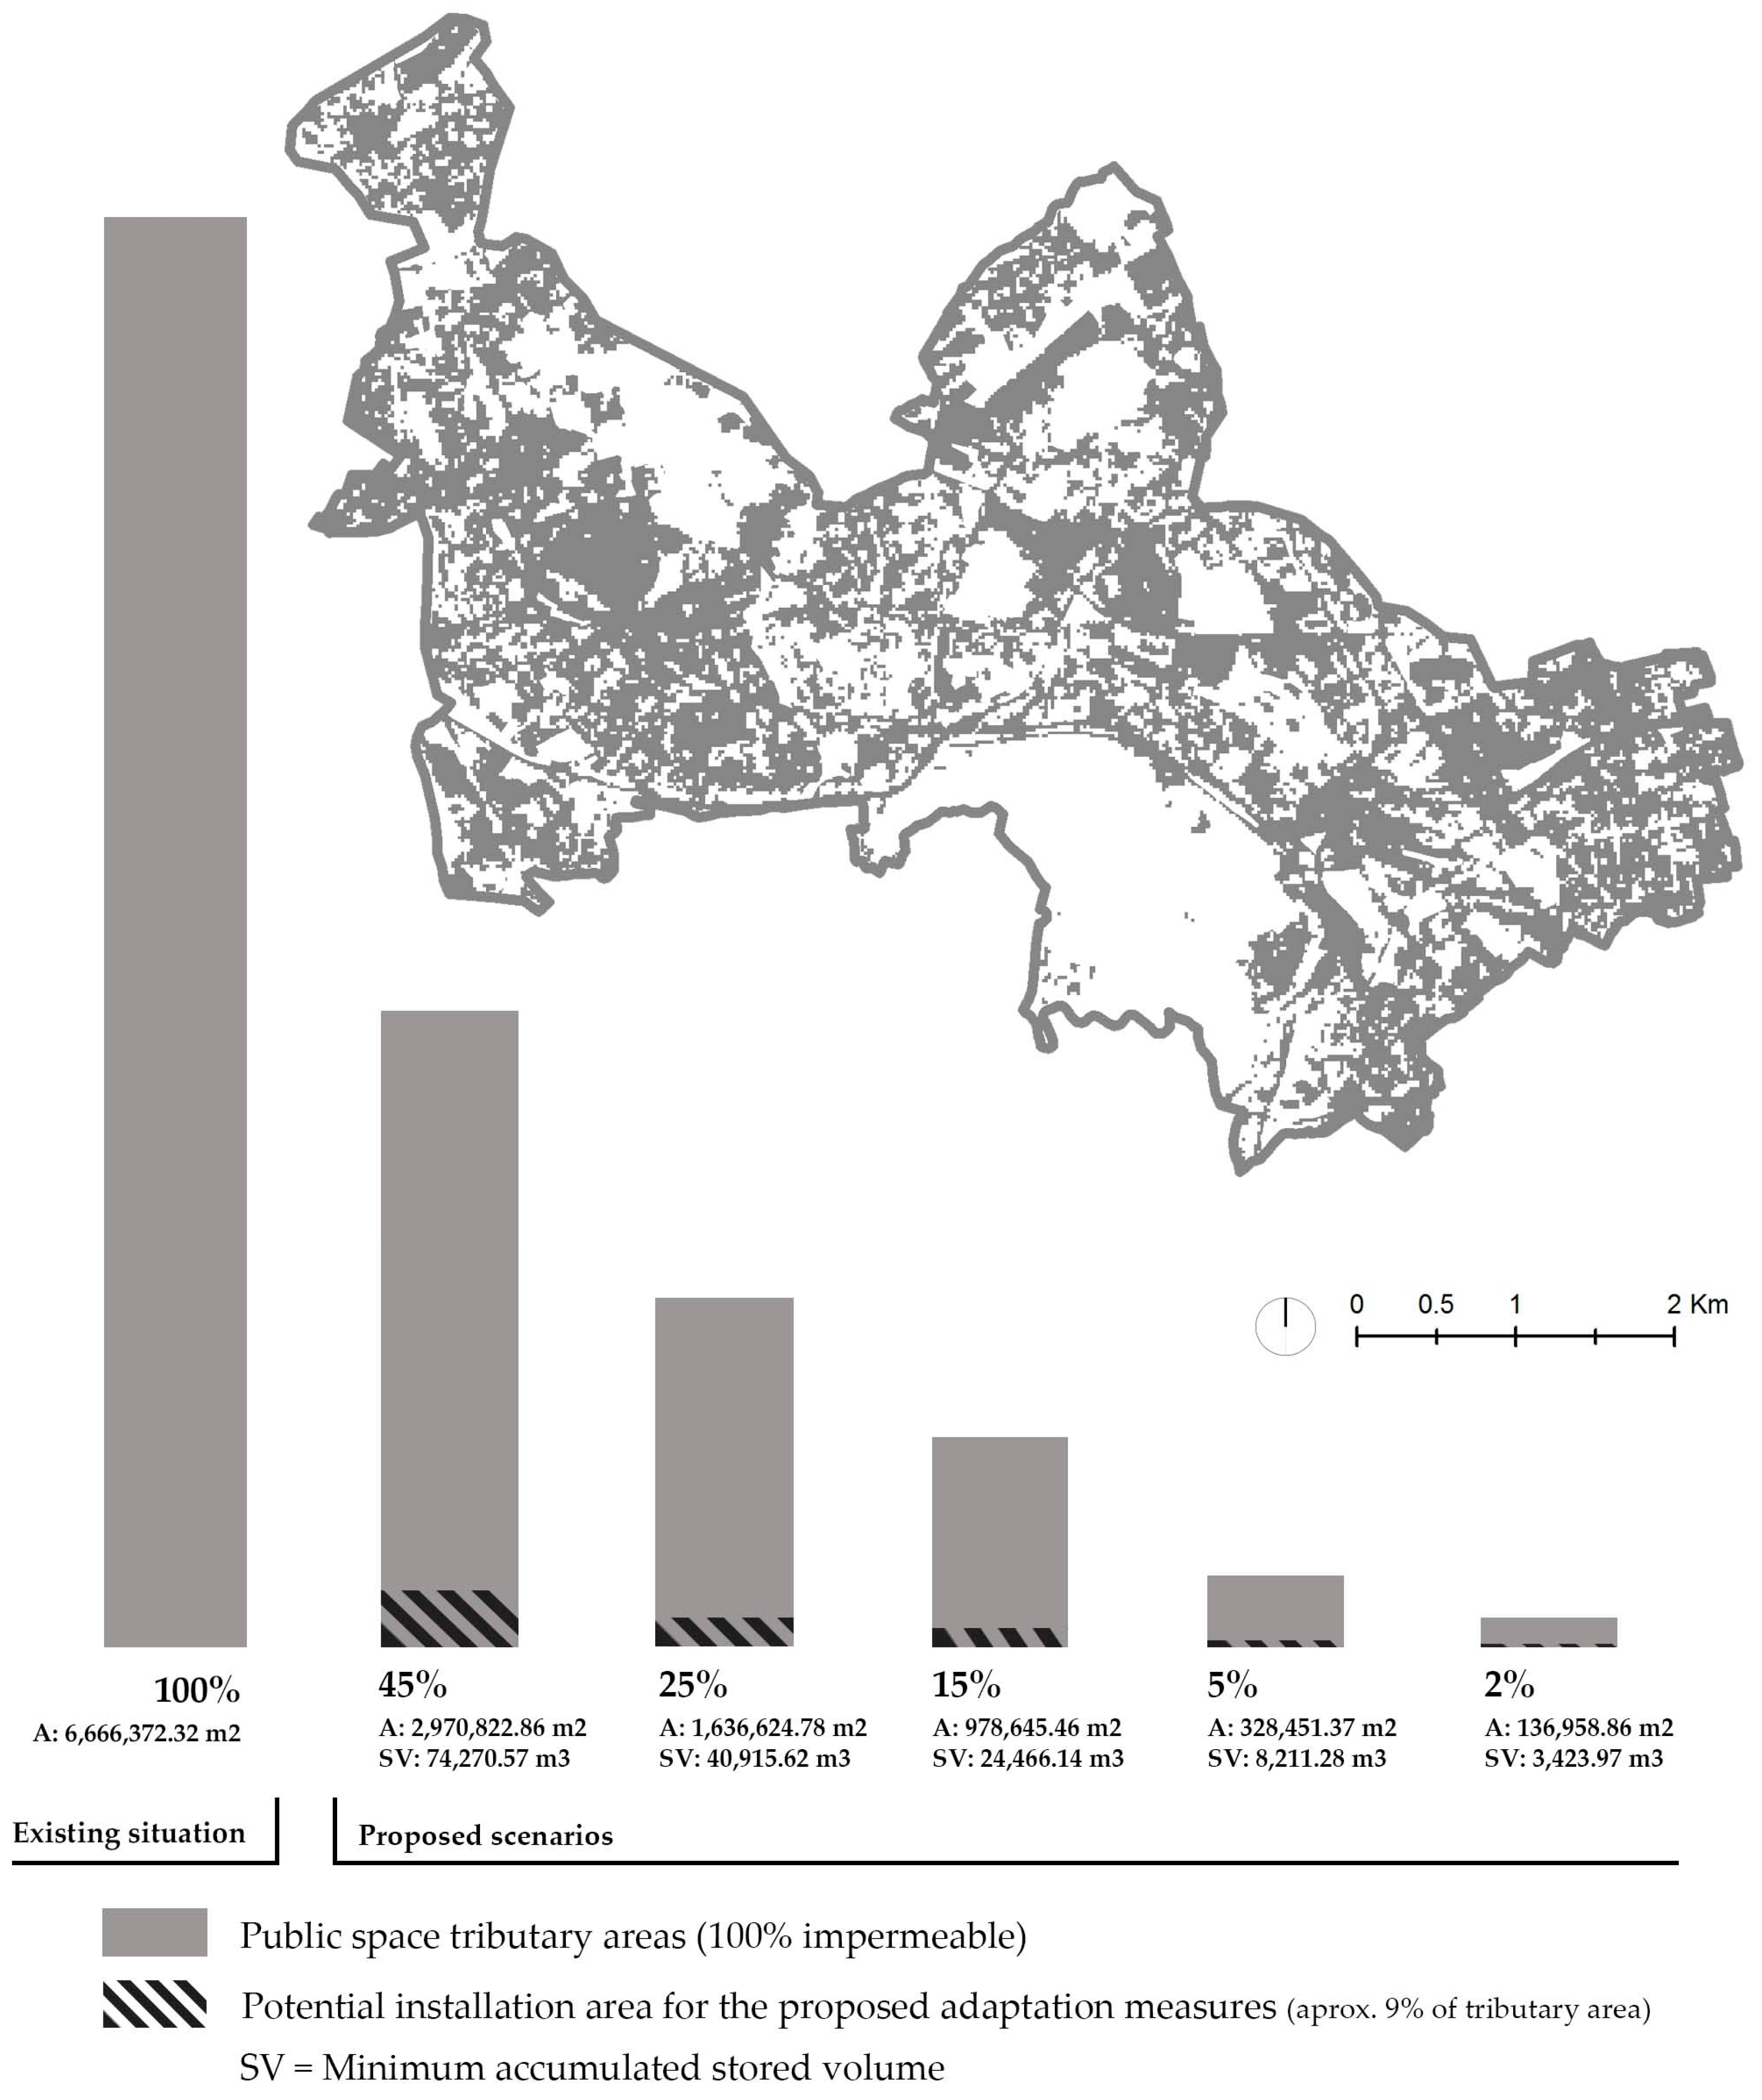
Table 1.
Summary of the adaptation measures directly and indirectly proposed by Lisbon’s Municipal Master Plan in effect (2012).
Table 1.
Summary of the adaptation measures directly and indirectly proposed by Lisbon’s Municipal Master Plan in effect (2012).
| Main Infrastructural Strategy | Measure | ||
|---|---|---|---|
| Category | Type | ||
| 1 | Harvest | Urban greenery, Rooftop retention | Green walls, Green roofs |
| Tree alignments | |||
| 2 | Store | Retention | Retention basins |
| Bioretention | Bioretention basins | ||
| Reservoirs | Cisterns | ||
| Underground reservoirs | |||
| 3 | Infiltrate | Permeable paving | |
| Infiltration techniques | Infiltration trenches, Leaky well | ||
| 4 | Convey | Stream recovery | Rehabilitation, Restoration |
Table 2.
Resulting areas form the “intersection” between “artificial territories” land use occupation classes (COS 2007) and the area with 100% soil sealing [23], together with “Potential Area for Public Space Adaptation” within each analyzed COS sub-class. Source: developed by the author.
Table 2.
Resulting areas form the “intersection” between “artificial territories” land use occupation classes (COS 2007) and the area with 100% soil sealing [23], together with “Potential Area for Public Space Adaptation” within each analyzed COS sub-class. Source: developed by the author.
| Study Area: Alcântara Upper Basin | ||||||
|---|---|---|---|---|---|---|
| COS 2007 | Soil Sealing EEA | Potential Area for Public Space Adaptation (within Area 100% Impermeable) | ||||
| COSN5 | Description (English, Author’s Translation) | Total Area (m2) | Area 100% Impermeable (m2) | % | m2 | % of the Total AUB Area |
| 1.1.1.01.1 | Predominantly vertical continuous urban fabric | 10,869,901.61 | 7,217,630.00 | 63% | 4,547,106.90 | 41.83% |
| 1.2.2.01.1 | Roads and associated spaces | 2,309,890.69 | 1,519,023.00 | 13% | 197,472.99 | 8.55% |
| 1.2.1.04.1 | Public and private facilities | 2,321,941.99 | 1,313,419.00 | 69% | 906,259.11 | 39.03% |
| 1.1.1.02.1 | Predominantly horizontal continuous urban fabric | 1,395,900.20 | 853,389.00 | 73% | 622,973.97 | 44.63% |
| 1.2.1.01.1 | Industry | 777,098.10 | 639,609.00 | 0% | 0.00 | 0.00% |
| 1.2.2.02.1 | Rail network and associated spaces | 532,952.94 | 478,908.00 | 10% | 47,890.80 | 8.99% |
| 1.1.1.03.1 | Parking lot and courtyard areas | 507,111.25 | 362,809.00 | 95% | 344,668.55 | 67.97% |
| 1.2.1.02.1 | Commerce | 352,647.64 | 264,515.00 | |||
| 1.4.2.01.2 | Other sports facilities | 407,243.30 | 224,606.00 | |||
| 1.3.3.01.1 | Areas in construction | 264,533.38 | 194,699.00 | |||
| 1.4.1.01.1 | Parks and gardens | 808,027.26 | 115,036.00 | |||
| 1.1.2.01.1 | Discontinuous urban fabric | 293,741.14 | 98,838.00 | |||
| 1.3.3.02.1 | Abandoned areas in artificialized territories | 110,107.04 | 95,584.00 | |||
| 1.4.1.02.1 | Cemeteries | 116,858.47 | 57,287.00 | |||
| 1.4.2.03.1 | Cultural facilities and historic areas | 113,161.32 | 53,476.00 | |||
| 1.1.2.02.1 | Discontinuous sparse urban fabric | 83,503.35 | 4395.00 | |||
| Total areas (m2) | 21,264,619.68 | 13,493,223.00 | 6,666,372.32 | 35.62% | ||
Table 3.
Projected scenarios for flood adaptation through public space retrofits, along 20, 50 and 100 years. Source: Developed by the author.
Table 3.
Projected scenarios for flood adaptation through public space retrofits, along 20, 50 and 100 years. Source: Developed by the author.
| Projected Scenarios for Flood Adaptation through Public Space Retrofits | ||||||||||||
|---|---|---|---|---|---|---|---|---|---|---|---|---|
| COS 2007 Description (Author’s Translation) | 2017–2022 (5 Years) | 2022–2027 (5 years) | 2027–2032 (5 Years) | 2032–2037 (5 Years) | 2037–2067 (30 Years) | 2067–2117 (50 Years) | ||||||
| Impermeable Public Space Area to be adapted | ||||||||||||
| % | m2 | % | m2 | % | m2 | % | m2 | % | m2 | % | m2 | |
| Predominantly vertical continuous urban fabric | 2 | 90,942.138 | 3 | 136,413.207 | 5 | 227,355.345 | 5 | 227,355.345 | 10 | 45,4710.69 | 20 | 90,9421.38 |
| Roads and associated spaces | 2 | 3949.4598 | 2 | 3949.4598 | 5 | 9873.6495 | 3 | 5924.1897 | 9 | 17,772.569 | 20 | 39,494.598 |
| Public and private facilities | 2 | 18,125.1822 | 3 | 27,187.7733 | 5 | 45,312.9555 | 5 | 45,312.9555 | 9 | 81,563.32 | 20 | 181,251.822 |
| Predominantly horizontal continuous urban fabric | 1 | 6229.7397 | 1 | 6229.7397 | 1 | 6229.7397 | 2 | 12,459.4794 | 8 | 49,837.918 | 15 | 93,446.0955 |
| Industry | - | - | - | - | - | - | - | - | - | - | - | - |
| Rail network and associated spaces | 1 | 478.908 | 1 | 478.908 | 1 | 478.908 | 2 | 957.816 | 5 | 2394.54 | 15 | 7183.62 |
| Parking lot and courtyard areas | 5 | 17,233.4275 | 5 | 17,233.4275 | 10 | 34,466.855 | 10 | 34,466.855 | 15 | 51,700.283 | 30 | 103,400.565 |
| Total areas (m2) | 136,958.8552 | 191,492.5153 | 323,717.4527 | 326,476.6406 | 657,979.3191 | 1,334,198.081 | ||||||
| % of Impermeable Public Space Area to be adapted | 2% | 3% | 5% | 5% | 10% | 20% | ||||||
| Minimum stored volume * (m3) | 3423.97138 | 4787.31288 | 8092.936318 | 8161.91602 | 16,449.483 | 33,354.952 | ||||||
| 2% | 5% | 10% | 15% | 25% | 45% | |||||||
| Minimum accumulated stored volume * (m3) | 3423.97138 | 8211.28426 | 16,304.22058 | 244,66.1366 | 40,915.62 | 74,270.5716 | ||||||
| Accumulated impermeable Public Space Adaptation area (m2) | 136,958.8552 | 328,451.371 | 652,168.8232 | 978,645.464 | 1,636,624.8 | 2,970,822.86 | ||||||
| Along 20 years | Along 50 years | Along 100 years | ||||||||||
Notes: * Design must manage at least 25 mm of stormwater runoff from first rainstorm.
© 2017 by the authors. Licensee MDPI, Basel, Switzerland. This article is an open access article distributed under the terms and conditions of the Creative Commons Attribution (CC BY) license (http://creativecommons.org/licenses/by/4.0/).
Share and Cite
MDPI and ACS Style
Matos Silva, M.; Costa, J.P. Urban Flood Adaptation through Public Space Retrofits: The Case of Lisbon (Portugal). Sustainability 2017, 9, 816. https://doi.org/10.3390/su9050816
AMA Style
Matos Silva M, Costa JP. Urban Flood Adaptation through Public Space Retrofits: The Case of Lisbon (Portugal). Sustainability. 2017; 9(5):816. https://doi.org/10.3390/su9050816
Chicago/Turabian StyleMatos Silva, Maria, and João Pedro Costa. 2017. "Urban Flood Adaptation through Public Space Retrofits: The Case of Lisbon (Portugal)" Sustainability 9, no. 5: 816. https://doi.org/10.3390/su9050816
Note that from the first issue of 2016, this journal uses article numbers instead of page numbers. See further details here.