
Sustainable Supply Chain Based on News Articles and Sustainability Reports: Text Mining with Leximancer and DICTION


1
Graduate School of Innovation and Technology Management, Korea Advanced Institute of Science and Technology (KAIST)
2
Department of IT convergence, Kumoh National Institute of Technology, Gumi 730-701, Gyungbuk, Korea
*
Author to whom correspondence should be addressed.
Sustainability 2017, 9(6), 1008; https://doi.org/10.3390/su9061008
Submission received: 15 April 2017
/
Revised: 4 June 2017
/
Accepted: 5 June 2017
/
Published: 10 June 2017
(This article belongs to the Special Issue Sustainability Issues in the Textile and Apparel Supply Chains)
Abstract
:The purpose of this research is to explore sustainable supply chain management (SSCM) trends, and firms’ strategic positioning and execution with regard to sustainability in the textile and apparel industry based on news articles and sustainability reports. Further analysis of the rhetoric in Chief executive officer (CEO) letters within sustainability reports is used to determine firms’ resoluteness, positive entailments, sharing of values, perception of reality, and sustainability strategy and execution feasibility. Computer-based content analysis is used for this research: Leximancer is applied for text analysis, while dictionary-based text mining program DICTION and SPSS are used for rhetorical analysis. Overall, contents similar to the literature on environmental, social, and economic aspects of the triple bottom line (TBL) are observed, however, topics such as regulation, green incentives, and international standards are not readily observed. Furthmore, ethical issues, sustainable production, quality, and customer roles are emphasized in texts analyzed. The CEO letter analysis indicates that listed firms show relatively low realism and high commonality, while North American firms exhibit relatively high commonality, and Europe firms show relatively high realism. The results will serve as a baseline for providing academia guidelines in SSCM research, and provide an opportunity for businesses to complement their sustainability strategies and executions.
1. Introduction
Sustainability has become an important topic in both academia and industry as governments, for-profit organizations, and non-profit organizations increasingly focus on this area in terms of business development. The concept of sustainability started with forestry, where harvest quantities are less than the yield [1,2]. It began to be considered as a policy concept in the Brundtland Reprt published in 1987 by UN World Commission on Environment and Development(UNWCED) [3]. Then, in 1994 Elkington used a triple bottom line (TBL) framework to define the concept in a more integrated way [4]. The formal definition of TBL in sustainability includes environment, social, and economic dimension, indicating that the traditional measure of performance based on economic profit should be extended to include the environment and the well being of people [4]. The increasing importance of sustainability in management can also be observed in the standard that stakeholders (including investors) use to evaluate excellent firms, where they value sustainability and focus on firms that can yield long-term profit while coexisting with the society. Sustainability is no longer a choice, but a requirement in management [5].
The globalization of business in diverse fields such as purchasing, manufacturing, distribution, and retail is intensifying the new code of corporate survival based on sustainable development [6]. A firm must perceive correctly that its growth and development are evaluated from the perspective of sustainability, and behave in such a way that not only considers stakeholder responsibility, but also its effects on upstream partners and downstream customers [7]. In terms of a firm’s managerial activities, the concept of sustainability must be discussed in all its main activities (e.g., purchasing, manufacturing, delivery, retail, and customers), as well as its relationship with suppliers (upstream) and with distributors/customers (downstream). Each activity must be evaluated within the TBL framework (environmental, social, and economic dimension).
Implementing SSCM is especially important in the textile and apparel industry, which is very labor-intensive, uses materials that have a potential environmental impact, and widely adopts global sourcing. Thus, SSCM in the textile and apparel industry is an important topic for both academia and industry [8,9].
The evaluation of sustainability of SCM may differ depending on the industry the business belongs to, the nature of employees, and the characteristics of the work environment. For example, SCM might consider the following questions: (1) What are the characteristics of the production materials? (2) What are the characteristics of the employee involved in production process? (3) What are the working environments in facilities? (4) Are there any flows other than the traditional distribution flow in the supply chain? (5) If so, do these flows occur frequently? The answers to these questions must provide a solution that does not compromise the needs of future generations, while still achieving economic and social development for the present generation. To facilitate meeting this objective, it is necessary not only to focus on theoretical aspects of sustainability and SCM, but to compile and organize business cases in the textile and apparel industry that can be compared to the findings of academic studies. The theory must pay attention to the real cases in the industry and needs to be updated based on field experience. On the other hand, firms must consider themes in theoretical discussions but not implemented in its practice when formulating sustainability strategies.
Collecting business cases in the field can be proceeded in two ways. The first is to conduct detailed data collection and analyses per each firm, which will conclude with important implications. The second is to focus on the news data, which are not detailed, but can be analyzed macroscopically, because the data exists for long periods. Furthermore, strategic directions on sustainability can be determined from sustainability reports (including CEO letters), which are used to deliver messages from the firm to their stakeholders. Detailed case studies are microscopic and costly, but provide detailed implication, while analyses of news/report data are macroscopic and cost efficient, and can provide general implications.
This study attempts to leverage analyses of news/report data to identify themes that are highlighted in theory, but are neither highlighted nor shared within the industry or among the public. In addition, we attempt to identify themes with opposite characteristics (i.e., themes that occur frequently in the field and must be resolved, but that are not considered seriously by academia). Thus, we identify gaps in the existing literature and in current practice. The gaps in literature are identified from news data and firm’s strategic direction and themes shared with the public, while the gaps in current practice are identified from the existing literature, and will be suggested as areas firms should consider implementing.
We pursue three research questions to achieve the objectives in the previous paragraph.
RQ1. In the perspective of value chain process and TBL, what are the differences between the themes of SSCM in literature review and those in the news of textile and apparel industry?
RQ2. What are the differences between the themes of SSCM in literature review and those in the sustainability reports of textile and apparel industry?
RQ3. Does the type or regional base of a textile and apparel firm lead to differences in the activities, intention and execution of SSCM in those firms?
This study is divided into two major parts. The first part establishes a framework for comparison based on a literature review. The second part collects and analyzes real data, creating practical findings that can be compared with findings in literature review in terms of directions and themes. To establish the framework for comparison, the literature on sustainability, and related studies, are reviewed to define the concept of sustainability. In addition, literature in SSCM are examined to identify the themes in the integration of SCM and sustainability. Indeed, several journals are endeavoring to formulate the concept of SSCM by compiling viewpoints of researchers and related literature [10,11]. Lastly, we consider how SSCM is evolving in the context of the textile and apparel industry, and the themes that should be emphasized in the process. This is because SSCM is an issue common to all industries, but there are themes specific to the textile and apparel industry.
In order to explore SSCM in the textile and apparel industry, and to compare it to the literature review, we have devised three studies. In Study 1, we explore the theme of SSCM in news data, which reflect economic and political debates by industries and the governments. These data are also evaluated within the TBL framework, which is a part of the literature review. Study 2 analyzes the sustainability reports, which are public message to external stakeholders, to explore the companies’ strategic positioning and implementing on the issue of sustainability. This study further examines whether this positioning differs depending on the type of firm (e.g., listed, MNE and regions). Finally, Study 3 extracts the CEO letters from the sustainability reports in order to analyze the strategic nature of companies’ organizational rhetoric [12] on sustainability. The analyses will enable us to determine the feasibility of sustainability related strategies or policies.
This research makes three major contributions. First, this research provides potential topics for future research on SSCM in textile and apparel industries based on news and sustability reports. It is difficult to deduce these topics using traditional cases study approach. Many researchers collect and analyze practical cases across various sectors and industries, but mining major issues of a specific industry and deducing implications take significant time. By analyzing public news (targeted at public) and sustainability report (targeted at stakeholders), the research provides the status and the future directions/strategies of SSCM along with critical but unexplored opportunities and rooms in this field of research. Secondly, this research provides methodological framework for systematic processing and accumulation of text data in SSCM by applying text mining methodology in the field of SSCM. The results can be the basis for firms and nations to quickly design prototype plans for sustainability strategies/policies without having to do surveys/observations. Although the plan will have to revised and modified later, this methodology can facilitate quick decision-making. Third, this research provides comprehensive perspective and expands the field of sustainability by applying sentiment analysis text mining method, which was mostly used in politics, leadership, communication and accounting researches.
The analyses uses news data, sustainability reports, and CEO letters as the base data. Therefore, this research is significant in that it uses actual data to explore how themes discussed theoretically are handled in real situations. In doing so, we attempt to derive a wide range of implications for the direction, depth, and intensity of future research, while also suggesting ways in which firms can implement missing themes in practice.
2. Literature Review
2.1. Sustainability Concept
The concept of sustainability was defined in detail with the publication of the “Report of the UN World Commission on Environment and Development.” People today attempt to maximize the welfare of the present generation and to enhance their quality of life. Development in this context may be economic development, but can also be social development [13]. Furthermore, development from an economist’s perspective may differ from that of a sociologist. For example, while an economists might use GDP to measure development, a sociologist will define welfare and how it can be measured, possibly using a human development index. Whether development is an economic one or social one, the future generations should not suffer as a result of development by the present generation. For example, resource depletion is a loss for future generations. Sustainability has three dimensions: economic, social, and environmental [1,4,14,15]. Economic and social development should minimize negative impacts on the environment, which is resource for both present and future generations.
In the TBL framework, the economic dimension can be expressed using national GDP growth or corporate profit growth. In other words, the economic dimension can be a cumulative generation of money, measured using GDP, from a national perspective, or it can refer to generating earnings, from a corporate perspective [16,17]. In the short term, a firm may earn a profit by reducing costs or saving money. However, negative social and/or environmental impacts may harm the firm’s long-term profit, and it may even face long-term losses. The social dimension in the TBL framework refers to people, and especially employees. It can refer to medical services and employees’ health or the provision of facilities for the handicapped and for minorities. The environmental dimension focuses on the themes where there is a conflict between current development and the state of the environment for future generations. This conflict raises questions on what policies should be prioritized [1]. Policymakers are faced with a trade-off between development and looking after the environment. The environment is a resource that future generations will inherit, and managed/maintained by the present generation [1,5].
2.2. Sustainabe Supply Chain Management in the Textile and Apparel Industry
2.2.1. Sustainable Supply Chains
A supply chain is a vertical sequences of independent transactions creating value to end consumers [18] and is also a set of corporate activities, including upstream and downstream flows of products, servicess and information to deliver value to customers and other stakeholders [19]. If a supply chain is indeed a flow of material, products and information of a firm and a set of corporate activities, it is no coincidence that SCM has emerged as a major theme in sustainable practices [3,20]. Furthermore, the servitization of manufacturing and commoditization of major resources makes it compulsory for firms to adopt SSCM to achieve successful SCM [6]. In addition, the past focus of optimizing operations in a specific factory/organization is moving towards the optimizing operations in the overall supply chain. Furthermore, the focus on sub-optimal operations from a cost perspective is shifting towards the creation of the greatest possible value in the overall supply chain [21]. This has led to a major focus on the implement of sustainability in the field of supply chains [20,22].
SSCM is a strategic and transparent integration to achieve economic, social, and environmental goals in the supply chain, encompassing the procurement of resources, manufacturing, and consumers, in order to ensure long-term profit [5]. The environmental goal is to minimize negative environmental impacts. The social goal is to maximize social well-being [23], which covers how the supply chain affects/treats employees, customers, and the community. These goals may increase operational costs in the short term and may conflict with one another [23]. Therefore, a variety of considerations and approaches, along with participants’ decision-making and execution, are required to ensure the success of SSCM.
There have been many studies on SSCM in the last decade [4,14,23,24,25], including recent comprehensive reviews of the literature [6,20,26,27]. Some of these studies emphasize the role of suppliers, while others quantitatively analyze the relationship between SSCM and a firm’s performance [28,29,30], emphasize collaboration among retailers and supplier [23,24,30,31], and include retail policies [25]. Other studies focus on outsourcing from the sustainability perspective (i.e., sustainable growth). These include qualitative studies resembling case studies [14,30,31], based on semi-structured questions and interviews [32,33,34], as well as quantitative analyses with analytical, mathematical, and empirical approach [23,25,35,36,37]. Excluding purely technical [38,39] and socio-scientific theoretical discussions [5,40,41], the SSCM themes can be classified as follows: functions of supply chain processes; the role of related organizations and partners, including government, which may enforce regulations or provide policy support; and SSCM in the context of business globalization.
The functions of processes in the forward supply chain, which is the traditional distribution flow of the supply chain, indicates that SSCM includes sustainable procurement, sustainable production, eco-design, sustainable distribution, and the role of customers.
Sustainable procurement and production includes selecting appropriate suppliers [42], resource reduction, reuse, and recycling [43], and minimizing waste by using nontoxic materials [44]. In sustainable production, environmentally friendly materials must be used, which lead to lower greenhouse gas(GHG) emissions [45]. In addition, water for production must minimize waste water [46,47]. These activities lead to environment-friendly products [48], which means that SSCM ultimatey aims to enhance environmental performance [43,49]. In addition, labor processes must be treated as ethically as possible in production process [50].
While many SSCM researches target private sector, researchers should also look into procurement process of value chain management in the public sector. Public sector also needs to procure while meeting organisation’s social, environmental and economic goals, and considering sustainable development. Lutz and Preuss (2009) state that there are some challenges and hurdels to adopt SSCM in public sector, such as increase in cost, lack of leadership and integration with standard procurement processes already in place. However, transparency, strategy, culture and risk management to implement SSCM as stated by Carter and Rogers [5] should also be applied to public sector [51].
Eco-design plays an important role in the efficient process aspect of sustainable production [52]. Eco-design is explicitly described in ISO 14001, where it recognizes and considers the environmental impact [49], aiming to minimizes the negative environmental impact during the product’s life cycle [53]. To achieve this, collaboration in purchasing and production among organizations and partners is necessary.
Sustainable distribution indicates a delivery process where transportation costs are reduced and the carbon footprint is minimized, as defined in ISO 14001 [49]. To attain these goals in distribution process, a firm must consider inventory control, warehousing, and packaging, and must make decisions on facility locations. This is because packaging may impact transport, depending on its shape, size, and material [53], and may also impact spatial requirements of warehousing. The locations of facilities and warehouses determine the design of logistics networks, where decision on various factors, such as offshore vs. onshore, and locating warehouse close to customers or resources, are necessary [23]. The mode of transportation is also important because it affects GHG emissions, cost, and time [54]. Sustainable distribution focuses on reducing emissions from transportation [55], distance of distribution, and empty miles. Inventory management is a crucial factor to be considered in sustainable distribution, and it is also a key performance index in the supply chain field. Whether or not the supply chain strives for sustainability, a firm must optimize its inventory in order to gain competency to survive and grow. The optimization of inventory is a key performance index in finance, where it maximizes cash flow. However, recent literature on SSCM rarely covers this aspect, which means it should be considered and managed to realize sustainable supply chains [23].
Achieving low carbon emissions may incur higher costs, which may be transferred to customers. Price-sensitive customers may not adopt these products. Firms respond to this by providing discounts as much as consumers buy. This problem occurs when a firm produces a product using renewable resources or recycled materials but this does not increase consumers’ willingness to buy. Fair trade, in the same context, may face the same issue because higher prices, stemming fromcompensating source regions (poverty regions) means extra pay for the consumer. Although research on pricing is not common [23,56,57,58], it is another important research topic in SSCM. The literature emphasizes the environmental dimension of sustainability [59] and sometimes uses the term green supply chain instead of SSCM [29,35,60,61,62,63].
While the above studies explain SSCM in the context of the traditional supply chain, other studies analyze how reuse, recycling, and remanufacturing can be included in the more common forward supply chain. Unlike the case of the traditional supply chain, they propose considering SSCM from the perspective of “closing the loop” (reverse logistics) [61]. Reverse logistics is a set of activities aiming to recycle and remanufacture, including collecting products from consumers, moving the collected products to recycling center, evaluating products and determining their value, repairing/remanufacturing product in the most economic manner, and then reselling the products [64]. In this way, firms can generate profit while contributing to environmental protection [65].
This summarizes the themes of SSCM from the perspective of functions in a supply chain, but there are perspectives based on activities that occur among participants in the supply chain process. SSCM requires collaboration among the entities in the supply chain. Inter organizational linkage is required within a firm and collaboration among upstream and downstream partners is required in the overall supply chain [7,66]. Technological collaboration may also be necessary, for example, in joint development with partners [29]. Handfield et al. (2002) emphasize collaboration with suppliers as upstream partners [67,68], and claim that such collaborations will enhance environmental performance [30]. In collaborating with partners, the sustainable responsibility of partners is also an important factor in SSCM [69]. However, if the suppliers, the one being engaged in buyer-supplier relationships, are SMEs (small-and medium-sized enterprises), contextual conditions including resource limitations may make adoption of SSCM difficult. The supplier may struggle to just obtain ISO 14001 certification to be eligible to be a supplier. In this case, buyers should not enforce SSCM practice to SMEs, but provide incentives for the supplier to adopt SSCM driven by autonomy, competence and relatedness [70].
Regulatory and governmental perspectives may suggest environmental laws and policies as SSCM research themes. A policy can be a regulation or green incentives [49,71]. In the financial market, mutual funds or pension funds may require environmental activities and sustainable practices of the firm in which they are investing [72,73]. Furthermore, there is ISO 14001 which is an industry standard. While ISO 9001 describes quality management systems, ISO 14001 describes environmental management systems, and can be used as a standard to audit and certify firms. ISO 14001 serves as a guideline for greening supply chains, which provides guidance on lean management, eco-design, production facilities, clean programs, reducing carbon footprints, product life cycle costing or assessment, reducing transportation costs, reverse logistics and remanufacturing [6]. There also is ISO 26000 (Guidance on Social Responsibility), which was published in November 2010, which covers the standardization of sustainable management from the perspective of economics, society, and the environment. This standard was influenced by ISO 9000 and ISO 14001, and serves as a pioneering standard in the field of social responsibility. The uniqueness of ISO 26000 is that it is a voluntary international standard, and does not require certification by a third party [74]. ISO 26000 defines seven principles (accountability, transparency, ethical behavior, respect for stakeholder interests, respect for the rule of law, respect for international norms of behavior, respect for human rights), seven core subjects (organizational governance, the environment, labor practices, human rights, community involvement and development, consumer issues, fair operating practices) and the engagement of stakeholders [75]. While there are criticisms that ISO 26000 is a weak guideline without concrete measures [76], it is considered an example of transnational governance in the field of sustainability and CSR [77].
The perspective of global business prompts readers to focus on the phenomenon of global sourcing, where firms search for optimal sourcing locations for low-cost. While outsourcing and offshoring decisions are made based on cost-reduction goals, a firm must also ensure the quality of a product and quick time-to-market. A firm cannot relinquish any of the three goals (cost, quality, and time-to-market) of global sourcing, and must achieve all three to minimize business risk [50].
Lastly, the economic performance perspective of TBL is divided into two groups, where one group claims that a green supply chain has short-term negative effects on economic performance [20], while other claims that it enhances economic performance [62]. This indicates that there is a mix of both negative and positive impacts by green supply chains on economic performance [78,79]. Some researchers claims that green purchasing (a subset of green supply chains) may enhance short-term cost savings and positively impact brand image, which will lead to enhanced economic performance [49].
In addition to the discussions in economic performance, some researchers believe that the early adoption of environmental and risk management may not have a positive impact on environmental performance. However, firms may ultimately perceive the environment as a competitive advantage [62], and SSCM can be an effort to implement this competitive advantage. Among these discussions, the most critical and imminent topic is the measurement of SSCM performance. Measurement of SSCM performance has been studied by many scholars and is a field where practitioners and researchers must keep devising practical and feasible measurement methods.
Burritt et al. (2012) is a good example of research that suggests SSCM performance measurement for biomass. It considers the characteristics of biomass such as its production and its the purpose (including input material, transportation, and energy source) while providing comprehensive checklist for sustainability accounting. First, what is the particular step that must be considered in a product’s production and use? Second, what must be considered in the perspective of sustainability impacts? Third, what indicators must be selected? Fourth, how will it be measured and what are the unit and methodology of measurement? Fifth, how to enhance reliability of accounting information and reporting? Lastly, which responsible and interested party is this being reported to? [80]. This research provides important direction for researchers as it reviews the production and use of biomass in technical perspective and studies the impact of biomass comprehsively.
Although there are conflicts in the viewpoints on economic performance and environmental performance of SSCM, SSCM is no longer a choice for a firm, but an indispensable requirement [5]. In summary, researchers endeavored to answer to following questions: (1) What are the sustainable supply chain activities? (2) How can it be measured? [34,81] (3) What is the relationship between SSCM activities and firms’ performance?
2.2.2. Themes of SCM and Sustainability in the Textile and Apparel Industry
Scholars sometimes research SSCM issues in a specific industry [8,68,82,83,84]. It is necessary to apply SSCM themes to the textile and apparel industry and to identify points of emphasis or additional consideration. This is because the textile and apparel industry is labor intensive and very sensitive to the environment and society [50].
First, the industry should use more eco-materials in the procurement and production processes. It is also necessary to use organic fabrics and to reduce the use of harmful chemicals and water [85]. Reuse and recycling is also possible if old clothes or scraps can be utilized [86]. Recycling is indeed a very popular process in the fashion industry.
Second, multinational enterprises (MNEs) that are established to outsource globally for cost reduction may turn to low-cost labor, which means there is higher probability of a very young employee being involved in the manufacturing process or manufacturing facility in a poor work environment. These may negatively affect employees’ safety and human rights. Furthermore, poor work environments and inexperienced workers may expose the facility to higher risks of fire or safety accidents. Since MNEs make up a major portion of the textile and apparel industry, the industry has a global impact on carbon emissions from the location of factories and transportations. Therefore, the industry must take additional considerations in adopting SSCM [87].
Third, customers play a very important role in the success of SSCM, for example, in eco-fashion consumption, where customers are willing to pay for environmentally friendly products [88]. In the fashion industry, a firm’s SSCM can positively impact brand image and lead to a competitive advantage in the market [89], and therefore the relationship with and role of customers are more important than in other industries. Because an improvement in brand image may lead to long-term economic performance, it is easier to avoid the conflicts among TBL goal. In this context, Beard (2008) recommends promoting eco-fasion brands under the concept of ethical fashion [90].
It is also worthwhile to note that SSCM issues in textile and apparel industries are often discussed within the theme of CSR [91,92]. CSR covers variety of topics such as SCM, globalization, transaction cost economics, social issues, buyer-supplier relationships and collaboration. SSCM and CSR are not substitutes but complementary where both can become two pillars of sustainability research. Hoejmose et al. (2014) suggest that firms’ reputation can be developed by CSR but it can also be enhanced and protected by responsible supply chain management. This research connects SSCM and CSR with concepts of trust, credibility and firms’ reputation to identify indirect relationship with firms’ performance, which suggests that responsible supply chain management can ultimately lead to competitive advantage of a firm [93].
2.3. Materials Analyzed: News, Sustainability Reports and CEO Letters
2.3.1. Sustainability Report-Based GRI
Sustainability reports are becoming standard practice for firms as a way to communicate with its shareholders [94,95]. Firms that have been endeavoring to implement SSCM demonstrate their efforts in a sustainability report. Some contents may be described in financial reports, but a sustainability report is the formal tool used to communicate with the firm’s shareholders on the theme of sustainability. However, there are some criticisms on the form of sustainability reports. Sustainability reports may be used as a tool to package actions as being positive, and can be used in impression management to maintain the legitimacy of the firm [96]. Despite these criticisms, there are attempts to standardize and specialize the format, which has led to the Global Reporting Initiative (GRI).
GRI is a global standard that was established in 1999 to implement sustainable management [97] and was expanded in 2002. In 2006, the third guideline, G3, was released, which consists of a sustainability report guideline, index protocol, description protocol, and industry-specific annexes. The standard format of the report provided by the GRI consists of an organizational profile, management approach, and performance indicators. The organizational profile describes the operational, strategy, and governance structure of the organization, while the management approach describes the methods used to achieve sustainability and achievements in specific areas. Lastly, performance indicators indicate performance based on TBL. The categories of environmental and social indicators are (1) environmental, (2) labor practices and decent work, (3) product responsibility, (4) human rights, and (5) society [98].
GRI is likely to become a platform for broadly participative societal dialog on the components of sustainability performance, as perceived by companies and other organizations [97]. Moreover, GRI reports are important in practice in that they are an efficient assessment tool used to measure and report corporates’ sustainability performances [99].
2.3.2. CEO Letter
In every sustainability report, there is a CEO letter, which decribes the firm’s performance and strategy of the firm [74,100]. The CEO letter does not literally state the reality, but is an attempt at “sensemaking” for stakeholders inside and outside the firm [100]. Firms may use the CEO letter to provide its vision to its customers or to justify/legitimize their behavior. By analyzing CEO letters, researchers can determine the past and predict the future performance of a firm, because it possesses information on the two points of time [101]. Indeed, existing literature has identified self-confirmation and embellishments in CEO letters [101] and as well as identifying metaphysical and modernism expressions [102]. Therefore, we study a firm’s response to the external environment [103], its CEO’s capability [104], and identify strategic messages by analyzing the CEO letters [105]. The analysis of the CEO letter in the sustainability report indicate the firmness of the firm’s vision of sustainability, the strength of its intention, and the degree of future-orientation. The study of CEO rhetoric related to sustainability is a novel research area, and is gaining attention [106,107].
2.3.3. News Articles
News media are an important source of information for the public, and may exert both positive and negative impacts [108]. The influence of news media on the public can form the public’s perception of a social issue, affect personal attitudes, and change behaviors [108,109,110]. The people that receive the information may also an exert influence on the sender [111]. Whether the news consists of facts or messages with intention, both senders and receivers of the information interact mutually [112]. News articles emphasize political and ethical issues, and communicate their importance to make them a policy agenda [109,113]. When information from a source is perceived to be credible, the news will have a greater impact on public opinion [114]. Therefore, media can pressure a firm towards a more environment-friendly attitude or to greater willingness to embrance social responsibility [115]. News delivers facts about a firm that the public is likely to be interested in, and allows the public to give feedback to the firm after receiving the information [116]. This is because news is generated from selected facts worthy of mutual interaction. Therefore, the theme of sustainability in news articles will identify not only the present status of the firm, but also change the attitudes of the public and the firm’s future, which takes into account the public’s attitudes.
2.4. Research Process and Initial SSCM Research Map
To summarize the literature review, firms are endeavoring to achieve current and future development by working towards economic, social, and environmental goals, and minimizing their impact on the environment while engaging in economic and social development. Such activities most frequently occur in the form of SSCM.
The literature on SSCM can be classified into a few key dimensions. For example, what data were collected? What methodology was used? What is the main theme? Which activity on value chain process does the research target at? Does it compare regions/nations or industries? Table 1, Table 2 and Table 3 below classifies the existing literature based on 6 key dimensions. The literatures were divided into reviews and researches on a specific topic before classification. Majority of researches on the past and present trends of the SSCM field investigates existing research literature or uses interviews of related experts. These were based on the analysis of trends and patterns using descriptive statistics or qualitative analysis methodology. There were many researches that measure SSCM performance as a variable (the topic in concern) changes, while in the perspective of value chain process, procurement and production processes were most popular. Survey is often used to study the relationship between firms’ performance and specific variables associated with SSCM. Some have attempted to measure performance related to sustainability through surveys [117]. When CSR is the central concept of research, it uses the concept of social performance.
In terms of methodology, there were case studies based on secondary data and interview and empirical quantitative analysis that attempted to build theoretical models or test specific hypotheses.
The articles for literature review were selected based on the following criteria:
- -
- Searched in Scopus DB using keywords “sustainability” and “SSCM”
- -
- Deals with both sustainability and supply chain management
- -
- Published in 2000 or later
In addition, articles that did not include “sustainability” and “SSCM” but discusses SSCM on the perspective of value chain were also included (e.g., reverse logistic, ISO 26000 and CSR). The following table lists the articles that were selected based on the criteria above in the descending order of number of citations.
This research is distinct from the existing literature in that it collects vast amount of data on textile and apparel industry from multiple sources. Rather than formulating theories on specific concept, we adopt exploratory approach where we search for the themes and concepts of the real business field. We use quantitative analysis on qualitative data.
The recent literature on SSCM can be depicted as a map based on major themes and concepts as shown in Figure 1. The grouping of research themes based on key concepts can deduce research topic groups that shows the present status and predicts directions of the field. The first group consists of themes related to sustainable procurement, production and input materials in the processes. The second group approaches SSCM in the customer perspective where existing literature emphasizes the role of consumers in SSCM in textile and apparel industry. It also looks into how different variables such as consumer’s recognition on materials (e.g., renewable resource), brand image, pricing, cost, fair trade, and eco-fashion consumption relates to SSCM.
The third group consists of themes related to facilities (e.g., packaging and warehousing) and manufacturing (e.g., low carbon emission and remanufacturing). The next group deals with ethical labor practices such as human rights and safety, and the fifth group evaluates performance of SSCM (e.g., inventory control, transportation cost, pricing, cost, time and quality). Lastly, there is a group of independent topics such as collaboration among entities, policies (e.g., green incentives), international standards (e.g., ISO 14001, ISO 26000) and global sourcing.
For successful SSCM, some goals are applicable to all industries, while others are specific to particular industries. The literature review indicates that the emphasis on the following map is necessary for successful SSCM in all industires including textile and apparel. The map provides a guideline, which we will compare with the SSCM themes we identify in real news data and sustainability reports. Since the purpose of the map is to explore the important areas of research that are not emphasized or researched, it is denoted as research map rather than conceptual framework.
Research questions, initial SSCM research map based on literature review and revised SSCM research map based on the results of this research can be depicted as research process and output in Figure 2.
3. Study 1
3.1. Data
In Study1, news data from 2009 to 2016 (seven years) were collected and organized by year. The news data were extracted from the Lexis-Nexis academic database, with the following filters applied: textile and apparel-related industries for industry and major world publications as the news source. Only news containing both sustainability and supply chains were selected. This research is inductive methodology based on secondary and tertiary data. Theoretical sampling, rather than statistical sampling, is used to complement and challenge existing literature [118,119]. The rationale behind collecting news data from 2009 is because G3 was developed as a GRI guideline in 2006, and firms in textile and apparel industry started to publish sustainability reports based on G3. Therefore, we considered that the news data also started accumulating from 2009. This criteria is expected to collect appropriate data for complementing and challenging existing literature.
A total of 792 news articles were filtered, from which the numbers of articles and words were analyzed per year (Table 4). From 2009, there is an increasing trend in the number of news articles. The rationale behind analyzing news before other data types is that news is generated from topics on social, corporate, government, and national issues in which the public may be interested [120]. Furthermore, it is generated by a third party, which means it is more likely to be objective than reports compiled by a firm [121,122].
One of the purposes of Study 1 is to explore the major themes in sustainability and supply chains generated by the public and private sector, as well as in the contents generated as news to gain public attention. The changes in these issues can be deduced from the yearly data. Since media characterizes specific interests and issues, the results can be compared with interests and issues identified from theoretical literature.
3.2. Method
3.2.1. Content Analysis
We apply a content analysis based on text mining. A content analysis is a methodology that analyzes a large quantity of text and deduces manageable categories, which can be analyzed further to deduce specific concepts or themes [123]. Content analyses can elicit effective inferences from the text and also infer responses and behaviors towards a specific issue [124]. Although the content analysis started as a qualitative analysis to identify the meaning of text, it can also be used quantitatively by counting. This means that quantitative conclusions can be deduced from qualitative material [125]. A content analysis can lead to optimized results when both qualitative and quantitative methods are mixed [126].
In a content analysis, we must examine specific units in the text and extract appropriate data. This is related to how categories are classified and themes are deduced, and is called coding in content analysis. There are three types of coding: (1) qualitative coding, based on manual/guideline/intuition, (2) computer-assisted coding, where a person intuitively classifies data, while a computer organizes the results (e.g., Nvivo), and (3) computer-based coding, where the computer uses algorithms to generate the coding (e.g., Leximancer) [127]. There is also another type of computer-based coding, called a sentiment analysis, which quantifies the strength of emotions (e.g., positive, negative, and neutral) based on a dictionary [128,129].
In Studies 1 and 2, the third coding method is adopted. This is because algorithm-based content analyses (quantitative analyses by computer based on frequency and co-occurrrence algorithms) enable more subtle and in-depth analyses than an average person can achive by analyzing qualitatively [130]. This method is economical (i.e., can analyze large quantity of data), systematic, and reliable [131]. There are two types of content analysis where the computer counts the categories. The first is frequency and co-occurrence based, while the second is dictionary-based. In this research, Studies 1 and 2 adopt the first type (Leximancer) and study 3 adopts the second type (DICTION).
3.2.2. Leximancer
Leximancer is a software tool based on a statistical algorithm for analyzing text data [132]. This methodology is widely used in content analyses and has been employed in various studies [120,123]. It is based on the corpus linguistics observation [133]. Leximancer reliably and reproducibly identifies the main concepts embedded in the text (i.e., the frequency and patterns of co-occurrence) based on the ways in which words correlate with one another in the text. Leximancer overcomes various limitations of qualitative analyses. First, it overcomes the potential bias and errors of the researcher when he/she codes categories manually from the data and sets rules for categorization [127]. With Leximancer, we are able to deduce concepts and themes automatically from the data and provide enriched interpretations [127,132]. The concepts deduced from Leximancer are composed of mutually connected words, which are defined as words (including their synonyms) that occur in two sentence text blocks [134]. A theme is defined as a set of concepts and uses the name of the most prominent concept. Here, prominence is not merely based on frequency, but on the number of connections with other identified concepts [134].
3.3. Results
3.3.1. Theme and Concepts
Leximancer generates the most frequently occurring concepts from the news text [131], as well as themes as sets of concepts. Leximancer generated 61 concepts and 8 themes from the 792 news articles. The eight themes are products, supply, sustainability, fashion, clothing, retailers, factories, and green (Table 5). The names of the themes are those of the most prominent concept in the group of connected themes. For each theme, the number of hits and connectivity was calculated, where connectivity indicates the relative importance of the theme, and hits refer to the number of text excerpts that match each concept [123,135].
The generated concepts and themes are then mapped to corresponding years using a correspondence analysis. The correspondence analysis is an exploratory technique for analyzing categorical data, considering the sample size for each category. Although it does not guarantee the statistical significance of the relationships, it provides a comprehensive view of the relationship between categories [136].
The yearly trends in the themes and concepts suggest that the emphasis of news articles change over time. For example, 2009 has a greater number of links to the theme of products, which is linked to concepts such as products, process, use, chemical, environments, and materials. 2010 has more links to the theme of green, including concepts such as price and cost, 2011 has more links to the theme of supply, and its related concepts. Year 2012 is linked to the concept of green, 2013 is linked to the concepts of factories and worker, 2014 is linked to the theme of sustainability and, finally, 2015 is linked to the concepts of worker, clothing, and garment (Figure 3).
Table A1 lists the top 40 generated themes, ordered by the number of counts. “Count is the number of times a word (concept) appears in the entire corpus (two-sentence blocks)”. “Relevance indicates the most frequent occurrence, and shows proportionality (representative) relative to the other themes”[134]. From the perspective of stakeholders [137,138], the counts of concepts suggest that workers and retailers have the most counts (494), followed by consumers (457), suppliers (338), and customers (310). Consumers and customers appearing frequently may be due to the nature of the news data, while workers and suppliers appearing frequently may be due to the search keyword being sustainability and SCM (see Table A1). Mapping the concepts on the supply chain indicates that the concepts are evenly distributed along the chain. In manufacturing, several concepts occur very frequently: factories (533), workers (494), manufacturing (494), and quality (231). In distribution, retailers, as entities of the distribution, were generated (Figure 4).
3.3.2. Linked Concepts of Social, Environmental, Price, and Cost
From the perspective of TBL, social and environmental were generated explicitly as concepts, but it was difficult to identify concepts that represent the economic dimension. While there were many researches on economic performance in the existing literature [5,49,62,79], this topic does not explicitly emerge in the news. This may be because the public and the corporate businessmen are indifferent on relationship between SSCM and economic performance or because the topic itself is not considered as a noteworthy topic. When the firm perceives that the SSCM is a variable that affects real financial performance, then it will emerge as a topic in the news. However, we may consider that price and cost are related to the discussions on the performance of the three dimensions. Therefore, we further deduced other concepts closely interconnected to those of social, environmental, price, and cost. The Table 6 shows that the social concept was counted 81 times with respect to the environmental concept. This means that the two concepts were mentioned together 81 times (i.e., count is the number of times a concept is mentioned with the other concept) and that of all comments on social, 29% mentioned environmental, as indicated by likelihood of 29%. This means that if social concept was mentioned 100 times, the number of it occurring with environment concept is 29 times. Environmental and social both have high values of accompanying occurrence and likelihood. For the environmental concept, closely linked concepts are green, water, chemical, and manufacturing, while for the social concept, the closely linked concepts are ethical, factories, and labour. Since both environmental and social occur frequently with sustainability, this shows that the news considers the two concepts to be the main concepts of sustainability.
It is also worthwhile to note that the water concept were not a standalone topic of research but ranked as one of the top concepts in social and environmental dimensions.
An investigation of the concepts linked to cost and price indicated that both occurred together very frequently and with a very high likelihood. It is very noteworthy to see that quality is closely linked to both price and cost, which means that a firm working towards global sourcing is not only aiming for low cost and optimal pricing, but also quality enhancements. The cost concept is connected to sales, retailers, and international, while the price concept is connected to international, retailers, and trade (Table 7).
4. Study 2
4.1. Method
4.1.1. Data
In Study 2, the sustainability reports published in the past three years by firms in the textile and apparel industries were collected for analysis. The collection focused on sustainability reports based on GRI standards. Here, 24 firms qualified and were selected. These 24 were classified in GRI site as textile and apparel industries and published sustainability report for three or more years, indicating more interest in sustainability than their average counterparts. The sampling in this research were informed by the firms’ interest on sustainability and reporting [119], which means that it is in nature theoretical and purposive sampling [118], and will contribute to identification of new concepts and research direction by providing various pratical cases. Since sampling is based on key action (3 or more years of sustainability reporting), the selected firms are not evenly distributed by region and type. All reports are titled as either a sustainability report or a CSR report, where both are targets of analysis. Recent researches and practices indicate that CSR is treated as a comparable concept to sustainability [65,139]. This tendency can be seen in ISO 26000, where sustainability factors are all considered under social responsibility (SR). The 24 firms analyzed can be organized as shown in Table 8, depending on whether the firm is listed, the region where it is located, and whether it is an MNE. Of the 24 firms, 12 are from listed firms, 12 are from MNEs, and 7 are from Asian firms, while 6 are from North American firms, and 11 are from European firms.
4.1.2. Method
Study 2 also uses the content analysis based on Leximancer. The first objective of Study 2 is to explore the themes of sustainability that all 24 firms’ sustainability reports covers. The second purpose is to compare the concepts generated by the sustainability reports in terms of being listed, the region, and whether the firm is an MNE. The linkages (count and likelihood) between two concepts are also calculated. Before procceding to the analysis, the figures and the tables in the reports were excluded.
For the comparative analysis, we need to take into account the different quantities of text each report contain. Therefore, this must be adjusted before comparing the firms based on the categories (region, listed, MNE). To control this, a prominence index is calculated and applied [131,140].
The prominence index is defined as follows:
The Prominence score uses Bayesian statistics, where the scores are absolute measures of correlation between categories and attributes. They can be used for comparisons over categoy.
“Here, P(C) is the probability of a text block being coded as a specific concept, while P(T) is the probability of a text block being coded as a specific category (the categories in this study are region, listed, and MNE). Then, P(C and T) is the actual probability of a text block being coded as both the concept and the category (region, listed, and MNE) (i.e., the co-occurrence)”.
“The PI is the Bayes factor for the null hypothesis that there is no correlation between the coding of a text block as a concept and a category. If there is no correlation between the two, then the expected probability of their co-occurrence is the product of the probability of the concept occurring in the text and the probability of the text occurring in the category. In this case the Prominence Index (PI) is 1” [131,140].
If PI is less than one, the concept and the category have negative correlation. If PI is greater than one, there is a positive correlation between the concept and the category. Values greater than two indicate a noteworthy degree of prominence. Then, values greater than six indicate a strong correlation between the concept and category [140].
4.2. Results
4.2.1. Concept Generation in Textile and Apparel 24 Companies
Nine themes were generated by Leximancer. The first theme focuses on the procurement process and manufacturing phase within the supply chain, and is linked to production concepts such as material and water. The second theme is environmental, but its constituent concepts suggest that it is more linked to the social dimension (health and safety), and that the environmental and social dimensions are usually considered together. The environmental dimension emerges in the seventh theme as the concept of emissions. The social dimension emerges in the third theme as the managerial concepts of human rights and training, in the fourth theme as operational concepts, and in the sixth theme as employee-related concepts. Although relatively small, there are some financial concepts that may be considered part of the economic performance dimension. The following Table 9 shows the themes in decreasing order of connectivity, which indicates the relative importance of a theme.
Similar to study 1, water and quality are the key concepts describing the environmental theme. Financial concept is explicitly mentioned because GRI, the guidline of sustainability reporting, has been encouraging inclusion of financial performance along with environmental and social dimensions. This shows that the sustainability report is progressing towards integrated reports [94]. The results also suggest that the sustainability report includes the firm’s current status and actions on sustainability and that the sustainability report is an important publication that describes sustainability performance.
4.2.2. Prominence Index by Region, Listing, and MNE
Regional comparison is provided because a firm’s perception on and attitudes toward sustainability may depend on the national economic status and corporate culture which vary from region to region. These differences can eventually lead to effective research by focusing on themes that are more effective on particular regions. The comparison is based on theoretical sampling perspective that ensures certain degree of accuracy in application of a theory.
Listing comparison is provided because sustainability reports are publications targeted at external stakeholders and the range of external stakeholders differ for firms that are listed and that are not listed. Lastly, MNE comparison is provided because textile and apparel industry frequently outsources globally and major themes of SSCM (e.g., location of facility, transportation, safety and rights of employees) are directly related to MNE [87].
Based on the categories (region, listing and MNE), the 10 concepts with the highest prominence index were deduced. For the regional category, there is no concept within Asia that has PI (Prominence index) with two or above, while Europe has two concepts with a relatively high prominence index: service (2.2) and customers (2.0). In North America, the following are prominent concepts: sewing (5.2), program (4.7), factories (3.9), impact (2.6), sustainability (2.3), business (2.2) and employees (2.0). The listing category contains no concepts with a strong prominence index for listed firms, while the concepts of customer, service, and sustainability possess strong prominence index values for firms that are not listed. The MNE category does not differentiate the concepts, as all concepts have a prominence index below two for both types (MNE/no-MNE).
The concepts that exhibited positive relationships, regardless of the categories, were employee, environment, management and products (Table 10).
The reason for the weak prominence indices is that the concepts are analyzed individually under the assumption that these could be added together linearly to characterize the text. However, the words and concepts cannot be viewed as a linear sum. They are nonlinearly related for each category, because they mutually interact and are interdependent [131]. It is possible to tackle this issue by comparing the prominence index of compound concepts in each category. Examining compound concepts can resolve the potential error/uncertainty that may arise when analyzing a single concept. For example, the concept of factories may refer to eco-friendly production in the manufacturing phase or safety/rights in the workplace from employee perspective.
4.2.3. Prominence Index of Compound Concept
Consequently, we analyzed compound concepts in order to determine mutual relationships of words and concepts that are not easily identified from a single concept. Table 11 and Table 12 show the 10 pairs of concepts with the highest prominence index for the three categories considered. The sustainability reports of the listed firms have more distinct concepts related to the environmental and social dimension than do firms that are not listed. These distinct concepts also exhibit a high PI (safety and health, environmental and social, management and risk, environmental and reduce, employees and training). The sustainability reports of MNEs have greater PI values for pairs involving water (water and energy: 15.6; water and quality: 12.4), while Non-MNEs have greater PI values for pairs involving waste (waste and textile, waste and reduce). Listed or MNEs reveal their requirement of managing risk as the concept of management and risk.
Compound concepts in regional categories indicate that firms in North America have very high PI values, where the compound concepts of the social dimension occur frequently (e.g., training, program, standards, worker, and employees interacting with other concepts). For firms in Europe, service concept pairs interact with other concepts such as customers, textile, brand, operations, impact, and products (Table 12, Table A2). Environmental dimension seems to be important among the top 10 compound concepts for Asia indicating Asian firms’ interest in establishing management and system to minimize negative environmental impacts. North American firms are interested in its employees in aspects such as optimization and standardization of sewing process.
Prominence index is a cardinal measurement of the correlation between categories and attributes as a specific concept and therefore the figure can be analyzed literally. Environmental and social compound concepts in North America are likely to appear more frequently than those of other regions although their ranking within North American compound concepts are low. However, some researchers consider PI of larger than 6 as merely “very lage value” and analyze the ranks within a specific category [131,140]. (Appendix shows the concepts used in deriving PI and application of PI).
5. Study 3
5.1. Method
5.1.1. Sample
Whereas Study 1 analyzed news articles to determine the direction and amount of information distributed to the public on SSCM in the textile and apparel industry, Study 2 analyzed the themes emphasized by these firms within the industry and whether the emphasis differs depending on three categories (listed, MNE, and region). In Study 3, the strategic nature of the organizational rhetoric on sustainability is determined by analyzing the CEO letters of the sustainability reports, which indicate the strategic positioning of a firm towards customers, stockholders, and other stakeholders [12]. This is because a CEO letter can be used to determine a firm’s interest and strength of intention toward sustainability, the extent of sharing these interests and intentions with stakeholders (e.g., employees and customers), agreements with internal stakeholders, the perception of reality by the firm, execution capability of the firm, and consequently the feasibility of the firm’s strategy. Therefore, the 73 CEO letters were analyzed. Of the 73 letters, 36 are from listed firms while 37are from firms that are not listed, 34 are from MNEs, while 39 are from non-MNE, and 22 are from Asian firms, while 19 are from North American firms, and 32 are from European firms. These firms were selected from the samples of study 2 whose sustainability report contained a CEO letter.
5.1.2. Method
We used DICTION as the text mining tool. DICTION is a dictionary-based computerized content analysis program frequently used as a content analysis tool for researching semantics of different data (especially in the field of communication and politics, and recently, extended to annual reports) [141]. DICTION is based on linguistic theory and uses 33 different dictionaries. DICTION uses its algorithms and statistical weighting procedures on passages to calculate the scores for a theme/variable [142]. DICTION allows the quantitative analysis of qualitative material [143,144].
Dictionary-based content analyses including DICTION have pros and cons. There are criticisms that DICTION is a tool that is based on the assumption that frequently occurring words or sentences are important, and therefore, prevents an insightful and creative approach to the material [145]. However, it has a strength in that it allows for a reliable and systematic content analysis, without human prejudice [146]. In addition, the program is effective for identifying hidden implications in a language that may be difficult to discover, even for an experienced researcher. This is why we selected DICTION in this research to determine the rhetoric in the CEO letters.
We analyzed the rhetoric of the CEO letters based on five main semantic themes in DICTION. The five main semantic features are called master variables in DICTION, and include activity, optimism, certainty, realism, and commonality [94].
“Certainty measures languge that indicates resoluteness, inflexibility and completeness, optimism measures language that endorses some person, group, concept or event or highlighting their positive entailments, activity measures language that features movement, change, the implementation of ideas and the avoidance of inertia, realilsm measures language that describes tangible, immediate, recognizable matters that affect people’s lives, and commonality measures language that highlights the agreed-upon values of a group and rejects idiosyncratic models of engagement”.[147]
More detaile definitions are available in Table A4.
The 73 CEO letters all have scores for the master variables. These scores are analyzed using ANCOVA and MANCOVA to determine whether there is a statistically significant difference among the means for the different categories (region, listed, and MNE).
5.1.3. Result
The means and standard deviations of the five master variables of DICTION’s construct do not seem to differ greatly (Table A5). Therefore, in order to analyze significant differences in the means and standard deviations for the three categories, a one-way multivariate analysis covariance (MANCOVA) was conducted. There are five dependent variables (certainty, optimism, activity, realism, and commonality) and three independent variables (listed, region, and MNE). Because the word count may differ among the data, they were included as covariates [143,148]
The MANCOVA results indicate that a statistically significant difference in means is observed for listed firms as the independent variable. A summary of the significance levels and partial eta-squared statistics are described in Table 13. The partial eta squared explains the extent to which the independent variables explain the changes in the dependent variables. A larger value (maximum is 1) means that the independent variables explain the changes in the dependent variables well. The results in Table 13 indicate that there is a statistical difference between the dependent variables of listed firms and firms that are not listed (Wilk’s Λ = 0.807, F (5, 66) = 3.154, p < 0.05). Therefore, we may reject the null hypothesis that the rhetoric of CEO letters expressed in the five master variables is the same for both types of firms. For other independent variables, the results were not statistically significant.
To further analyze the MANCOVA results, an ANCOVA was conducted for each dependent variable. There were statistically significant cases when the independent variables were either listed or by region, where realism and commonality were found to have significant differences among the five variables. The realism score of listed firms is lower than that of firms not listed, while the commonality score of listed firms is higher than that of firms not listed. For the region independent variable, the realism and the commonality and were observed to have a significant difference, where Europe had the highest score, followed by North America, and then Asia in realism, and North America had the highest score, followed by Asia, and then Europe in commonality. The means, univariate F-tests, partial eta squared, and observed power are provided in Table 14 and Table 15.
6. Discussion
6.1. Convenience and Usefulness of Leximancer and DICTION
Two computer-based text mining programs were used for this research: Leximancer, which is based on frequency and co-occurrence, and DICTION, which is based on the dictionary. Leximancer provides excellent methodological reliability; it is based on co-occurrence information and exhibits natural language in semantic patterns. Leximancer utilizes unsupervised learning, and generates information on simultaneous occurrences in two stages, based on semantic and relational methods, thereby ensuring methodological reliability. Leximancer ensures inter-coder reliability in category generation in comparison with manual coding methods, and also ensures reproducibility, with the same results being produced given the same data [120,123]. Furthermore, it reduces the time required for analysis, while achieving methodological rigor [149]. A grounded approach of leximancer also allows for exploratory research, regardless of the research target [127]. Leximancer is a representative methodology among the ever-evolving computer-assisted content analysis methods. While it may be criticized for being messy, it can contribute significantly to exploratory research, as a productive, open and truthful methodology [120,150].
DICTION is an effective methodology for text mining research involving the comparison and continuity of two or more data groups. The DICTION program treats homographs by using statistical weighting, in order to partially account for the context of the words [146]. Since DICTION conducts analysis based on preset rules, it can minimize researcher subjectivity and biases. This methodology is also highly useful for strategic management research, as it can relate the narratives of executive management, the organization’s strategic direction, and performance by means of analysis [151].
6.2. Implication of News Data Analysis for SSCM
There has been an increase in the yearly number of news articles containing the keywords “sustainability” and “supply chain” in textile and apparel industry, is increasing, which indicates growing awareness of both society and businesses about sustainability and SSCM. Each news piece consists of 1087–1480 words, and while the theme indicates the most prominent concept among its constituent concepts, researchers can also interpret it in their manner, as a topic that is the most similar and close to the characteristics of the group of concepts. The perspective of the supply chain suggests that the product (number 1) and factories (number 7) themes emphasize manufacturing aspect. The fashion theme (number 4) emphasizes the role of the consumer, while retailer theme (number 6) emphasizee the consumer interface: retail side (Table 16). The most representative texts of theme number 6 are:
“Instead of passing on the pain, the co-operative could have pulled its suppliers closer at an earlier stage to manage pricing more effectively and look for ways to achieve efficiencies in areas such as logistics and packaging. It could also have used its industry clout to lobby supermarkets and government, and make the public aware of the price pressures facing the industry.”
“A low carbon category could even afford retailers and suppliers an opportunity to charge a premium for products that will reduce carbon footprints significantly, as consumers, retailers and suppliers all have a stake in the future of the planet, and higher prices could be easily and clearly justified. Carbon footprint labels can then also be used to build up retailer brands and create loyalty.”
These texts highlight the notion that consumers and retailers should accept higher prices as a result of environmental endeavors and changes in the market.
News articles also exhibit the TBL structure of sustainability. While there may be exceptions, environmental related themes have emerged since 2009, while ethical issues in the social dimension, such as factories and workers, have been discussed from 2013 onwards (Figure 1).
The phenomenon of both environmental and social concepts occuring concurrently in news indicates that the two axes resemble two sides of the sustainability coin, which is also perceived by the public as representing the key dimensions of sustainability. Ethical issues emerge as concepts related to both environmental and social dimensions, and indicating that these could be the leading sustainability theme. Although there is no concept that can directly estimate the economic dimension, concepts such as prices and costs, as well as each dimension’s performance, have been debated. The results did not exhibit concepts relating to survival, which may be due to the nature of news as being supposed to deliver facts, while the concept of survival is likely to involve subjective author expressions. Instead, the more neutral concept of growth was deduced as that which links to the social concept. It is worth observing that the nature of the fashion industry is demonstrated in the results, as ethics emerges as the concept constituting the fashion theme, along with concepts of fashion and brand. Ethics can be interpreted as firms’ emphasis on both an ethical work environment and ethical consumer roles.
In the supply chain context, manufacturing processes have the highes number of important (in terms of frequency and co-occurrence) concepts, indicating that manufacturing processes include the most theme raised as issues. The concepts of countries, world, global, and trade indicate that textile and apparel industry SSCM is a global issue. Topics that were emphasized in the literature review but did not emerge frequently in news were ISO 14001, ISO 26000, reverse logistics, and the issue of collaboration.
There are attempts to identify the relationship between SSCM and economic performance in the academic literature, while the concepts do not appear explicitly in the news. It is important to identify a variable that the business field would be interested in and agree on its importance from many independent variables that affect performance. The themes that are emphasized in the news can provide a hint. Examples include sustainability related variables in manufacturing process, effect of organization’s response to environmental activities and social activities (with varying degrees of strength) on performance, and the effect of the role of supplier, retailer and customers on performance.
Castka and Balzarova’s research is a unique one that studies mutual synergy and complementary relationship between CSR and ISO 26000 [76], as there are only a few researches that study quality management in the context of SSCM and CSR. Quality and CSM has similar evolution pattern, where interest and confidence in CSR will positively impact quality management. In fact, CSR can help the firm to naturally develop quality management that ultimately evolves into SSCM. The future prospective research topics on CSR and quality management may include sustainability, price and cost, factory location, location of primary target market and time to market. It is important to highlight that the literature should focus on setting of practical independent variable and collection of corresponding data rather than maintaining data driven researches driven by existing data.
6.3. Implications of Sustainability Reports Analysis for SSCM
The first sustainability report finding is that, as in the case of news media, the environmental and social dimensions of the TBL tend to be discussed together as a major theme. While the literal words “environmental” and “social” co-occurred frequently in news media, there were also frequent co-occurrences of social related concepts and environmental related concepts in the sustainability reports. Therefore, it is essential to identify the differences between the results of sustainability reports and those of the news media. The following two representative texts in sustainability reports have been extracted for this purpose:
“Bronze indicates full compliance with NIKE Code of Conduct and adherence to the 227 requirements in the Code Leadership Standards (CLS) as measured by our health, safety and environment and labor tools (available online)”.
“In FY2013, in the area of safety and disaster prevention, we performed detailed investigations into the background and causes for accidents involving fires by explosions at another company’s plants and we shared issues for improvement and preventive measures among our factories. We also completed the introduction of Emergency Call, a system to confirm the safety of employees in the event of natural disasters and started reviewing the BCP”.
Since Leximancer sets a text block consisting of a sentence or two for counting, the first text shows that mere listing of indices, including environmental and social indices, contributes towards count for the sustainability report analysis. Such a case of co-occurrence of the environmental and social dimension is not so meaningful.
In the case of the second text, it can be seen that the health, safety, and training of employees in the midst of their physical environment (transportation and factories) is discussed. More specifically, it describes the deployment of a system for employee safety in the case of fire, which means that the text belongs to the social dimension. These two texts indicate that although it requires more time, additional consideration is necessary to analyze the co-occurrences generated by Leximancer one by one, in order to generalize specific findings.
Sustainability report, similar to news data, indicates importance of water concept. This means that the academia should consider ways to bring the concept into the future research. The report describes water as follows:
“Cotton cultivation and manufacture uses huge amounts of water. We need to innovate our way out of water usage and start looking at other aterials”.
“The life-cycle analysis showed that manufacturing accounts for a relatively small percentage of the water consumed during the life of a pair of jeans. Almost half of the water used during the life-cycle of its jeans is used during cotton production and 95% of Levi's products use cotton”.
“One way it is saving water in the supply chain, for instance, is by backing the Better Cotton Initiative, which promotes farming that reduces water use”. This study proves that the textile industry is creating water pollution all around the globe”.
Therefore, future research should include technology perspective where process improvement to reduce water usage is discussed and organizational perspective where the impact of such system on organizational management is studied. Furthermore, the effects of process improvement on product’s competitiveness can be studied in the perspective of price and marketing (e.g., environment-friendly activity). The latter may also include the brand image and performance.
The results of the prominence index (PI) measured from a single concept show that, in North America, the PIs of factories and employees are high, and the social dimension is emphasized, while the PI was weakest for Asia. Compound concept analysis suggests that regional differences are more explicit, as Asia emphasizes environmental and management aspects, North America emphasizes the social dimension, and Europe emphasizes customer aspects. The second implication of the compound concepts is that risk management is emphasized for firms that are listed and those that are MNEs. This is because listed firms have a wider range of stakeholders than their counterparts and therefore explicitly notify their management activities, which may have contributed to the sustainability reports’ focus on risk management. In terms of MNE firms, their inception was motivated by cost reduction and market expansion on global scale, which means that they are more likely to focus on environmental and social aspects of production processes, where managing the associated environmental and social risks is significant.
The comparison results of study 2 suggests the following directions for future research. Adoption of technologies to minimize environmental impact, and relationship between organizational management style and business performance would be meaningful for researching Asian firms in the perspective of SSCM. For North America, researches on economic and environmental performance focusing on variables such as employees, factories, work environment, process standardization and training program would be useful. Researches on the role of customers, value of brand and consideration of SSCM in service perspective would be valuable for European context. Finally, in-depth study on risk management, emphasized by listed firms and MNEs, is necessary. Qualitatively, what risk management systems are operated for successful SSCM and how it can be formalized, and how is it related to firm performance?
Regarding MNEs, the academia should collaborate with engineering and managment to identify the reason for the occurrence of water as a compound concept for MNEs and waste as a compound concept for non-MNEs.
6.4. CEO Letter in Sustainability Report Rhetoric
The five master variables of CEO letter rhetoric measure different characteristics, as follows. Certainty measures the resoluteness and completeness of a firm’s motivation and interests in sustainability; optimism measures the extent of the positivity of a firm’s culture and atmosphere; activity measures movement and changes for executing sustainability; realism measures the feasibility and tangibility of the firm’s sustainability plan and the interest on everyday lives; and commonality measures the degree of agreement by internal stakeholders about sustainability values.
Managers must make decisions to resolve issues that organizations face under uncertainty and risks, and endeavor to reduce uncertainty and acquire sufficient information [152]. According to Isabella and Waddock(1994), increase in certainty of business enhances management confidence which leads to better performanace and higher profits [153]. Optimisim is a positive component of a firm and it is the firm’s communication of the news on sustainability-related activities in confident tone [154]. It must be assumed that optimism is related to the positive tone of the organization towards sustainability implementation and performance, which means that sincerity must be accompanied in the process [155]. When this assumption holds, optimism can predict the future performance of a firm [155]. By measuring realism, we can determine whether a company has a tangible plan or an immediate perception of an employee's daily life. A firm with a high realism score is likely to gain high reputation [156]. Commonality is based on approximation of the communitarian concepts by Etzioni (1999) [151,157]. It is used as strategic discourses by leader’s communitarian characterizations in organizations such as joint ventures. Commonality shows leader’s plain and depersonalized style and implements a perception that the leader can collaborate with any organization [151,158]. By suggesting that the employees are all common members of a single community [159], the employees can expect that sustainability performance will not benefit only a few organizations but allocated fairly. Isomorphism is a similar concept discussed in organizational field where organization shows unified and monolithic response to uncertainty when it is institutionalized [160,161,162]. However, it is different in that commonality is based on leader’s depersonalized style.
The results of study 3 indicate, that listed firms exhibit a lower degree of realism than their counterparts, which is due to the fact that their CEO letter may consider external stakeholders, concentrate on their sustainability strategic plan, and and not focus on employees’ everyday life. Commonality, however, is higher for listed firms, which indicates that their internal stakeholders perceive and share the value of sustainability, and thus is easier for these firms execute sustainability strategies.
The region category results suggest that North America possess a stronger execution capability as it has a higher degree of commonality, and Europe is expected to execute tangible sustainability plans and to immediately respond to sustainability TBL framework (e.g., human rights and safety of employees) as it has a higher degree of realism. In addition, Europe is more likely to meet social goals and gain better reputation.
Firms that have high commonality scores (listed or North America) may face less opposition in adoption/execution of sustainability related institutions as employees perceive themselves as common members in a single community, which means that new system is more likely to be stabilized quickly. Furthermore, if those firms share common values on allocation, the firms will be able to acquire very good execution abilities. Firms that have high realism score (No-listed or Europe) immediately discuss everyday matters in the organization. In addition, firms with better reputation has higher realism score [156].
Although number of samples limit the findings to be generalized, more samples across diverse industry sectors will deduce significant implications. The findings of studies 2 and 3 can be summarized as shown in Table 17.
However one may challenge the veracity of the contents of the CEO letter and the validity of the analysis that deduces scores based on the literal data. There are two different perspectives on sustainability reporting related to this challenge: accountability perspective and impression management perspective [94]. Accountability perspective includes appropriate management of resources and responsibility to accurately provide firm’s activities and status to stakeholders [163]. GRI guideline is based on accountability perspective and therefore the rhetoric scores from CEO letter is considered to be veracious and transparent.
In the impression management perspective, however, sustainability report is a tool to justify firm’s operation [164] which suggests that good contents of sustainability reports are exaggerated and negative actions in real case can be concealed. In this case, the scores of certainty, activity, optimism, realism and commonality are considered to be exaggerated.
A firm engages in proactive strategy for positive actions and reactive strategy for negative actions for impression management, where proactive strategy may significantly increase scores of certainty, activity and optimism. Considering the timeline of activity and reporting, there are two types of reporting that can affect veracity of sustainability reporting. The first is exaggerating and concealing past activities and the second is expressing aggressively or with over confidence the future plans. Since the CEO letter of sustainability report represents mainly the performance of sustainability in that year, it does not refer to a specific future strategy or plan. It is not common for firms to avoid what they initially planned to do or to take strategic ambiguity. Therefore, distortion would most likely be the first type, where certainty is expressed when the reality is uncertain or action is pretended when there was no activity or optimism is feigned when the future is not optimistic.
But the recent sustainability reports and CEO statements can be considered to be veracious and transparent to a certain degree for the reasons that are listed in the subsequent paragraphs, and therefore leading to validity of the analysis.
First, GRI guideline has been enhancing in accountability perspective. Second, sustainability report is not a temporary publication but an annual publication that is shared regularly, which makes it difficult to distort by impression management. Third, sustainability report is becoming an integrated report that includes environmental, social, financial information and CEO letter. It is also considered to be matured since 2010. Although CEO letters of sustainability report is liable to errors due to changes in CEO, writing by different PR directors and translation of CEO letter for non-English company [94], it is an important qualitative data that enables quantification of sustainability performance.
6.5. Revised SSCM Research Map
The results can be used to revise initial SSCM research map (Figure 1) as depicted in Figure 5. The figure adds concepts emphasized in news and sustainability report as bold italic text and oval. For the concepts that are emaphsized in both literature review and the pratical data, they are emaphsized with rectangle. For concepts with regional emaphsis, letters have been added (Asia: A, North America: N, Europe: E), while listed firms’ emphasis have letter L and MNEs’ emphasis have letter M.
7. Conclusions
This research is an exploratory study based on text mining, which examines and analyzes the topic of SSCM in the textile and apparel industry using a wide variety of text data (including news and sustainability reports). We examined the SSCM trend in news articles as publicly shared messages, as well as the various firms’ strategic positioning and execution of sustainability based on sustainability reports. Furthermore, we analyzed the rhetoric of CEO letters in sustainability reports to determine firms’ resoluteness, positive entailments, sharing of values, perception of reality, and sustainability feasibility.
Overall, certain contents overlapped with the literature review, however, discussions on regulation, green incentives, economic performance, and international standards (e.g., ISO) were not readily discovered.
The relationship between economic performance and sustainable supply chain activities, identification of SSCM activities and measurement of SSCM performance are research topics actively studied in academia but deserves more attention from managers in practice. Managers should look into topics such as definition and collection of data generated by the processes of supply chain, the relationship between the data and sustainability, measurement of data, enhancing reliability of data, and use of generated data. This is because firm’s value will be evaluated, in the near future, by financial performance and firm’s activities in processes of SSCM.
In contrast, ethical issues in social dimensions, SCM manufacturing perspectives, and the role of customers were well covered in the literature review as well as news and reports. Ethical issues related to employees should be highlighted in the textile and apparel industries in North America. In addition, consideration should be given to the characteristics of input materials and manufacturing stages. For Europe, more consideration on the role of customers is required across whole value chain with brand image and eco-fashion consumption.
Themes related to water and quality are more emphasized in news and sustainability report than in the literature review. Water-related issues are emphasized in the practical field, but it is rarely treated independently in the academia. This may be because water-related issues usually accompany reviews of technology characteristics and/or production processes. In this context, the research described in the literature review on measurement of SSCM performance of biomass can provide guidance to future research directions because it considers technical characteristics and comprehensively evaluates their impact on production processes and sustainability [80].
Quality also deserves attention from both practice and academia in the fields of SSCM, CSR and ISO. There is a need to segment approaches in more detail while developing practically feasible activites. Quality is an important issue regardless of the type of the firm (MNE or listed). Especially in inter-firm relationships, buyer asks suppliers, which are mostly SMEs, for SSCM performance. As suppliers need to satisfy buyers, meeting the level of quality buyer demands is an essential and minimum requirement for sustainability activities of SMEs. Quality is a key performance index that the supplier must satisfy and a key indicator that meets goals of SSCM and CSR in more comprehensive view. In textile and apparel industry where there are resource limitations and is more likely to have small suppliers, quality is even more important.
The CEO letter analysis indicates that listed firms exhibit relatively low realism and high commonality, and that North American firms show a relatively high commonality, and Europe firms show a relatively high realism. CEO letter is a qualitative data and it can be used in impression management, and therefore is subject to error when analyzing. However, it can be a good complement for traditional SSCM performance measurement which quantitatively measures performance. Especially, as the five master variables used in this research are based on theory and provides managerial implications, it can be a good indicator that predicts direction of sustainability of a firm, its execution, its feasibility and its performance.
Topics emphasized in the literature review but not generated in sustainability news and reports may have been excluded for the following reasons. First, there may be limitations to the research methodology; second, news agencies may have determined the topics based on public interest and policy influence; third, firms may have purposely omitted the topics, as they were not an important for their communication strategy; and lastly, firms may have unintentionally omitted the topics. An academia should take into account the second and the third reasons in future research, while firms should consider the fourth reason in their sustainability strategies and execution thereof.
However, certain limitations exist, and future research may be necessary to overcome these shortcomings. The first limitation lies in the collection of news data. The keywords used for filtering news were “sustainability” and “supply chain”, however, news media may cover the theme of sustainability without containing these two keywords. Sampling limitations compelled the researchers to exclude such cases from the study.
The second limitation is firm classification. It was challenging to distinguish firms with a manufacturing focus from those with a retail focus using the classification scheme provided by Lexis-Nexis News DB. It is also difficult to make such a classification in practice, as most firms are a mixture of both categories. This limitation is also evident in studies 2 and 3. Since corporate culture and supply chain relationships differ between firms creating textile materials and those making complete fashion products, firm classification must also take this into account. Future research is therefore required to investigate this aspect and include the comparisons among different firm categories, research on modeling based on quantitative data, and detailed case studies that can be applied to the field.
The final limitation is that of tools, where Leximancer determines the theme as the most prominent concept among the group of concepts generated. As noted in previous sections, this may erroneously determine a linkage between two concepts when the sentence merely lists possible concepts. In the future, researchers will need to review the sentences one by one and rectify the errors. There also exists a technical limitation in DICTION, as it is not able to analyze precisely the double negatives, but counts these as a double pessimistic indication rather than the actual intent (positive). Furthermore, there are limitations to the content analysis methodologies themselves. While computer-based content analysis was used, it was difficult to draw generalized conclusions from unstructured data analysis. To do this, quantitative modeling, based on quantitative data is required in the future. Despite the limitations of this research, a contribution is made by providing a macroscopic image of sustainability and SCM topics that are discussed and/or should be discussed, based on a wide range of data. This can provide a baseline for academia to complement its endeavors in SSCM research, as well as an opportunity for businesses to consider additional aspects in their sustainability strategies and executions.
Acknowledgments
This research was supported by the MSIP (Ministry of Science, ICT and Future Planning), Korea, under the ITRC (Information Technology Research Center) support program (IITP-2017-2014-0-00639) supervised by the IITP (Institute for Information and communications Technology Promotion).
Author Contributions
Sungbum Kim designed the overall framework of the research, conducted literature review and drafted the manuscript. Dongwook Kim collected the data, analyzed the data and reviewed the draft. All authors read the final manuscript and approved it for final submission.
Conflicts of Interest
The authors declare no conflict of interest.
Appendix A

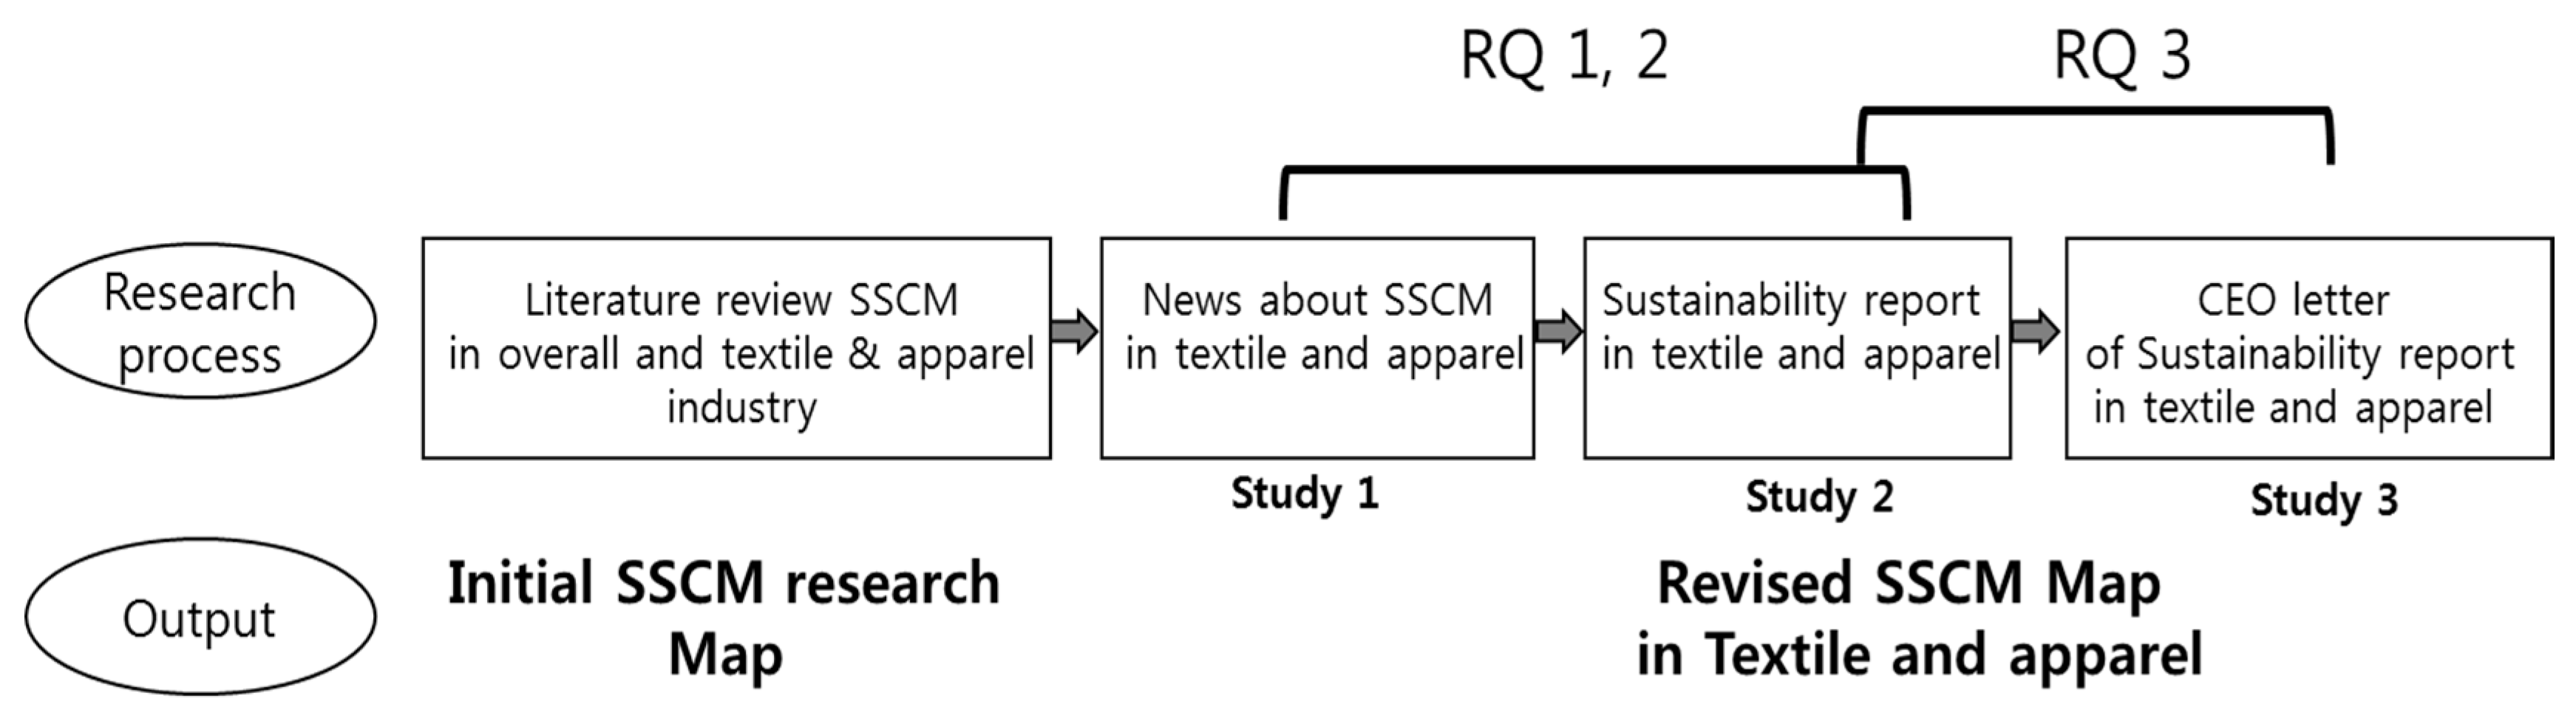
Table A1.
Concept count and relevance in news data.
| # | Concept | Count | Relevance | # | Concept | Count | Relevance |
|---|---|---|---|---|---|---|---|
| 1 | products | 965 | 22% | 21 | price | 356 | 8% |
| 2 | sustainability | 874 | 20% | 22 | management | 349 | 8% |
| 3 | supply | 827 | 19% | 23 | environmental | 338 | 8% |
| 4 | use | 794 | 18% | 24 | suppliers | 338 | 8% |
| 5 | fashion | 794 | 18% | 25 | cotton | 331 | 8% |
| 6 | industry | 777 | 18% | 26 | report | 319 | 7% |
| 7 | brands | 679 | 16% | 27 | cost | 316 | 7% |
| 8 | clothing | 588 | 14% | 28 | customers | 310 | 7% |
| 9 | factories | 533 | 12% | 29 | countries | 306 | 7% |
| 100 | workers | 494 | 11% | 30 | process | 302 | 7% |
| 11 | retailers | 494 | 11% | 31 | world | 302 | 7% |
| 12 | need | 471 | 11% | 32 | materials | 296 | 7% |
| 13 | consumers | 457 | 11% | 33 | social | 281 | 7% |
| 14 | development | 441 | 10% | 34 | global | 280 | 7% |
| 15 | ethical | 435 | 10% | 35 | technology | 271 | 6% |
| 16 | design | 418 | 10% | 36 | garment | 267 | 6% |
| 17 | change | 382 | 9% | 37 | trade | 244 | 6% |
| 18 | people | 381 | 9% | 38 | quality | 231 | 5% |
| 19 | manufacturing | 375 | 9% | 39 | local | 217 | 5% |
| 20 | chemical | 357 | 8% | 40 | green | 217 | 5% |
Table A2.
Prominence Index of Compound concept by region, listing, and MNE (Full data version).
| Category | Region | Listing | MNE | |||||
|---|---|---|---|---|---|---|---|---|
| Compound Concept | Asia | Europe | North-Am | Listed | No-Listed Listinglisted | MNE | No-MNE | |
| business and global | 16.3 | 12.1 | 24.3 | |||||
| business and sustainability | 16.5 | |||||||
| customers and development | 15.4 | 15.1 | ||||||
| customers and operations | 16.9 | 16.4 | ||||||
| customers and quality | 15.0 | 15.3 | ||||||
| customers and sustainability | 16.7 | |||||||
| customers and value | 13.6 | |||||||
| emissions and reducing | 30.0 | |||||||
| employees and facilities | 16.1 | |||||||
| employees and facility | 17.9 | |||||||
| employees and program | 14.4 | |||||||
| employees and support | 10.0 | |||||||
| employees and training | 10.2 | 17.4 | 10.9 | 17.1 | ||||
| environmental and global | 11.4 | |||||||
| environmental and impact | 29.1 | 30.5 | ||||||
| environmental and performance | 9.8 | 10.9 | 15.9 | |||||
| environmental and reduce | 19.0 | 22.4 | ||||||
| environmental and reducing | 16.8 | |||||||
| environmental and social | 24.2 | 22.6 | 64.8 | 28.7 | 26.8 | 33.4 | 25.7 | |
| environmental and standards | 10.0 | |||||||
| factories and industry | 59.5 | |||||||
| factories and manufacturing | 118.4 | |||||||
| factories and standards | 60.9 | |||||||
| factories and workers | 240.9 | |||||||
| health and environment | 16.4 | |||||||
| health and human | 13.8 | |||||||
| health and quality | 14.9 | |||||||
| health and rights | 14.7 | |||||||
| impact and chain | 58.0 | |||||||
| impact and environmental | 60.7 | |||||||
| improve and performance | 12.9 | |||||||
| improve and quality | 12.4 | |||||||
| management and corporate | 14.3 | |||||||
| management and quality | 11.6 | |||||||
| management and risk | 19.3 | 20.7 | 12.1 | 21.6 | ||||
| management and system | 11.8 | |||||||
| management and team | 15.4 | |||||||
| materials and manufacturing | 16.6 | 11.4 | ||||||
| materials and process | 13.9 | |||||||
| materials and products | 10.1 | |||||||
| operations and local | 10.6 | 24.1 | ||||||
| operations and rights | 15.7 | |||||||
| operations and service | 16.1 | |||||||
| products and brand | 16.8 | 13.3 | ||||||
| products and manufacturing | 13.7 | 13.5 | 15.5 | |||||
| products and quality | 15.9 | 17.7 | 13.9 | 18.0 | ||||
| products and service | 14.4 | 17.9 | ||||||
| products and textile | 17.2 | |||||||
| program and factories | 54.9 | |||||||
| program and improve | 53.5 | |||||||
| program and support | 53.7 | |||||||
| program and training | 80.2 | |||||||
| program and workers | 60.3 | |||||||
| safety and environment | 16.1 | 16.5 | ||||||
| safety and health | 116.0 | |||||||
| safety and human | 14.1 | |||||||
| safety and quality | 14.4 | 13.6 | ||||||
| safety and rights | 15.1 | |||||||
| safety and workers | 13.6 | |||||||
| service and brand | 22.4 | 21.9 | ||||||
| service and customers | 49.2 | 51.1 | ||||||
| service and development | 14.5 | 16.2 | ||||||
| service and impact | 21.8 | |||||||
| service and improve | 13.8 | |||||||
| service and operations | 22.0 | 18.8 | ||||||
| service and products | 19.8 | 23.6 | ||||||
| service and quality | 17.6 | |||||||
| service and textile | 48.3 | 54.9 | ||||||
| sewing and brand | 56.6 | |||||||
| sewing and employees | 79.1 | |||||||
| sewing and manufacturing | 69.9 | |||||||
| sewing and performance | 50.4 | |||||||
| sewing and program | 91.2 | |||||||
| sewing and system | 53.9 | |||||||
| sewing and textile | 162.1 | |||||||
| sewing and training | 95.7 | |||||||
| sustainability and business | 15.3 | 10.2 | ||||||
| sustainability and industry | 16.5 | |||||||
| sustainability and project | 13.9 | 15.4 | ||||||
| sustainability and social | 16.7 | 11.8 | ||||||
| system and facilities | 15.8 | |||||||
| system and management | 18.2 | 18.2 | ||||||
| system and quality | 12.6 | |||||||
| waste and manufacturing | 19.0 | |||||||
| waste and materials | 16.0 | 14.7 | ||||||
| waste and reduce | 14.3 | 25.8 | ||||||
| waste and textile | 39.2 | 36.3 | 32.8 | |||||
| waste and water | 17.8 | 15.9 | ||||||
| water and energy | 15.6 | |||||||
| water and industry | 9.8 | |||||||
| water and local | 10.6 | |||||||
| water and quality | 12.4 | |||||||
| water and waste | 11.1 | |||||||
Table A3.
Prominence Index by relative frequency and strength.
| Asia | Rel Freq. (%) 1 | Strength (%) 2 | PI 3 |
| emissions and reducing | <1 | 53 | 30.0 |
| environmental and impact | <1 | 42 | 29.1 |
| environmental and social | <1 | 41 | 24.2 |
| management and risk | <1 | 62 | 19.3 |
| system and management | <1 | 60 | 18.2 |
| Europe | Rel Freq. (%) | Strength (%) | PI |
| service and customers | <1 | 75 | 49.2 |
| service and textile | <1 | 94 | 48.3 |
| waste and textile | <1 | 91 | 39.2 |
| environmental and impact | <1 | 34 | 30.5 |
| environmental and social | <1 | 29 | 22.6 |
| North America | Rel Freq. (%) | Strength (%) | PI |
| factories and workers | <1 | 64 | 240.9 |
| sewing and textile | <1 | 88 | 162.1 |
| factories and manufacturing | <1 | 74 | 118.4 |
| sewing and training | <1 | 85 | 95.7 |
| sewing and program | <1 | 84 | 91.2 |
1 Relative Freq (%): a measure of the conditional probability of the Concept, given the Category, The frequency score is in fact a log scale; 2 Strength (%): a measure of the conditional probability of the Category, given the particular Concept; 3 PI: The Prominence score combines the Strength and Frequency scores using Bayesian statistics. Prominence scores are absolute measures of correlation between category and attribute.Prominence is given by joint probability/product of marginal probabilities. e.g., given the Attribute A and Category C, prominence is equal to (the co-occurrence count for A and C/total number of context blocks in data set)/(occurrence of A/number of context blocks) x (occurrence of C/number of context blocks).
Table A4.
Master variables definition and formula.
| Definition | Formula | |
|---|---|---|
| Certainty | Language indicating resoluteness, inflexibility and completeness | [Tenacity + Leveling + Collectives + Insistance] − [Numerical Terms + Ambivalence + Self Reference + Variety] |
| Optimism | Language endorsing some person, group, concept or event or highlighting their positive entailments | [Prasie + Satisfaction + Inspiration] − [Blame + Hardship + Denial] |
| Activity | Language featuring movement, change, the implementation of ideas and the avoidance of inertia | [Aggression + Accomplishment + Communication + Motion] − [Cognition + Passivity + Embellishment] |
| Realism | Tangible, immediate, recognizable matters that affect people’s lives | [Familiarity + Spatial Terms + Temporal Terms + Prsent Concern + Human Interest + Concreteness] − [Past Concern + Complexity] |
| Commonality | Highlights the agreed-upon values of a group and rejects idiosyncratic models of engagement | [Centrality + Cooperation + Rapport] − [Diversity + Exclusion + Liberation] |
Table A5.
Mean and Standard deviation comparison.
| Variable | Listed | No-Listed | MNE | No-MNE | Asia | North America | Europe |
|---|---|---|---|---|---|---|---|
| Certainty | |||||||
| Mean | 47.39 | 47.23 | 47.21 | 47.40 | 47.33 | 46.69 | 47.66 |
| SD | 2.47 | 2.86 | 3.29 | 1.99 | 3.10 | 1.83 | 2.75 |
| Optimism | |||||||
| Mean | 54.68 | 54.28 | 54.61 | 54.35 | 54.48 | 54.92 | 54.20 |
| SD | 2.18 | 2.24 | 2.40 | 2.05 | 3.08 | 1.66 | 1.75 |
| Activity | |||||||
| Mean | 50.27 | 50.96 | 50.93 | 50.34 | 50.49 | 50.26 | 50.91 |
| SD | 2.19 | 2.44 | 2.19 | 2.45 | 2.54 | 1.79 | 2.50 |
| Realism | |||||||
| Mean | 45.70 | 47.51 | 46.60 | 46.63 | 45.09 | 46.90 | 47.50 |
| SD | 1.95 | 3.36 | 2.20 | 3.40 | 1.85 | 2.16 | 3.44 |
| Commonality | |||||||
| Mean | 52.74 | 51.57 | 52.05 | 52.23 | 51.95 | 53.25 | 51.63 |
| SD | 2.25 | 2.22 | 2.46 | 2.17 | 2.06 | 2.38 | 2.24 |
| N | 36 | 37 | 34 | 39 | 22 | 19 | 32 |
References
- Kuhlman, T.; Farrington, J. What is sustainability? Sustainability 2010, 2, 3436–3448. [Google Scholar] [CrossRef]
- Wiersum, K.F. 200 years of sustainability in forestry: Lessons from history. Environ. Manag. 1995, 19, 321–329. [Google Scholar] [CrossRef]
- World commission on environment and development (WCED). Our Common Future; Oxford University Press: London, UK, 1987. [Google Scholar]
- Elkington, J. Towards the sustainable corporation: Win-win-win business strategies for sustainable development. Calif. Manag. Rev. 1994, 36, 90–100. [Google Scholar] [CrossRef]
- Carter, C.R.; Rogers, D.S. A framework of sustainable supply chain management: Moving toward new theory. Int. J. Phys. Distrib. Logist. Manag. 2008, 38, 360–387. [Google Scholar] [CrossRef]
- Ageron, B.; Gunasekaran, A.; Spalanzani, A. Sustainable supply management: An empirical study. Int. J. Prod. Econ. 2012, 140, 168–182. [Google Scholar] [CrossRef]
- Vachon, S.; Klassen, R.D. Extending green practices across the supply chain: The impact of upstream and downstream integration. Int. J. Oper. Prod. Manag. 2006, 26, 795–821. [Google Scholar] [CrossRef]
- Li, Y.; Zhao, X.; Shi, D.; Li, X. Governance of sustainable supply chains in the fast fashion industry. Eur. Manag. J. 2014, 32, 823–836. [Google Scholar] [CrossRef]
- Morana, R.; Seuring, S. A three level framework for closed-loop supply chain management—Linking society, chain and actor level. Sustainability 2011, 3, 678–691. [Google Scholar] [CrossRef]
- Boone, T.; Jayaraman, V.; Ganeshan, R. Editorial: Sustainable supply chains. In Sustainable Supply Chains: Models, Methods, and Public Policy Implications; Boone, T., Jayaraman, V., Ganeshan, R., Eds.; Springer New York: New York, NY, USA, 2012; pp. 1–8. [Google Scholar]
- Krause, D.R.; Vachon, S.; Klassen, R.D. Special topic forum on sustainable supply chain management: Introduction and reflections on the role of purchasing management. J. Supply Chain Manag. 2009, 45, 18–25. [Google Scholar] [CrossRef]
- Conrad, C.; Poole, M.S. Strategic Organizational Communication in a Global Economy, 6th ed.; Thomson Wadsworth: Belmont, CA, USA, 2005. [Google Scholar]
- Waas, T.; Hugé, J.; Block, T.; Wright, T.; Benitez-Capistros, F.; Verbruggen, A. Sustainability assessment and indicators: Tools in a decision-making strategy for sustainable development. Sustainability 2014, 6, 5512–5534. [Google Scholar] [CrossRef]
- Shen, B. Sustainable fashion supply chain: Lessons from h&m. Sustainability 2014, 6, 6236–6249. [Google Scholar]
- Elkington, J.; Henriques, A.; Richardson, J. Enter the triple bottom line. In The Triple Bottom Line: Does It All Add Up? Henriques, A., Richardson, J., Eds.; Earthscan: London, UK, 2004; pp. 1–16. [Google Scholar]
- Smith, M. Business sustainability and the triple bottom line: Considering the interrelationships of people, profit, and planet. In Learner-Centered Teaching Activities for Environmental and Sustainability Studies; Springer International Publishing: Cham, Switzerland, 2016; pp. 181–186. [Google Scholar]
- Rothaus, R. Return on sustainability: Workforce housing for people, planet and profit. Eng. Min. J. 2013, 214, 88–91. [Google Scholar]
- Lazzarini, S.; Chaddad, F.; Cook, M. Integrating supply chain and network analyses: The study of netchains. J. Chain Netw. Sci. 2001, 1, 7–22. [Google Scholar] [CrossRef]
- Lambert, D.M.; Cooper, M.C.; Pagh, J.D. Supply chain management: Implementation issues and research opportunities. Int. J. Logist. Manag. 1998, 9, 1–20. [Google Scholar] [CrossRef]
- Linton, J.D.; Klassen, R.; Jayaraman, V. Sustainable supply chains: An introduction. J. Oper. Manag. 2007, 25, 1075–1082. [Google Scholar] [CrossRef]
- Leenders, M.R.; Blenkhorn, D.L. Reverse Marketing: The New Buyer-Supplier Relationship. Free Press: New York, NY, USA; Collier Macmillan: London, UK, 1988. [Google Scholar]
- Corbett, C.J.; Kleindorfer, P.R. Environmental management and operations management: Introduction to the third special issue. Prod. Oper. Manag. 2003, 12, 287–289. [Google Scholar] [CrossRef]
- Hassini, E.; Surti, C.; Searcy, C. A literature review and a case study of sustainable supply chains with a focus on metrics. Int. J. Prod. Econ. 2012, 140, 69–82. [Google Scholar] [CrossRef]
- Berning, A.; Venter, C. Sustainable supply chain engagement in a retail environment. Sustainability 2015, 7, 6246–6263. [Google Scholar] [CrossRef]
- Shen, B.; Li, Q. Impacts of returning unsold products in retail outsourcing fashion supply chain: A sustainability analysis. Sustainability 2015, 7, 1172–1185. [Google Scholar] [CrossRef]
- Pagell, M.; Krause, D.; Klassen, R. Sustainable supply chain management: Theory and practice. J. Supply Chain Manag. 2008, 44, 85. [Google Scholar] [CrossRef]
- Carter, C.R.; Easton, P.L. Sustainable supply chain management: Evolution and future directions. Int. J. Phys. Distrib. Logist. Manag. 2011, 41, 46–62. [Google Scholar] [CrossRef]
- Prajogo, D.; Chowdhury, M.; Yeung, A.C.L.; Cheng, T.C.E. The relationship between supplier management and firm's operational performance: A multi-dimensional perspective. Int. J. Prod. Econ. 2012, 136, 123–130. [Google Scholar] [CrossRef]
- Zhu, Q.; Sarkis, J.; Geng, Y. Green supply chain management in china: Pressures, practices and performance. Int. J. Oper. Prod. Manag. 2005, 25, 449–468. [Google Scholar] [CrossRef]
- Lee, S.M.; Kim, S.T.; Choi, D. Green supply chain management and organizational performance. Ind. Manag. Data Syst. 2012, 112, 1148–1180. [Google Scholar] [CrossRef]
- Beske, P.; Land, A.; Seuring, S. Sustainable supply chain management practices and dynamic capabilities in the food industry: A critical analysis of the literature. Int. J. Prod. Econ. 2014, 152, 131–143. [Google Scholar] [CrossRef]
- LoMonaco-Benzing, R.; Ha-Brookshire, J. Sustainability as social contract: Textile and apparel professionals’ value conflicts within the corporate moral responsibility spectrum. Sustainability 2016, 8, 1278. [Google Scholar] [CrossRef]
- Silvestre, B.S. Sustainable supply chain management in emerging economies: Environmental turbulence, institutional voids and sustainability trajectories. Int. J. Prod. Econ. 2015, 167, 156–169. [Google Scholar] [CrossRef]
- Walker, H.; Phillips, W. Sustainable procurement: Emerging issues. Int. J. Procure. Manag. 2009, 2, 41–61. [Google Scholar] [CrossRef]
- Tippayawong, K.; Niyomyat, N.; Sopadang, A.; Ramingwong, S. Factors affecting green supply chain operational performance of the thai auto parts industry. Sustainability 2016, 8, 1161. [Google Scholar] [CrossRef]
- Amann, M.; Roehrich, J.K.; Eßig, M.; Harland, C. Driving sustainable supply chain management in the public sector: The importance of public procurement in the european union. Supply Chain Manag. 2014, 19, 351–366. [Google Scholar] [CrossRef]
- Nagurney, A.; Yu, M. Sustainable fashion supply chain management under oligopolistic competition and brand differentiation. Int. J. Prod. Econ. 2012, 135, 532–540. [Google Scholar] [CrossRef]
- Shim, S.O.; Park, K. Technology for production scheduling of jobs for open innovation and sustainability with fixed processing property on parallel machines. Sustainability 2016, 8, 904. [Google Scholar] [CrossRef]
- Uwasu, M.; Yabar, H.; Hara, K.; Shimoda, Y.; Saijo, T. Educational initiative of osaka university in sustainability science: Mobilizing science and technology towards sustainability. Sustain. Sci. 2009, 4, 45–53. [Google Scholar] [CrossRef]
- Larsen, G.L. An inquiry into the theoretical basis of sustainability: Ten propositions. In Understanding the Social Dimension of Sustainability; Routledge: London, UK, 2008; pp. 45–82. [Google Scholar]
- Kaup, F. Theoretical framework: Sustainability and innovation. In Contributions to Economics; Springer: Berlin/Heidelberg, Germany, 2015; Volume 213, pp. 13–44. [Google Scholar]
- Min, H.; Galle, W.P. Green purchasing strategies: Trends and implications. Int. J. Purch. Mater. Manag. 1997, 33, 10–17. [Google Scholar] [CrossRef]
- Zsidisin, G.A.; Siferd, S.P. Environmental purchasing: A framework for theory development. Eur. J. Purch. Supply Manag. 2001, 7, 61–73. [Google Scholar] [CrossRef]
- Min, H.; Galle, W.P. Green purchasing practices of us firms. Int. J. Oper. Prod. Manag. 2001, 21, 1222–1238. [Google Scholar] [CrossRef]
- Vachon, S.; Mao, Z. Linking supply chain strength to sustainable development: A country-level analysis. J. Clean. Prod. 2008, 16, 1552–1560. [Google Scholar] [CrossRef]
- Vachon, S.; Klassen, R.D. Environmental management and manufacturing performance: The role of collaboration in the supply chain. Int. J. Prod. Econ. 2008, 111, 299–315. [Google Scholar] [CrossRef]
- Zhu, Q.; Sarkis, J. Relationships between operational practices and performance among early adopters of green supply chain management practices in chinese manufacturing enterprises. J. Oper. Manag. 2004, 22, 265–289. [Google Scholar] [CrossRef]
- Carter, C.R.; Ellram, L.M.; Ready, K.J. Environmental purchasing: Benchmarking our german counterparts. Int. J. Purch. Mater. Manag. 1998, 34, 28–38. [Google Scholar] [CrossRef]
- Esfahbodi, A.; Zhang, Y.; Watson, G. Sustainable supply chain management in emerging economies: Trade-offs between environmental and cost performance. Int. J. Prod. Econ. 2016, 181, 350–366. [Google Scholar] [CrossRef]
- Marketline Case Study: Ethical Supply Chain Management; MarketLine: London, UK, 2014; pp. 1–29.
- Preuss, L. Addressing sustainable development through public procurement: The case of local government. Supply Chain Manag. Int. J. 2009, 14, 213–223. [Google Scholar] [CrossRef]
- Zhu, Q.; Sarkis, J.; Lai, K.-H. Initiatives and outcomes of green supply chain management implementation by chinese manufacturers. J. Environ. Manag. 2007, 85, 179–189. [Google Scholar] [CrossRef] [PubMed]
- Seuring, S.; Müller, M. Core issues in sustainable supply chain management—A delphi study. Bus. Strategy Environ. 2008, 17, 455–466. [Google Scholar] [CrossRef]
- Dou, Y.; Sarkis, J. A joint location and outsourcing sustainability analysis for a strategic offshoring decision. Int. J. Prod. Res. 2010, 48, 567–592. [Google Scholar] [CrossRef]
- Green, K.W.; Zelbst, P.J.; Bhadauria, V.S.; Meacham, J. Do environmental collaboration and monitoring enhance organizational performance? Ind. Manag. Data Syst. 2012, 112, 186–205. [Google Scholar] [CrossRef]
- Tang, C.S. A review of marketing–operations interface models: From co-existence to coordination and collaboration. Int. J. Prod. Econ. 2010, 125, 22–40. [Google Scholar] [CrossRef]
- Ding, H.; Zhao, Q.; An, Z.; Xu, J.; Liu, Q. Pricing strategy of environmental sustainable supply chain with internalizing externalities. Int. J. Prod. Econ. 2015, 170, 563–575. [Google Scholar] [CrossRef]
- Madani, S.R.; Rasti-Barzoki, M. Sustainable supply chain management with pricing, greening and governmental tariffs determining strategies: A game-theoretic approach. Comput. Ind. Eng. 2017, 105, 287–298. [Google Scholar] [CrossRef]
- Hu, T.-L.; Sheu, J.-B.; Huang, K.-H. A reverse logistics cost minimization model for the treatment of hazardous wastes. Transp. Res. Logist. Transp. Rev. 2002, 38, 457–473. [Google Scholar] [CrossRef]
- Shianghau, W.; Jiannjong, G. The trend of green supply chain management research (200010): A text mining analysis. In Proceedings of the 8th International Conference on Supply Chain Management and Information Systems: Logistics Systems and Engineering, Hong Kong, China, 6–9 October 2010. [Google Scholar]
- Zhu, Q.; Sarkis, J.; Lai, K.-H. Green supply chain management implications for “closing the loop”. Transp. Res. Logist. Transp. Rev. 2008, 44, 1–18. [Google Scholar] [CrossRef]
- Rao, P.; Holt, D. Do green supply chains lead to competitiveness and economic performance? Int. J. Oper. Prod. Manag. 2005, 25, 898–916. [Google Scholar] [CrossRef]
- Jayaram, J.; Avittathur, B. Green supply chains: A perspective from an emerging economy. Int. J. Prod. Econ. 2015, 164, 234–244. [Google Scholar] [CrossRef]
- Lai, K.-H.; Wu, S.J.; Wong, C.W.Y. Did reverse logistics practices hit the triple bottom line of chinese manufacturers? Int. J. Prod. Econ. 2013, 146, 106–117. [Google Scholar] [CrossRef]
- Nikolaou, I.E.; Evangelinos, K.I.; Allan, S. A reverse logistics social responsibility evaluation framework based on the triple bottom line approach. J. Clean. Prod. 2013, 56, 173–184. [Google Scholar] [CrossRef]
- Awasthi, A.; Chauhan, S.S.; Goyal, S.K. A fuzzy multicriteria approach for evaluating environmental performance of suppliers. Int. J. Prod. Econ. 2010, 126, 370–378. [Google Scholar] [CrossRef]
- Handfield, R.B.; Walton, S.V.; Seegers, L.K.; Melnyk, S.A. ‘Green’ value chain practices in the furniture industry. J. Oper. Manag. 1997, 15, 293–315. [Google Scholar] [CrossRef]
- Beske, P.; Koplin, J.; Seuring, S. The use of environmental and social standards by german first-tier suppliers of the volkswagen ag. Corp. Soc. Responsib. Environ. Manag. 2008, 15, 63–75. [Google Scholar] [CrossRef]
- Dyllick, T.; Hockerts, K. Beyond the business case for corporate sustainability. Bus. Strategy Environ. 2002, 11, 130–141. [Google Scholar] [CrossRef]
- Roehrich, J.K.; Hoejmose, S.U.; Overland, V. Driving green supply chain management performance through supplier selection and value internalisation: A self-determination theory perspective. Int. J. Oper. Prod. Manag. 2017, 37, 489–509. [Google Scholar] [CrossRef]
- Clemens, B. Economic incentives and small firms: Does it pay to be green? J. Bus. Res. 2006, 59, 492–500. [Google Scholar] [CrossRef]
- Koellner, T.; Weber, O.; Fenchel, M.; Scholz, R. Principles for sustainability rating of investment funds. Bus. Strategy Environ. 2005, 14, 54–70. [Google Scholar] [CrossRef]
- Albert Desclée, L.D.; Jay Hyman, S.P. Sustainable Investing and Bond Returns: Research Study into the Impact of Esg on Credit Portfolio Performance. Available online: https://www.investmentbank.barclays.com/content/dam/barclaysmicrosites/ibpublic/documents/our-insights/esg/barclays-sustainable-investing-and-bond-returns-3.6mb.pdf (accessed on 1 March 2017).
- Toppinen, A.; Hänninen, V.; Lähtinen, K. Iso 26000 in the assessment of csr communication quality: Ceo letters and social media in the global pulp and paper industry. Soc. Responsib. J. 2015, 11, 702–715. [Google Scholar] [CrossRef]
- Iso 26000-Social Responsibility. Available online: https://www.Iso.Org/iso-26000-social-responsibility.html (accessed on 2 April 2017).
- Castka, P.; Balzarova, M.A. A critical look on quality through csr lenses: Key challenges stemming from the development of ISO 26000. Int. J. Qual. Reliab. Manag. 2007, 24, 738–752. [Google Scholar] [CrossRef]
- Hahn, R.; Weidtmann, C. Transnational governance, deliberative democracy, and the legitimacy of iso 26000. Bus. Soc. 2016, 55, 90–129. [Google Scholar] [CrossRef]
- Bowen, F.E.; Cousins, P.D.; Lamming, R.C.; Faruk, A.C. Horses for courses. Greener Manag. Int. 2001, 2001, 41–60. [Google Scholar] [CrossRef]
- Wagner, M.; Van Phu, N.; Azomahou, T.; Wehrmeyer, W. The relationship between the environmental and economic performance of firms: An empirical analysis of the european paper industry. Corp. Soc. Responsib. Environ. Manag. 2002, 9, 133–146. [Google Scholar] [CrossRef]
- Burritt, R.L.; Schaltegger, S. Measuring the (un-)sustainability of industrial biomass production and use. Sustain. Account. Manag. Policy J. 2012, 3, 109–133. [Google Scholar] [CrossRef]
- Grosvold, J.; Hoejmose, S.U.; Roehrich, J.K. Squaring the circle: Management, measurement and performance of sustainability in supply chains. Supply Chain Manag. 2014, 19, 292–305. [Google Scholar] [CrossRef]
- Gopalakrishnan, K.; Yusuf, Y.Y.; Musa, A.; Abubakar, T.; Ambursa, H.M. Sustainable supply chain management: A case study of british aerospace (bae) systems. Int. J. Prod. Econ. 2012, 140, 193–203. [Google Scholar] [CrossRef]
- Köksal, D.; Strähle, J.; Müller, M.; Freise, M. Social sustainable supply chain management in the textile and apparel industry—A literature review. Sustainability 2017, 9, 100. [Google Scholar] [CrossRef]
- Sgarbossa, F.; Russo, I. A proactive model in sustainable food supply chain: Insight from a case study. Int. J. Prod. Econ. 2017, 183, 596–606. [Google Scholar] [CrossRef]
- De Brito, M.P.; Carbone, V.; Blanquart, C.M. Towards a sustainable fashion retail supply chain in europe: Organisation and performance. Int. J. Prod. Econ. 2008, 114, 534–553. [Google Scholar] [CrossRef]
- Anson, R. Editorial: Can the shift of textile and clothing production to asia be reversed. Text. Outlook Int. 2012, 19, 4–9. [Google Scholar]
- Mousiolis, D.T.; Zaridis, A.D.; Karamanis, K.; Rontogianni, A. Corporate social responsibility in smes and mnes. The different strategic decision making. Procedia Soc. Behav. Sci. 2015, 175, 579–583. [Google Scholar] [CrossRef]
- Chan, T.; Wong, C.W.Y. The consumption side of sustainable fashion supply chain: Understanding fashion consumer eco-fashion consumption decision. J. Fash. Mark. Manag. 2012, 16, 193–215. [Google Scholar] [CrossRef]
- Faisal, M.N. Sustainable supply chains: A study of interaction among the enablers. Bus. Process Manag. J. 2010, 16, 508–529. [Google Scholar] [CrossRef]
- Beard, N.D. The branding of ethical fashion and the consumer: A luxury niche or mass-market reality? Fash. Theory 2008, 12, 447–467. [Google Scholar] [CrossRef]
- Perry, P.; Towers, N. Determining the antecedents for a strategy of corporate social responsibility by small- and medium-sized enterprises in the uk fashion apparel industry. J. Retail. Consum. Ser. 2009, 16, 377–385. [Google Scholar] [CrossRef]
- Perry, P.; Towers, N. Conceptual framework development: Csr implementation in fashion supply chains. Int. J. Phys. Distrib. Logist. Manag. 2013, 43, 478–501. [Google Scholar] [CrossRef]
- Hoejmose, S.U.; Roehrich, J.K.; Grosvold, J. Is doing more doing better? The relationship between responsible supply chain management and corporate reputation. Ind. Mark. Manag. 2014, 43, 77–90. [Google Scholar] [CrossRef]
- Barkemeyer, R.; Comyns, B.; Figge, F.; Napolitano, G. Ceo statements in sustainability reports: Substantive information or background noise? Account. Forum 2014, 38, 241–257. [Google Scholar] [CrossRef]
- Kolk, A. Sustainability, accountability and corporate governance: Exploring multinationals’ reporting practices. Bus. Strategy Environ. 2008, 17, 1–15. [Google Scholar] [CrossRef]
- Bansal, P.; Kistruck, G. Seeing is (not) believing: Managing the impressions of the firm’s commitment to the natural environment. J. Bus. Ethics 2006, 67, 165–180. [Google Scholar] [CrossRef]
- Brown, H.S.; de Jong, M.; Levy, D.L. Building institutions based on information disclosure: Lessons from gri’s sustainability reporting. J. Clean. Prod. 2009, 17, 571–580. [Google Scholar] [CrossRef]
- Khan, M.H.U.Z.; Islam, M.A.; Fatima, J.K.; Ahmed, K. Corporate sustainability reporting of major commercial banks in line with gri: Bangladesh evidence. Soc. Responsib. J. 2011, 7, 347–362. [Google Scholar] [CrossRef]
- Chen, L.; Feldmann, A.; Tang, O. The relationship between disclosures of corporate social performance and financial performance: Evidences from gri reports in manufacturing industry. Int. J. Prod. Econ. 2015, 170, 445–456. [Google Scholar] [CrossRef]
- Conaway, R.N.; Wardrope, W.J. Do their words really matter? Thematic analysis of U.S. And latin american ceo letters. J. Bus. Commun. 2010, 47, 141–168. [Google Scholar] [CrossRef]
- Bournois, F.; Point, S. A letter from the president: Seduction, charm and obfuscation in french ceo letters. J. Bus. Strategy 2006, 27, 46–55. [Google Scholar] [CrossRef]
- Oakes, H.; Oakes, S. Accounting and marketing communications in arts engagement: A discourse analysis. Account. Forum 2012, 36, 209–222. [Google Scholar] [CrossRef]
- Cormier, D.; Magnan, M.; Van Velthoven, B. Environmental disclosure quality in large german companies: Economic incentives, public pressures or institutional conditions? Eur. Account. Rev. 2005, 14, 3–39. [Google Scholar] [CrossRef]
- Madlock, P.E. The link between leadership style, communicator competence, and employee satisfaction. J. Bus. Commun. 2008, 45, 61–78. [Google Scholar] [CrossRef]
- Hallahan, K. Seven models of framing: Implications for public relations. J. Public Relat. Res. 1999, 11, 205–242. [Google Scholar] [CrossRef]
- Tregidga, H.; Milne, M.; Lehman, G. Editorial. Account. Forum 2012, 36, 149. [Google Scholar] [CrossRef]
- Tregidga, H.; Milne, M.; Lehman, G. Analyzing the quality, meaning and accountability of organizational reporting and communication. Account. Forum 2012, 36, 150–153. [Google Scholar] [CrossRef]
- Lee, A.H.Y.; Silva, E.A. Newspaper representation and power relations in infrastructure projects: A case study of hong kong’s express rail link. Int. Plan Stud. 2016. [Google Scholar] [CrossRef]
- McCombs, M.E.; Shaw, D.L. The agenda-setting function of mass media. Pub. Opin. Q. 1972, 36, 176–187. [Google Scholar] [CrossRef]
- Du, Y.R. Intermedia agenda-setting in the age of globalization: A multinational agenda-setting test. Glob. Media Commun. 2013, 9, 19–36. [Google Scholar] [CrossRef]
- Calloway, C.; Jorgensen, C.M.; Saraiya, M.; Tsui, J. A content analysis of news coverage of the hpv vaccine by u.S. Newspapers, January 2002–June 2005. J. Women Health 2006, 15, 803–809. [Google Scholar] [CrossRef] [PubMed]
- Zack, M.H. Interactivity and communication mode choice in ongoing management groups. Inf. Syst. Res. 1993, 4, 207–239. [Google Scholar] [CrossRef]
- Baumgartner, F.R.; Jones, B.D. Agenda dynamics and policy subsystems. J. Politics 1991, 53, 1044–1074. [Google Scholar] [CrossRef]
- Mrogers, E.; Wdearing, J. Agenda-setting research: Where has it been, where is it going? Ann. Int. Commun. Assoc. 1988, 11, 555–594. [Google Scholar] [CrossRef]
- Islam, M.A.; Deegan, C. Media pressures and corporate disclosure of social responsibility performance information: A study of two global clothing and sports retail companies. Account. Bus. Res. 2010, 40, 131–148. [Google Scholar] [CrossRef]
- Heath, R.L. New communication technologies: An issues management point of view. Public Relat. Rev. 1998, 24, 273–288. [Google Scholar] [CrossRef]
- Zailani, S.; Jeyaraman, K.; Vengadasan, G.; Premkumar, R. Sustainable supply chain management (sscm) in malaysia: A survey. Int. J. Prod. Econ. 2012, 140, 330–340. [Google Scholar] [CrossRef]
- Roehrich, J.K.; Grosvold, J.; Hoejmose, S.U. Reputational risks and sustainable supply chain management: Decision making under bounded rationality. Int. J. Oper. Prod. Manag. 2014, 34, 695–719. [Google Scholar] [CrossRef]
- Eisenhardt, K.M. Building theories from case study research. Acad. Manag. Rev. 1989, 14, 532–550. [Google Scholar]
- Spry, D.; Dwyer, T. Representations of australia in south korean online news: A qualitative and quantitative approach utilizing leximancer and korean keywords in context. Qual. Quant. 2016, 1–20. [Google Scholar] [CrossRef]
- Niskanen, J.; Nieminen, T. The objectivity of corporate environmental reporting: A study of finnish listed firms' environmental disclosures. Bus. Strategy Environ. 2001, 10, 29–37. [Google Scholar] [CrossRef]
- Ryan, M. Journalistic ethics, objectivity, existential journalism, standpoint epistemology, and public journalism. J. Mass Media Ethics 2001, 16, 3–22. [Google Scholar] [CrossRef]
- Fisk, K.; Fitzgerald, R.; Cokley, J. Controversial new sciences in the media: Content analysis of global reporting of nanotechnology during the last decade. Media Int. Aust. 2014, 156–166. [Google Scholar] [CrossRef]
- Kolbe, R.H.; Burnett, M.S. Content-analysis research: An examination of applications with directives for improving research reliability and objectivity. J. Consum. Res. 1991, 18, 243–250. [Google Scholar] [CrossRef]
- Miles, M.B.; Huberman, A.M. Drawing valid meaning from qualitative data: Toward a shared craft. Educ. Res. 1984, 13, 20–30. [Google Scholar] [CrossRef]
- Johnson, R.B.; Onwuegbuzie, A.J.; Turner, L.A. Toward a definition of mixed methods research. J. Mixed Methods Res. 2007, 1, 112–133. [Google Scholar] [CrossRef]
- Cretchley, J.; Gallois, C.; Chenery, H.; Smith, A. Conversations between carers and people with schizophrenia: A qualitative analysis using leximancer. Qual. Health Res. 2010, 20, 1611–1628. [Google Scholar] [CrossRef] [PubMed]
- Qiu, G.; He, X.; Zhang, F.; Shi, Y.; Bu, J.; Chen, C. Dasa: Dissatisfaction-oriented advertising based on sentiment analysis. Expert Syst. Appl. 2010, 37, 6182–6191. [Google Scholar] [CrossRef]
- Taboada, M.; Brooke, J.; Tofiloski, M.; Voll, K.; Stede, M. Lexicon-basedmethods for sentiment analysis. Comput. Linguist. 2011, 37, 267–307. [Google Scholar] [CrossRef]
- Bligh, M.C.; Kohles, J.C. Comparing leaders across contexts, culture, and time: Computerized content analysis of leader–follower communications. Leadership 2014, 10, 142–159. [Google Scholar] [CrossRef]
- Young, L.; Wilkinson, I.; Smith, A. A scientometric analysis of publications in the journal of business-to-business marketing 1993–2014. J. Bus. Bus. Mark. 2015, 22, 111–123. [Google Scholar] [CrossRef]
- Hume, M.; Johnston, P.; Argar, M.; Hume, C. Creating the global greenscape: Developing a global market-entry framework for the green and renewable technologies. In Advances in Sustainability and Environmental Justice; Emerald Group Publishing Limited: Bradford, UK, 2013; Volume 11, pp. 151–185. [Google Scholar]
- Tkaczynski, A.; Rundle-Thiele, S.R.; Cretchley, J. A vacationer-driven approach to understand destination image: A leximancer study. J. Vacat. Mark. 2015, 21, 151–162. [Google Scholar] [CrossRef]
- Leximancer User Guide Release 4.5. Available online: http://doc.leximancer.com/doc/LeximancerManual.pdf (accessed on 10 June 2017).
- Mirzaei, A.; Siuki, E.; Gray, D.; Johnson, L.W. Brand associations in the higher education sector: The difference between shared and owned associations. J. Brand Manag. 2016, 23, 419–438. [Google Scholar] [CrossRef]
- Hair, J.F.; Black, W.C.; Babin, B.J.; Anderson, R.E. Multivariate Data Analysis, 7th ed.; Prentice-Hall: Upper Saddle River, NJ, USA, 2009. [Google Scholar]
- Mitchell, R.K.; Agle, B.R.; Wood, D.J. Toward a theory of stakeholder identification and salience: Defining the principle of who and what really counts. Acad. Manag. Rev. 1997, 22, 853–886. [Google Scholar]
- Şener, İ.; Varoğlu, A.; Karapolatgil, A.A. Sustainability reports disclosures: Who are the most salient stakeholders? Procedia Soc. Behav. Sci. 2016, 235, 84–92. [Google Scholar] [CrossRef]
- Moratis, L. Out of the ordinary? Appraising iso 26000’s csr definition. Int. J. Law Manag. 2016, 58, 26–47. [Google Scholar] [CrossRef]
- Kass, R.E.; Raftery, A.E. Bayes factors. J. Am. Stat. Assoc. 1995, 90, 773–795. [Google Scholar] [CrossRef]
- Hart, R.P.; Jarvis, S.E. Political debate. Am. Behav. Sci. 1997, 40, 1095–1122. [Google Scholar] [CrossRef]
- Hart, R.P.; Lind, C.J. The rhetoric of islamic activism: A diction study. Dyn. Asymmetr. Confl. Pathw. Terrorism Genocide 2011, 4, 113–125. [Google Scholar] [CrossRef]
- Davis, K.M.; Gardner, W.L. Charisma under crisis revisited: Presidential leadership, perceived leader effectiveness, and contextual influences. Leadersh. Q. 2012, 23, 918–933. [Google Scholar] [CrossRef]
- Insch, G.S.; Moore, J.E.; Murphy, L.D. Content analysis in leadership research: Examples, procedures, and suggestions for future use. Leadersh. Q. 1997, 8, 1–25. [Google Scholar] [CrossRef]
- Winter, D.G.; Stewart, A.J. Content analysis as a technique for assessing political leaders. Psychol. Exam. Political Lead. 1977, 27–61. [Google Scholar]
- Hart, R.P. Verbal Style and the Presidency: A Computer-Based Analysis; Academic Pr: Manhattan, NY, USA, 1984. [Google Scholar]
- Hart, R.P.; Carroll, C.E. Diction 7.1 Help Manual: The Text Analysis Program; Digitext, Inc.: Austin, TX, USA, 2015. [Google Scholar]
- Bligh, M.C.; Kohles, J.C.; Meindl, J.R. Charisma under crisis: Presidential leadership, rhetoric, and media responses before and after the september 11th terrorist attacks. Leadersh. Q. 2004, 15, 211–239. [Google Scholar] [CrossRef]
- Harwood, I.A.; Gapp, R.P.; Stewart, H.J. Cross-check for completeness: Exploring a novel use of leximancer in a grounded theory study. Qual. Rep. 2015, 20, 1029–1045. [Google Scholar]
- Karlsson, M.; Sjøvaag, H. Introduction: Research methods in an age of digital journalism. Digit. J. 2016, 4, 1–7. [Google Scholar] [CrossRef]
- Short, J.C.; Palmer, T.B. The application of diction to content analysis research in strategic management. Organ. Res. Methods 2008, 11, 727–752. [Google Scholar] [CrossRef]
- Ober, S.; Zhao, J.J.; Davis, R.; Alexander, M.W. Telling it like it is: The use of certainty in public business discourse. J. Bus. Commun. 1999, 36, 280–296. [Google Scholar] [CrossRef]
- Isabella, L.A.; Waddock, S.A. Top management team certainty: Environmental assessments, teamwork, and performance implications. J. Manag. 1994, 20, 835–858. [Google Scholar] [CrossRef]
- Yuthas, K.; Rogers, R.; Dillard, J.F. Communicative action and corporate annual reports. J. Bus. Ethics 2002, 41, 141–157. [Google Scholar] [CrossRef]
- Patelli, L.; Pedrini, M. Is the optimism in ceo’s letters to shareholders sincere? Impression management versus communicative action during the economic crisis. J. Bus. Ethics 2014, 124, 19–34. [Google Scholar] [CrossRef]
- Craig, R.J.; Brennan, N.M. An exploration of the relationship between language choice in ceo letters to shareholders and corporate reputation. Account. Forum 2012, 36, 166–177. [Google Scholar] [CrossRef]
- Etzioni, A. A communitarian note on stakeholder theory. In Essays in Socio-Economics; Springer: Berlin/Heidelberg, Germany, 1999; pp. 27–42. [Google Scholar]
- Barry, D.; Elmes, M. Strategy retold: Toward a narrative view of strategic discourse. Acad. Manag. Rev. 1997, 22, 429–452. [Google Scholar]
- Moss, T.W.; Short, J.C.; Payne, G.T.; Lumpkin, G.T. Dual identities in social ventures: An exploratory study. Entrep. Theory Pract. 2011, 35, 805–830. [Google Scholar] [CrossRef]
- Haveman, H.A. Follow the leader: Mimetic isomorphism and entry into new markets. Adm. Sci. Q. 1993, 38, 593–627. [Google Scholar] [CrossRef]
- Deephouse, D.L. Does isomorphism legitimate? Acad. Manag. J. 1996, 39, 1024–1039. [Google Scholar] [CrossRef]
- Mizruchi, M.S.; Fein, L.C. The social construction of organizational knowledge: A study of the uses of coercive, mimetic, and normative isomorphism. Adm.Sci. Q. 1999, 44, 653–683. [Google Scholar] [CrossRef]
- Gray, R. Does sustainability reporting improve corporate behaviour?: Wrong question? Right time? Account. Bus. Res. 2006, 36, 65–88. [Google Scholar] [CrossRef]
- Comyns, B.; Figge, F.; Hahn, T.; Barkemeyer, R. Sustainability reporting: The role of “search”, “experience” and “credence” information. Account. Forum 2013, 37, 231–243. [Google Scholar] [CrossRef]
Figure 1.
Initial SSCM research map.

Figure 2.
Research process and output.

Figure 3.
Themes and concepts in sustainability-related news.
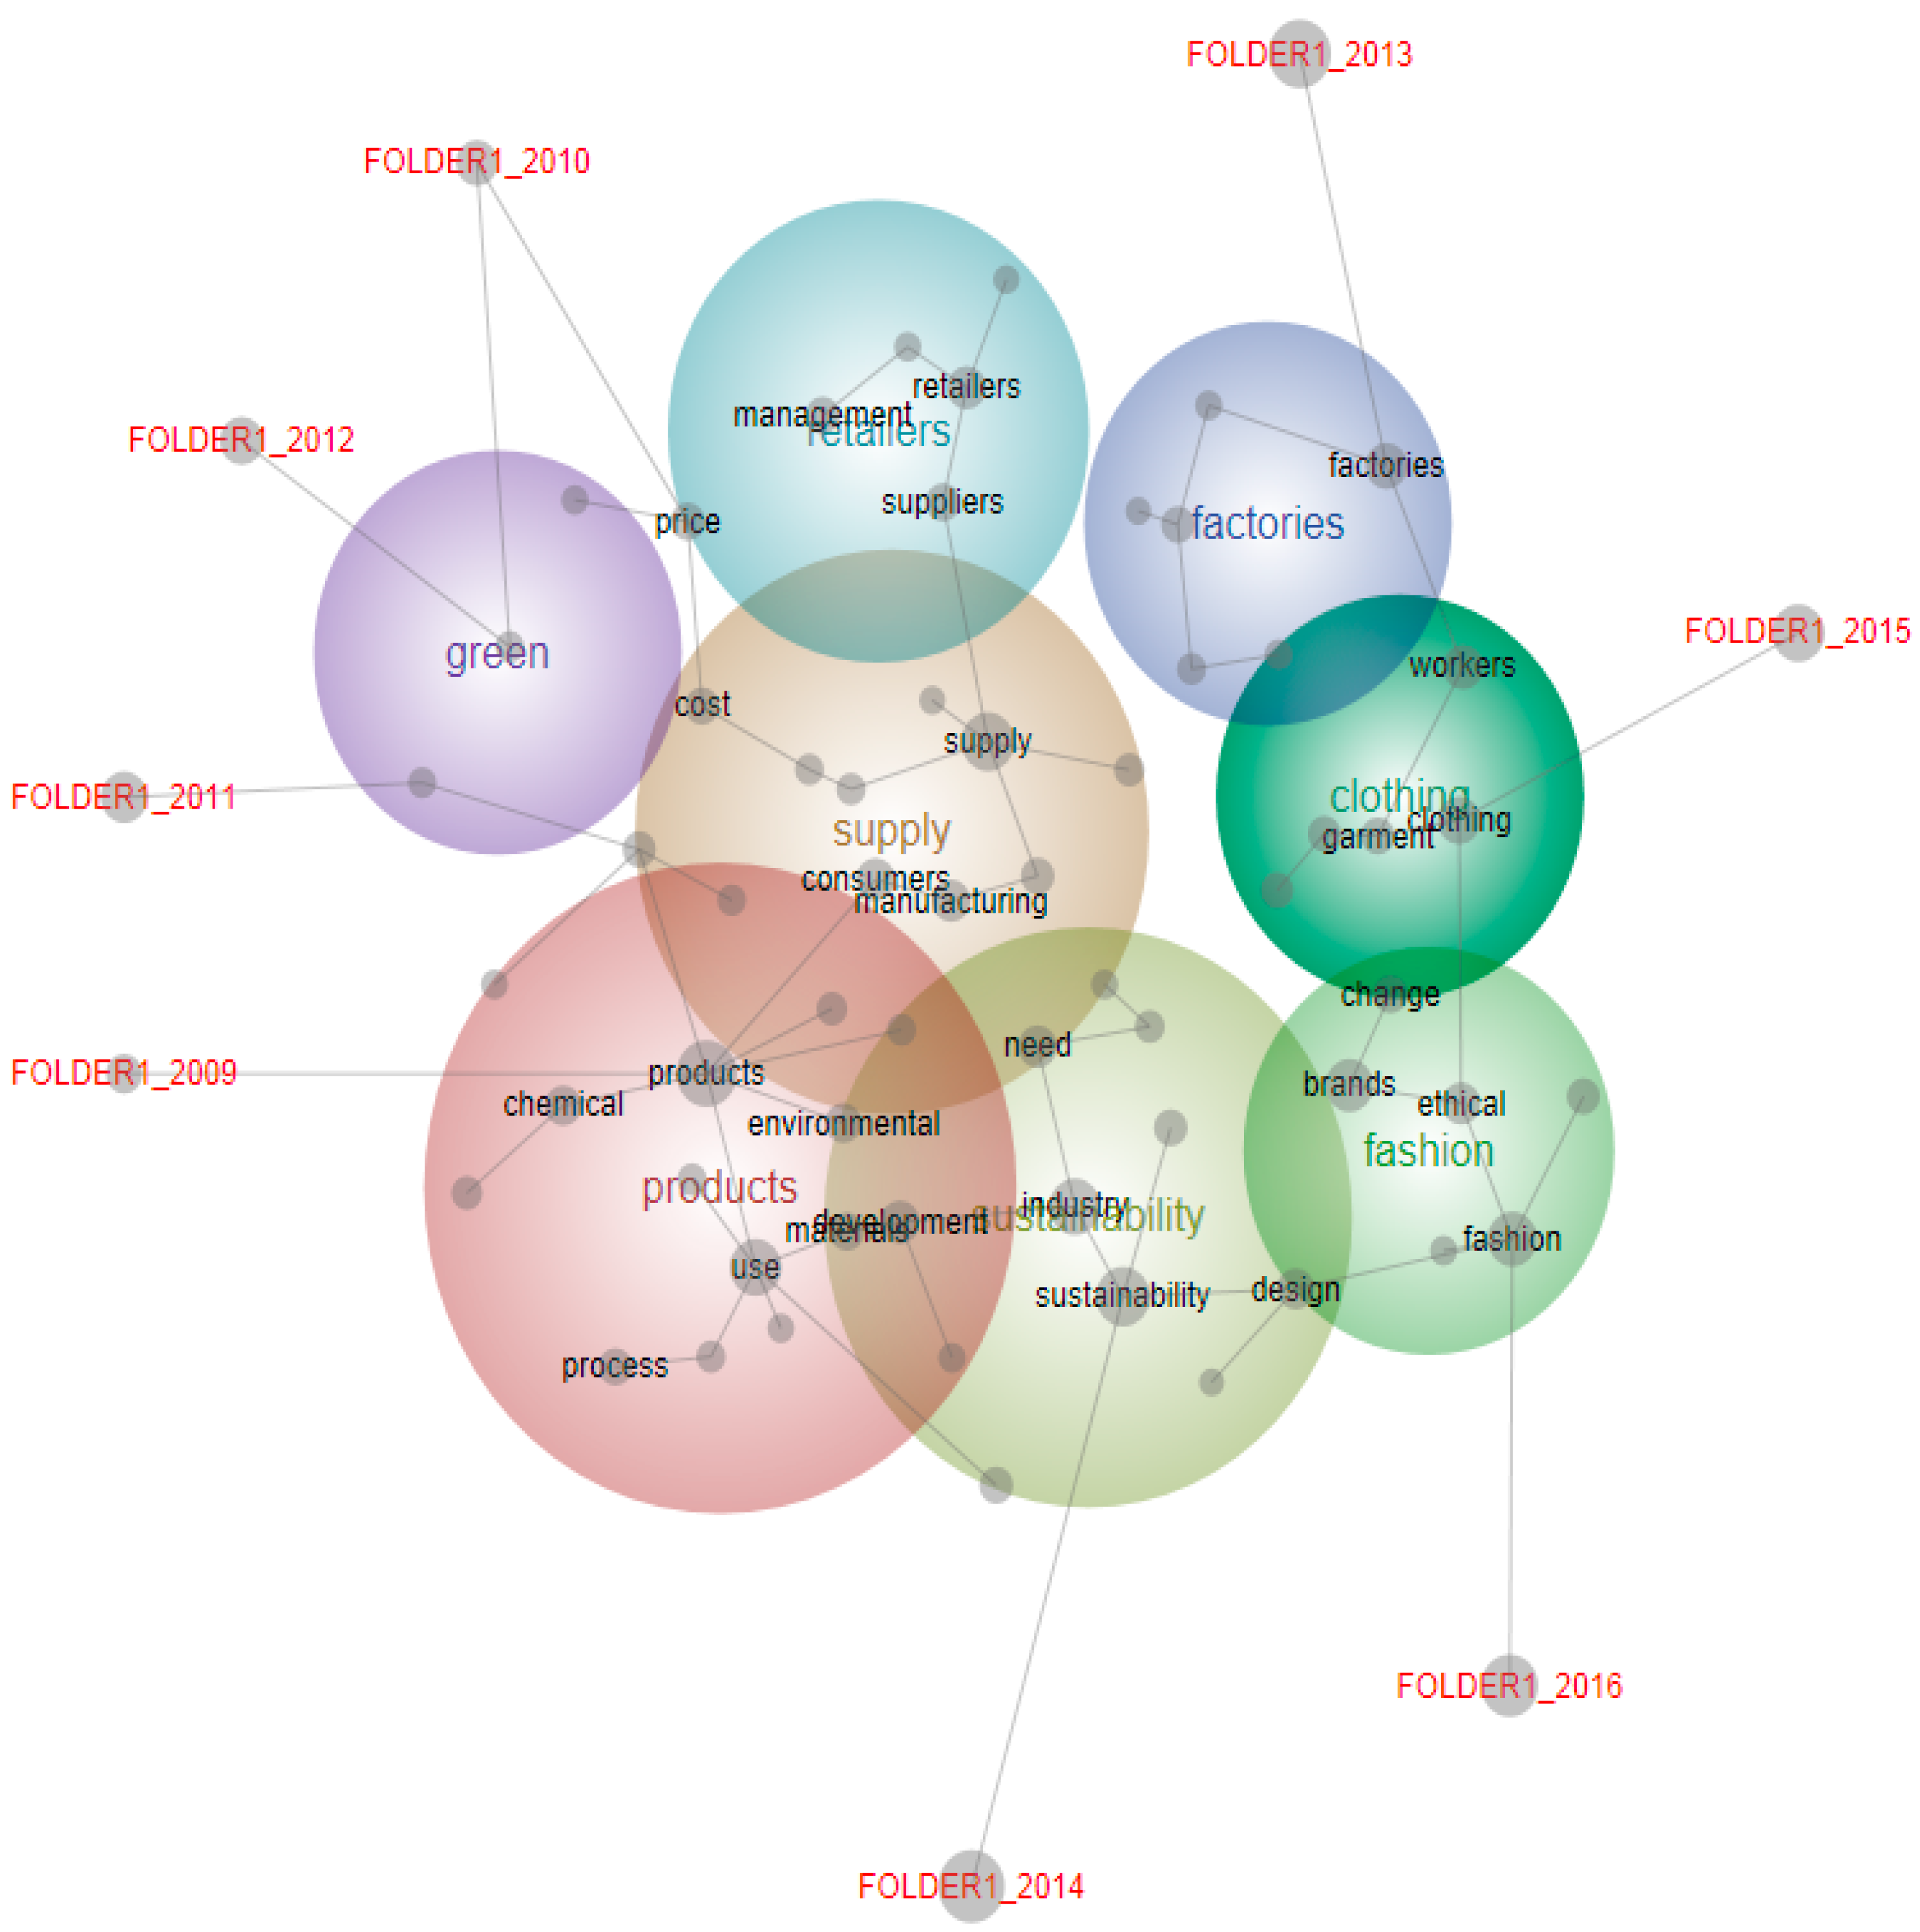
Figure 4.
Mapping of concepts of supply chains: although firms’ supply chains are not a linear one but more complex than shown here [18], the figure has been simplified to compare data.
Figure 4.
Mapping of concepts of supply chains: although firms’ supply chains are not a linear one but more complex than shown here [18], the figure has been simplified to compare data.
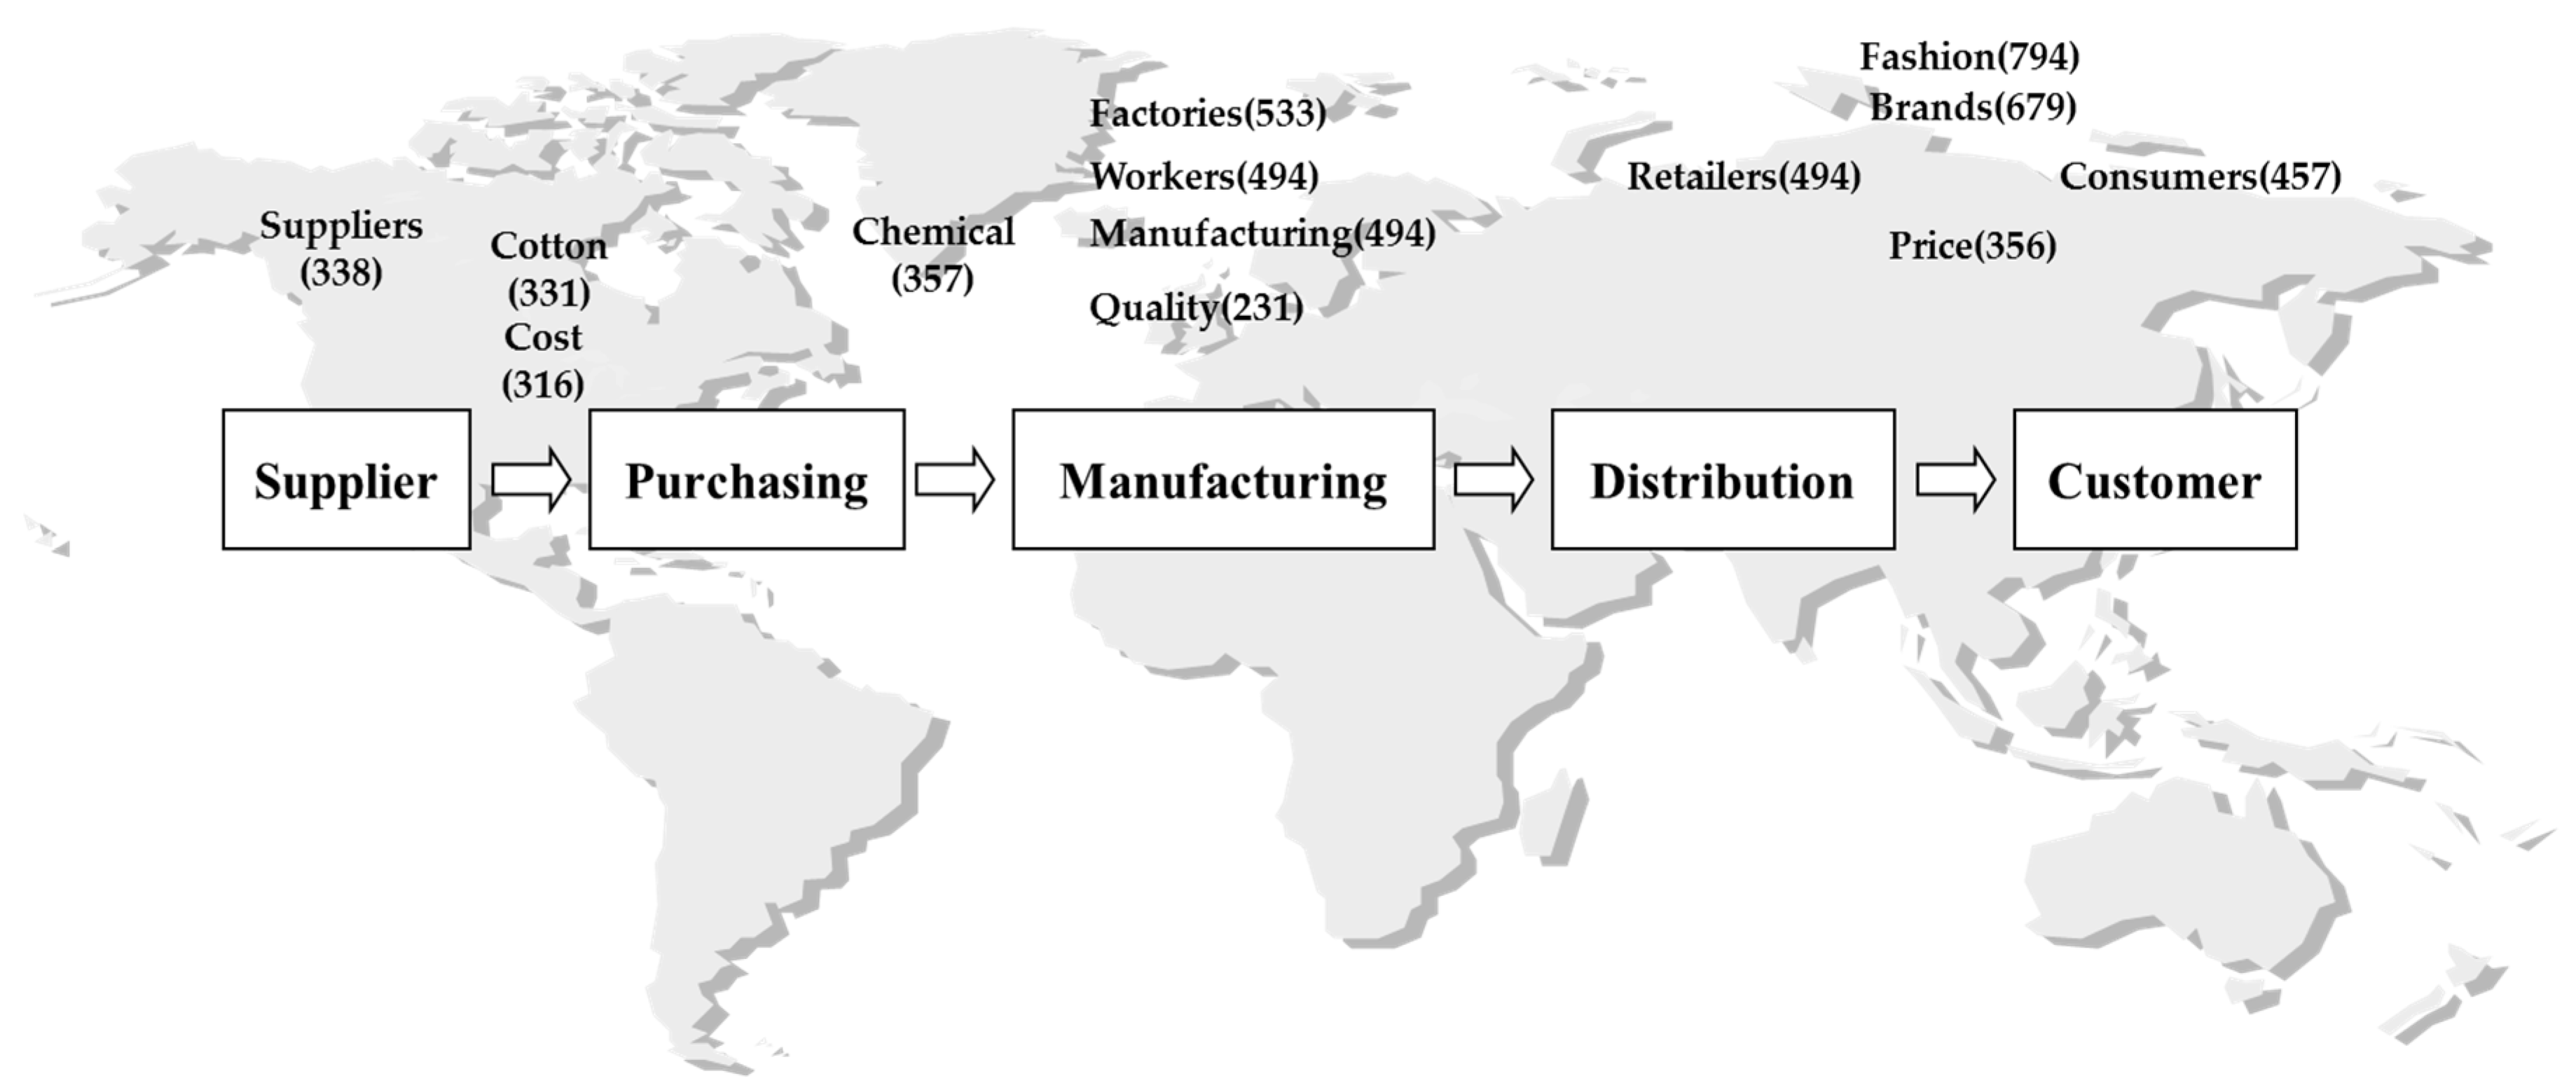
Figure 5.
Revised SSCM research map.
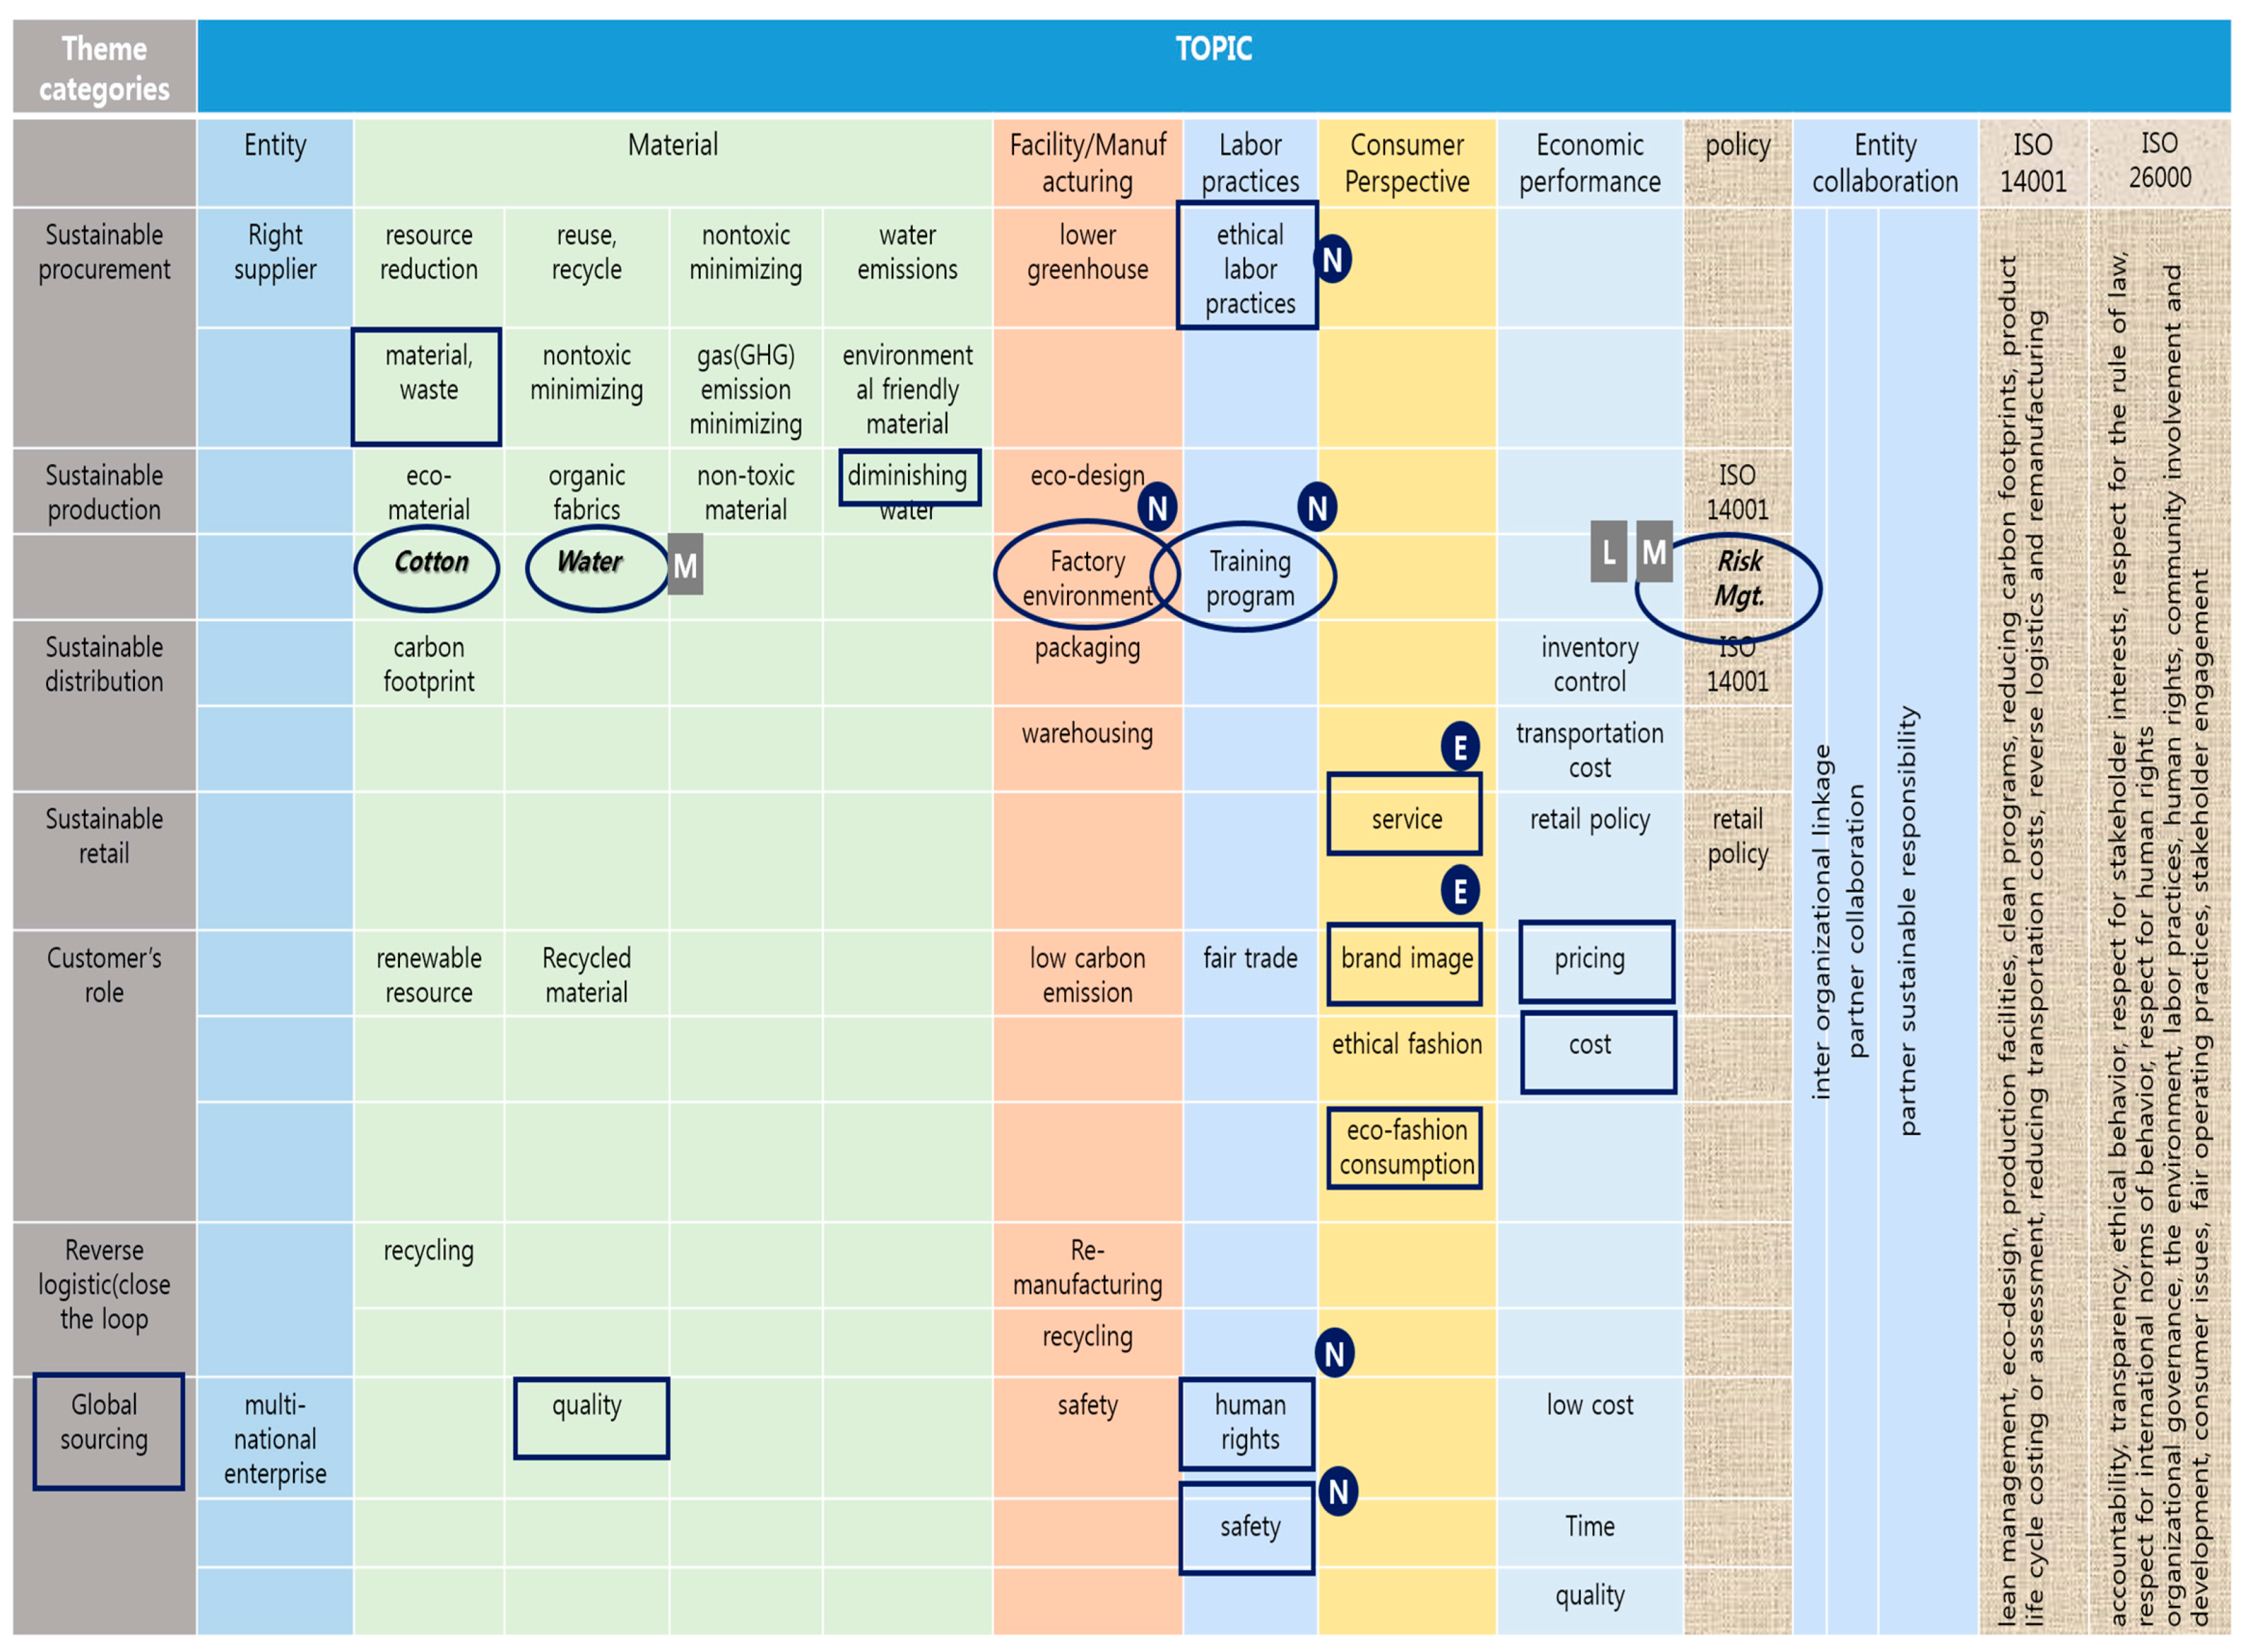
Table 1.
Review articles for SSCM.
| # | Author | Year | Industry/Country | Data | Method | Performance | Value Chain | Main Topic |
|---|---|---|---|---|---|---|---|---|
| 1 | Rao et al.[62] | 2005 | South East Asia | survey data | Quantitative (SEM) | economic | overall | ISO 14001, economic performance |
| 2 | Linton et al.[20] | 2007 | overall | secondary data (L) | descriptive | - | production | product design, By-products, product life extension, product end-of-life, recovery processes at end-of-life |
| 3 | Carter et al. [27] | 2011 | overall | secondary data (L) | qualitative | TBL | overall | TBL overall SSCM |
| 4 | Hassini et al. [23] | 2012 | overall | secondary data (L) | quantitative | SSM | overall | location, pricing, inventory |
| 5 | Ageron et al. [6] | 2012 | overall | survey data | descriptive | SSM | overall | reasons for SSM, performance criteria, greening SC, managerial approaches, barriers, benefits and motivations |
| 6 | Seuring et al. [53] | 2008 | Germany | expert polls | Delphi method | TBL | overall | overall |
| 7 | Beske et al. [31] | 2014 | food | secondary data (L) | qualitative | firm | - | continuity, collaboration, risk management, pro-activity |
| 8 | Walker et al. [34] | 2009 | overall | focus group interview | qualitative | TBL | procurement | ethical supply, sustainability and innovation measurement issues |
| 9 | Silvestre [33] | 2015 | oil and gas/Brazil | interview data | qualitative | TBL | - | environmental turbulence, institutional voids, extreme ambiguity,corruption, social pressing |
| 10 | Jayaram et al. [63] | 2015 | India | survey data | Quantitative (factor correlation) | environmental | overall | green procurement, design, product recovery green consciousness, sustainability strategy |
| 11 | Köksal et al. [83] | 2017 | textile and apparel | secondary data (L) 1 | Qualitative (content analysis) | environmental/social | overall | SSCM drivers, enablers, barriers management of Social Risk |
| 12 | Shianghau et al. [60] | 2010 | overall | secondary data (L) | Text mining | environmental | overall | green supply chain management trend |
1 (L): Literature review.
Table 2.
Quantitative Research Articles for SSCM.
| # | Author | Year | Industry/Country | Data | Method | Performance | Value Chain | Main Topic |
|---|---|---|---|---|---|---|---|---|
| 1 | Zhu [61] | 2008 | power generating, chemical/petroleum, electrical/electronic automobile/China | survey data | quantitative and ANOVA | environmental | purchasing/production/packaging/transportation | green purchasing, customer cooperation investment recovery, eco-design customer cooperation in overall value chain |
| 2 | Awasthi et al. [66] | 2010 | - | - | quantitative (fuzzy TOPSIS and Sensitivity analysis) | Environmental | overall | environmental performance assessment/supplier selection/multicriteria decision making |
| 3 | Zhu [52] | 2007 | automobile, power generating, electrical, chemical | survey data | quantitative (ANOVA and SEM) | environmental/GSCM | purchasing, eco design | economic/environmental/operational GSCM implementation/green purchasing customer cooperation/investment recovery |
| 4 | Hu et al. [59] | 2002 | high-technology manufacturers/Taiwan | Real data in factory | quantitative and modeling | operating | overall | hazardous-waste reverse logistics system |
| 5 | Zailani et al. [117] | 2012 | Malaysia | survey data | quantitative/regression | SSC/environmental | purchasing, packaging | performance |
| 6 | Nagurney et al. [37] | 2012 | fashion and apparel | simulation | mathematic modeling | economic | production/storage/distribution | brands oligopolistic competition |
| 7 | Nikolaou[65] | 2013 | overall | secondary data | quantitative and modeling | CSR Environmental | overall | reverse logistics social responsibility performance index |
| 8 | Lee et al. [30] | 2012 | electronics firms/Korea | survey data | Quantitative (SEM) | business | overall | business performance/job satisfaction/efficiency, GSCM practice implementation |
| 9 | Chan et al. [88] | 2012 | fashion, Hong Kong, | survey data | quantitative/regression | - | consumer purchasing | eco-fashion consumption decision |
| 10 | Lai et al. [64] | 2013 | China's manufacturing | survey data | quantitative, Regression analysis | operational, financial and social | overall | reverse logistics practices and TBL performance, waste management, recycle, reuse, reprocess, materials recovery, design for RL |
| 11 | Amann et al. [36] | 2014 | EU (Austria, Germany, The Netherlands, UK) | secondarty data (procurement file) | Quantitative (SEM) | environmental and social goal | purchasing | public procurement |
| 12 | Shen et al. [25] | 2015 | fashion | secondary data | quantitative and modeling | supply chain | retail | retail outsourcing with a return policy |
| 13 | Esfahbodi et al. [49] | 2016 | China, Iran | survey data | Quantitative (SEM 1) | environmental/SSCM/financial/cost | procurement/distribution/design/investment recovery | resource dependence theory, cost, ISO 14001, eco-design, economic/environmental performance |
| 14 | Ding et al. [57] | 2015 | transportation/China | secondary data | quantitative and modeling | environmental/operational | production, regulation | price strategy/government policy/externality relationship between firm performance and environmental incentives. |
| 15 | Toppinen et al. [74] | 2015 | world pulp and paper | secondary data | Quantitative (Regression analysis) | social and financial | overall | CEO communication/CSR/ISO 26000 |
| 16 | Tippayawong et al. [35] | 2016 | Auto Parts/Thai | survey and interviews | Quantitative (multiple linear regression analysis) | Green Supply Chain Operational financial | overall | green procurement/green transportation/manufacturing/Eco-design |
| 17 | Madani et al. [58] | 2017 | overall | secondary data | Game theory and modeling | environmental/economic/GSC | retail | pricing/subsidy and tax rate/policies |
1 SEM: structure equation modeling.
Table 3.
Qualitative Research Articles for SSCM.
| # | Author | Year | Industry/Country | Data | Method | Performance | Value Chain Process | Main Topic |
|---|---|---|---|---|---|---|---|---|
| 1 | Gopalakrishnan et al. [82] | 2012 | aerospace | secondary data | case study | environmental/financial/supplier/total performance | overall | TBL, drivers, sustainability initiatives and activities |
| 2 | Castka et al. [76] | 2007 | overall | secondary data (L) | qualitative | SR | Overall | ISO 26000, CSR, quality management |
| 3 | Perry et al. [91] | 2009 | fashion garment manufacturer | secondary data (L) | qualitative | firm/environmental and social | CSR, Transaction cost economics globalization, SME context | |
| 4 | Waas et al. [13] | 2014 | overall | secondary data (L) | qualitative review | sustainability | overall | sustainability assessment and indicators, decision making strategy |
| 5 | Shen [14] | 2014 | textile and apparel | secondary data | Qualitative (single case) | sustainability/environmental/financial | material, manufacturing, distribution, retailing | eco-material preparation/sustainable manufacturing/green distribution, retailing |
| 6 | Perry et al. [92] | 2013 | fashion | interviews, secondary data | qualitative (case study) | social and CSR | Overall | ethical sourcing/CSR, supplier CSR |
| 7 | Roehrich et al. [118] | 2014 | 9 industry (Utilities, food and drink, Retail, Construction, consulting, etc.) | primary and secondary data (semi-structured interviews) | Qualitative (Multiple case studies) | sustainability and financial | Overall | decision making, risk management, bounded rationality |
| 8 | Grosvold et al. [81] | 2014 | 9 industry | interview data | Qualitative (Multiple case studies) | SSC | Overall | SSC measurement, performance |
| 9 | LoMonaco et al. [32] | 2016 | textile and apparel | interview data | qualitative Interview | - | consumption | employee-corporation relationship perspective |
Table 4.
News articles about sustainability and supply chain management (SCM) in textile and apparel industry.
Table 4.
News articles about sustainability and supply chain management (SCM) in textile and apparel industry.
| Year | Number of News Articles | Number of Words Analyzed | Year | Number of News Articles | Number of Words Aalyzed |
|---|---|---|---|---|---|
| 2009 | 58 | 63,050 | 2013 | 121 | 179,125 |
| 2010 | 65 | 85,462 | 2014 | 123 | 168,805 |
| 2011 | 82 | 104,865 | 2015 | 119 | 138,196 |
| 2012 | 89 | 98,781 | 2016 | 135 | 149,903 |
Table 5.
Themes and Concepts in Sustainability-related News that constitute Themes.
| # | Theme | Connectivity | Hits | Concept |
|---|---|---|---|---|
| 1 | Products | 15,737 | 2650 | products, use, development, chemical, environmental, materials, process |
| 2 | Supply | 13,678 | 1783 | supply, consumers, manufacturing, cost |
| 3 | Sustainability | 11,260 | 2207 | sustainability, industry, need, cotton |
| 4 | Fashion | 10,457 | 2204 | fashion, brands, ethical, design, change |
| 5 | Clothing | 6644 | 1049 | clothing, workers |
| 6 | Retailers | 5847 | 1406 | retailers, suppliers, price, management |
| 7 | Factories | 4898 | 533 | factories |
| 8 | Green | 1695 | 211 | green |
Table 6.
Count and likelihood of concepts of triple bottom line (TBL) (environmental and social dimensions).
Table 6.
Count and likelihood of concepts of triple bottom line (TBL) (environmental and social dimensions).
| # | Environmental (338) | Social (281) | ||||
|---|---|---|---|---|---|---|
| Concept | Count | Likelihood | Concept | Count | Likelihood | |
| 1 | social | 81 | 29% | corporate | 40 | 25% |
| 2 | green | 35 | 17% | environmental ntatal | 81 | 24% |
| 3 | water | 22 | 12% | ethical | 37 | 9% |
| 4 | waste | 17 | 9% | water | 15 | 9% |
| 5 | ethical | 36 | 8% | factories | 33 | 8% |
| 6 | sustainability | 67 | 7% | garment | 14 | 6% |
| 7 | chemical | 26 | 7% | labor | 10 | 5% |
| 8 | process | 21 | 6% | change | 19 | 5% |
| 9 | customers | 20 | 6% | research | 7 | 5% |
| 10 | products | 62 | 6% | sustainability | 43 | 5% |
| 11 | manufacturing | 24 | 6% | customers | 15 | 5% |
| 12 | major | 10 | 6% | supply | 40 | 5% |
| 13 | development | 26 | 6% | management | 16 | 5% |
| 14 | world | 17 | 6% | value | 9 | 4% |
| 15 | cost | 17 | 5% | materials | 12 | 4% |
| 16 | labor | 10 | 5% | consumers | 18 | 4% |
| 17 | supply | 42 | 5% | global | 11 | 4% |
| 18 | consumers | 23 | 5% | design | 1 | 4% |
| 19 | research | 7 | 5% | growth | 6 | 4% |
| 20 | industry | 38 | 5% | safety | 5 | 4% |
Table 7.
Count and likelihood for concepts of TBL (Economic dimension).
| # | Cost (316) | Price (356) | ||||
|---|---|---|---|---|---|---|
| Concept | Count | Likelihood | Concept | Count | Likelihood | |
| 1 | price | 64 | 18% | cost | 64 | 20% |
| 2 | quality | 20 | 9% | quality | 20 | 9% |
| 3 | materials | 23 | 8% | customers | 24 | 8% |
| 4 | waste | 14 | 7% | internationals | 10 | 8% |
| 5 | sales | 11 | 7% | consumers | 33 | 7% |
| 6 | major | 19 | 6% | suppliers | 22 | 7% |
| 7 | service | 12 | 6% | value | 13 | 6% |
| 8 | cotton | 19 | 6% | government | 9 | 6% |
| 9 | products | 54 | 6% | supply | 51 | 6% |
| 10 | retailers | 27 | 5% | major | 10 | 6% |
| 11 | clothing | 32 | 5% | retailers | 29 | 6% |
| 12 | suppliers | 18 | 5% | products | 52 | 5% |
| 13 | process | 16 | 5% | garment | 14 | 5% |
| 14 | internationals | 7 | 5% | ethical | 22 | 5% |
| 15 | safety | 7 | 5% | trade | 12 | 5% |
| 16 | environmental | 17 | 5% | long | 6 | 5% |
| 17 | food | 10 | 5% | green | 10 | 5% |
| 18 | supply | 40 | 5% | materials | 14 | 5% |
| 19 | head | 5 | 5% | head | 5 | 5% |
| 20 | garment | 12 | 4% | global | 12 | 4% |
Table 8.
Companies analyzed.
| # | Company Name | Region | Listed 1 | MNE | # | Company Name | Region | Listed | MNE |
|---|---|---|---|---|---|---|---|---|---|
| 1 | AandE | North A 2 | X | X | 13 | Lindstrom Oy | Europe | X | X |
| 2 | Aksa krilik (AKSA) | Asia | BIST | X | 14 | Marc O’Polo | Europe | X | X |
| 3 | Aquafil | Europe | X | X | 15 | Nike (NKE) | North A | NYSE | X |
| 4 | Coach (COH) | North A | NYSE | O | 16 | Odlo | Europe | X | X |
| 5 | Crocs (CROX) | North A | NASDAQ | O | 17 | Otto Group | Europe | X | O |
| 6 | Crystal Group | Asia | X | O | 18 | Polyflor | Europe | X | X |
| 7 | CWS-boco Group | Europe | X | O | 19 | PRADA (PRP) | Europe | SIX | O |
| 8 | Delta Galil (DELT) | Asia | TASE | O | 20 | PUMA (PUM) | Europe | FWB | O |
| 9 | Desso Holding B.V | Europe | X | O | 21 | PVH (PVH) | North A | NYSE | X |
| 10 | Everest textile (1460) | Asia | TWSE | O | 22 | TAL | Asia | X | O |
| 11 | Gildan(GIL) | North A | NYSE | X | 23 | Teijin (3401) | Asia | TYO | X |
| 12 | Lindex | Europe | X | X | 24 | Toray Industries Inc. (3402) | Asia | TYO | O |
1 BIST: Turkey Stock Exchange, NYSE: New York Stock Exchange, NASDAQ: NASDAQ Stock Market, TASE: Tel Aviv, TWSE: Taiwan, SIX: Swiss, FWB: Frankfurt Stock Exchange, TYO: Tokyo; 2 North A: North America.
Table 9.
Themes and concepts in sustainability reporting.
| # | Theme | Connectivity | Hits | Concept |
|---|---|---|---|---|
| 1 | Environmental-products | 60,864 | 13,098 | products, impact, sustainability, process, materials, suppliers, reduce, supply, manufacturing, water, quality |
| 2 | Environmental-social | 47,456 | 8707 | environmental, health, safety, system, factories, risk, measures |
| 3 | Social-management | 46,310 | 8172 | management, activities, human, rights, global, training, issues |
| 4 | Social-operations | 44,433 | 4853 | operations, responsibility, social, development |
| 5 | Social-employees | 30,618 | 6581 | employees, business, company |
| 6 | Customers | 15,036 | 1370 | customers |
| 7 | Environmental-energy | 6197 | 1624 | emissions |
| 8 | CSR | 3294 | 1989 | CSR |
| 9 | Economic-financial | 900 | 435 | financial |
Table 10.
Prominence Index discriminating concepts by region, listing, and multinational enterprise (MNE).
Table 10.
Prominence Index discriminating concepts by region, listing, and multinational enterprise (MNE).
| Concept | Region | Listing | MNE | ||||
|---|---|---|---|---|---|---|---|
| Asia | Europe | North-Am | Listed | No-listed | MNE | No-MNE | |
| business | 1.2 | 2.2 | 1.4 | 1.1 | 1.5 | ||
| company | 1.2 | 1.6 | 1.3 | 1.4 | 1.2 | 1.4 | |
| customers | 2.0 | 2.1 | |||||
| emissions | 1.2 | ||||||
| employees | 1.3 | 1.1 | 2.0 | 1.4 | 1.1 | 1.2 | 1.4 |
| environmental | 1.3 | 1.2 | 1.8 | 1.3 | 1.3 | 1.1 | 1.6 |
| factories | 3.9 | ||||||
| health | 1.3 | ||||||
| impact | 2.6 | ||||||
| improve | 1.2 | ||||||
| management | 1.5 | 1 | 1.5 | 1.5 | 1.1 | 1.1 | 1.5 |
| materials | 1.6 | 1.2 | 1.6 | 1.2 | |||
| operations | 1.2 | 1.0 | 1.6 | ||||
| products | 1.0 | 1.7 | 1.4 | 1.1 | 1.7 | 1.1 | 1.5 |
| Program 1 | 4.7 | ||||||
| safety | 1.4 | 1.3 | |||||
| service | 2.2 | 2.4 | |||||
| sewing | 5.2 | ||||||
| sustainability | 1.6 | 2.3 | 2.0 | 1.2 | 1.4 | ||
| system | 1.5 | 1.7 | |||||
| waste | 1.9 | 1.9 | 1.9 | ||||
| water | 1.4 | ||||||
1 Program: A company’s internal program (e.g., education, training, counseling program, and risk control program) to implement CSR and sustainability.
Table 11.
Prominence index value for discriminating compound concepts by listing, and MNE.
| Listed | Not-Listed | MNE | Non-MNE | ||||
|---|---|---|---|---|---|---|---|
| Compound Concept | PI | Compound Concept | PI | Compound Concept | PI | Compound Concept | PI |
| safety and health | 116 | service and textile | 54.9 | environmental and social | 33.4 | waste and textile | 32.8 |
| environmental and social | 28.7 | service and customers | 51.1 | products and service | 17.9 | waste and reduce | 25.8 |
| management and risk | 20.7 | waste and textile | 36.3 | water and energy | 15.6 | environmental and social | 25.7 |
| environmental and reduce | 17.7 | environmental and social | 26.8 | products and quality | 13.9 | business and global | 24.3 |
| employees and training | 17.4 | service and products | 23.6 | products and brand | 13.3 | operations and local | 22.4 |
| products and brand | 16.8 | service and brand | 21.9 | water and quality | 12.4 | environmental and risk | 21.6 |
| material and manufacturing | 16.6 | service and operations | 18.8 | management and risk | 12.1 | waste and manufacturing | 19.0 |
| safety and environment | 16.5 | service and quality | 17.6 | business and goal | 12.1 | system and management | 18.2 |
| heath and environment | 16.4 | products and textile | 17.2 | management and system | 11.8 | products and quality | 18.0 |
| safety and rights | 15.1 | sustainability and social | 16.7 | sustainability and social | 11.8 | employees and training | 17.1 |
Table 12.
Prominence Index Value for discriminating Compound Concepts by Region.
| Asia | North America | Europe | |||
|---|---|---|---|---|---|
| Compound Concept | PI | Compound Concept | PI | Compound Concept | PI |
| emissions and reducing | 30 | factories and workers | 240.9 | service and customers | 49.2 |
| environmental and impact | 29.1 | sewing and textile | 162.1 | service and textile | 48.3 |
| environmental and social | 24.2 | factories and manufacturing | 118.4 | waste and textile | 39.2 |
| management and risk | 19.3 | sewing and training | 95.7 | environmental and impact | 30.5 |
| system and management | 18.2 | sewing and program | 91.2 | environmental and social | 22.6 |
| environmental and reducing | 16.8 | program and training | 80.2 | service and brand | 22.4 |
| business and goal | 16.3 | sewing and employees | 79.1 | service and operations | 22 |
| safety and environmental | 16.1 | sewing and manufacturing | 69.9 | service and impact | 21.8 |
| products and quality | 15.9 | environmental and social | 64.8 | service and products | 19.8 |
| safety and quality | 14.4 | factories and standards | 60.9 | waste and water | 17.8 |
Table 13.
MANCOVA results for rhetorical variables by listed.
| Variable | Sig. | Partial eta Squared | Wilk’s Lambda |
|---|---|---|---|
| Certainty | 0.968 | 0 | 0.807 |
| Optimism | 0.099 | 0.038 | |
| Activity | 0.134 | 0.032 | |
| Realism | 0.041 * | 0.058 | |
| Commonality | 0.002 ** | 0.125 |
* p < 0.05, ** p < 0.01.
Table 14.
ANCOVA results for rhetorical variables by listed.
| Construct | Listed Mean | Not-Listed Mean | Univariate F(1,71) | Partial eta Squared | Observed Power |
|---|---|---|---|---|---|
| Certainty | 47.39 | 47.23 | 0.002 | 0.000 | 0.050 |
| Optimism | 54.67 | 54.28 | 2.801 | 0.038 | 0.379 |
| Activity | 50.27 | 50.96 | 2.298 | 0.032 | 0.321 |
| Realism | 45.70 | 47.51 | 4.348 * | 0.058 | 0.538 |
| Commonality | 52.74 | 51.57 | 9.989 ** | 0.125 | 0.876 |
* p < 0.05, ** p < 0.01.
Table 15.
ANCOVA results for rhetorical variables by region.
| Construct | Asia Mean | North America Mean | Europe Mean | Univariate F(2,70) | Partial eta Squared | Observed Power |
|---|---|---|---|---|---|---|
| Certainty | 47.33 | 46.69 | 47.66 | 0.822 | 0.023 | 0.185 |
| Optimism | 54.48 | 54.92 | 54.20 | 0.748 | 0.021 | 0.172 |
| Activity | 50.50 | 50.26 | 50.92 | 0.521 | 0.015 | 0.133 |
| Realism | 45.09 | 46.90 | 47.50 | 4.147* | 0.107 | 0.714 |
| Commonality | 51.95 | 53.25 | 51.63 | 3.306* | 0.087 | 0.609 |
* p < 0.05.
Table 16.
Mapping of Themes and Concepts generated by Supply Chain News.
| # | Theme | Concepts | Supply Chain Process |
|---|---|---|---|
| 1 | Products | products, use, development, chemical, environmental, materials, process | manufacturing purchasing |
| 2 | Supply | supply, consumers, manufacturing, cost | manufacturing |
| 3 | Sustainability | sustainability, industry, need, cotton | overall manufacturing |
| 4 | Fashion | fashion, brands, ethical, design, change | distribution consumer side |
| 5 | Clothing | clothing, workers | manufacturing |
| 6 | Retailers | retailers, suppliers, price, management | retail |
| 7 | Factories | Factories | manufacturing |
| 8 | Green | green | overall |
Table 17.
Summary of study 2 and 3 findings.
| Category | Study 2_Sustainability Report | Study 3_CEO Letter |
|---|---|---|
| Listed | Individual concept to TBL: None | Low realism
High commonality |
| Compound concept to TBL: safetyand health, environmental and social, management and risk, environmental and reduce, employees and training, emphasis on risk management | ||
| No-Listed | Individual concept to TBL: customer, service, sustainability | High realism
Low commonality |
| Compound concept to TBL: service and textile, service and customers, waste and textile, environmental and social | ||
| MNE | Individual concept to TBL: None | |
| Compound concept to TBL: water and energy, water and quality; emphasis on risk management | ||
| No-MNE | Individual concept to TBL: None | |
| Compound concept to TBL: waste and textile, waste and reduce | ||
| Asia | Individual concept to TBL: None | Low Realism
Mid commonality |
| Compound concept to TBL: environmental, management | ||
| North America | Individual concept to TBL: sewing, program, factories, impact, sustainability, business, employees | Mid Realism
High commonality |
| Compound concept to TBL: Emphasis on social dimension; (training, program, standards, workers, employees) | ||
| Europe | Individual concept to TBL: service, customers | High Realism
Low commonality |
| Compound concept to TBL: customer, service |
© 2017 by the authors. Licensee MDPI, Basel, Switzerland. This article is an open access article distributed under the terms and conditions of the Creative Commons Attribution (CC BY) license (http://creativecommons.org/licenses/by/4.0/).
Share and Cite
MDPI and ACS Style
Kim, D.; Kim, S. Sustainable Supply Chain Based on News Articles and Sustainability Reports: Text Mining with Leximancer and DICTION. Sustainability 2017, 9, 1008. https://doi.org/10.3390/su9061008
AMA Style
Kim D, Kim S. Sustainable Supply Chain Based on News Articles and Sustainability Reports: Text Mining with Leximancer and DICTION. Sustainability. 2017; 9(6):1008. https://doi.org/10.3390/su9061008
Chicago/Turabian StyleKim, Dongwook, and Sungbum Kim. 2017. "Sustainable Supply Chain Based on News Articles and Sustainability Reports: Text Mining with Leximancer and DICTION" Sustainability 9, no. 6: 1008. https://doi.org/10.3390/su9061008
Note that from the first issue of 2016, this journal uses article numbers instead of page numbers. See further details here.