Use of Video and 3D Scenario Visualisation to Rate Vegetation Screens for Integrating Buildings into the Landscape


 ,
,  and
and
Abstract
:1. Introduction
1.1. Aproach to the Problem
1.2. Landscape Visualisation
1.3. Animation and 3D Visalisation
2. Materials and Methods
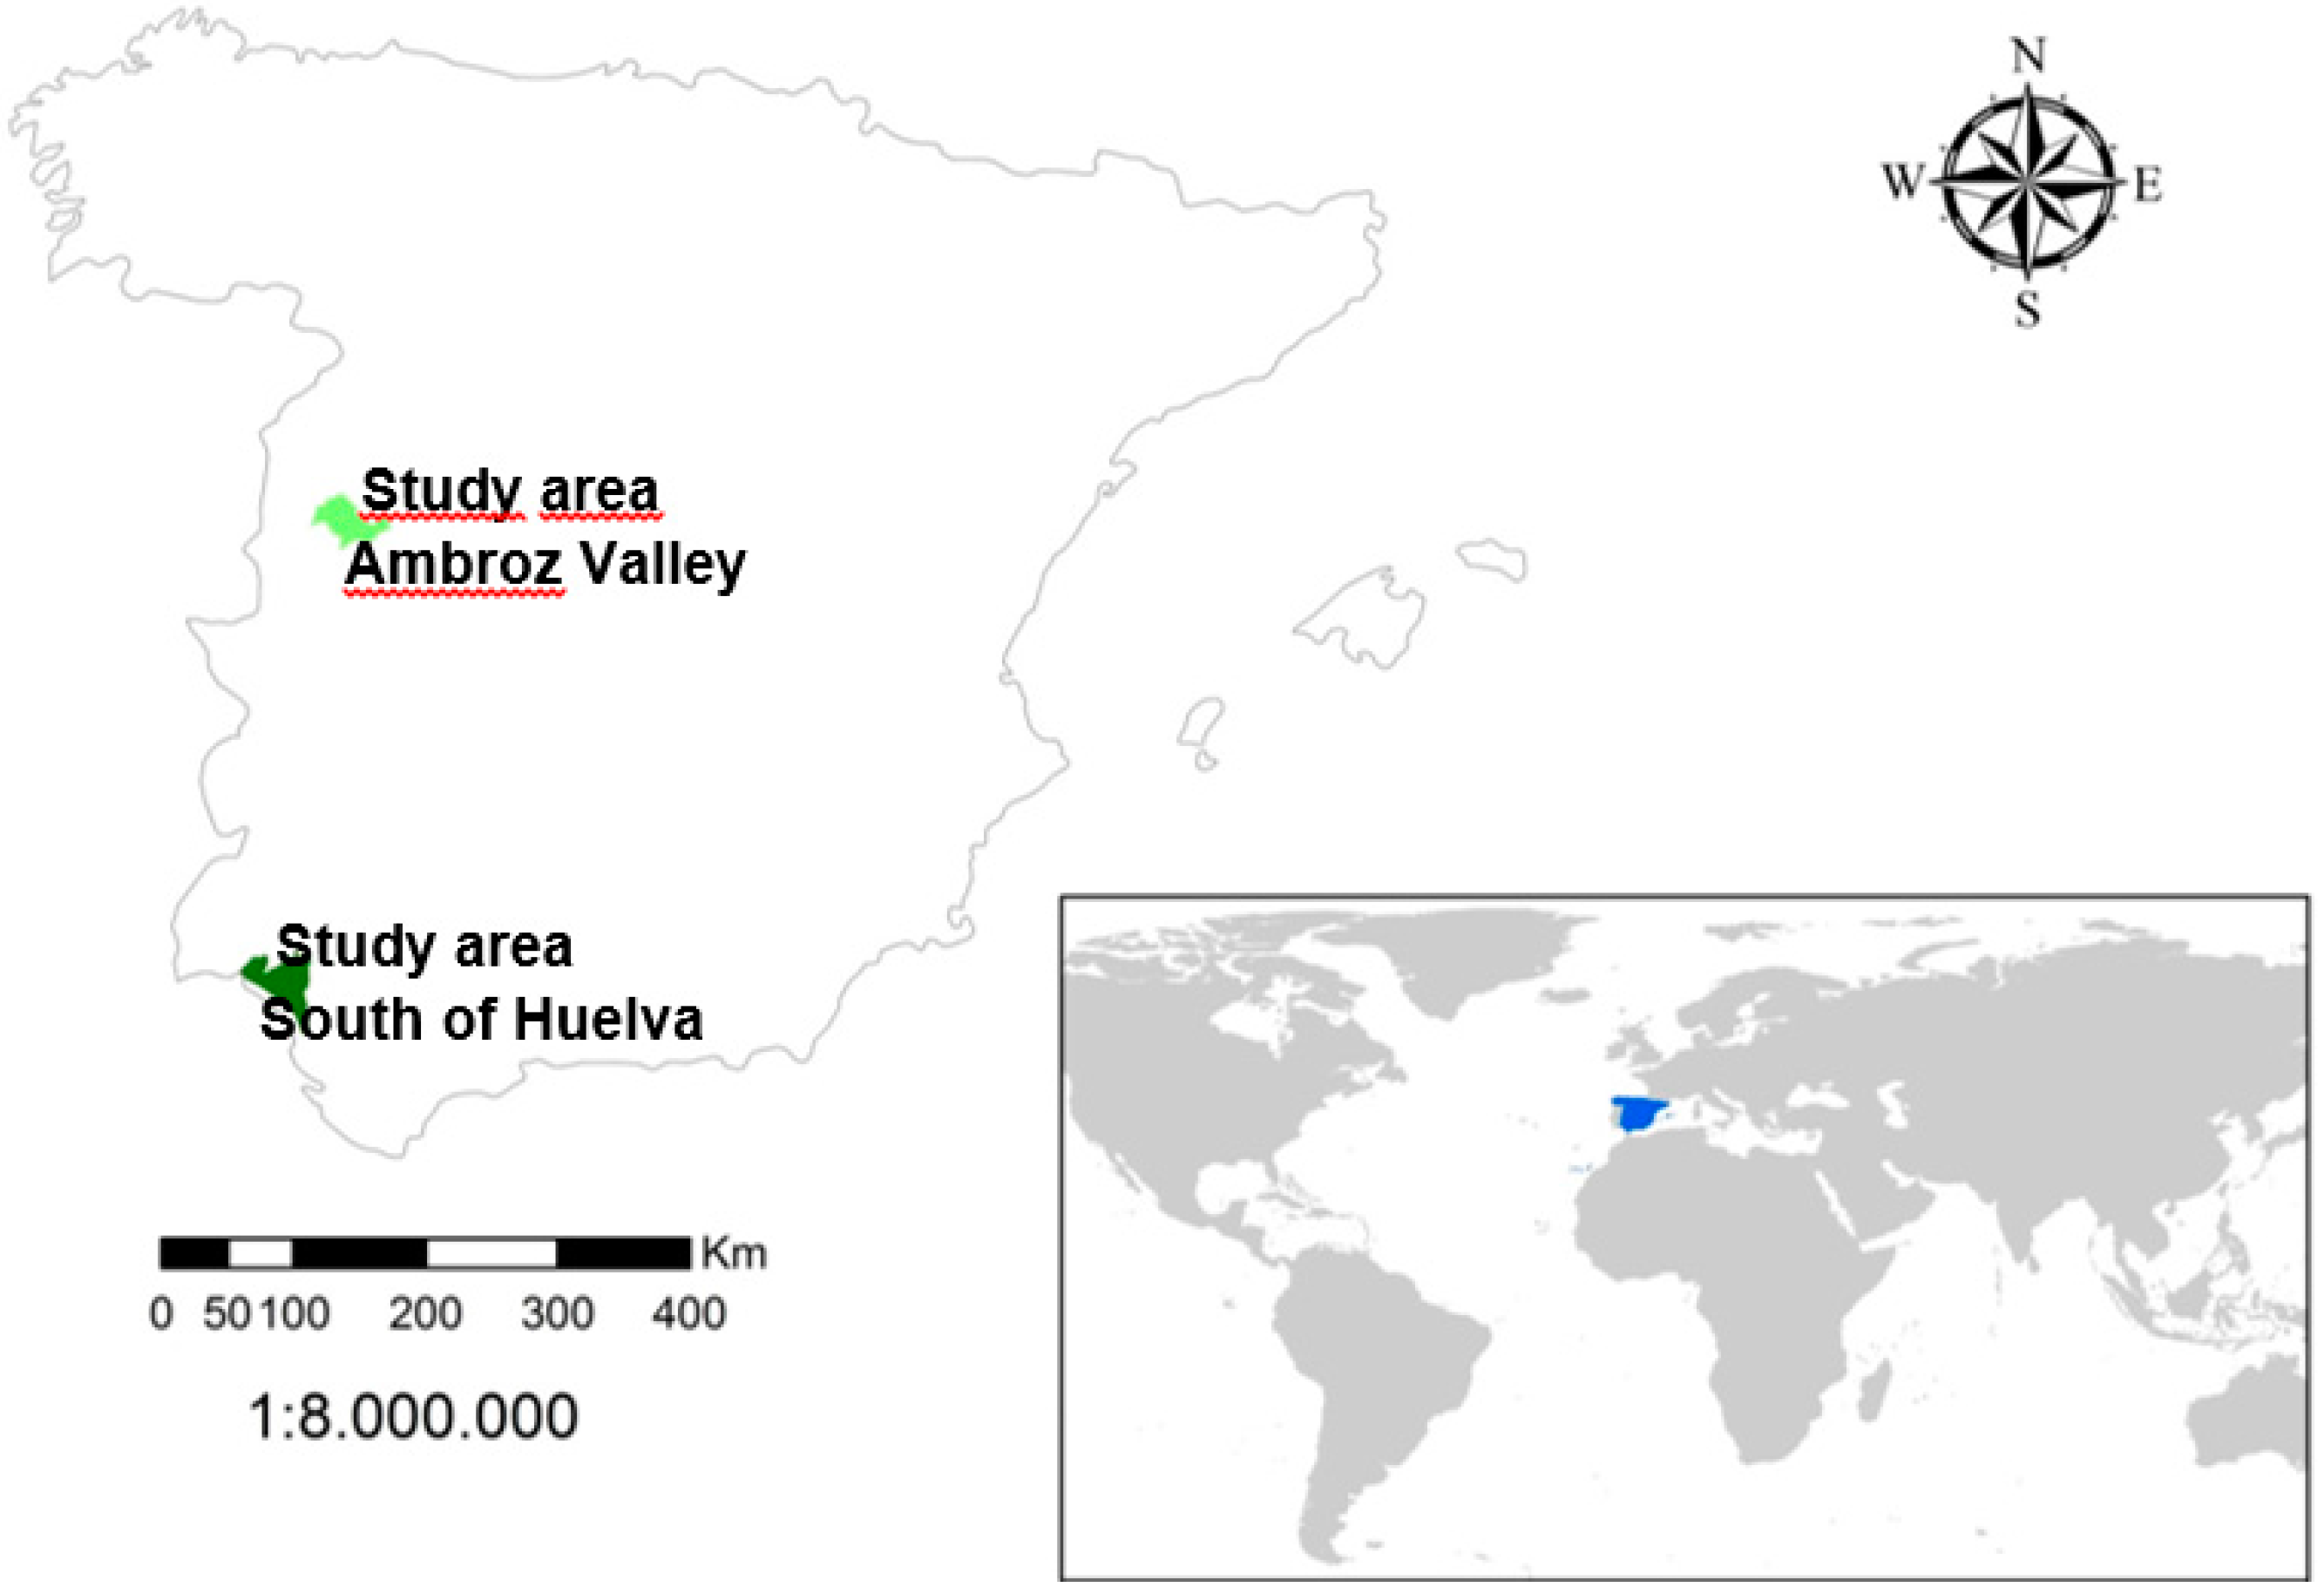
2.1. Study Areas: Plot Selection
2.1.1. Ambroz Valley Study Area
- High mountain woodland, where the climate is favourable for heather, cytisus spp, broom, high mountain pasture, moss, and lichen.
- Atlantic woodland, which is deciduous and rich in vegetation such as sweet chestnut, oak, holly, and yew.
- Mediterranean woodland, comprising holm oak and old cork oak woods, areas under crops, and irrigated flat-bottomed valleys. This system is found at lower altitudes.
2.1.2. South Huelva Study Area
2.2. Analysis of Information Gathered
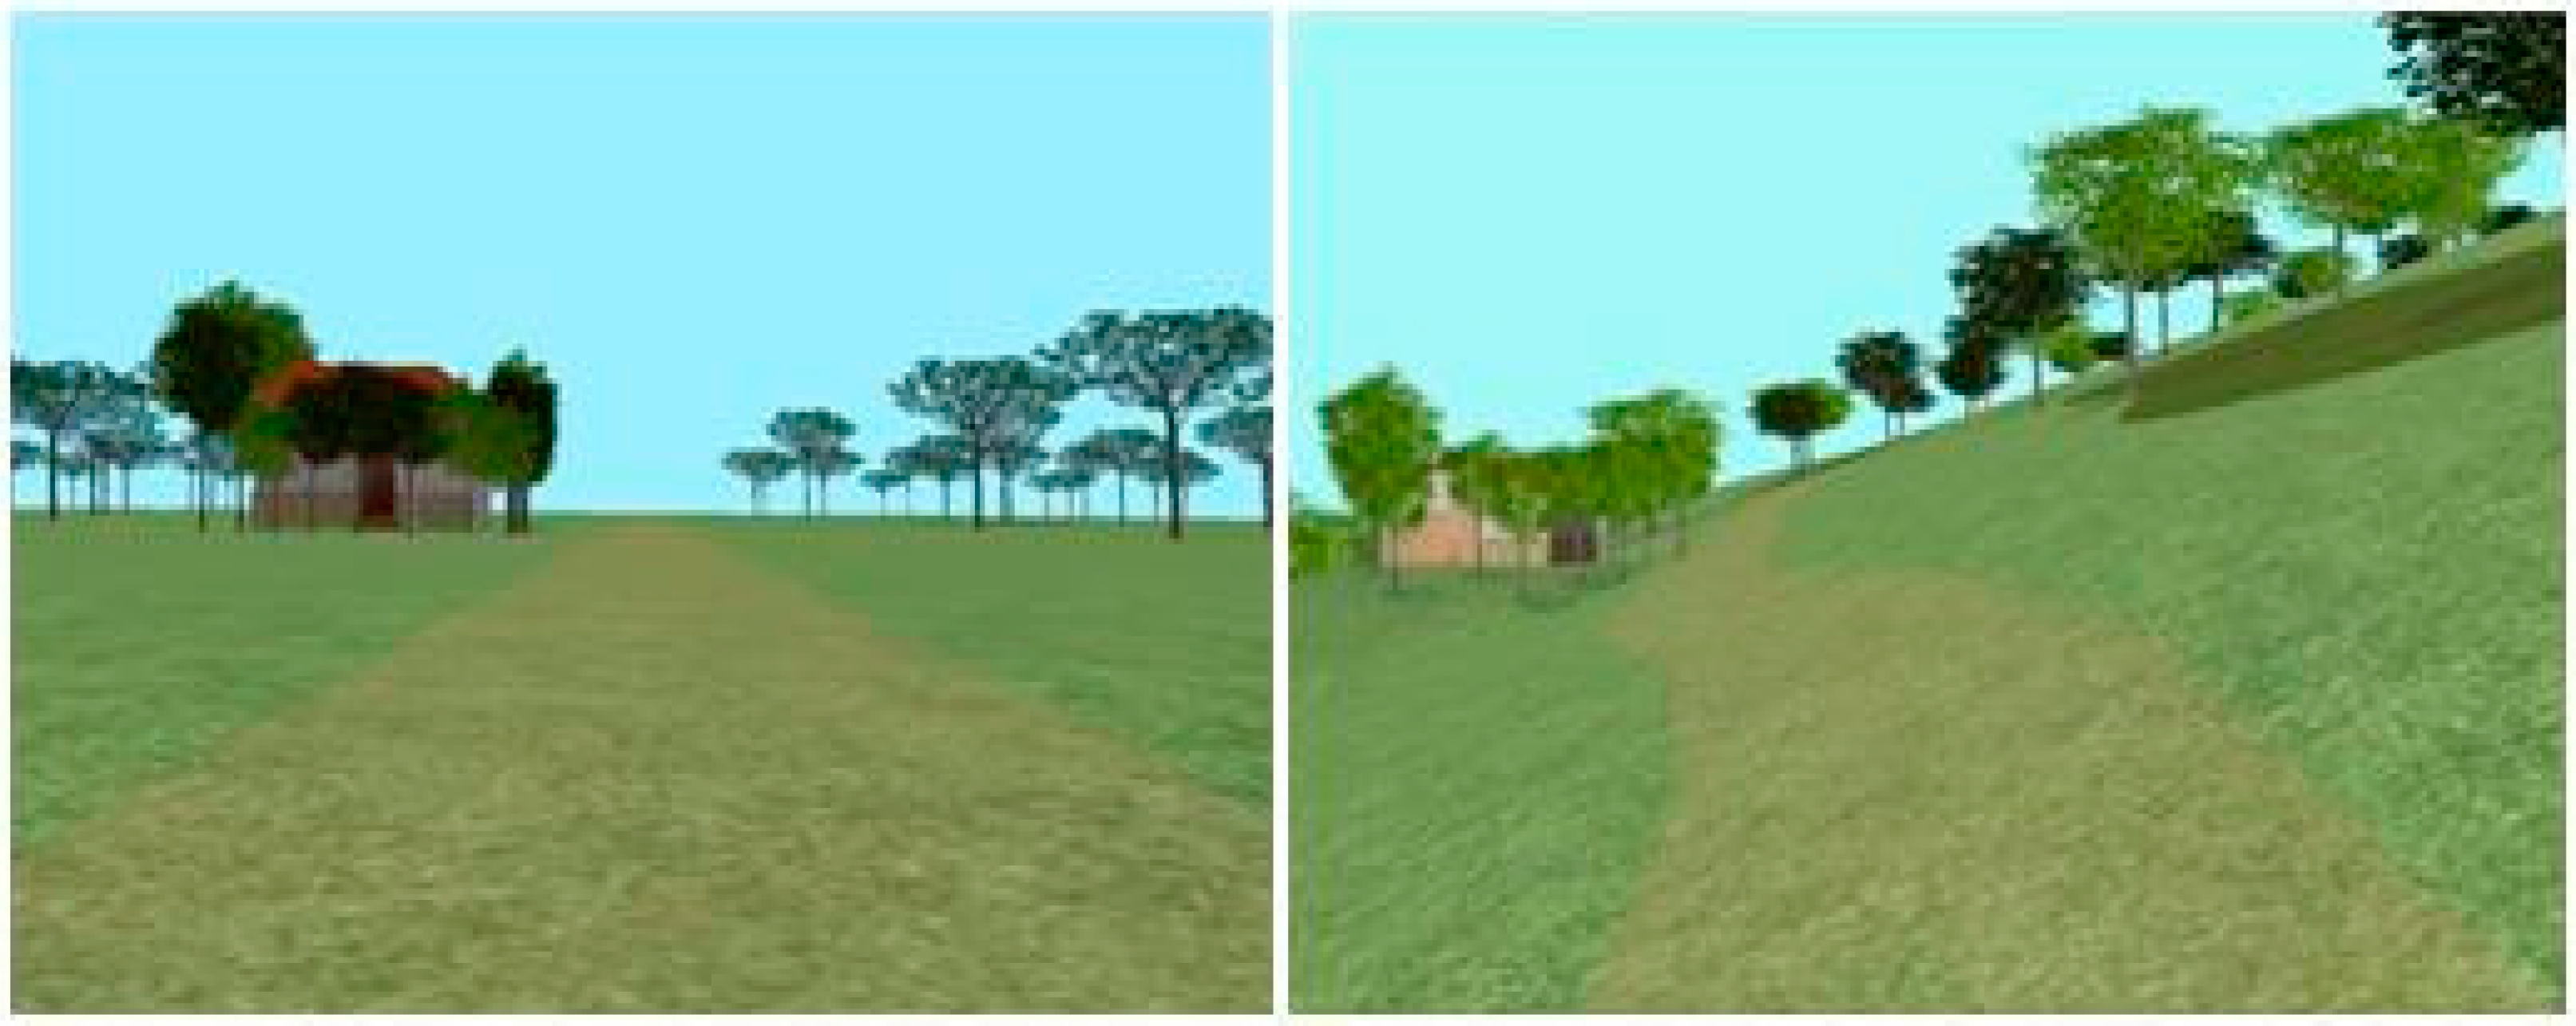
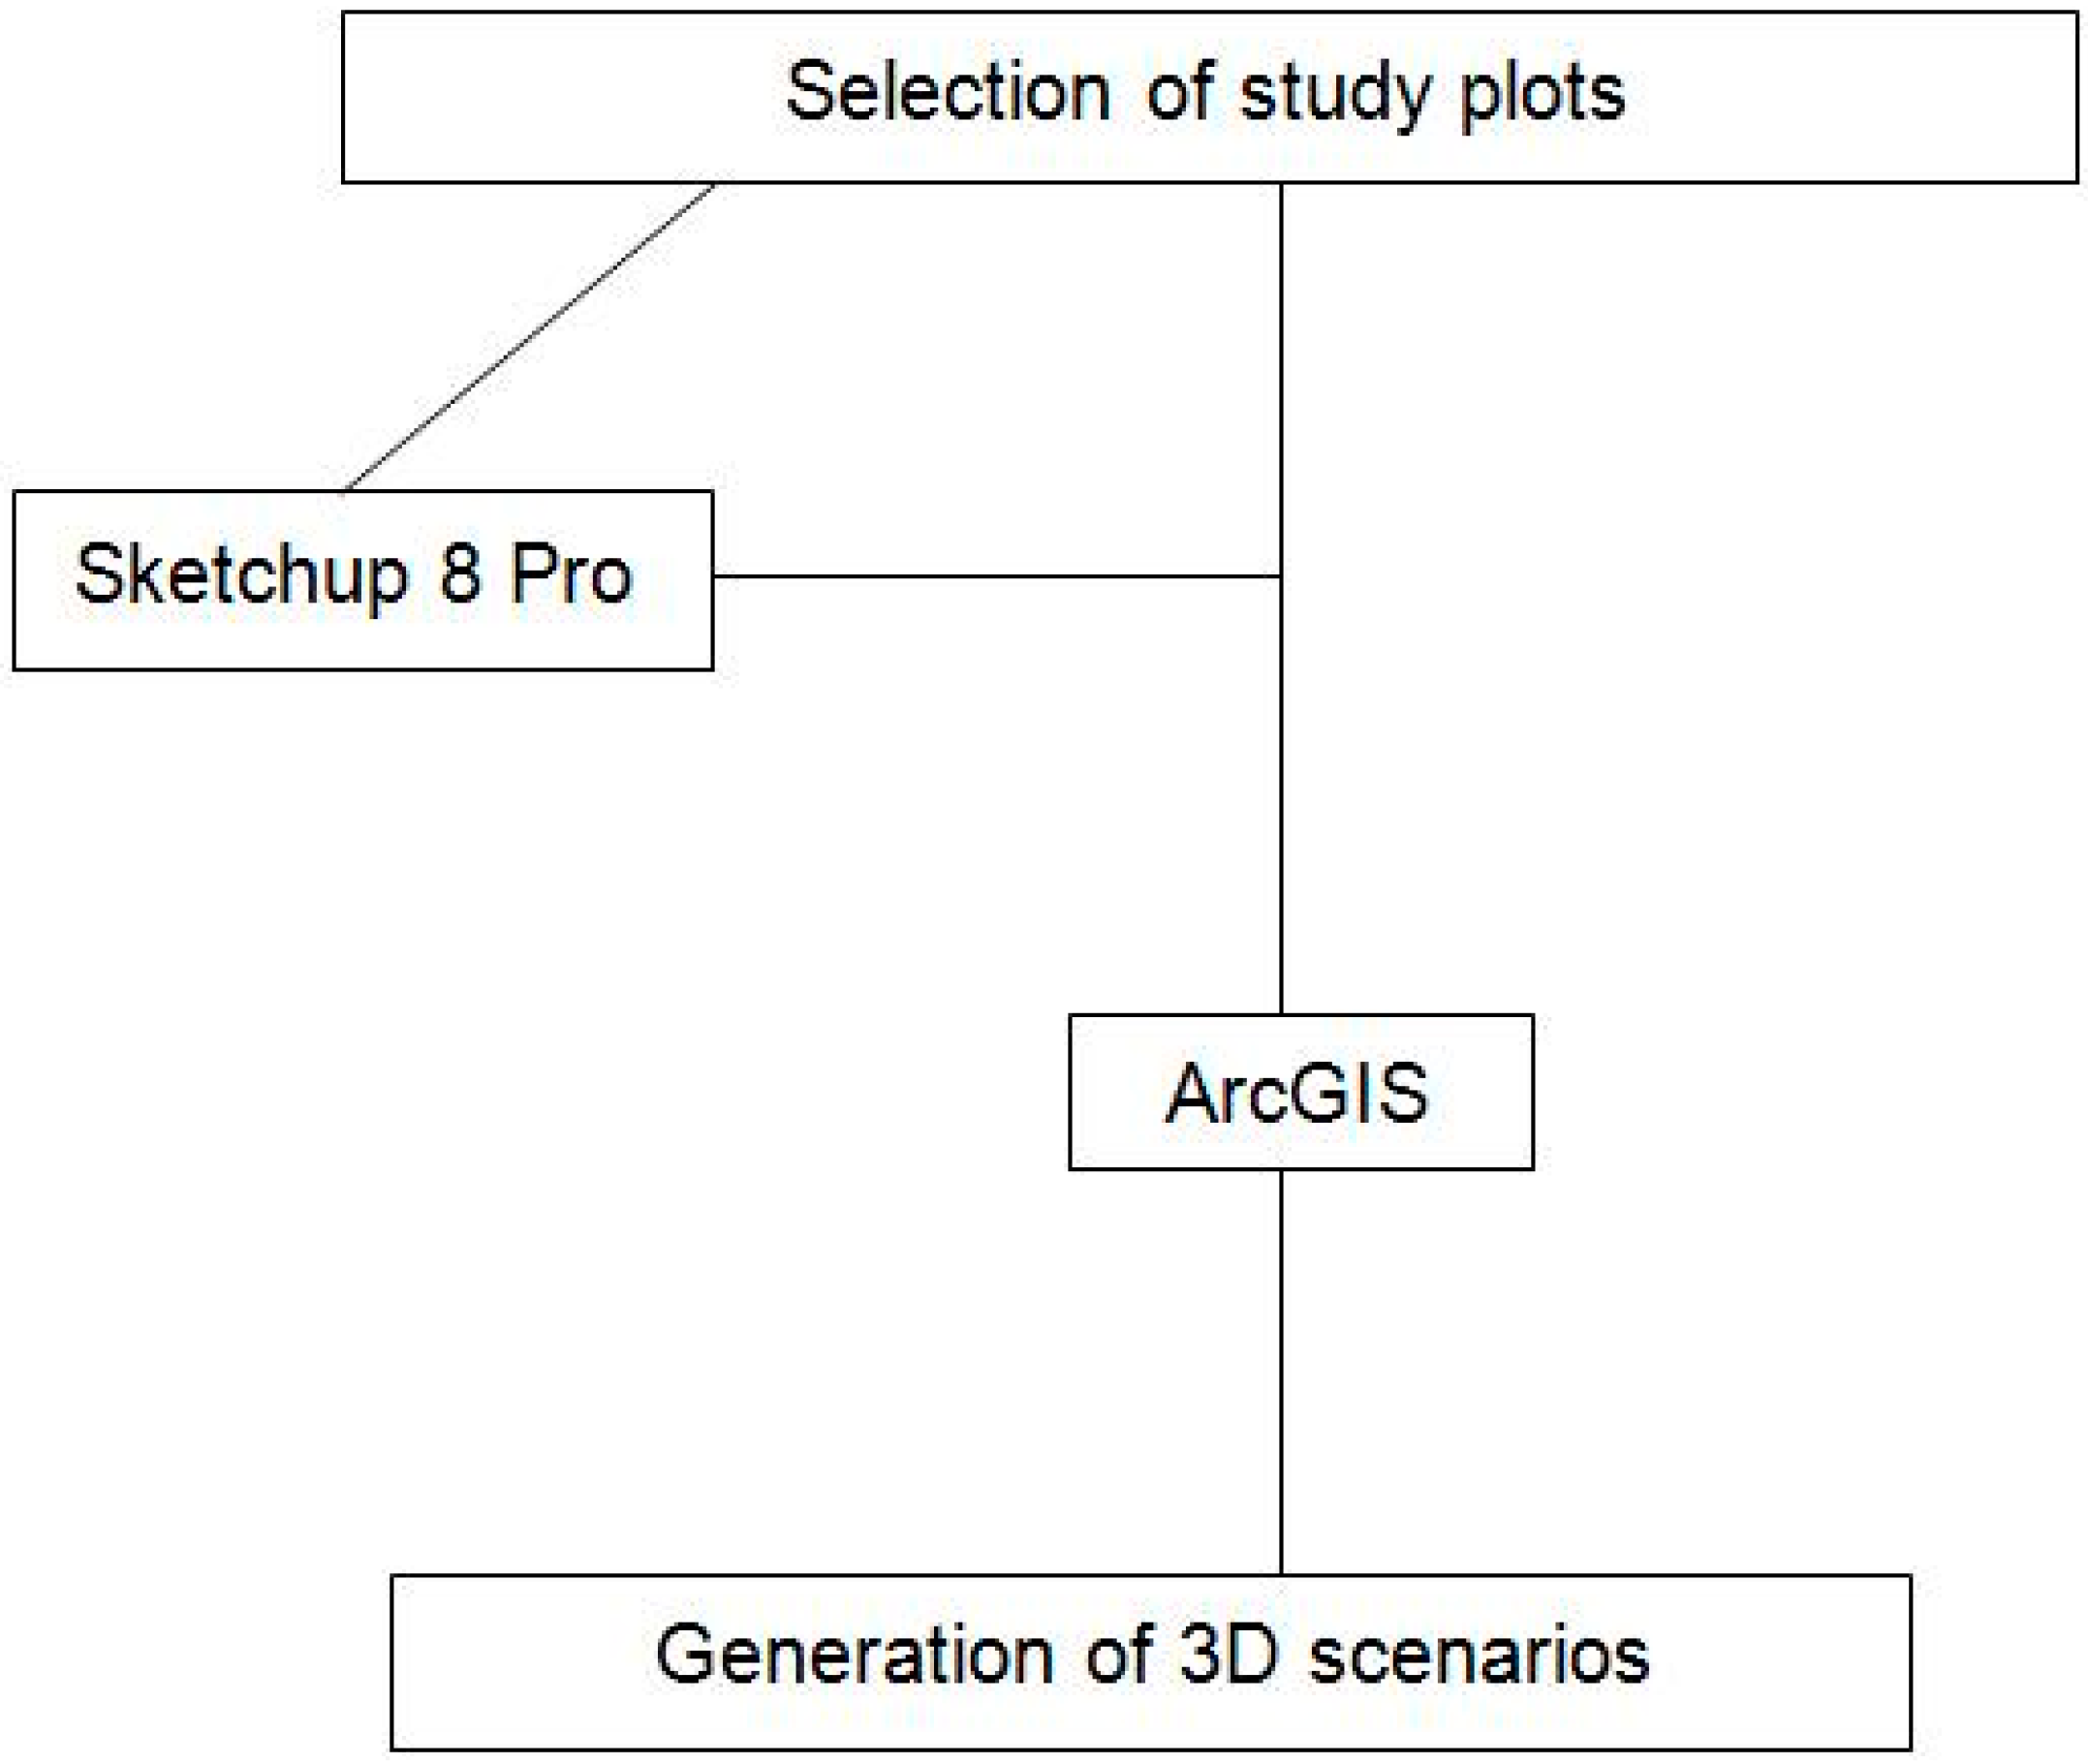
2.2.1. 3D Scenario Generation
2.2.2. Video Variations and Generation
2.3. Methodology of the Survey
Respondent Characteristics
2.4. Statistical Methodology
3. Results and Discussion
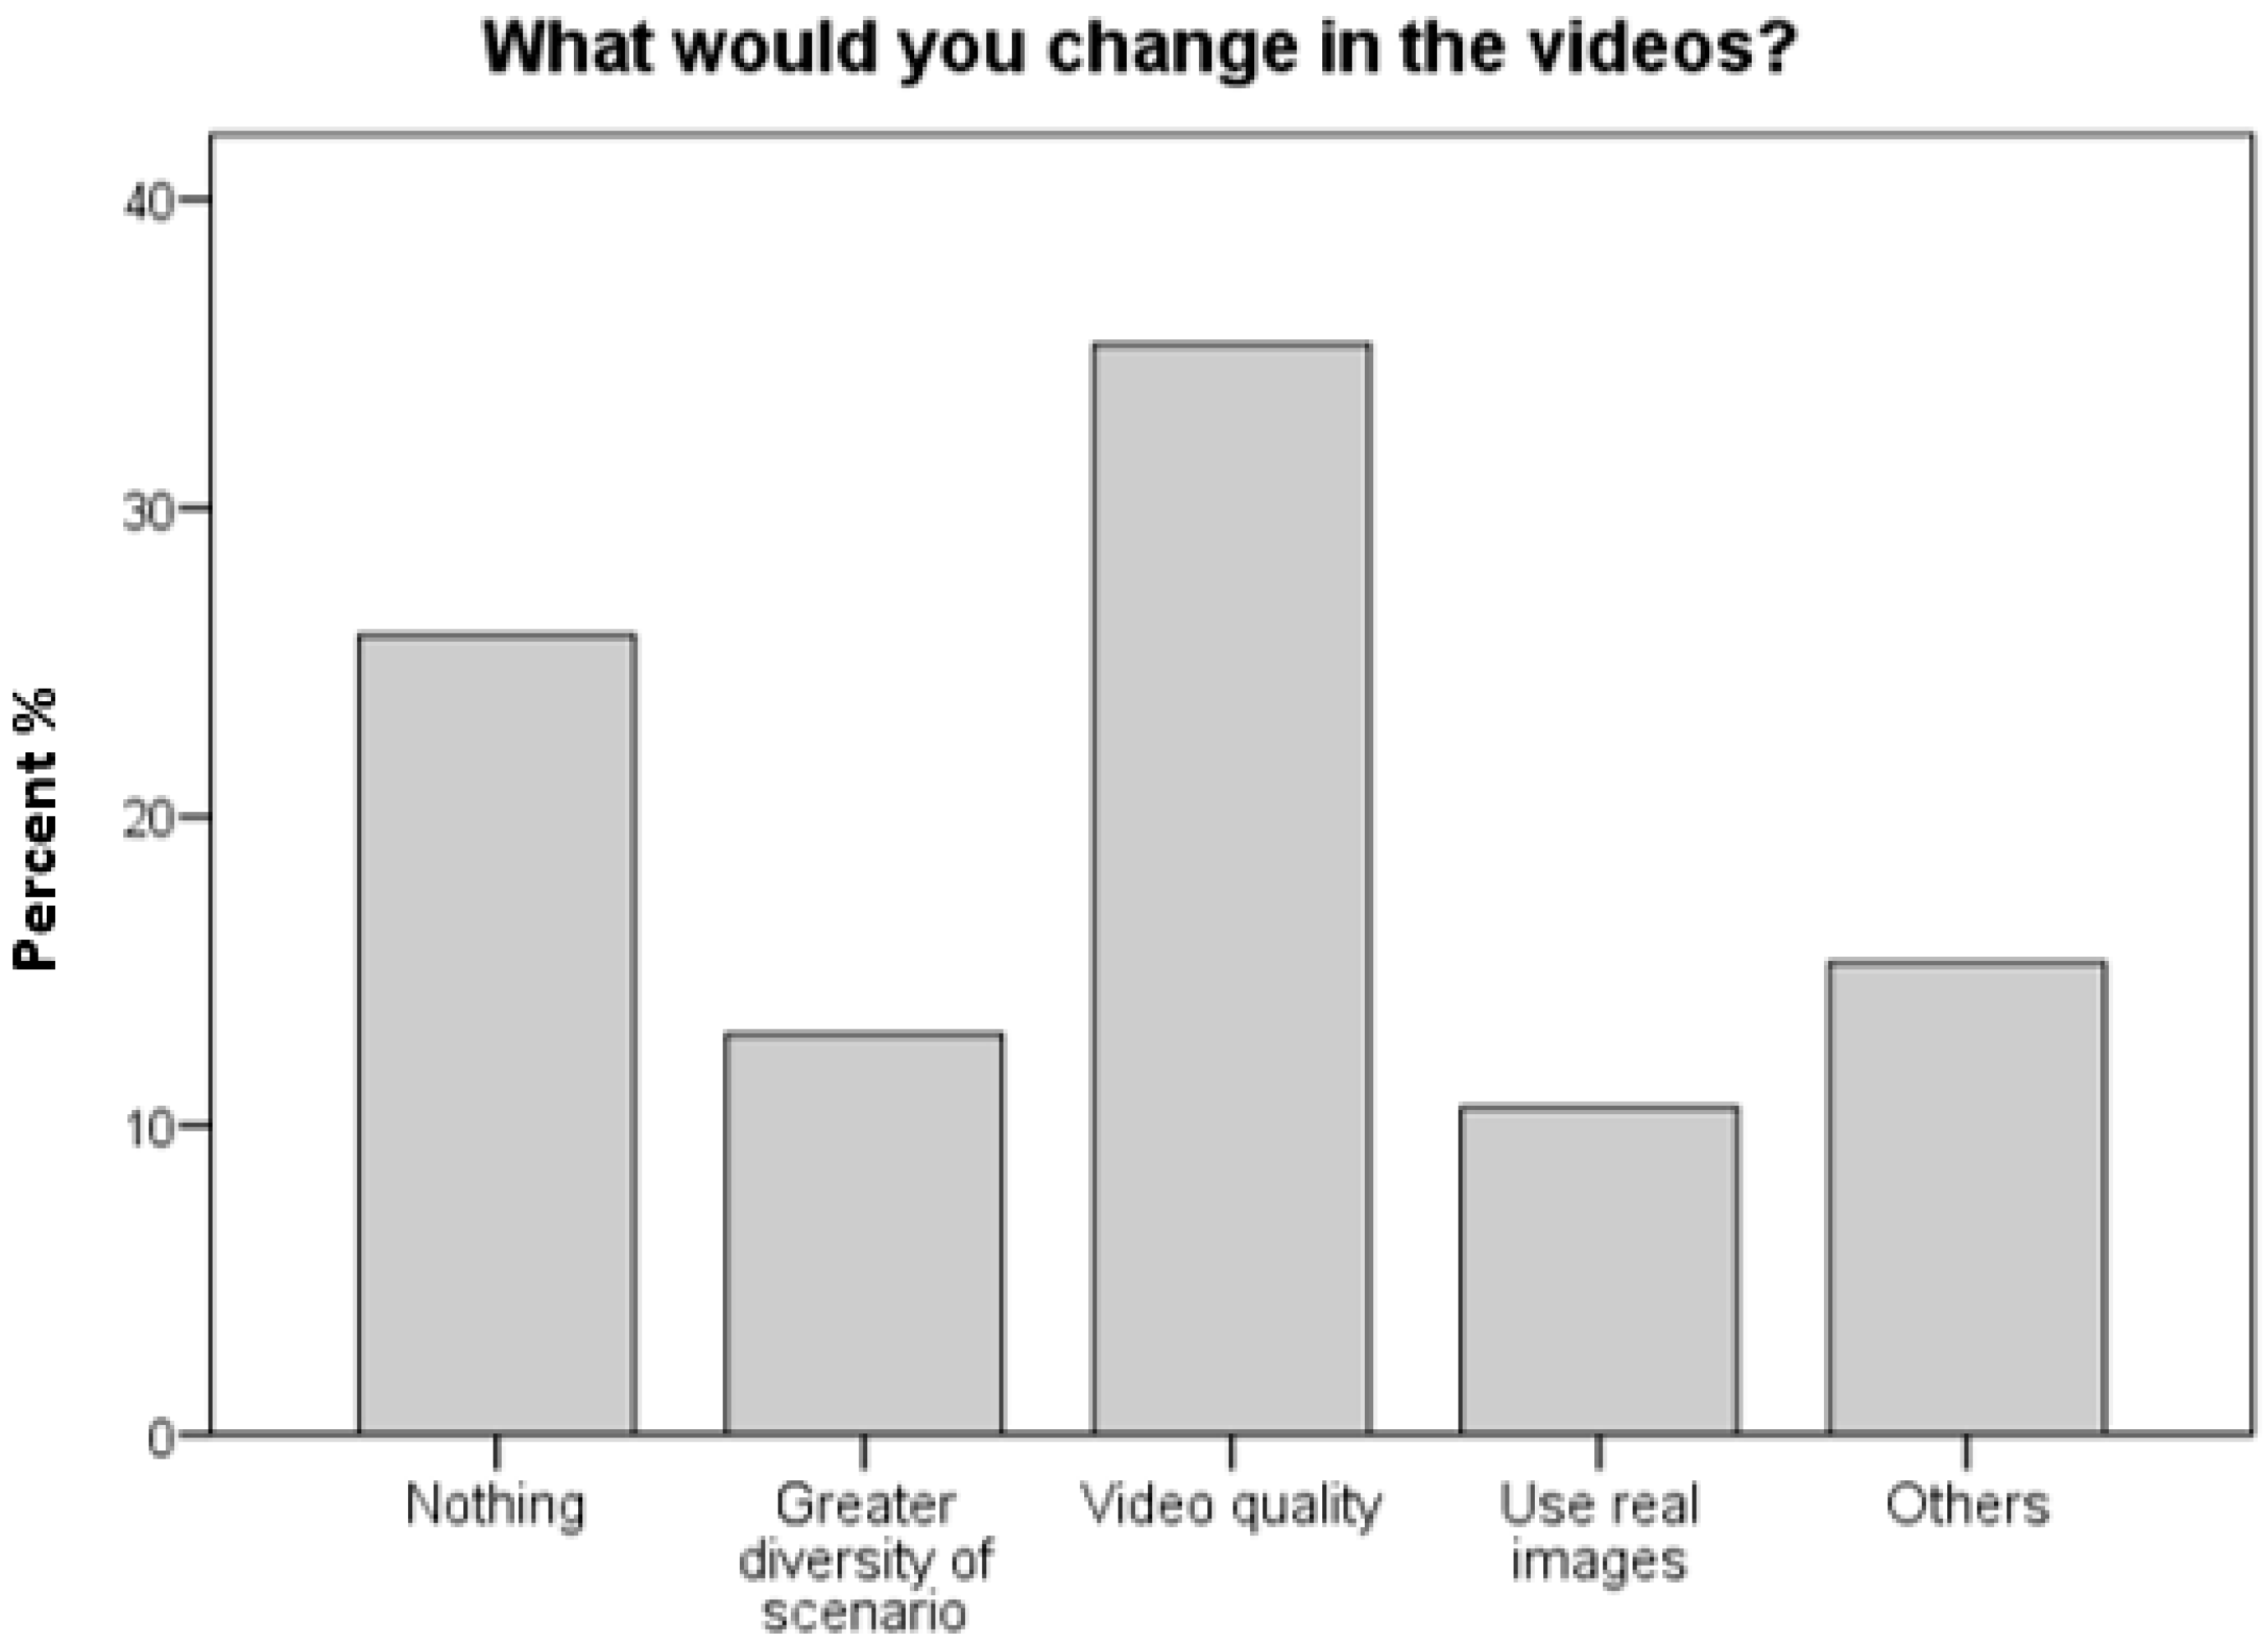
3.1. Data Analysis: North Huelva
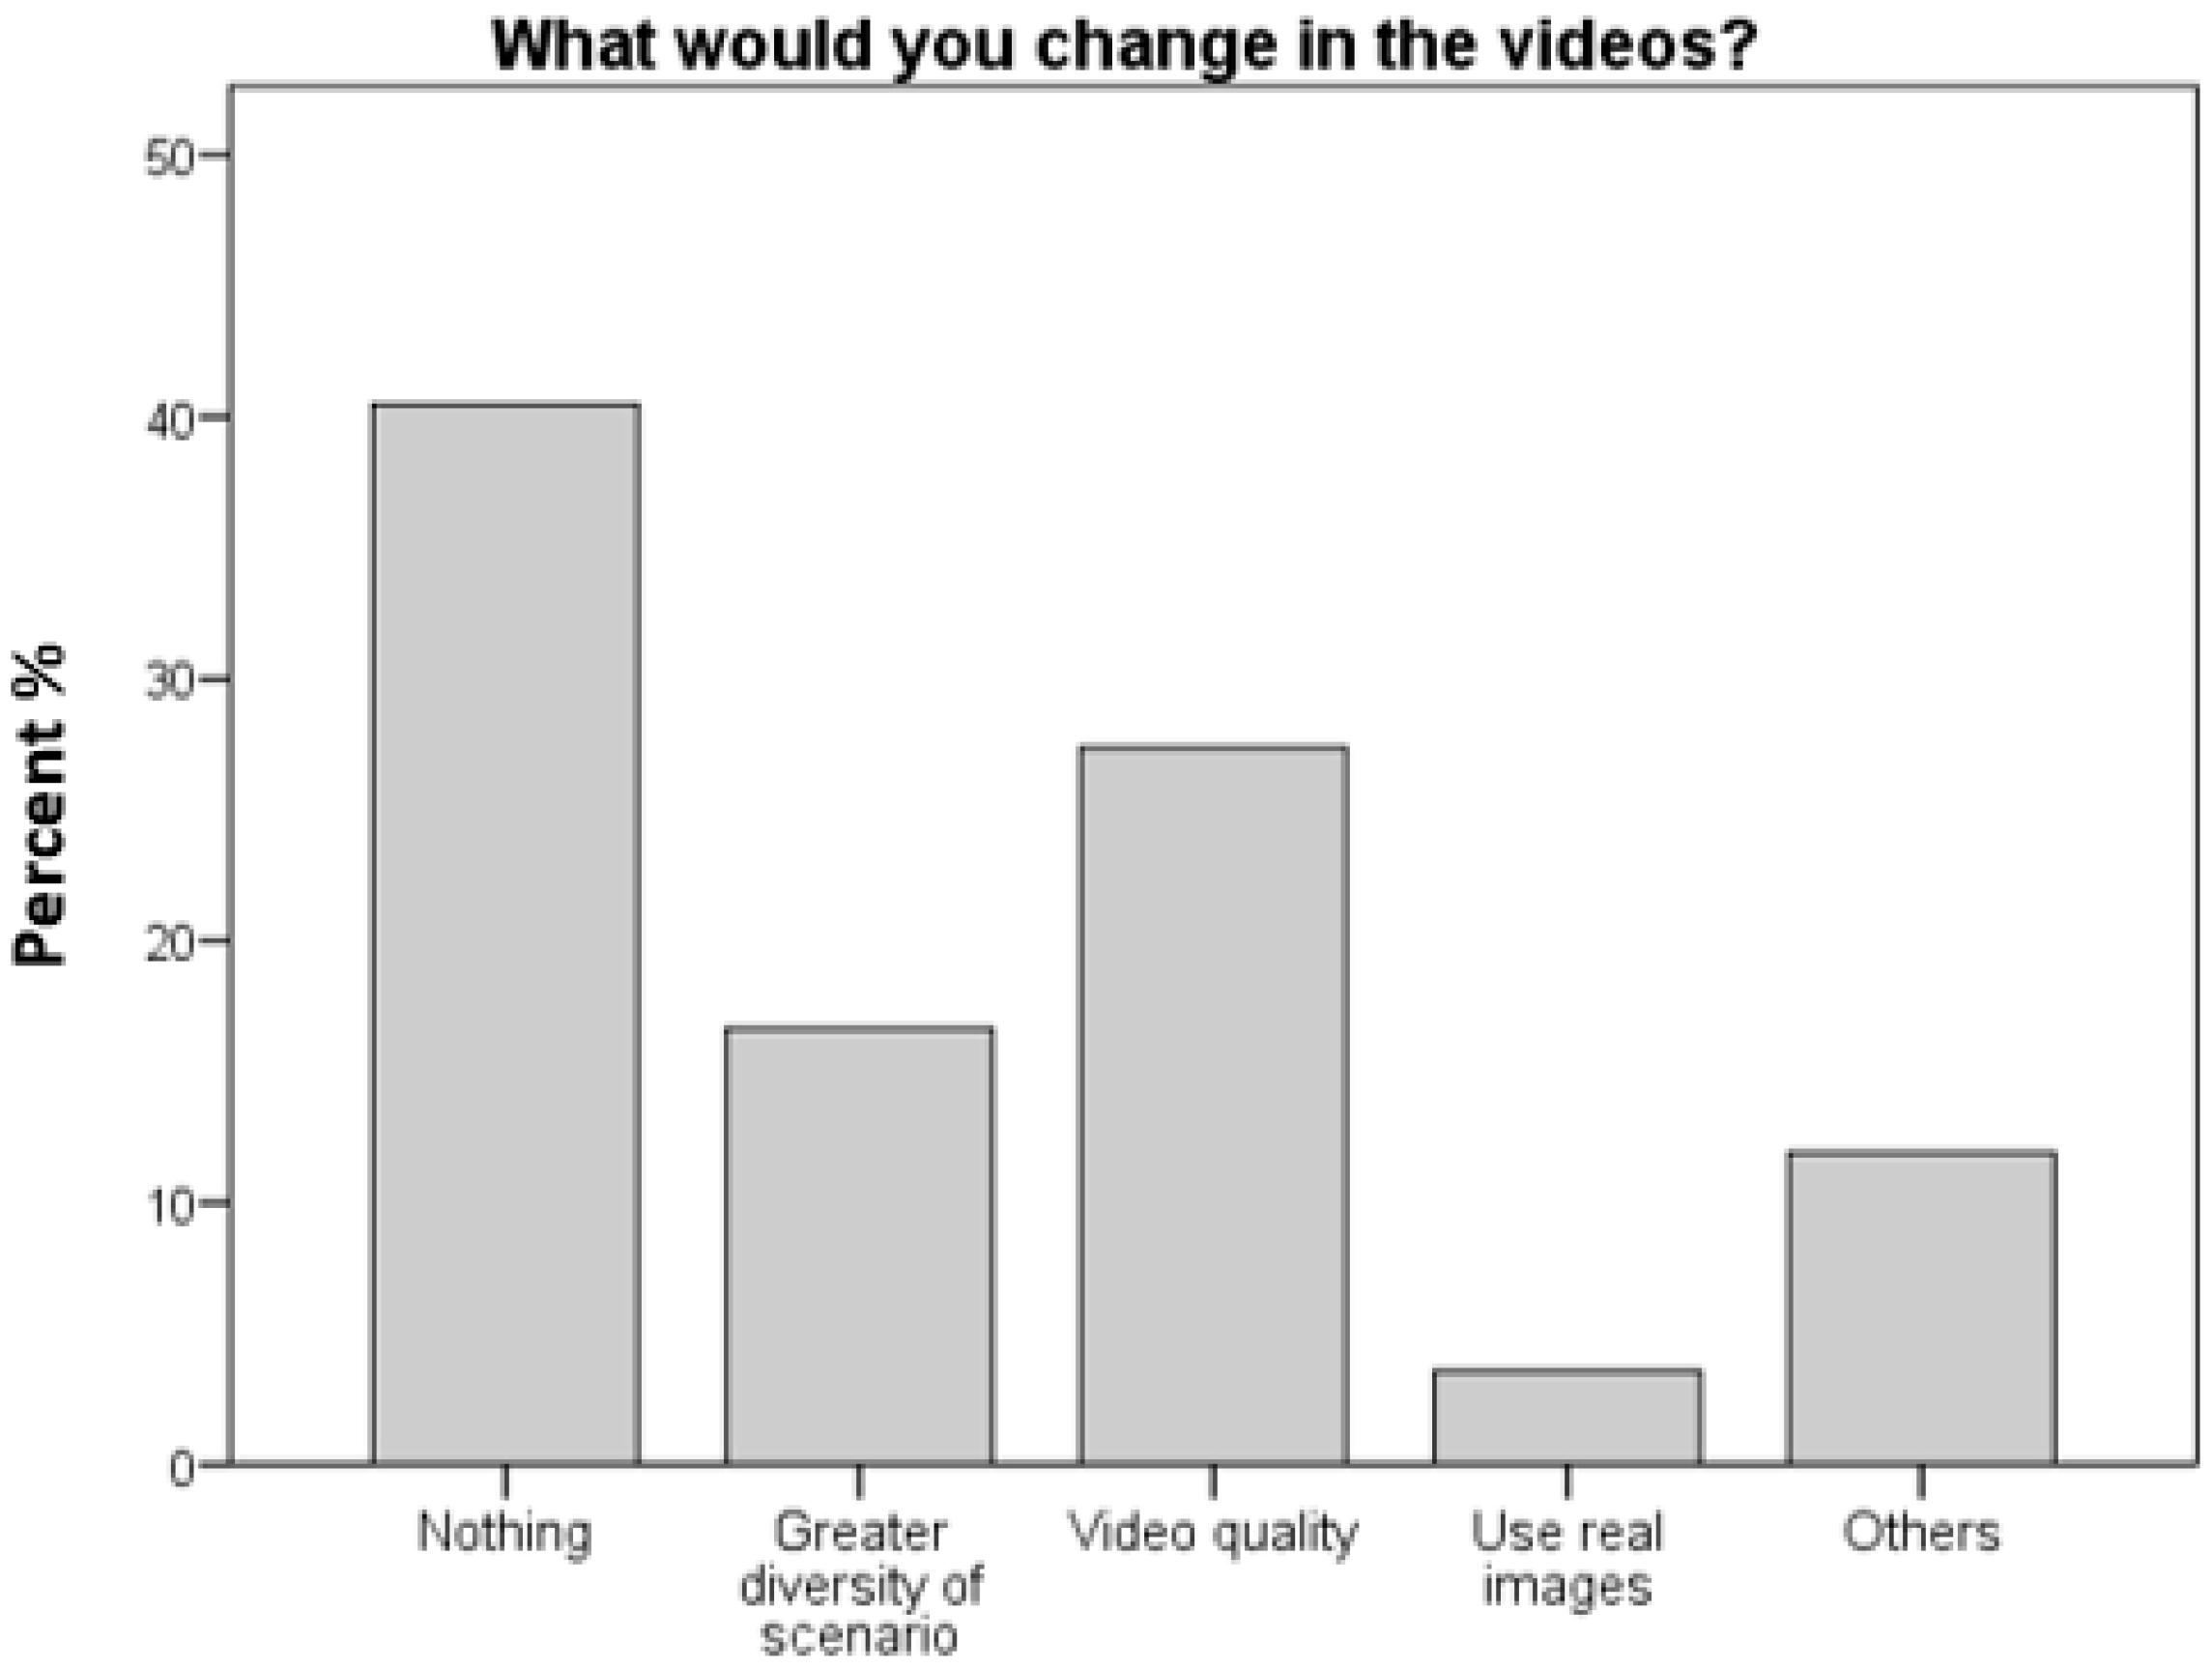
3.2. Data Analysis: North Extremadura
3.3. Conjoint Analysis of Data
4. Conclusions
5. Future Lines
- Future lines of research could be the incorporation of new native plant species, characteristic of riverine areas such as alder (Alnus glutinosa) and poplars (Populus alba), in order to expand the study areas and scenarios considered. It is also possible to advance the method of conducting the surveys, looking for not only the public opinion, but also recording their behavior and attitude during the completion of them.
- Generate an interactive virtual environment that allows respondents to modify the modeled scenarios and different elements, in addition to allowing them to freely navigate inside the modeling space.
Supplementary Materials
Supplementary File 1Acknowledgments
Author Contributions
Conflicts of Interest
References
- Schmind, W.A. The emerging role of visual resource assessment and visualization in landscape planning in Switzerland. Landsc. Urban Plan. 2001, 54, 213–221. [Google Scholar] [CrossRef]
- Tassinari, P.; Torreggiani, D.; Stefano, B. Dealing with agriculture, environment and landscape in spatial planning: A discussion about the Italian case study. Land Use Policy 2013, 30, 739–747. [Google Scholar] [CrossRef]
- García, L.; Hernández, J.; Ayuga, F. Analysis of the exterior color of agroindustrial buildings: A computer aided approach to landscape integration. J. Environ. Manag. 2003, 69, 93–104. [Google Scholar] [CrossRef]
- Hernández, J.; García, L.; Ayuga, F. Assessment of the visual impact made on the landscape by new buildings: A methodology for site selection. Landsc. Urban Plan. 2004, 68, 15–28. [Google Scholar] [CrossRef]
- Pullar, D.V.; Tidey, M.E. Coupling 3D visualization to qualitative assessment of built environment designs. Landsc. Urban Plan. 2001, 55, 29–40. [Google Scholar] [CrossRef]
- Bishop, I.D.; Lange, E. Visualization in Landscape and Environmental Planning: Technology and Applications; Taylor and Francis: London, UK, 2005. [Google Scholar]
- Español, E. Las obras Públicas en el Paisaje: Guía Para el Análisis y Evaluación del Impacto Ambiental en el Paisaje; Centro de Publicaciones, Ministerio de Fomento: Madrid, Spain, 1998. [Google Scholar]
- Lange, E.; Hehl-Lange, S.; Brewer, M.J. Scenario-visualization for the assessment of perceived green space qualities at the urban-rural fringe. J. Environ. Manag. 2008, 89, 245–256. [Google Scholar] [CrossRef] [PubMed]
- Repton, H. Observations on the Theory and Practice of Landscape Gardening: Including Some Remarks on Grecian and Gothic Architecture; Printed by T. Bensley, Bolt Court, for J. Taylor; The Architectural Library, High Holborn: London, UK, 1805. [Google Scholar]
- Lange, E. The limits of realism: perceptions of virtual landscapes. Landsc. Urban Plan. 2001, 54, 163–182. [Google Scholar] [CrossRef]
- Appleton, K.; Lovett, A.; Sünnenberg, G.; Dockerty, T. Rural landscape visualization from GIS databases: A comparison of approaches, options and problems. Comput. Environ. Urban Syst. 2002, 26, 141–162. [Google Scholar] [CrossRef]
- García, L.; Montero, M.J.; Hernández, J.; López, S. Analysis of lines and forms in buildings to rural landscape integration. Span. J. Agric. Res. 2010, 8, 833–847. [Google Scholar] [CrossRef]
- Barroso, F.L.; Pinto-Correia, T.; Ramos, I.L.; Surová, D.; Menezes, H. Dealing with landscape fuzziness in user preference studies: Photo-based questionnaires in the Mediterranean context. Landsc. Urban Plan. 2012, 104, 329–342. [Google Scholar] [CrossRef]
- Bishop, I.D. Understanding Place and Agreeing Purpose: The Role of Virtual Worlds. In Landscape Analysis and Visualisation; Springer: Berlin, Germany, 2008; pp. 457–467. [Google Scholar]
- Lange, E. 99 volumes later: We can visualize. Now What? Landsc. Urban Plan. 2011, 100, 403–406. [Google Scholar] [CrossRef]
- Sheppard, S.R.J.; Cizek, P. The ethics of Google Earth: Crossing thresholds from spatial data to landscape visualization. J. Environ. Manag. 2009, 90, 2102–2117. [Google Scholar] [CrossRef] [PubMed]
- Layar. The Layar App. Available online: http://www.layar.com/products/app/_ (accessed on 13 July 2014).
- Lovett, A.; Appleton, K.; Warren-Kretzchmar, B.; Von Haaren, C. Using 3D visualization methods in landscape planning: An evaluation of options and practical issues. Landsc. Urban Plan. 2015, 142, 85–94. [Google Scholar] [CrossRef]
- Conniff, A.; Craig, T.; Laing, R.; Galán-Díaz, C. A comparison of active navigation and passive observation of desktop models of future built environments. Des. Stud. 2010, 31, 419–438. [Google Scholar] [CrossRef]
- Gosling, D. Techniques of analysis and communication in urban design. Landsc. Urban Plan. 1993, 26, 215–230. [Google Scholar] [CrossRef]
- Heft, H.; Nasar, J.L. Evaluating environmental scenes using dynamic versus static displays. Environ. Behav. 2000, 32, 301–322. [Google Scholar] [CrossRef]
- Samavatekbatan, A.; Gholami, S.; Karimimoshaver, M. Assessing the visual impact of physical features of tall buildings: Height, top, color. Environ. Impact Assess. Rev. 2016, 57, 53–62. [Google Scholar] [CrossRef]
- Chang, H.; Gao, J.; Pan, P. Experiment and research of Google SketchUp combine with ArcGIS in the Three-Dimensional urban geographic information system. In Proceedings of the World Congress on Software Engineering, Xiamen, China, 19–21 May 2009. [Google Scholar]
- Li, J.; Ying, B.; Yang, W.; Ning, Z.; Cui, W. The application of ArcGIS and SketchUp in the virtual campus construction (Case of Shanxi Normal University). In Proceedings of the International Conference on Multimedia Technology (ICMT), Hangzhou, China, 26–28 July 2011. [Google Scholar]
- Steinits, C.; Anderson, R.; Arias, H.; Bassett, S.; Flaxman, M.; Goode, T.; Maddock, T.; Mouat, D.; Peiser, R.; Shearer, A. Alternative Futures for Landscapes in the Upper San Pedro River Basin of Arizona and Sonora; Island Press: Washington, DC, USA, 2005; pp. 93–100. [Google Scholar]
- Ringland, G. Scenario Planning: Managing for the Future; John Wiley & Sons: Chichester, UK, 1998. [Google Scholar]
- Montero, M.J.; García-Moruno, L.; López-Casares, S.; Hernández Blanco, J. Visual impact assessment of color and scale of buildings on the rural landscape. Environ. Eng. Manag. J. 2016, 15, 1537–1550. [Google Scholar]
- Ghadirian, P.; Bishop, I.D. Integration of augmented reality and GIS: A new approach to realistic landscape visualization. Landsc. Urban Plan. 2008, 86, 226–232. [Google Scholar] [CrossRef]
- Zhang, S.; Huang, X. Development of virtual Campus System Based on ArcGIS. Phys. Procedia 2012, 33, 1133–1139. [Google Scholar] [CrossRef]
- Hayek, W.U. Which is the appropriate 3D visualization type for participatory landscape planning workshops? A portfolio of their effectiveness. Environ. Plan. B Plan. Des. 2011, 38, 921–939. [Google Scholar] [CrossRef]
- Chen, Z.; Xu, B.; Devereux, B. Urban landscape pattern analysis based on 3D landscape models. Appl. Geogr. 2014, 55, 82–91. [Google Scholar] [CrossRef]
- Gill, L.; Lange, E. Getting virtual 3D landscapes out of the lab. Comput. Environ. Urban Syst. 2015, 54, 356–362. [Google Scholar] [CrossRef]
- Lindquist, M.; Lange, E.; Kang, J. From 3D landscape visualization to environmental simulation: The contribution of sound to the perception of virtual environments. Landsc. Urban Plan. 2016, 148, 216–231. [Google Scholar] [CrossRef]
- Nasar, J.L.; Stamps-III, A.E. Infill McMansions: Style and the psychophysics of size. J. Environ. Psychol. 2009, 29, 110–123. [Google Scholar] [CrossRef]
- Wherrett, J.R. Creating landscape preference models using internet survey techniques. Landsc. Res. 2000, 25, 79–96. [Google Scholar] [CrossRef]
- Arriaza, M.; Cañas-Ortega, J.F.; Cañas-Madueño, J.A.; Ruiz-Avilés, P. Assessing the visual quality of rural landscapes. Landsc. Urban Plan. 2004, 69, 115–125. [Google Scholar] [CrossRef]
- Paar, P. Landscape visualizations: Applications and requirements of 3D visualization software for environmental planning. Comput. Environ. Urban Syst. 2006, 30, 815–839. [Google Scholar] [CrossRef]
- Christopher, J.P.; Christopher, M.R.; Brett, A.B.; Hayden, L. Identifying strengths and weaknesses of landscape visualisation for effective communication of future alternatives. Landsc. Urban Plan. 2011, 100, 231–241. [Google Scholar]
- Pinto-Correia, T.; Barroso, F.; Surová, D.; Menezes, H. The fuzziness of Montado landscapes: Progress in assessing user preferences through photo-based surveys. Agrofor. Syst. 2011, 82, 209–224. [Google Scholar] [CrossRef]
- Roth, M. Validating the use of Internet survey techniques in visual landscape assessment-An empirical study from Germany. Landsc. Urban Plan. 2006, 78, 179–192. [Google Scholar] [CrossRef]
- Stamps, A.E.; Nasar, J.L. Design review and public preferences: effects of geographical location, public consensus, sensation seeking, and architectural styles. J. Environ. Psychol. 1997, 17, 11–32. [Google Scholar] [CrossRef]
- Appleton, K.; Lovett, A. GIS-based visualization of rural landscapes: Defining “sufficient” realism for environmental decision-making. Landsc. Urban Plan. 2003, 65, 117–131. [Google Scholar] [CrossRef]
- Perkins, N.H. Three questions on the use of photo-realistic simulations as real world surrogates. Landsc. Urban Plan. 1992, 21, 265–267. [Google Scholar] [CrossRef]
- Cubuku, E. Does the level of visual detail in virtual environments affect the user’s spatial knowledge? Environ. Plan. B Plan. Des. 2011, 38, 741–752. [Google Scholar] [CrossRef]
- Reyes-Rodriguez, A.M. Criterios de Diseño de las Construcciones Rurales Atendiendo a Los Costes de sus Acabados y a su Integración en el Paisaje. Ph.D. Thesis, University of Extremadura, Badajoz, Spain, 2009. [Google Scholar]
- Smardon, R.C. Perception and Aesthetics of the Urban Environment: Review of the Role of Vegetation. Landsc. Urban Plan. 1988, 15, 85–106. [Google Scholar] [CrossRef]
- Hernández, J.; García, L.; Morán, J.; Juan, A.; Ayuga, F. Estimating visual perception of rural landscapes: The influence of vegetation. The case of Elsa Valley (Spain). J. Food Agric. Environ. 2003, 1, 139–141. [Google Scholar]


| Capital Letter | Open Air Activity | Speed and Duration |
|---|---|---|
| A | Simulating a person walking | 60 s |
| B | Simulating a person cycling or horse-riding | 40 s |
| C | Simulating a person on quad, motorbike, car | 20 s |
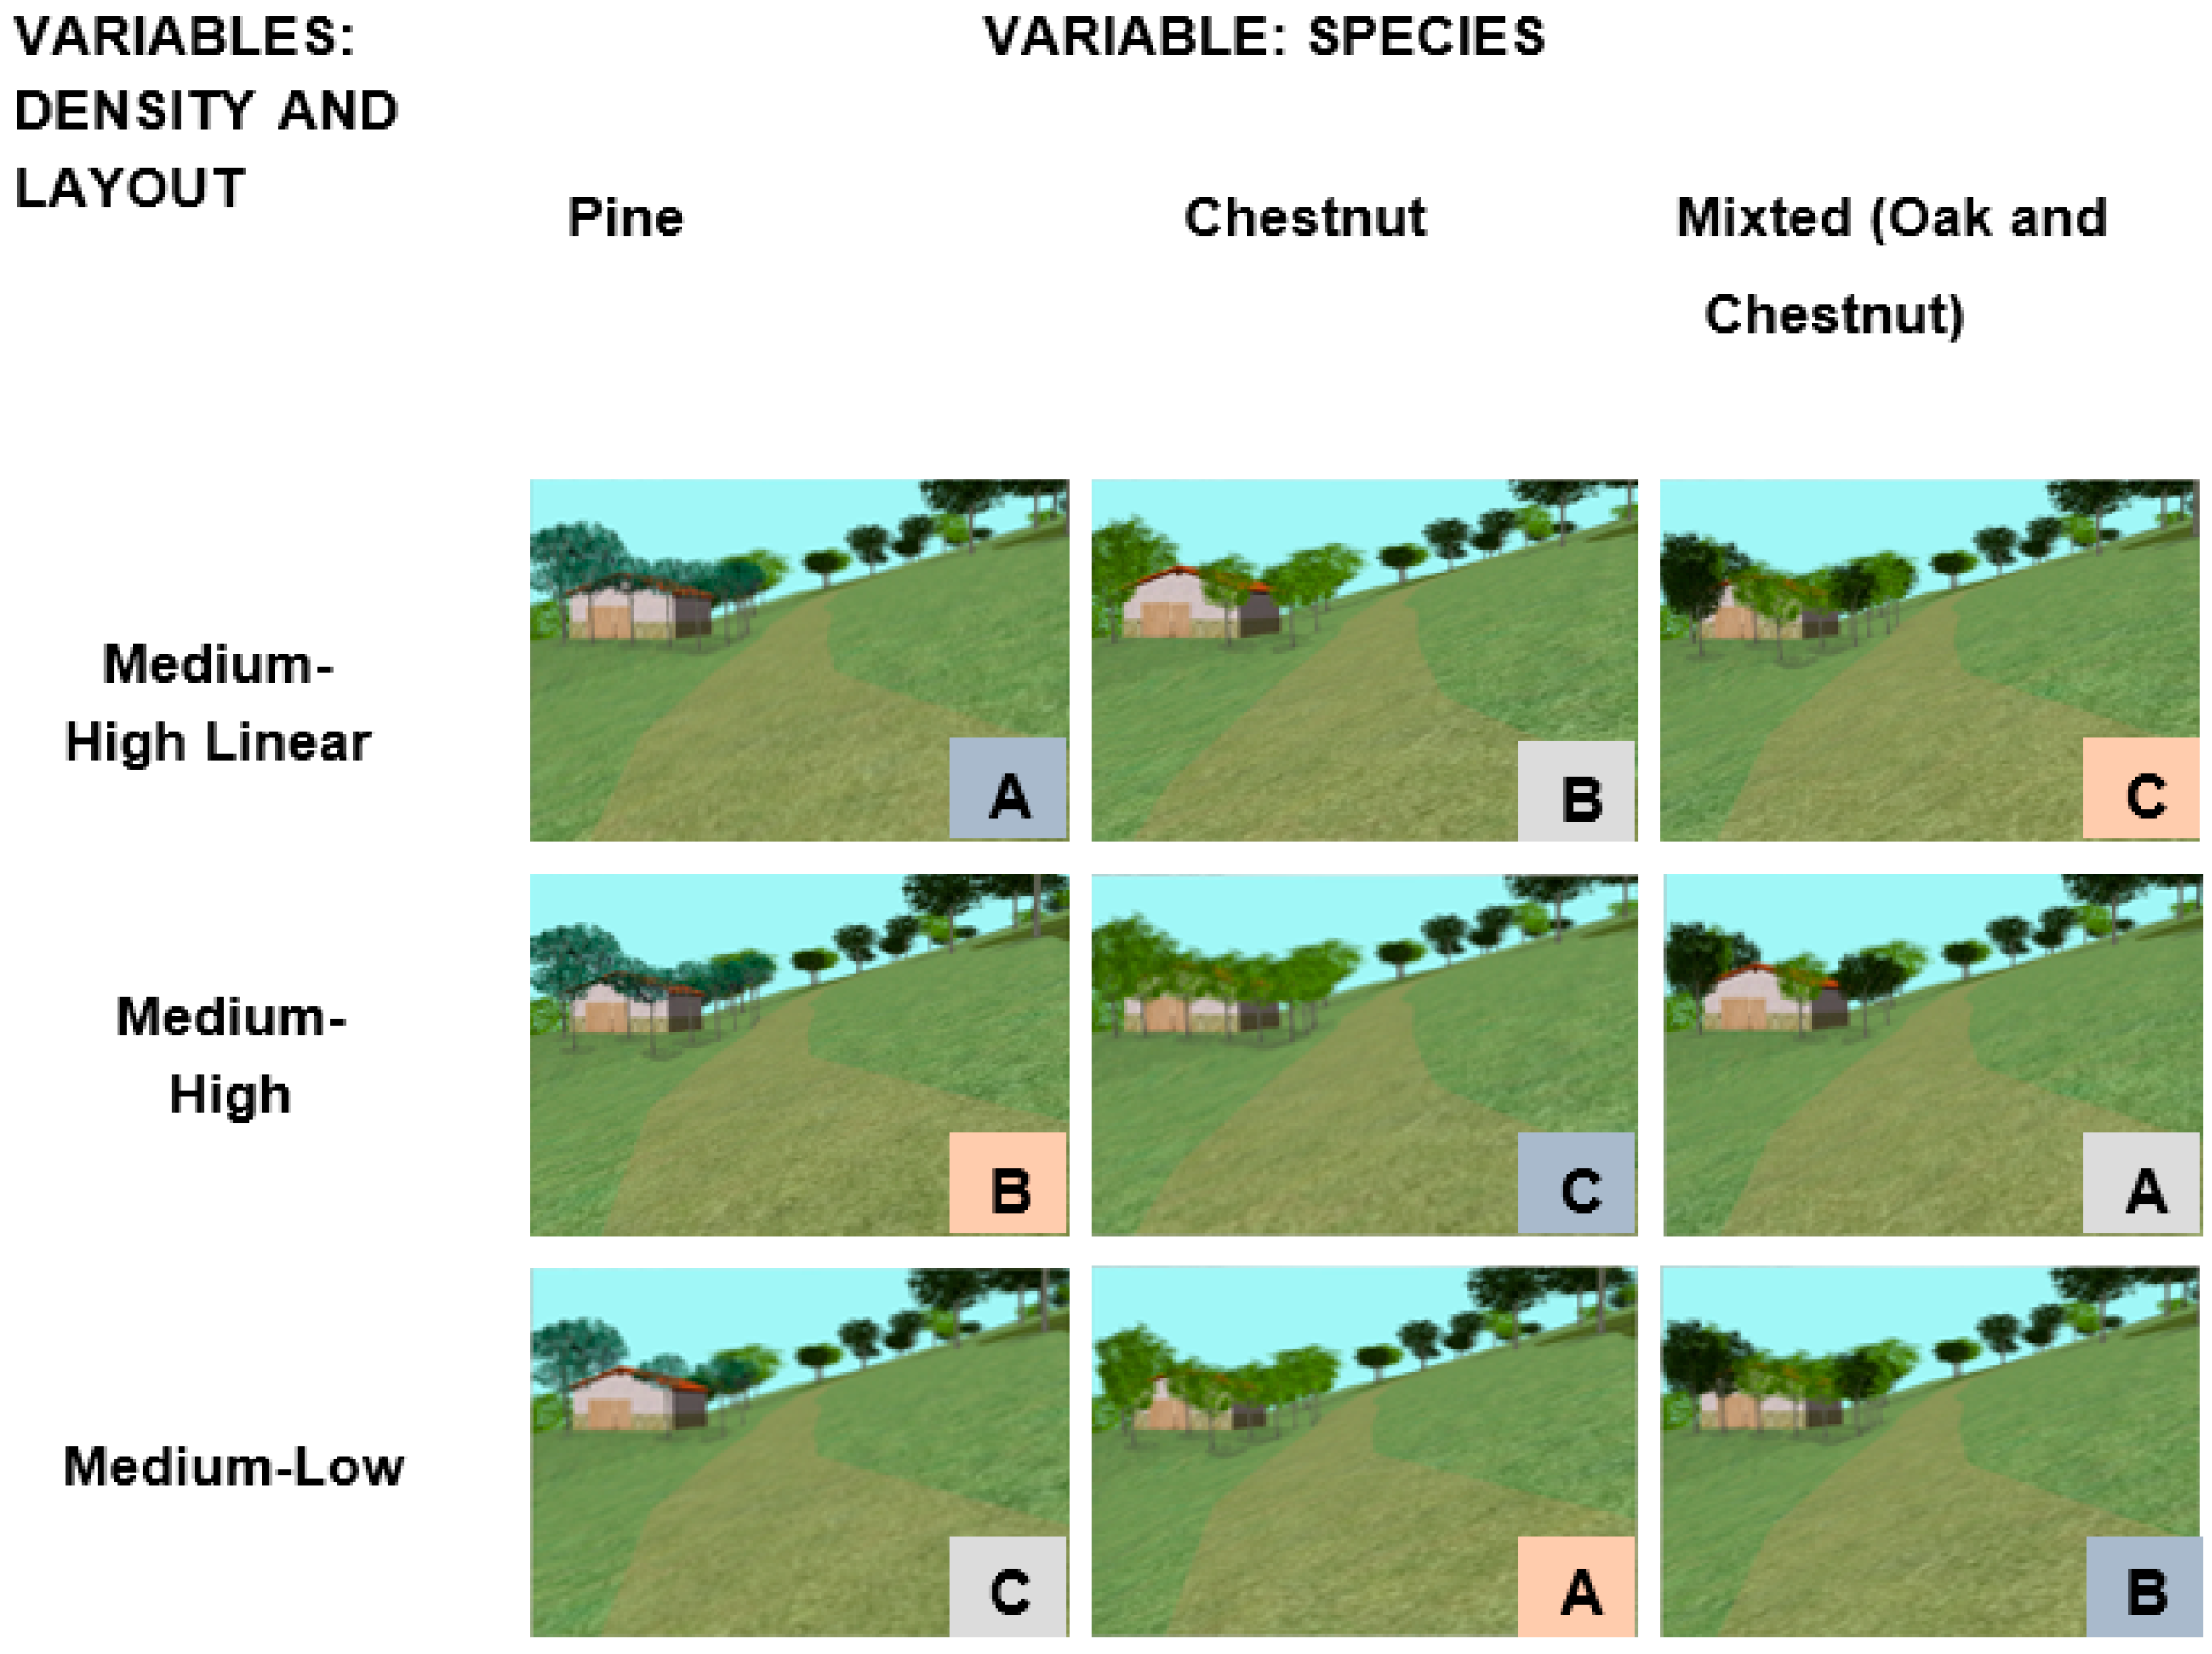
| Tree Density | Pine | Chestnut | Mixed (Oak and Chestnut) |
| Medium-high linear | A | B | C |
| Medium-high irregular | B | C | A |
| Medium-low | C | A | B |
| Source | Sum of Squares | df | Mean Square | F | Sig. |
|---|---|---|---|---|---|
| between-subjects | 156.078 | 2 | 78.039 | 110.702 | 0.00 |
| within-subjects | 177.647 | 252 | 0.705 | ||
| Total | 33.725 | 254 |
| Source | Sum of Squares | df | Mean Square | F | Sig. |
|---|---|---|---|---|---|
| between-subjects | 201.532 | 2 | 100.766 | 133.851 | 0.000 |
| within-subjects | 187.452 | 249 | 0.753 | ||
| Total | 388.984 | 251 |
| Sum of Squares | df | Mean Square | F | Sig. | |
|---|---|---|---|---|---|
| Inter-grupos | 0.000 | 1 | 0.000 | 0.000 | 0.986 |
| Intra-grupos | 722.710 | 505 | 1.431 | ||
| Total | 722.710 | 506 |
© 2017 by the authors. Licensee MDPI, Basel, Switzerland. This article is an open access article distributed under the terms and conditions of the Creative Commons Attribution (CC BY) license (http://creativecommons.org/licenses/by/4.0/).
Share and Cite
Velarde, J.G.; Parejo, M.J.M.; Blanco, J.H.; Moruno, L.G. Use of Video and 3D Scenario Visualisation to Rate Vegetation Screens for Integrating Buildings into the Landscape. Sustainability 2017, 9, 1102. https://doi.org/10.3390/su9071102
Velarde JG, Parejo MJM, Blanco JH, Moruno LG. Use of Video and 3D Scenario Visualisation to Rate Vegetation Screens for Integrating Buildings into the Landscape. Sustainability. 2017; 9(7):1102. https://doi.org/10.3390/su9071102
Chicago/Turabian StyleVelarde, Jacinto Garrido, María Jesús Montero Parejo, Julio Hernández Blanco, and Lorenzo García Moruno. 2017. "Use of Video and 3D Scenario Visualisation to Rate Vegetation Screens for Integrating Buildings into the Landscape" Sustainability 9, no. 7: 1102. https://doi.org/10.3390/su9071102