Human-Scale Sustainability Assessment of Urban Intersections Based upon Multi-Source Big Data


1
Institute of Transportation Engineering, Tsinghua University, Beijing 100084, China
2
College of Metropolitan Transportation, Beijing University of Technology, Beijing 100124, China
3
Road Transport Books Center, China Communications Press Co., Ltd., Beijing 100011, China
*
Author to whom correspondence should be addressed.
Sustainability 2017, 9(7), 1148; https://doi.org/10.3390/su9071148
Submission received: 24 May 2017
/
Revised: 23 June 2017
/
Accepted: 26 June 2017
/
Published: 2 July 2017
(This article belongs to the Special Issue Big Data and Predictive Analytics for Sustainability)
Abstract
:To evaluate the sustainability of an enormous number of urban intersections, a novel assessment model is proposed, along with an indicator system and corresponding methods to determine the indicators. Considering mainly the demands and feelings of the urban residents, the three aspects of safety, functionality, and image perception are taken into account in the indicator system. Based on technologies such as street view picture crawling, image segmentation, and edge detection, GIS spatial data analysis, a rapid automated assessment method, and a corresponding multi-source database are built up to determine the indicators. The improved information entropy method is applied to obtain the entropy weights of each indicator. A case study shows the efficiency and applicability of the proposed assessment model, indicator system and algorithm.
1. Introduction
As one of the countries with the fastest urbanization and motorization processes, China has been haunted by sustainable development issues in big cities, such as traffic jams and the absence of human-scale planning. Among them, the lack of the concept of human-scale design and the construction of intersections, which are bottlenecks and accident-prone points for most of the traffic network, are extremely unfavorable for the sustainable development of urban transportation.
In the United States from 2010 to 2014, an average of 26% of traffic fatalities and roughly half of all traffic injuries were attributed to intersections [1]. In big cities of Japan, vehicle drivers spend one-third of their travel time at intersections. In China, congestion is more likely to occur at intersections [2]. The sustainability assessment of intersections is an important basis for understanding the operational characteristics of urban road network. However, current assessment models of urban intersections require a tremendous amount of labor and financial resources and are not unified. Therefore, a reliable, generally applicable, automated assessment model is an urgent requirement.
In the last few years, many studies have been conducted in this field. Sun [3] constructed an accident risk matrix by case study and expert evaluation to determine the factors influencing traffic safety at intersections. Vedagiri [4] evaluated traffic safety at intersections by applying the simulation method to get the post-encroachment time. Wood [5] compared the advantages of a propensity scores-genetic matching-potential outcomes approach and the traditional signal control approach at the intersection by a case study. Current research mostly takes saturation, stopping delay, queue length, interference ratio, and separated ratio as traffic capacity indicators [6,7] and gap acceptance, traffic conflicts, traffic accidents, and safety infrastructure as safety indicators to evaluate the performance of intersections [8,9,10,11,12]. The assessment models are mostly grounded on extenics [13], cluster analysis [14], Bayesian network [15], etc. The data sources include the field survey [16], case study [17], and simulation [18]. However, most of these studies evaluate the sustainability of intersections from the perspective of the planners and builders rather than pedestrians and drivers. Moreover, the traditional models often require a lot of labor and financial resources to collect data, which restricts their application to a large number of intersections.
Sustainable development of the city should be primarily based on the user’s spatial perception and spatial needs in order to ensure safety of the roadway users. Everything else is subordinate to this fact [19]. As an important element of the urban public space, the comprehensive sustainability of intersections reflects not only the fundamental function of traffic dispersion, but also the style and features of a city and its residents’ concerns. In terms of the sustainability assessment methods, the abundant multisource data simplifies the procedure to determine the sustainability assessment indicators, which provide a solid basis for a more intelligent assessment of the sustainability of urban intersections.
A novel assessment indicator system of the sustainability of urban intersections is established in this paper, along with methods to determine all the indicators and their weight by applying multiple techniques and databases. Section 2 proposes a human-scale sustainability assessment indicator system and the method for determining the weight of each indicator based on information entropy theory; the indicator value auto-acquisition method based on big data mining algorithm is discussed in Section 3; Section 4 presents the case study on the intersections in the second ring of Beijing. Finally, conclusions are drawn in Section 5.
2. Human-Scale Sustainability Assessment Method Based on Information Entropy Theory
2.1. Establishment of the Indicator System of Sustainability Assessment of Urban Intersections
Considering mainly the user experience, this paper constructs a sustainability assessment indicator system including three primary indicators and 17 secondary indicators covering the three aspects of safety, functionality, and image perception (see Table 1).
The concept of safety is the ontological foundation of sustainability [20]. From this point of view, the number of conflict points, angle of intersection, and the existence of exclusive lanes, boundary fence, and colored bicycle lanes are taken as indicators. The number of traffic accidents is not recorded since statistics on traffic accidents are a long-term project. In addition, the traffic environment of intersections (including the traffic signal timing, road use, boundary fence, etc.) may be changed during the statistical period, which means the statistical cannot reflect the current situation of intersections well. Therefore, some other factors closely related to safety are chosen instead.
Providing sufficient services and livelihood is fundamental to sustainable urban development [21]. In terms of the functionality, the congestion degree, node degree, average spacing, average road width, accessibility of metro, accessibility of buses, and diversity of service are taken as indicators. The node degree, average spacing, and average road width reflect the geometrical characteristics of the intersection. The accessibility of metro and buses reflects the convenience for travelers, which will encourage people to choose a less polluting way to travel [22]. The diversity of service reflects the characteristics of land use around the intersection.
The landscape has a significant impact on traffic vitality [23]. In terms of the image perception, the sky opening degree, brightness, saturation, continuity of colors, and green looking ratio are taken as indicators. The sky opening degree reflects the opening degree of the intersection from the three-dimensional viewpoint [24]. Brightness, saturation, and continuity of colors have an important influence on the sense of space, degree of comfort, ambiance, service efficiency, and mental and physical state of travelers [25]. The green looking ratio, the percentage of green in the human field of view, is a three-dimensional measurement [26] that exerts an import influence on building a comfortable living environment.
2.2. Indicator Weights Determining Method Based on the Information Entropy Theory
Entropy is used to measure the disorder of molecular movement or the availability of energy. In social sciences, entropy information means the degree of uncertainty or dispersion of a system. It is generally believed that the more entropy information one system has, the more unbalanced its structure is and the bigger its differences are. From this perspective, the entropy information can also be used to determine the weight of assessment indicators. Without subjective participation, the accuracy and practicality of this method is enhanced [27].
2.2.1. General Steps of Entropy-Weight Method and Calculation
Factor Matrix Construction
Assuming there are rating schemes and indicators, so the matrix of original data is constituted as follows:
For an indicator if there is a big difference in indicator values , the indicator plays important roles in the comprehensive assessment; if all values of an indicator are even, the indicator is ineffective in the comprehensive assessment.
Data Standardization
In order to eliminate the effects of indicator dimensions on the results, the indicators are grouped into positively correlated indices and negatively correlated indicators. Assuming that the ideal value of indicator is , for positively correlated indicators, the bigger is the better; for negatively correlated indicators, the smaller is the better. The formulas used to standardize are:
Positively correlated indicators:
Negatively correlated indicators:
Here, is the standardized value, and and are the maximum values and minimum values of indicator in the assessed region, respectively.
Proportion Calculation
After an indicator matrix was conducted, the proportion of indicator in scheme was calculated:
Calculation of Entropy Value and Difference Coefficient
Entropy value of indicator j is:
Entropy value can be used to measure the utility value of indicator ; if the information is completely disorganized, then = 1. That is, the utility value of indicator cannot provide a comprehensive assessment. So, define as the redundancy of :
Weight Calculation
The weight of indicator is:
The value of is a representative of the role of indicator in the comprehensive assessment. The bigger is the more important role it plays.
Calculation of Assessment Value
The comprehensive assessment value of scheme is :
The value of represents the evaluating result of scheme . The greater the difference of is, the less synergy the system has. By comparing values of for different schemes, the conclusion can be drawn.
2.2.2. Improvements of Entropy-Weight Method
Zero Value of Indicators
In the second step above, the value of may be zero. For example, the number of intersection reserved lanes may be zero. This number cannot be solved via the entropy-weight method because it is impossible to take the log of zero. So, the first improvement is:
where, and are the average and standard deviation of Indicator j respectively. Next, coordinate translation is put into use:
where, .
Put into Equations (2) or (3) and continue the calculation.
Multilevel Assessment
A comprehensive method of TOPSIS (Technique for Order Preference by Similarity to an Ideal Solution) and entropy are often used for assessment [28,29]. In fact, primary entropy-weight method cannot work well on multilevel assessment, but the additivity of entropy provides a way to solve this problem. The approach and steps of the second improvement are as follows:
a. Calculation of difference coefficient of sub-system and total system indicators:
where and are the difference coefficient of the sub-system and the total system, respectively.
b. Weight of sub-system calculation:
c. Calculation of assessment value:
3. Indicator Value Auto-Acquisition Based on Big Data Mining Algorithm
3.1. Geospatial Analysis Based on GIS Database
Applying geospatial analysis tools such as buffer analysis, overlay analysis, network analysis, spatial joint analysis, and topological analysis [30], in combination with some statistical analysis methods of the attribute data, we obtain the indicator values of node degree, average spacing, average road width, accessibility of metro, accessibility of buses, and diversity of service.
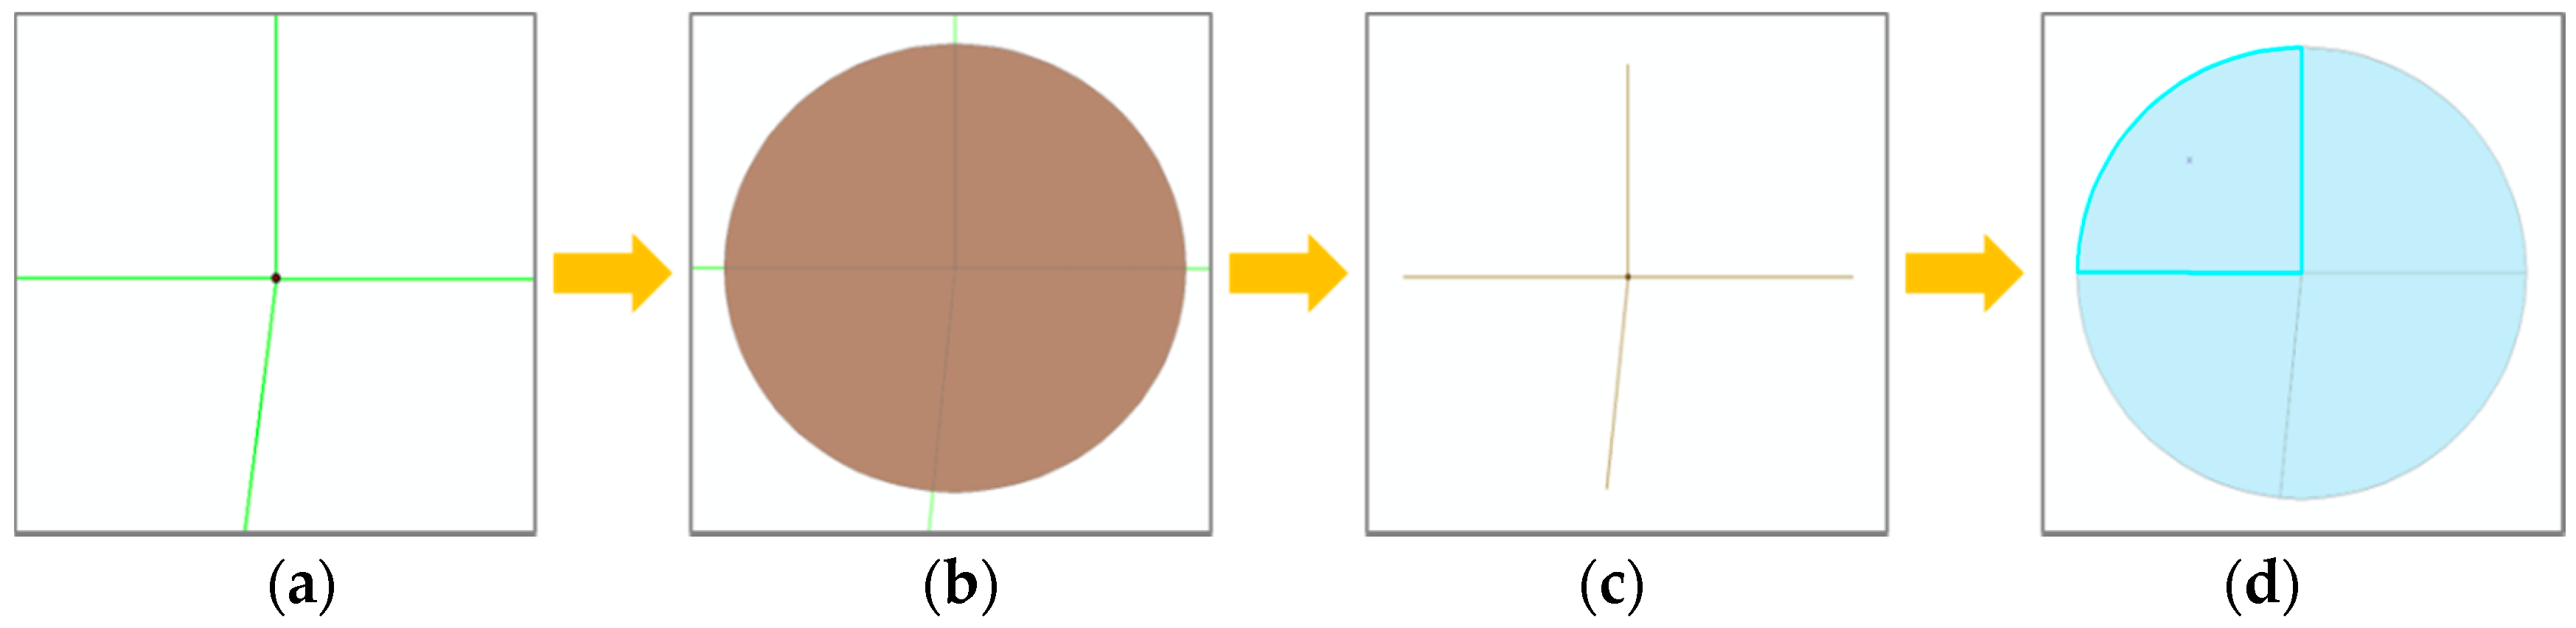
To calculate the smallest crossing angle, an area partition technique is proposed. The procedure of this technique is as follows:
Step 1: generate a circle with radius R centered at the intersection by buffer analysis.
Step 2: truncate the roads connected to the intersection by overlay analysis with the buffer layer generated in Step 1.
Step 3: continuing with the overlay analysis, divide the buffer layer into several sectors and calculate their areas .
Step 4: calculate the crossing angle of the neighboring roads according to the areas of each sector:
Figure 1 shows the calculating process of the area partition method.
The area partition method, applying the buffer analysis and overlay analysis, transforms the problem of calculating angles to a problem of calculating areas. Compared to the traditional method of calculating angles using the coordinates of start and end points of two neighboring roads, the area partition method eliminates the process of calculating the directional angle of each road and so simplifies the calculating process. Moreover, it can also reduce the calculating errors introduced by the curve of the roads.
3.2. Street View Picture Crawling and Recognition
3.2.1. Street View Picture Crawling
This paper takes the Tencent Street View pictures as the picture data source [31]. The pictures are crawled using the Application Programming Interface (API) developed by Tencent, which provides researchers with access to a set of routines based on certain software or hardware. Apart from the URL of the picture, the API takes another two parameters, heading and pitch. Heading represents the horizontal direction of the picture and pitch represents the vertical direction. To maximize the information that can be learnt from the picture, for each intersection, the pitch is set to 3 (the angle between the sightline and the ground is 3°) and the heading is set to change every 45°. Finally, eight pictures for each intersection are obtained. The crawling procedure is as follows:
Step 1: read the coordinates (longitude and latitude) of intersections from the GIS database.
Step 2: convert the values of coordinates from WGS-84 coordinate system to Mars coordinate system.
Step 3: get image IDs according to the coordinates.
Step 4: crawl pictures using the image ID.
3.2.2. RGB and HSV Decomposition
RGB color mode is a widely used industrial color standard. R, G, and B represent red, green, and blue, respectively. The other color types can be obtained by a combination of the three color channels. HSV is a color space created by A.R. Smith [32] in 1978, representing hue (H), saturation (S), and value (V). Tencent Street View pictures are in JPG format and can be decomposed into an RGB matrix and then transferred to an HSV matrix. The pseudocode is given in Algorithm 1.
| Algorithm 1 Method for RGB to HSV | |
| RGB-To-HSV (S) | |
| in: matrix S representing the RGB values of the image | |
| out: matrix P representing the HSV values of the image | |
| 1: k ← rows (S) | |
| 2: l ← columns (S) | |
| 3: P ← zeros (k, l) | |
| 4: for i ← 0 . . . k do | |
| 5: for j ← 0 . . . l do | |
| 6: (R, G, B) ← Si,j | |
| 7: V ← max (R, G, B) | |
| 8: M ← min (R, G, B) | |
| 9: if V ≠ 0 then | |
| 10: S ← 1 − M/V | |
| 11: else M/V | |
| 12: S ← 0 | |
| 13: end if | |
| 14: if V = R then | |
| 15: H ← 60 × (G − B)/(V − M) | |
| 16: else if V = G then | |
| 17: H ← 120 + 60 × (B − R)/(V − M) | |
| 18: else if V = B then | |
| 19: H ← 240 + 60 × (R − G)/(V − M) | |
| 20: end if | |
| 21: if H < 0 then | |
| 22: H ← H + 360 | |
| 23: end if | |
| 24: Pi,j ← (H, S, V) | |
| 25: end for | |
| 26: end for | |
| 27: return | |
Next, the brightness, saturation, continuity of colors, and green looking ratio can be calculated. The brightness refers to the eyes’ perception of how dark/light a color is. The brightness mainly depends on the strength of the light and can be represented by the parameter V in HSV mode. In our research, the brightness at the intersections is represented by the average value of parameter V in the HSV matrix. The saturation refers to the purity of the color and can be represented by the parameter S in HSV mode. The saturation at intersections is represented by the average value of parameter S in the HSV matrix. The continuity refers to the difference between areas with different brightness. The smaller the contrast ratio is, the better the continuity is. The contrast ratio is derived from the difference of grey degree between the neighboring pixels; the formula is:
where denotes the grey degree of pixel .
According to the HSV mode, the parameter H represents the color information, namely the position in the spectrum. This parameter is expressed in degree, where the color of red, green, and blue have a difference of 120°, while their complementary colors, cyan, magenta, and yellow, have a difference of 180°. Therefore, the parameter H has six possible values. The ratio of the number of green values to the total number of H values is called the green looking ratio of a picture.
3.2.3. Image Segmentation and Area Calculation
The sky opening degree of urban intersections is measured by the ratio of the area of sky to the whole area of a picture. Considering the influence of some factors like the weather, atmospheric concentration, and smog, the sky is not always blue, which makes it difficult to recognize it by color. Therefore, the image segmentation algorithm is needed to recognize the sky region. Based on the characteristics of the sky area, considering the accuracy and efficiency of the algorithm, an algorithm based on the adaptive Canny operator, mathematical morphology, and regional growth is designed. The basic idea of this algorithm is: by using the adaptive Canny operator, the edge detection of the image is carried out, the possible edge set of pixels is extracted, and the closed boundary connection is generated by using the mathematical morphology algorithm. The regional growth method is used to calculate the opening degree of the sky. The implementation process is as follows:
Step 1: edge detection based on the adaptive Canny operator
The classical Canny operator [33] is an edge detection operator based on the optimization theory. It firstly smoothens the image with a Gaussian filter, calculating the magnitude and direction of the gradient with the finite difference of the first partial derivative, and then uses the non-maximum suppression algorithm and the delayed dual threshold algorithm to calculate the maximum changes in grey degree in order to locate the edge of the image. For smoothing the image, the first derivative of the two-dimensional homogeneous Gaussian function is used, and the Gaussian kernel function is:
where is the input image, , denotes the convolution, is the standard deviation, determines the degree of smoothing. A lower results in high edge detection precision, but poor robustness of edge detection. A larger results in efficient noise cancellation, but low accuracy. Therefore, the choice of the value of σ is often a dilemma. In industrial applications, it is difficult to try many alternatives to find the best value of . Song [34] proposed an adaptive Gauss filter to solve this problem. It divides the image into smaller pieces of the filter window (fixed size), divides the pixels in the filter window into three categories, and automatically calculates the value of according to different types. Algorithms are as follows:
A. the pixels are located in the image smooth area
here, is very low.
B. the pixels are located on the edge of the image
here, is very low too.
C. the pixels are isolated in the image
here, is large.
is the present gray value is the average gray value of the image in the filter window. In the process of image smoothing, the value of changes automatically according to the type of pixels in the filter window. This can significantly improve the efficiency. Meanwhile, it is helpful for detecting the weak edge, reducing the false edge, and improving the connectivity of edges. Figure 2c–f show that the adaptive Canny operator can effectively reduce the influence of the fuzzy edge in an image caused by weather, haze, and other factors.
Step 2: image edge connection based on ensemble morphology
Although the adaptive Canny operator improves the edge detection performance, it is still difficult to obtain a complete closed contour for complex images and overly blurred edges. For further edge connections, the mathematical morphology algorithm is applied. The mathematical morphology algorithm [35] is simple and fast; the dilation and erosion method in the morphology can bridge the narrow gaps and fractures in the contour.
Single-scale morphological is defined as:
where f is the original image, g is the morphological structural element, (f⊕g) means to expand the original image using the structural element, and means to erode the original image using the structural element. g includes two parameters: shape and the shape’s size, where the shape may be a line, octagon, rectangle, square, etc. Figure 3 shows the effect of Figure 2a by expanding and eroding using the structural element (square, 3).
Too large a value of g will lead to the loss of slight edge; on the contrary, g being too small will lead to a fracture of the edge. So, based on the ensemble learning idea, we put forward a novel method, ensemble morphology, to solve this problem. It is described as follows:
where represents the weight of the scale . It can be obtained through the model training or set to the same value. Structural elements with different size and gradient are permitted.
From Figure 2g–j, the ensemble morphology method performs better than the single-scale morphological method. It can obtain more accurate image edges to realize the image segmentation.
Step 3: Calculate the area proportion of the sky.
After the edge detection and connection, the closed boundary is obtained. Based on the aforementioned analysis of the characteristics of the sky area, the area with the smallest change in grey degree in the upper half part of the picture is thought to be the sky area. The shape of this area is irregular and is suitable to calculate the proportion of this area by regional growth method. The general idea is to select a pixel in the sky area as a seed to start growing, and detect whether its four neighboring pixels meet the growth conditions. The pixels that meet the conditions are put into the stack and regarded as the already identified area. Then, another pixel in the stack is selected and the above process is repeated until no pixel in the stack meets the growth conditions. The pseudocode is given in Algorithm 2.
| Algorithm 2 Region Growing Method for Sky Calculation | |
| REGION-GROWTH-METHOD (E) | |
| in: edge matrix E, starting point (x0, y0) | |
| out: the area ratio of sky SR 1: SR | |
| 1: SR ← 0; stack ← 〈 〉; label ← 〈 〉; SkyArea ← 〈〉 | |
| 2: SkyArea ← SkyArea || 〈 (x0, y0) 〉 | |
| 3: while |stack| ≠ 0 do | |
| 4: neighbors ← 〈 (x0 − 1, y0), (x0 + 1, y0), (x0, y0 − 1), (x0, y0 + 1) 〉 | |
| 5: for all (x, y) neighbors do | |
| 6: if Ex, y = 0 and (x, y) label then | |
| 7: stack ← stack || 〈(x, y)〉 | |
| 8: label ← label || 〈(x, y)〉 | |
| 9: SkyArea ← SkyArea || 〈(x, y)〉 | |
| 10: end if | |
| 11: end for | |
| 12: n ← Random-Integer (0, 4) | |
| 13: (xi, yi) ← neighbors (n) | |
| 14: stack ← stack - 〈(x0, y0)〉 | |
| 15: (x0, y0) ← (xi, yi) | |
| 16: end while | |
| 17: k ← rows (E) | |
| 18: l ← columns (E) | |
| 19: SR ←|SkyArea|/(k·l) | |
| 20: return SR | |
3.3. Calculation of the Congestion Degree Based on Tencent Real-Time Traffic Condition
A Tencent map can show the real-time traffic conditions of China’s 296 large and medium-sized cities. The traffic condition is divided into four levels: smooth, slow, congested, and seriously congested, each of which is marked with a different color, but Tencent did not directly provide an API to get the level of the traffic condition of each road. Zheng et al. [36] took screenshots of real-time traffic conditions on Tencent map, and then conducted coordinate matching and RGB decomposition to calculate the road congestion situation. This method involves a heavy workload and multiple screenshots lead to an accumulation of errors. In our study, by using the Tencent API, which returns the travel distance and travel time by car at two arbitrary locations, the average car speed at an intersection is calculated. The average minimum car speed at the intersection during one observation period (one week or one month) is used to characterize the congestion degree at the intersection. The calculation process is as follows:
Step 1: by using Tencent API, obtain the travel time per car for a certain distance on the roads connected to an intersection.
Step 2: calculate the average car speed for each road connected to the intersection and take their arithmetic mean as the average car speed of the intersection.
Step 3: calculate the minimal average car speed during one period.
3.4. Counting Algorithm of Conflict Points Based on Traffic Engineering Database
The number of conflict points at an intersection can be obtained by the field observation method [37], the model calculation method [38], and the simulation method [39]. Pan et al. [40] proposed a model to calculate the conflict points of motor vehicles at the unsignalized plane intersection. In this paper, this model is extended to make it suitable for signalized multi-intersections and all kinds of conflicts. The algorithm is as follows:
Step 1: Obtain the type of intersections from the traffic engineering database, the lane properties of the roads connected to the intersection, and the traffic light control scheme.
Step 2: According to the lane properties, each road is divided into import quadrant and export quadrant; a one-way road only has one of them. All quadrants are numbered clockwise from 1 to M (M is the number of quadrants). Figure 4 illustrates the quadrant division of an intersection.
Step 3: According to the signal control scheme, calculate the total number of conflict points during one signal period, including those between motor vehicles, motor vehicles and pedestrians, motor vehicles and non-motor vehicles, and non-motor vehicles and pedestrians. The formula is:
where N is the number of phases of the traffic signal. At an unsignalized intersection, . M is the number of quadrants; is the number of conflict points between the motor vehicles, including the cross points, merging points, and diverging points; , , and are the number of conflict points between motor vehicles and non-motor vehicles, motor vehicles and pedestrians, and non-motor vehicles and pedestrians, respectively.
4. Case Study
4.1. Data
A case study was conducted using the data collected for the plane intersections within the Second Ring Road in Beijing (China). The data sourced include GIS database, street view image database, traffic engineering database, real-time traffic condition database, etc.
4.1.1. GIS Database
GIS data for the area within the Second Ring Road of Beijing include the administrative divisions, land use, road networks, the name, location and other attributes of the blocs and streets, road intersections, POIs, buildings, bus stops, subway stations, and so on. The road intersection includes the intersection of the trunk roads, the intersection of the trunk road and the secondary road, and the intersection of the slip roads. In order to enhance the comparability of the sustainability of the intersection, the intersection is selected with at least one trunk road as the object of study, which includes 126 intersections. Through the GIS spatial analysis tool, the values of the indicators are obtained, such as the minimal cross angle, node degree, average spacing, average road width, accessibility of metro, accessibility of buses, diversity of service, etc.
4.1.2. Street View Image Database
This database is constructed by using Tencent street view image API. Eight pictures for each intersection are collected, taken from different directions. The total number of pictures is 1008. Next, RGB and HSV decomposition are applied to each picture to obtain their brightness, saturation, continuity, and green looking ratio. Image segmentation and recognition are applied to calculate the opening degree of the sky.
4.1.3. Traffic Engineering Database
The data in this database include the type of intersection, the lane property of the connected road, the channeling scheme, and the signal control scheme. According to the obtained lane property and the signal control scheme, the number of conflict points can be obtained by the existing model.
4.1.4. Real-Time Traffic Database
This database is constructed by using Tencent real-time traffic condition API. The real-time traffic conditions during the morning peak 7:00–9:00 and the late peak 17:00–19:00, which are refreshed every 5 min, are used to calculate the average car speed at each intersection, and then the congestion degree is obtained.
4.2. Indicator Weights Determining
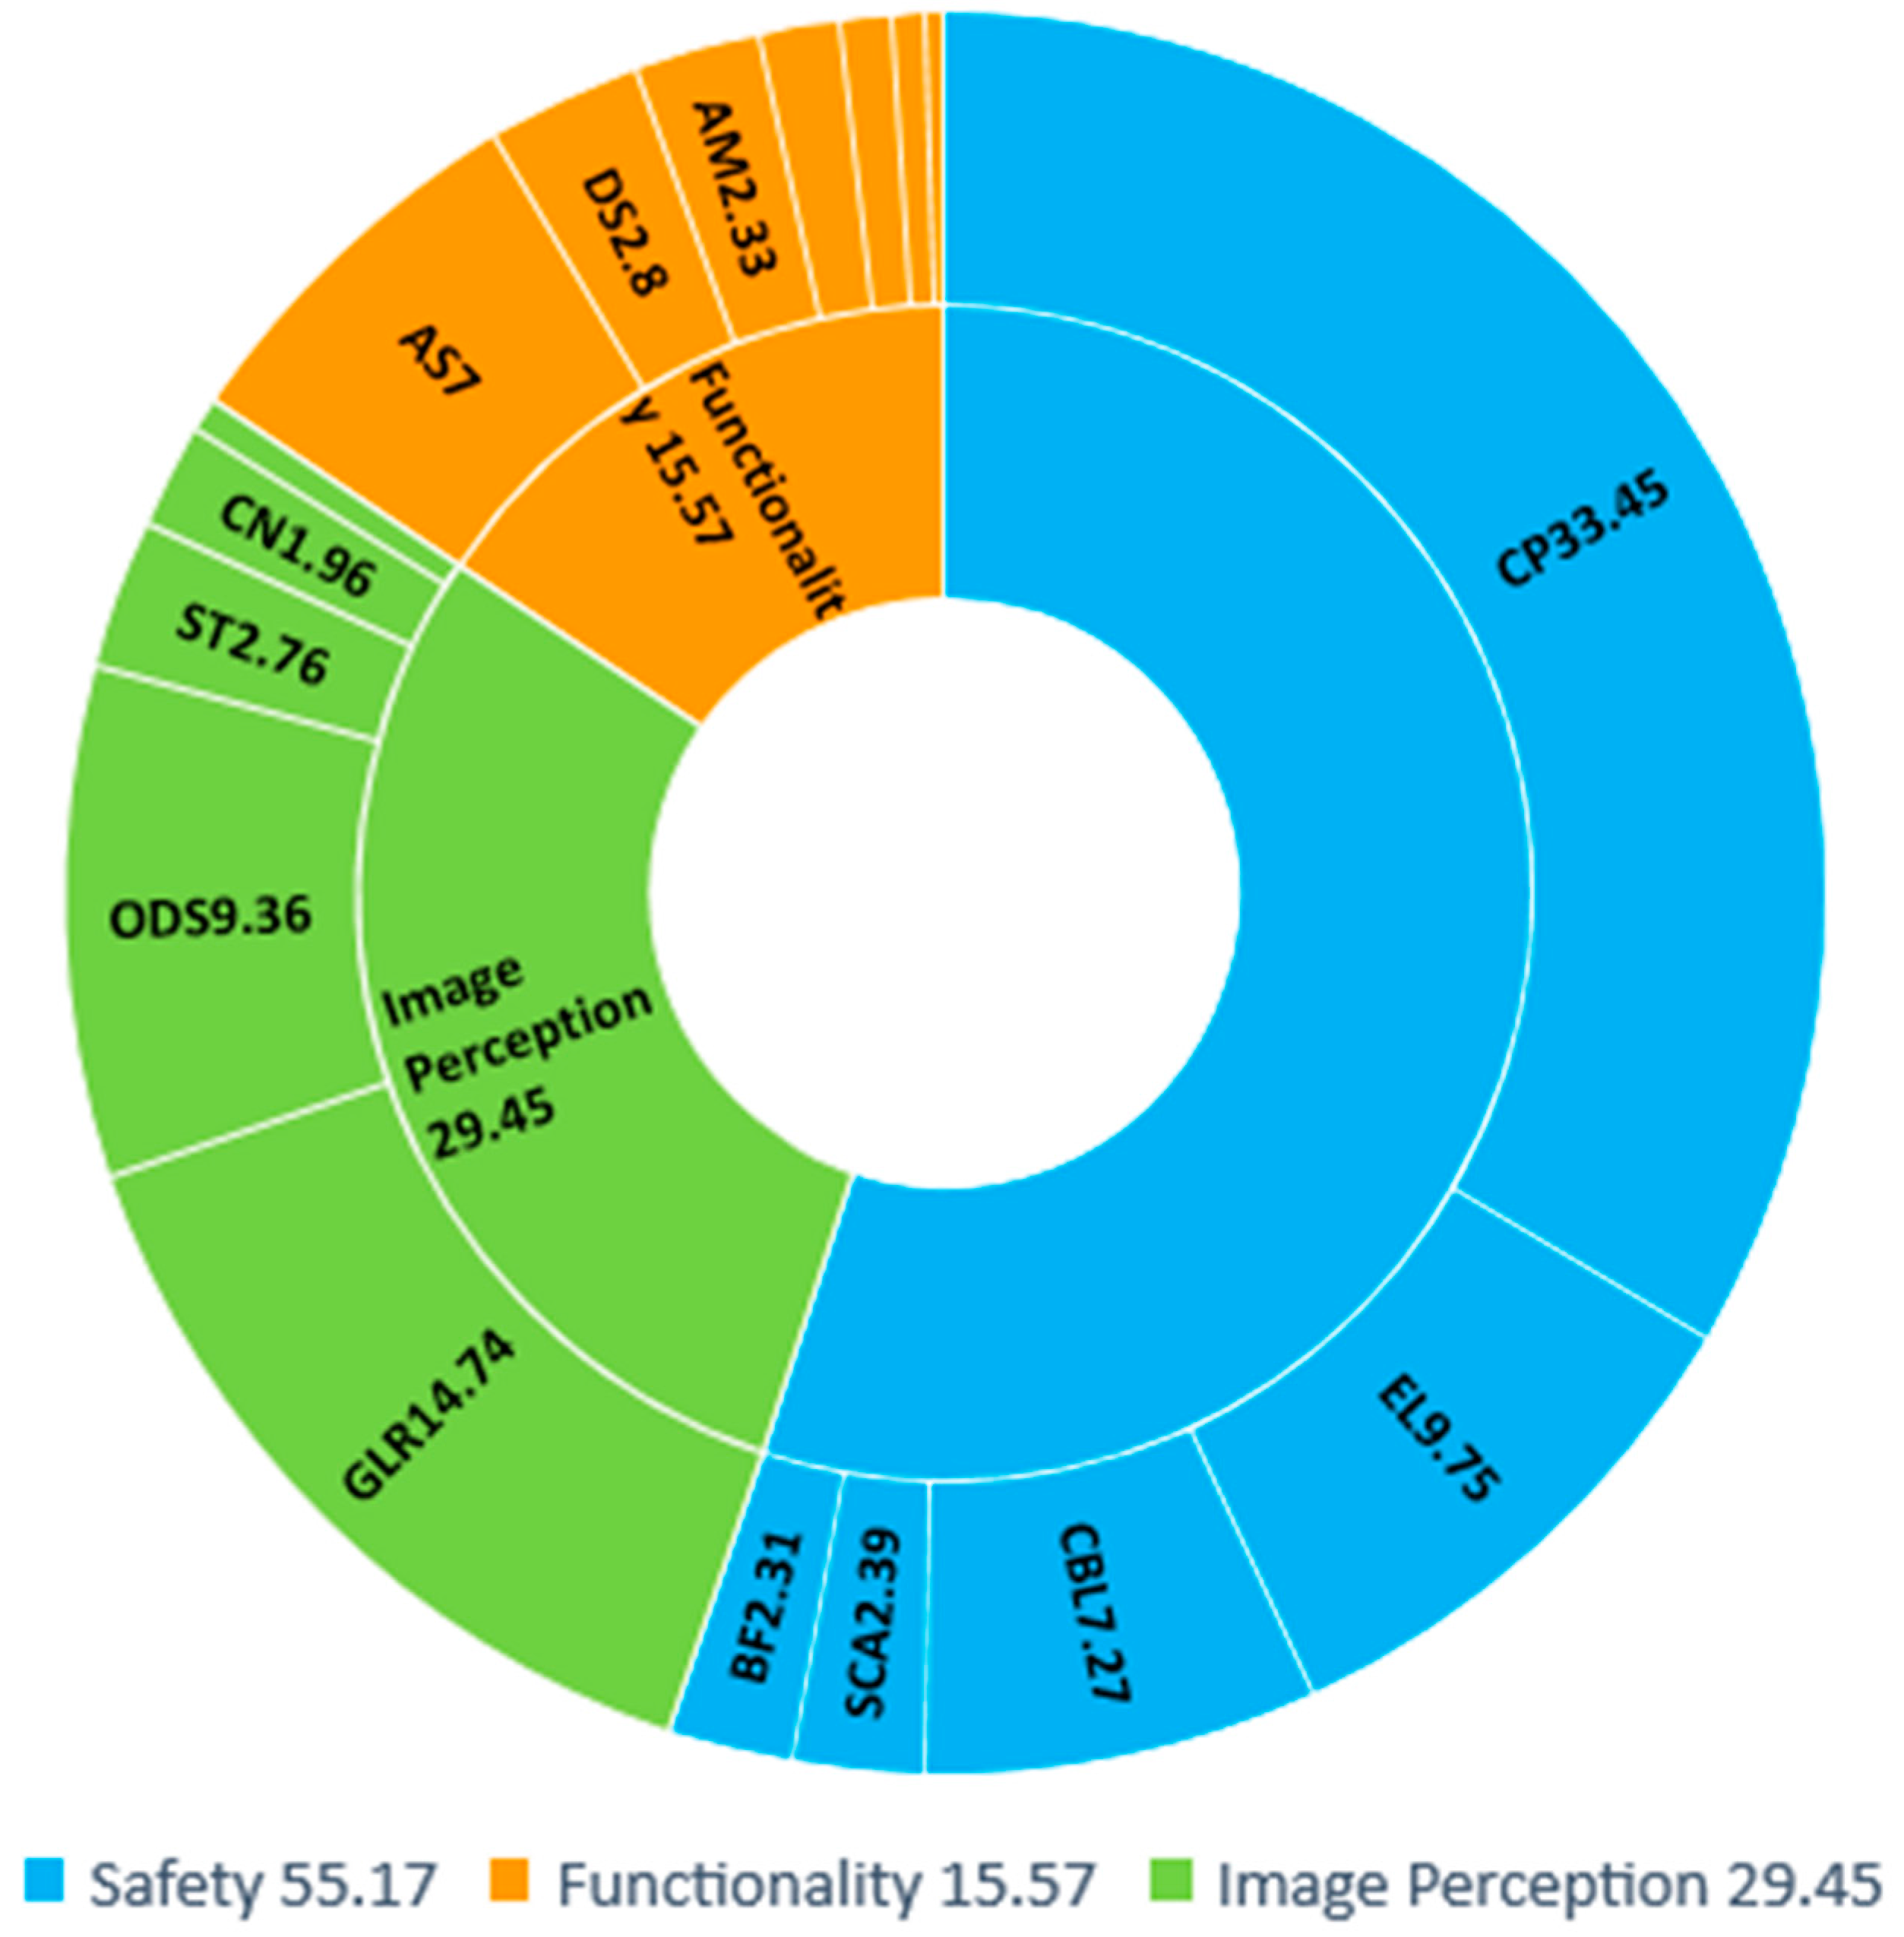
The weight of each indicator is determined by the improved information entropy method according to the value of each indicator. Table 2 and Figure 5 show the results of the calculation.
The weights of the primary indicators show that the intersections in our study are very different in terms of safety but similar in functionality. In terms of safety, the weight of the number of conflict points exceeds 1/3 of the overall weight of safety, indicating that the number of conflict points is quite different among all the intersections. The number of conflict points is determined by the type of intersection, lane properties and traffic lights control schema, so a reasonable channelization and traffic lights control schema are essential for the safety of the intersection. In terms of functionality, the weight of the average spacing is large, indicating that the range of services of the intersections is quite different. The distribution of intersections showed in Figure 8 also proves this point. Dispersing traffic and avoiding congestion is the basic function of the intersection. As the average car speed at the rush hour of the intersections is basically between 3 km/h and 10 km/h, which means the congestion degree of the intersections is similar, the weight of the congestion degree is low. The green looking ratio has the highest weight in image perception and the second highest weight in the overall system, following the number of conflict points. This means that there is a large difference in greening among the intersections. At the same time, the weights of the exclusive lane, colored bicycle lane, and opening degree of sky are also relatively high, which means the intersections also show a large difference in these aspects.
4.3. Assessment Results
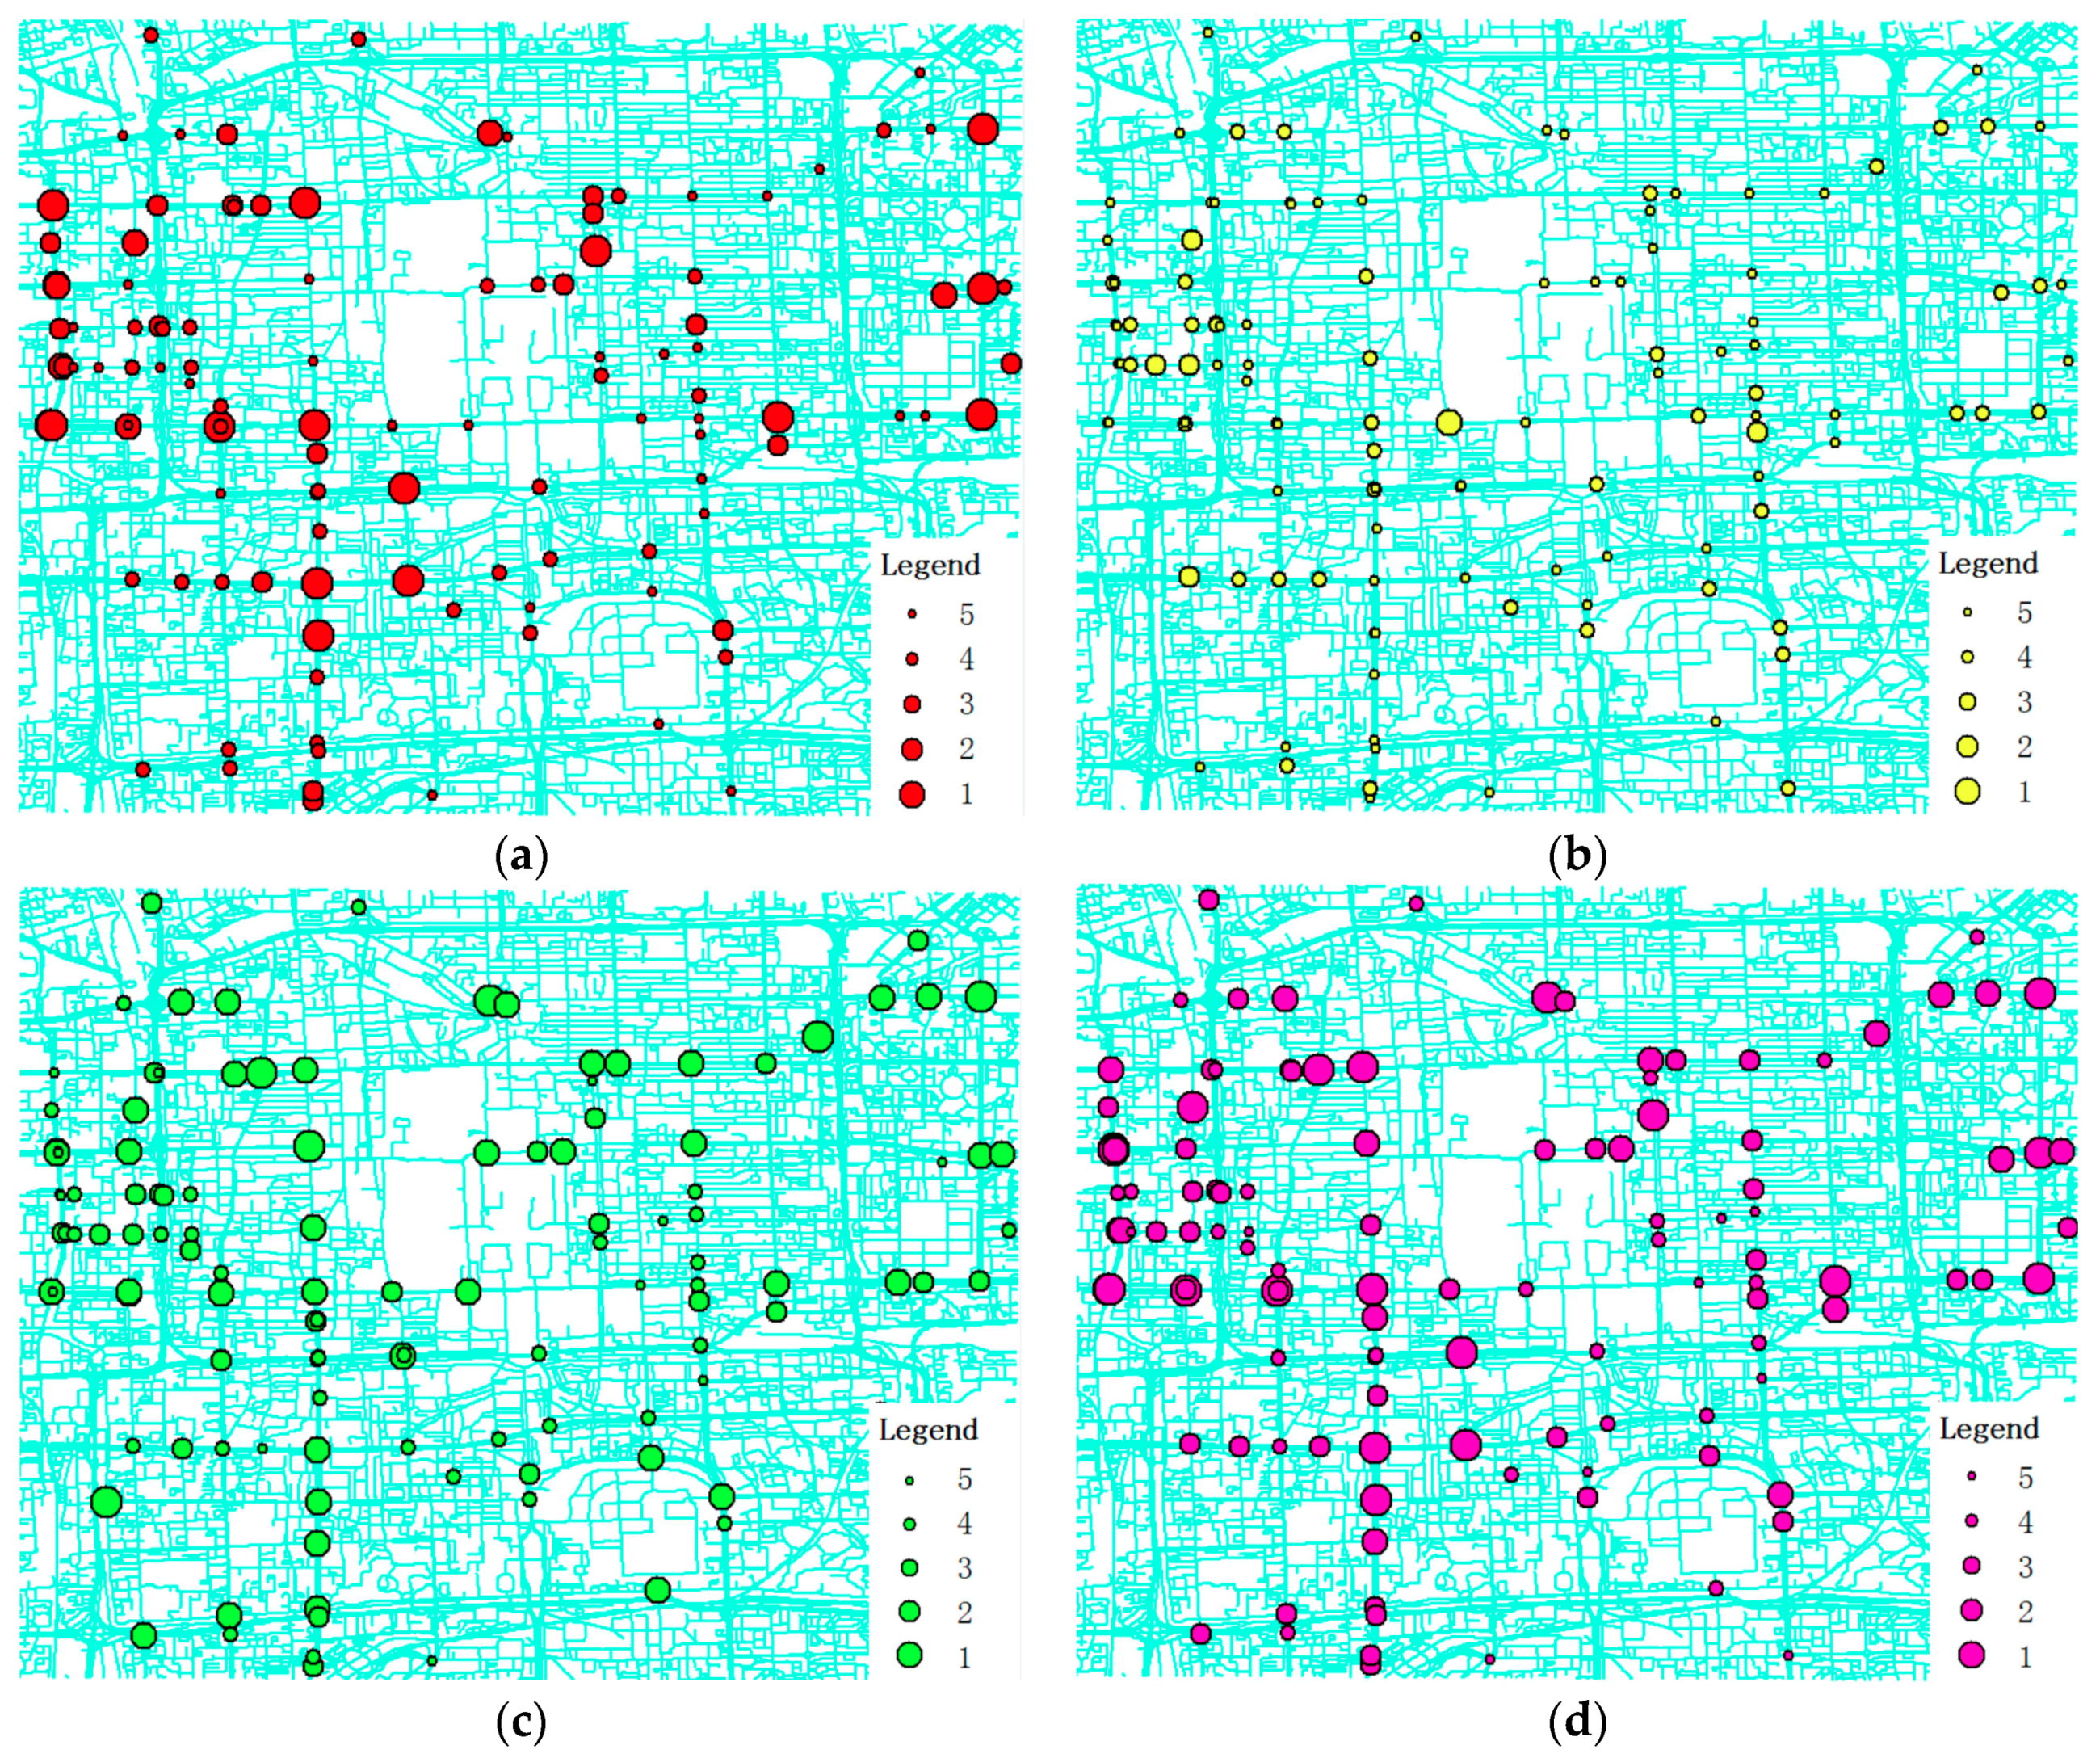
According to the values and weights of each indicator, the safety indicator, functionality indicator, image perception indicator, and comprehensive sustainability indicator of each intersection are calculated. The intersections are divided into five categories according to the comprehensive sustainability indicator, as shown in Figure 6, where a larger circle represents better performance.
4.4. Validation
A sampling survey is conducted to verify the rationality of the assessment results.
4.4.1. Safety Indicator
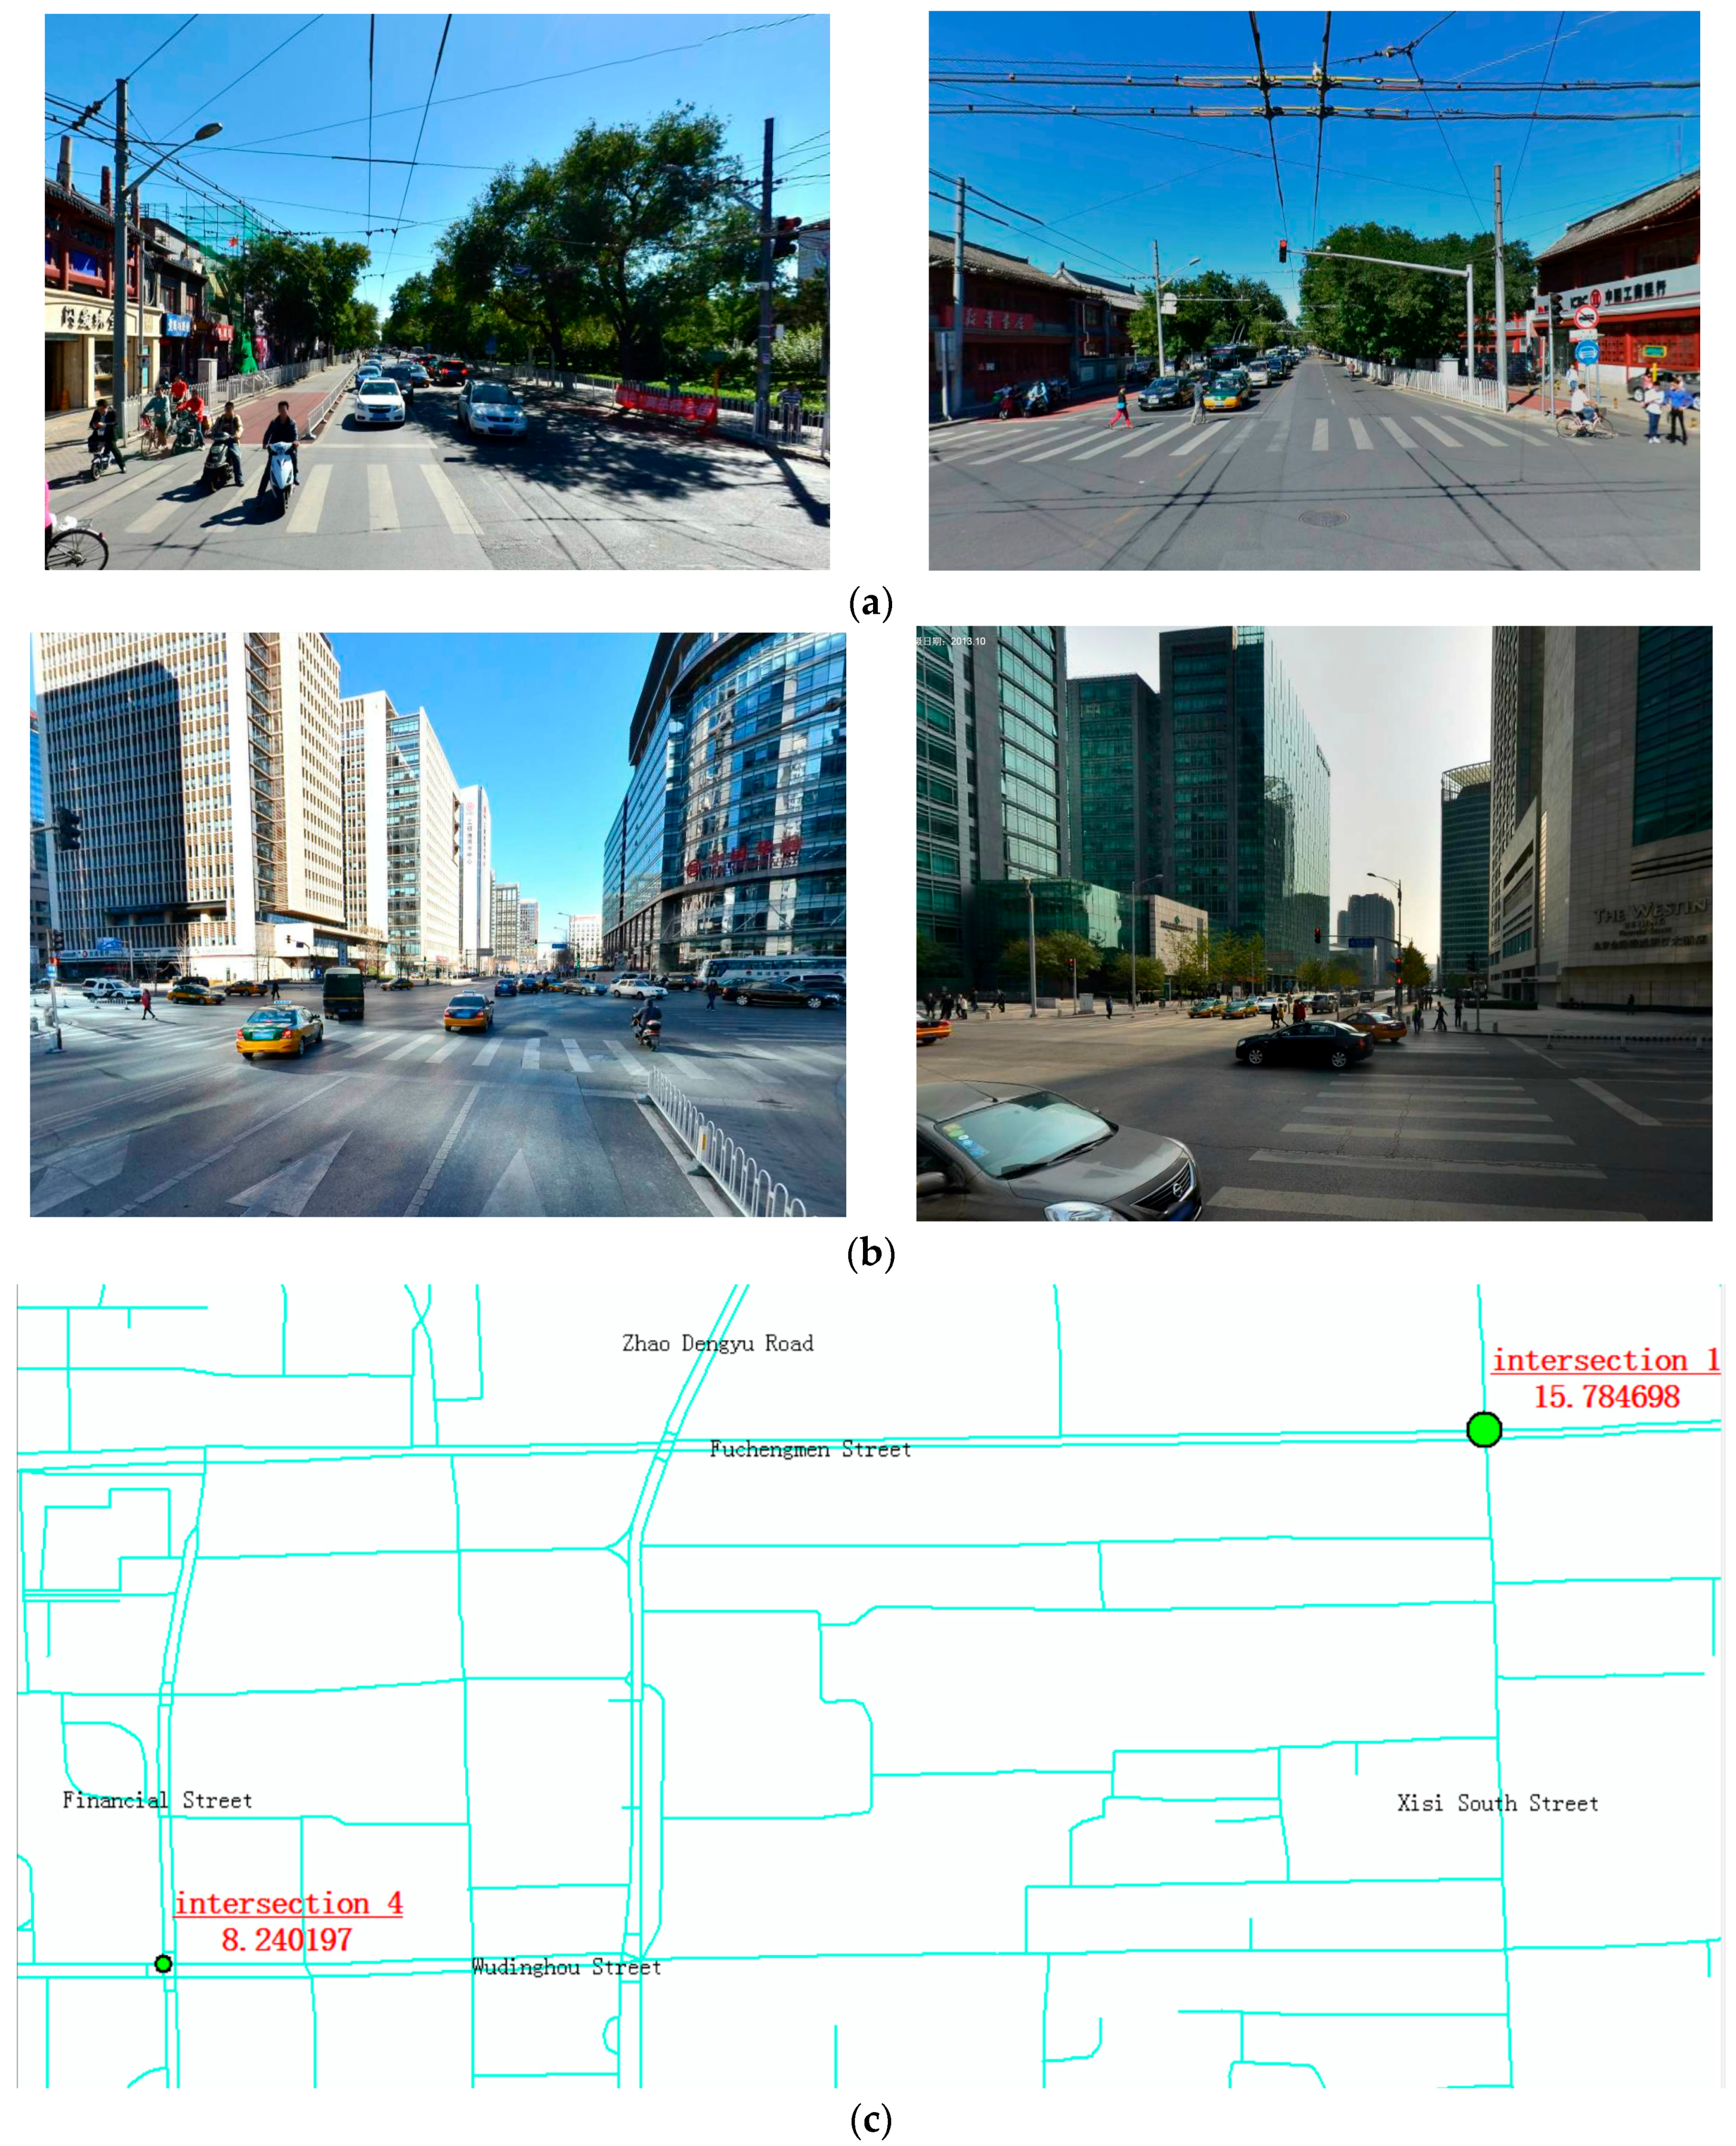
The intersection of West Fourth South Street and Fuchengmen Street (Intersection 1, the same below) and the adjacent intersection of West Gate Street and Xinjiekou South Street (Intersection 2, the same below) are selected randomly for comparison, as showed in Figure 7. The former has neither an exclusive lane for left or right turn nor a barrier section, and the number of conflict points is large; the latter has clear road marking and the exclusive lane for left and right turn. The right turn has a wide view and the traffic signal is clear. The motor vehicle lane and the non-motor vehicle lane are completely separated and the bicycle lane is colored. The number of conflict points is small. The safety indicator of the two intersections is 10.74 and 20.46. The assessment value can objectively reflect the difference of the level of safety between the two intersections.
4.4.2. Functionality Indicator
Intersection 1 is still chosen as the reference, and the adjacent intersection of Zhao Dengyu Road and Pinganli of the West Street as the comparison (Figure 8c). The former is far away from the other intersections so has a larger range of services. The commercial environment near the intersection is good as there are bookstores, banks, restaurants, and hotels nearby. The accessibility of this intersection is also good because there is a metro station and many bus stops nearby. By contrast, the latter intersection is close to the neighboring intersections so it has a smaller range of services. The commercial environment near the intersection is bad because there are few stores. There are also few bus stops, and the metro station is far away. The functionality indicator of the former is 8.16 and that of the latter is 7.41, corresponding to the above analysis results.
4.4.3. Image Perception Indicator
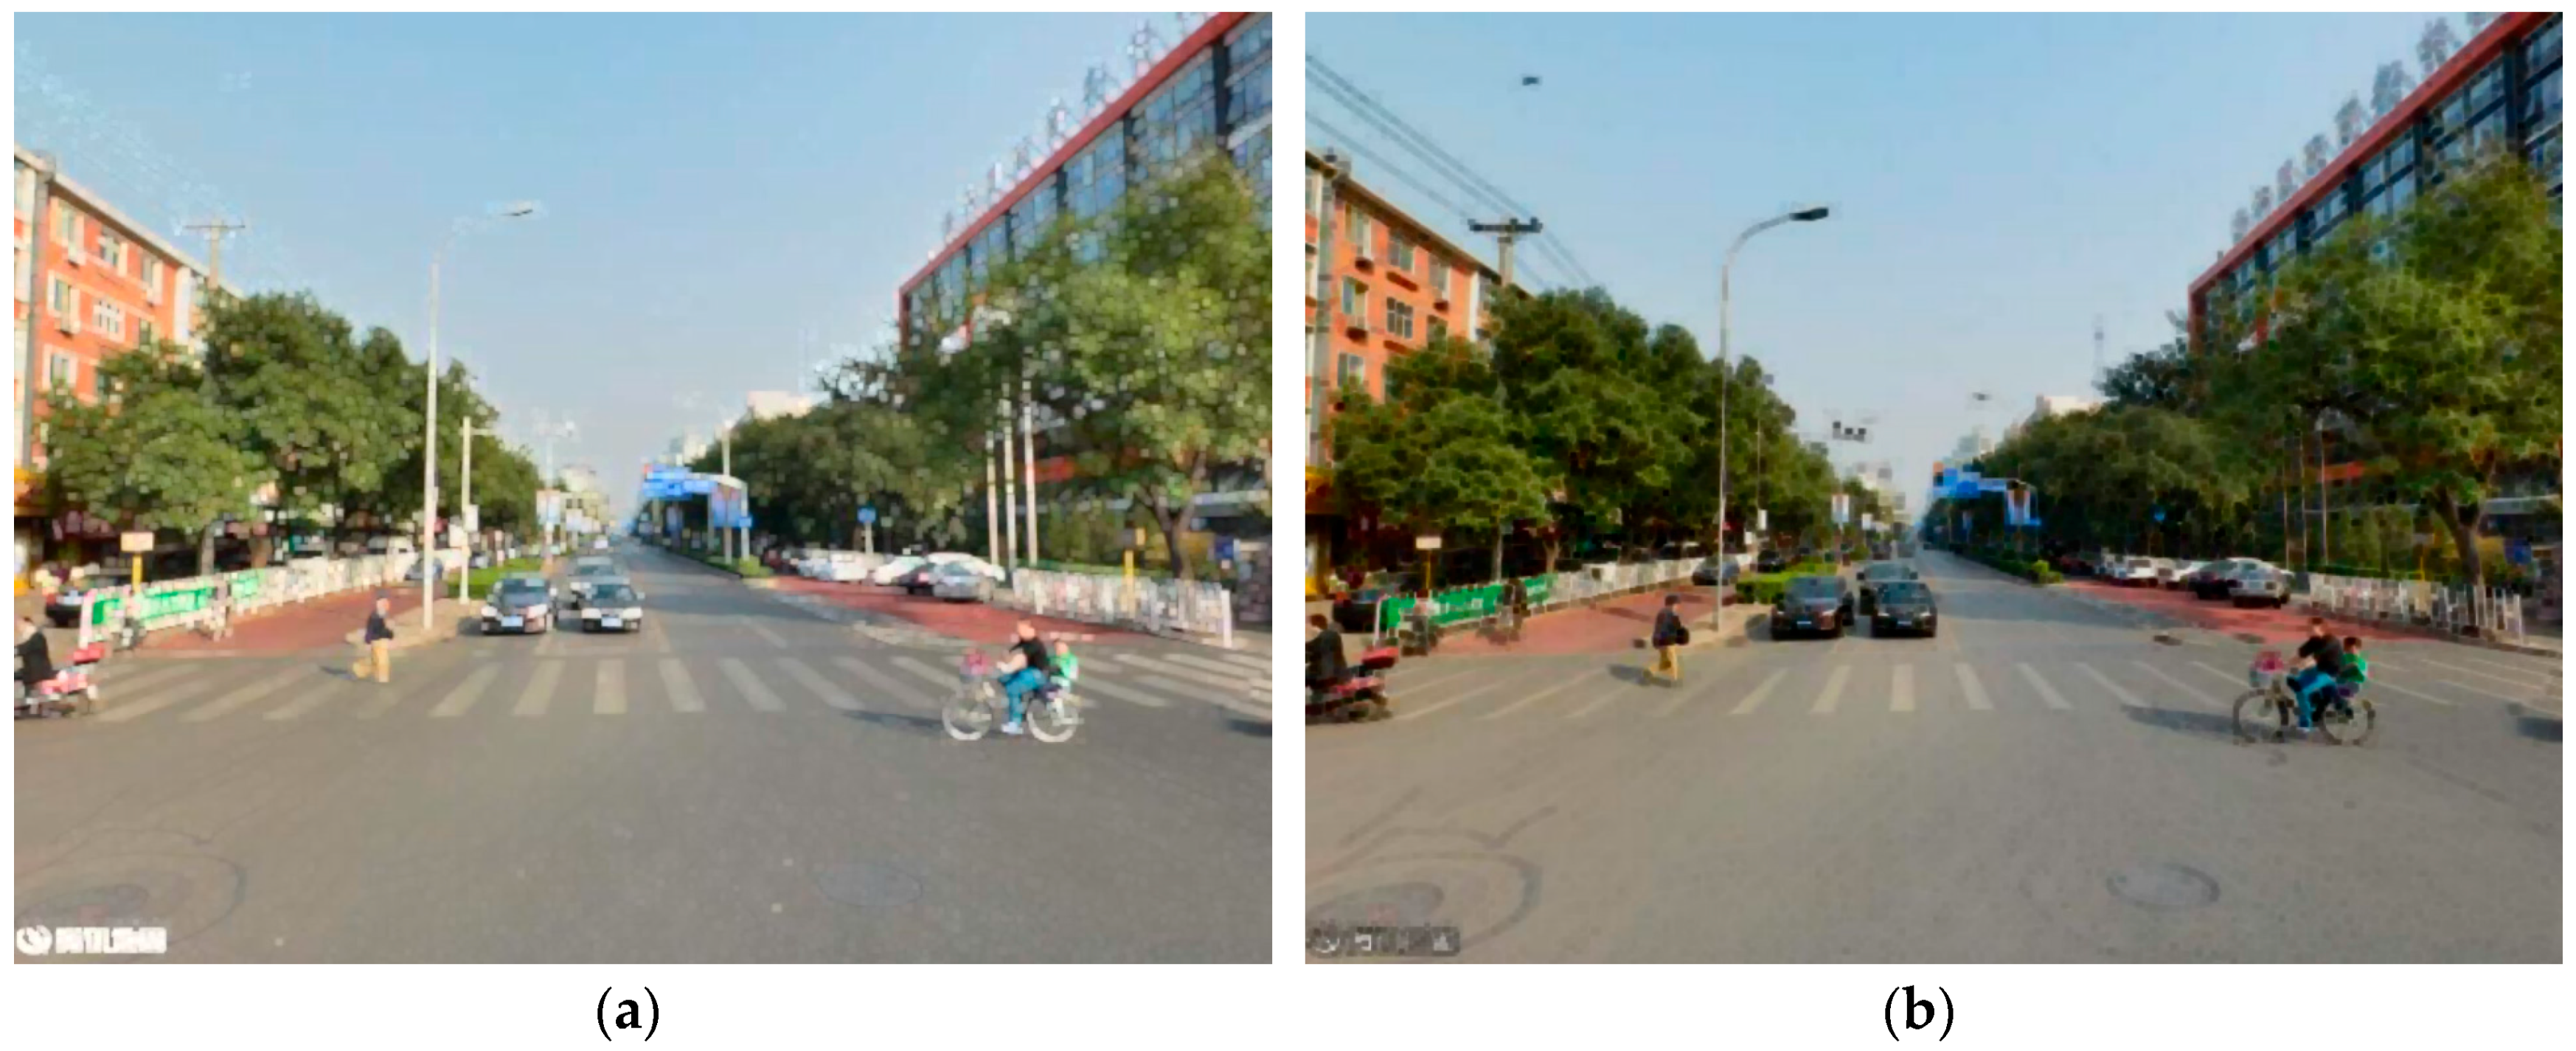
Intersection 1 is still chosen as the reference, and the adjacent intersection of Financial Street and Wudinghou Street (Intersection 4) as the comparison, as shown in Figure 9. The former has the wider perspective, blue sky and better greening, which makes the pedestrians feel comfortable in visual experience, so its image perception indicator is high. The latter intersection has a narrow perspective due to the high building on both sides and the greening is worse, so its image perception indicator is low.
4.4.4. Comprehensive Sustainability Indicator
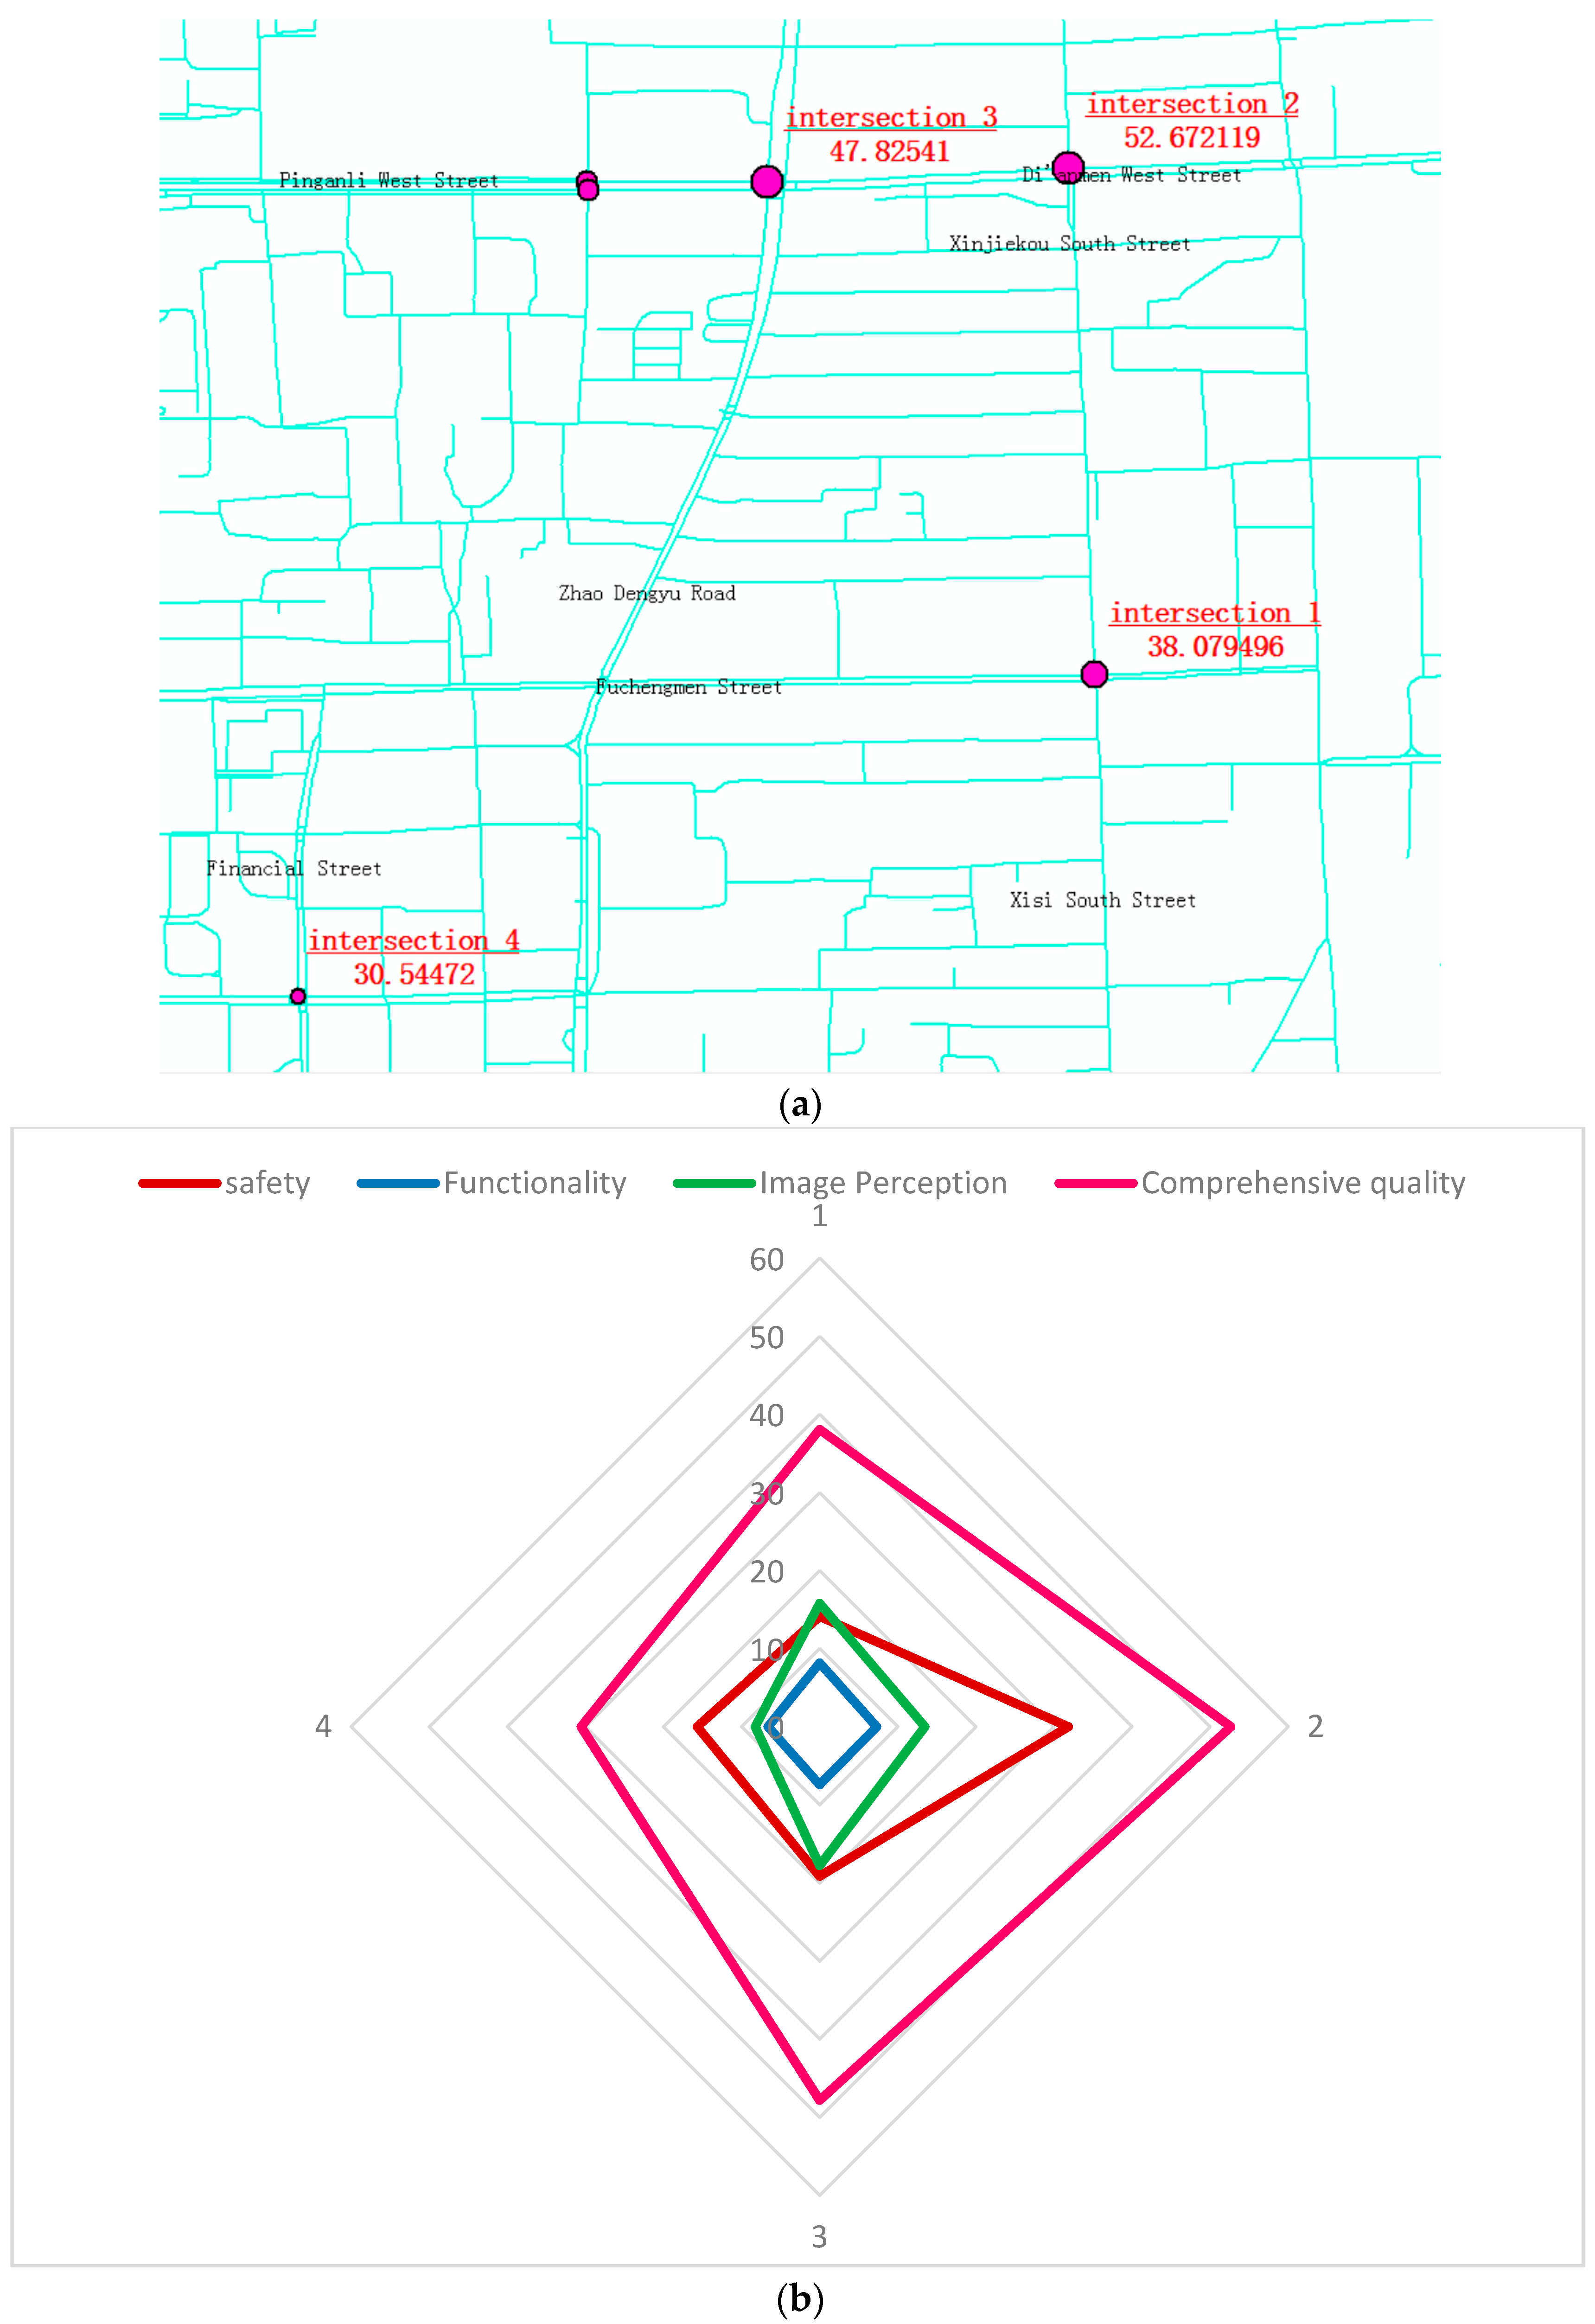
The above four intersections have their own advantages and disadvantages. The calculation results of multi-level information entropy method are shown in Figure 10. Sustainability is a result of combined factors. Intersection 2, which has a better average performance in safety, functionality, and image perception, has the highest comprehensive sustainability indicator, followed by Intersection 3.
5. Discussion and Conclusions
From the perspective of the demand and subjective perception of users, an assessment indicator system of the sustainability of urban plane intersection is established in this paper, covering three aspects: safety, functionality, and image perception. The techniques of image recognition, GIS spatial data analysis, web crawling, etc. are used to obtain the value of the assessment indicators, and the multi-level information entropy method is used to determine the weight of the assessment indicator. There is a notable difference between the results of this research and the current profession standards related to the design of urban intersections in China. According to “Code for design of urban road engineering (CJJ 37-2012)” [41], the service level of signalized intersections is divided into four classes, for which the three indicators concerned are the delay, traffic intensity, and queue length. All three indicators are selected from the perspective of motor vehicles, without considering pedestrians and non-motor vehicles. In the “Specification for design of intersections on urban roads (CJJ 152-2010)” [42], the indicators such as boundary fence, exclusive lanes for non-motor vehicles, smallest crossing angle, average spacing, average road width, and bus station accessibility are considered, while the Image Perception and all of its secondary indicators are not taken into account. In the empirical study however, Image Perception, as a key factor affecting the user’s experience, accounts for 29.45% of the total weight. In addition, the two codes do not consider the service diversity and colored bicycle lanes, which in the empirical study are more heavily weighted and might directly affect the experience of non-motor users. Furthermore, compared with past research, the perspective in this paper is switched creatively from urban transport planners and providers to users; the connotation of the indicators also extends to the user’s activities and subjective feelings. The assessment indicator system proposed in the paper provides a decision-making reference for “humanistic” and sustainable urban transportation planning and management. The rapid automated assessment method and technology based on big data, which enables large-scaled assessment with little cost, can be applied in other research that needs data fusion and mining. In addition, the assessment results provide travelers with personalized route recommendations, such as the safest route, the most beautiful route, etc.
Because considering all indicators and collecting all data are still challenging with the methods and system currently available, there is a need for further research to refine the methods and guarantee feasible computational performance. First, the green looking ratio does not fully reflect the greening of an intersection, as there may be buildings or cars that are green in the street view pictures. Second, interference factors such as weather and haze were not taken into account in the image recognition. Further research should be conducted considering these two limitations.
Acknowledgments
This research was supported by the project of “Research of Transportation Strategy for Powerful Nation” (2017ZD07), the major consulting project of the Chinese Academy of Engineering. We particularly thank Tencent Corporation for providing APIs to get access to street view pictures and real-time traffic state data.
Author Contributions
Zhang Yuhuan designed the research and algorithm, established the indicator system, completed the image segmentation and case study, created the tables and figures, and finished the writing of the paper; Luo Shengxi crawled street view pictures and calculated the congestion degree; Lu Huapu, Sun Zhiyuan, and Qu Wencong contributed valuable opinions during the manuscript writing; Sun Zhiyuan and Qu Wencong also modified the manuscript formats. All authors read and approved the final manuscript.
Conflicts of Interest
The authors declare no conflict of interest.
References
- US Department of Transportation. Available online: https://safety.fhwa.dot.gov/intersection/conventional/signalized/ (accessed on 23 June 2017).
- Pan, F.; Lu, J.; Xiang, Q. Level of safety service for highway unsignalized intersections. J. Southeast Univ. 2008, 3, 298–303. [Google Scholar]
- Sun, J.; Zhou, S.E.; Li, K.; Ni, Y. Evaluation of safety factors at Chinese intersections. Proc. Inst. Civ. Eng. Transp. 2012, 165, 195–204. [Google Scholar] [CrossRef]
- Vedagiri, P.; Killi, D.V. Traffic Safety Evaluation of Uncontrolled Intersections Using Surrogate Safety Measures under Mixed Traffic Conditions. Transp. Res. Rec. 2015, 2512, 81–89. [Google Scholar] [CrossRef]
- Wood, J.; Donnell, E.T. Safety evaluation of continuous green T intersections: A propensity scores-genetic matching-potential outcomes approach. Accid. Anal. Prev. 2016, 93, 1–13. [Google Scholar] [CrossRef] [PubMed]
- Transportation Research Board. Highway Capacity Manual; National Research Council: Washington, DC, USA, 2000. [Google Scholar]
- Wang, W.; Guo, X.C. Transportation Engineering; Southeast University Press: Nanjing, China, 2000. [Google Scholar]
- Ewadh, H.A.; Neham, S.S. Conflict to study safety at four leg-signalized intersections. Proc. Inst. Civ. Eng. Transp. 2011, 4, 221–230. [Google Scholar]
- Chen, H.Y.; Fabregas, A.; Lin, P.S. Landscaping of highway medians and roadway safety at unsignalized intersections. Accid. Anal. Prev. 2016, 90, 63–72. [Google Scholar] [CrossRef] [PubMed]
- Jiang, X.; Zhang, G.; Bai, W.; Fan, W. Safety evaluation of signalized intersections with left-turn waiting area in China. Accid. Anal. Prev. 2016, 95, 461–469. [Google Scholar] [CrossRef] [PubMed]
- Himes, S.; Gross, F.; Eccles, K.; Presaud, B. Multistate Safety Evaluation of Intersection Conflict Warning Systems. Transp. Res. Rec. 2016, 2583, 8–16. [Google Scholar] [CrossRef]
- Schorr, J.P.; Hamdar, S.H. Safety propensity index for signalized and unsignalized intersections: Exploration and assessment. Accid. Anal. Prev. 2014, 71, 93–105. [Google Scholar] [CrossRef] [PubMed]
- Cheng, W.; Yuan, M.R.; Zhao, J. Study on Extenics Evaluation of the Safety for Urban Road Intersections. Adv. Mater. Res. 2013, 779–780, 724–730. [Google Scholar] [CrossRef]
- Montella, A.; Aria, M.; D’Ambrosio, A.; Galante, F.; Mauriello, F.; Pernetti, M. Simulator evaluation of drivers’ speed, deceleration and lateral position at rural intersections in relation to different perceptual cues. Accid. Anal. Prev. 2011, 43, 2072–2084. [Google Scholar] [CrossRef] [PubMed]
- Zhu, S.; Lu, J.; Xiang, Q.; Yan, L. Intersection Safety Evaluation Method Based on Bayesian Network. In Proceedings of the International Conference On Measuring Technology and Mechatronics Automation, Zhangjiajie, China, 11–12 April 2009; Volume 3, pp. 234–237. [Google Scholar]
- Tang, K.; Nakamura, H. Safety Evaluation for Intergreen Intervals at Signalized Intersections Based on Probabilistic Method. Transp. Res. Rec. 2009, 2128, 226–235. [Google Scholar] [CrossRef]
- Rui, L.; Zhipeng, G. Intersection safety evaluation model based on traffic conflict and accident data. Adv. Mater. Res. 2015, 1065–1069, 3320–3324. [Google Scholar]
- Bie, Y.; Liu, Z. Evaluation of a Signalized Intersection with Hook Turns under Traffic Actuated Control Circumstance. J. Transp. Eng. 2015. [Google Scholar] [CrossRef]
- Cafuta, M.R. Open Space Evaluation Methodology and Three Dimensional Evaluation Model as a Base for Sustainable Development Tracking. Sustainability 2015, 7, 13690–13712. [Google Scholar] [CrossRef]
- Eizenberg, E.; Jabareen, Y. Social Sustainability: A New Conceptual Framework. Sustainability 2017, 9, 68. [Google Scholar] [CrossRef]
- Tang, H.; Lee, Y. The Making of Sustainable Urban Development: A Synthesis Framework. Sustainability 2016, 8, 492. [Google Scholar] [CrossRef]
- Mackenbach, J.D.; Randal, E.; Zhao, P.; Howden-Chapman, P. The Influence of Urban Land-Use and Public Transport Facilities on Active Commuting in Wellington, New Zealand: Active Transport Forecasting Using the WILUTE Model. Sustainability 2016, 8, 242. [Google Scholar] [CrossRef]
- Foltete, J.; Piombini, A. Urban layout, landscape features and pedestrian usage. Landscape Urban Plan. 2007, 81, 225–234. [Google Scholar] [CrossRef]
- Bell, P.A.; Greene, T.C.; Fisher, J.D.; Baum, A. Environment Psychology; China Renmin University Press: Beijing, China, 2009. [Google Scholar]
- Kobayashi, S. Colorist: Research on Color Psychology; People’s Fine Arts Publishing House: Beijing, China, 2006. [Google Scholar]
- Basic Plan for “Green” Kyoto Protocol (May 2011). Available online: http://www.city.kyoto.lg.jp/kensetu/cmsfiles/contents/0000102/102008/planhonpen.pdf (accessed on 23 June 2017).
- Gray, R.M. Entropy and Information Theory; Science Press: Beijing, China, 2012. [Google Scholar]
- Cavallaro, F.; Zavadskas, E.K.; Raslanas, S. Evaluation of Combined Heat and Power (CHP) Systems Using Fuzzy Shannon Entropy and Fuzzy TOPSIS. Sustainability 2016, 8, 556. [Google Scholar] [CrossRef]
- Ding, L.; Shao, Z.; Zhang, H.; Xu, C.; Wu, D. A Comprehensive Evaluation of Urban Sustainable Development in China Based on the TOPSIS-Entropy Method. Sustainability 2016, 8, 746. [Google Scholar] [CrossRef]
- Liu, X.; Wang, P.; Guan, L.; Lu, H.; Zhang, C. GIS Spatial Analysis, 3rd ed.; Science Press: Beijing, China, 2017. [Google Scholar]
- Tencent Map. Available online: http://map.qq.com/ (accessed on 23 June 2017).
- Smith, A.R. Color Gamut Transform Pairs. ACM SIGGRAPH Comput. Graph. 1978, 12, 12–19. [Google Scholar] [CrossRef]
- Canny, J. A computational approach to edge detection. IEEE Trans. Pattern Anal. Machine Intell. 1986, 8, 679–698. [Google Scholar] [CrossRef]
- Song, Q.; Lin, G.Y.; Ma, J.Q. An Edge-Detection Method Based on Adaptive Canny Algorithm and Iterative Segmentation Threshold. In Proceedings of the 2016 2nd International Conference on Control Science and Systems Engineering (ICCSSE), Singapore, 27–29 July 2016; pp. 64–67. [Google Scholar]
- Gonzalez, R.C.; Woods, R.E. Digital Image Processing, 3rd ed.; Pearson: Upper Saddle River, NJ, USA, 2013; pp. 404–411. [Google Scholar]
- Zheng, S.Q.; Xu, Y.; Wu, J.; Yu, D.; Xu, J.; Zhang, X.; Zhang, B. Jobs-Housing Balance: Measurement, Patterns, and Social Costs—A Case Study in Beijing; Working Paper #53; Beijing City Lab: Beijing, China, 2014. [Google Scholar]
- Fardzanela, S.; Kami, H.B. The application of traffic conflict technique as a road safety evaluation method: A case study of Hasselt intersection. Appl. Mech. Mater. 2016, 845, 394–403. [Google Scholar]
- Yang, P.K.; Wu, B. Traffic Management and Control; China Communication Press: Beijing, China, 2003. [Google Scholar]
- Costescu, D.; Raicu, S.; Rosca, M.; Burciu, S.; Rusca, F. Using Intersection Conflict Indicator in Urban Traffic Risk Evaluation; Elsevier: Amsterdam, The Netherlands, 2016; Volume 22, pp. 319–326. [Google Scholar]
- Pan, F.Q.; Zhang, L.X.; Lu, J.; Wang, F.Y. Calculation Models of Conflict Points for Motorized Vehicles at Unsignalized Intersections. J. Shanghai Jiaotong Univ. 2013, 2, 259–263. [Google Scholar]
- Code for Design of Urban Road Engineering (CJJ37-2012); Ministry of Housing and Urban-Rural Construction of the People’s Republic of China: Beijing, China, 2012.
- Specification for Design of Intersections on Urban Roads (CJJ152-2010); Ministry of Housing and Urban-Rural Construction of the People’s Republic of China: Beijing, China, 2010.
Figure 1.
Illustration of the area partition method. (a) Locating the intersection; (b) generating a circle centered at the intersection; (c) truncating the roads connected to the intersection; (d) dividing the circle into several sectors.
Figure 1.
Illustration of the area partition method. (a) Locating the intersection; (b) generating a circle centered at the intersection; (c) truncating the roads connected to the intersection; (d) dividing the circle into several sectors.

Figure 2.
An example of image segmentation. (a) The original street view picture; (b) grey degree picture; (c) processed by Canny operator; (d) detailed view of (c); (e) processed by improved Canny operator; (f) detailed view of (e); (g) processed by single-scale morphological method; (h) detailed view of (g); (i) processed by ensemble morphology method; (j) detailed view of (i).
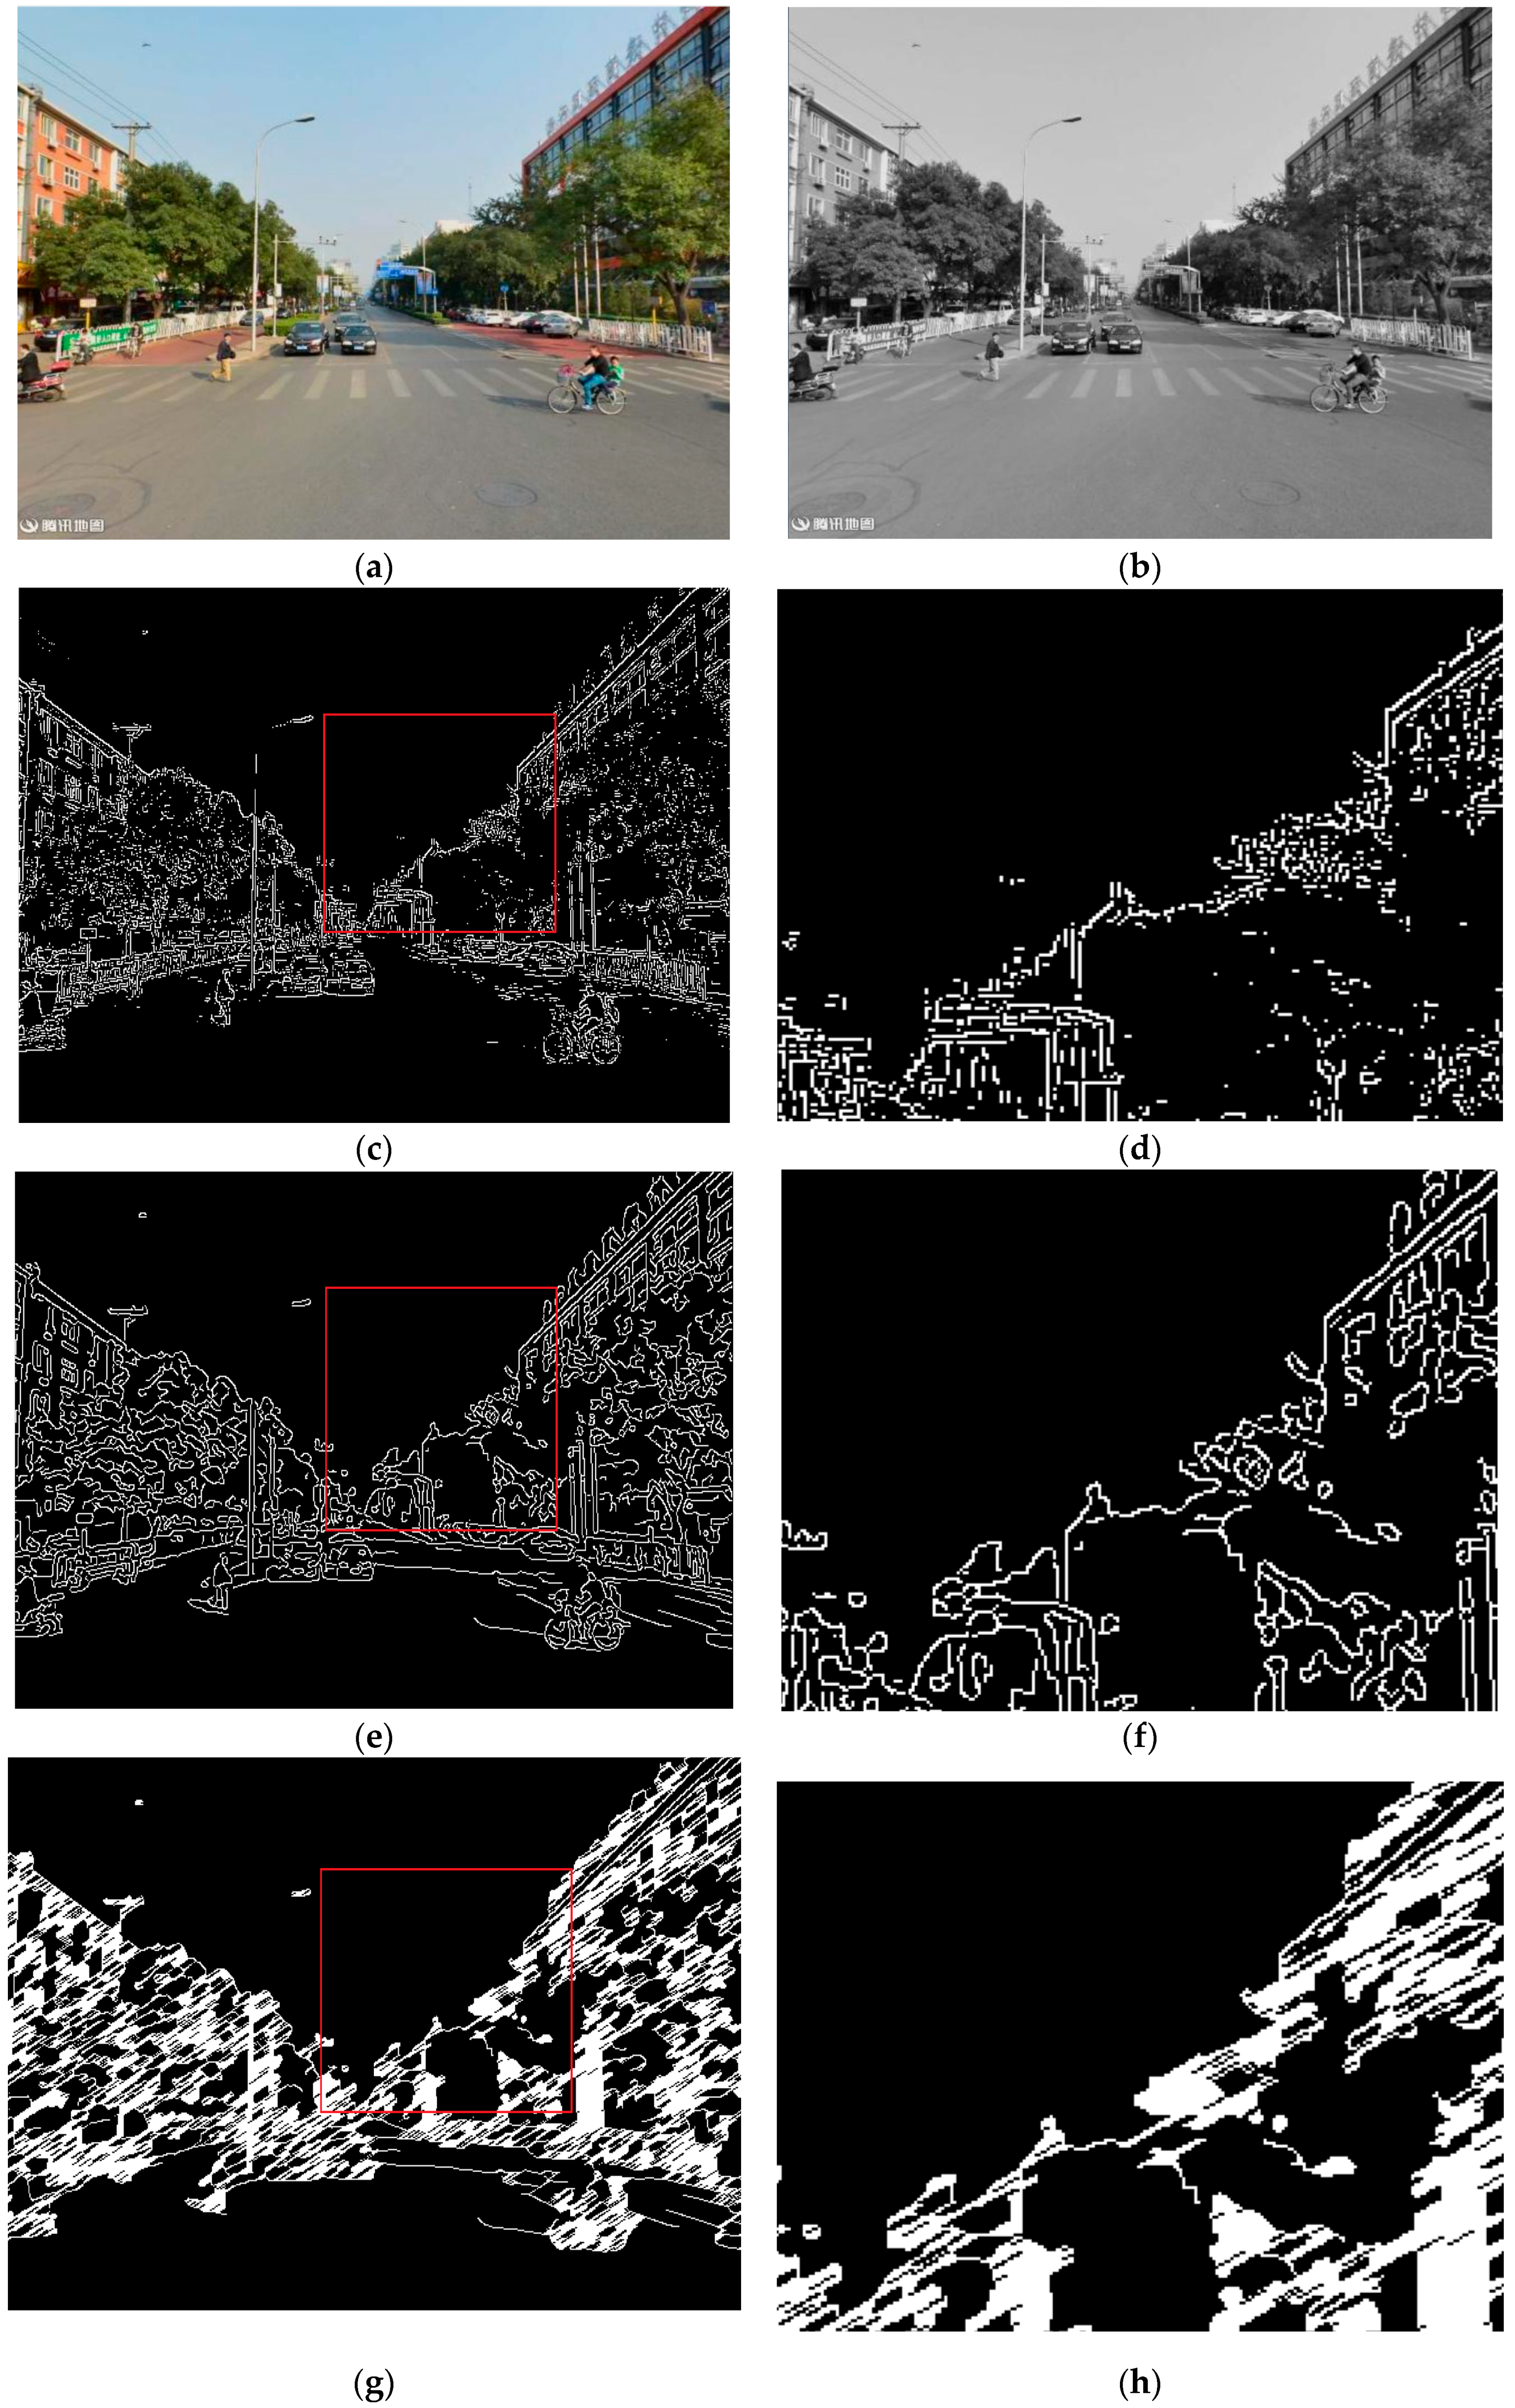
Figure 3.
Effect of expanding and eroding. (a) Expanding (f⊕g); (b) eroding (fΘg).

Figure 4.
Illustration of the quadrants of the intersection.
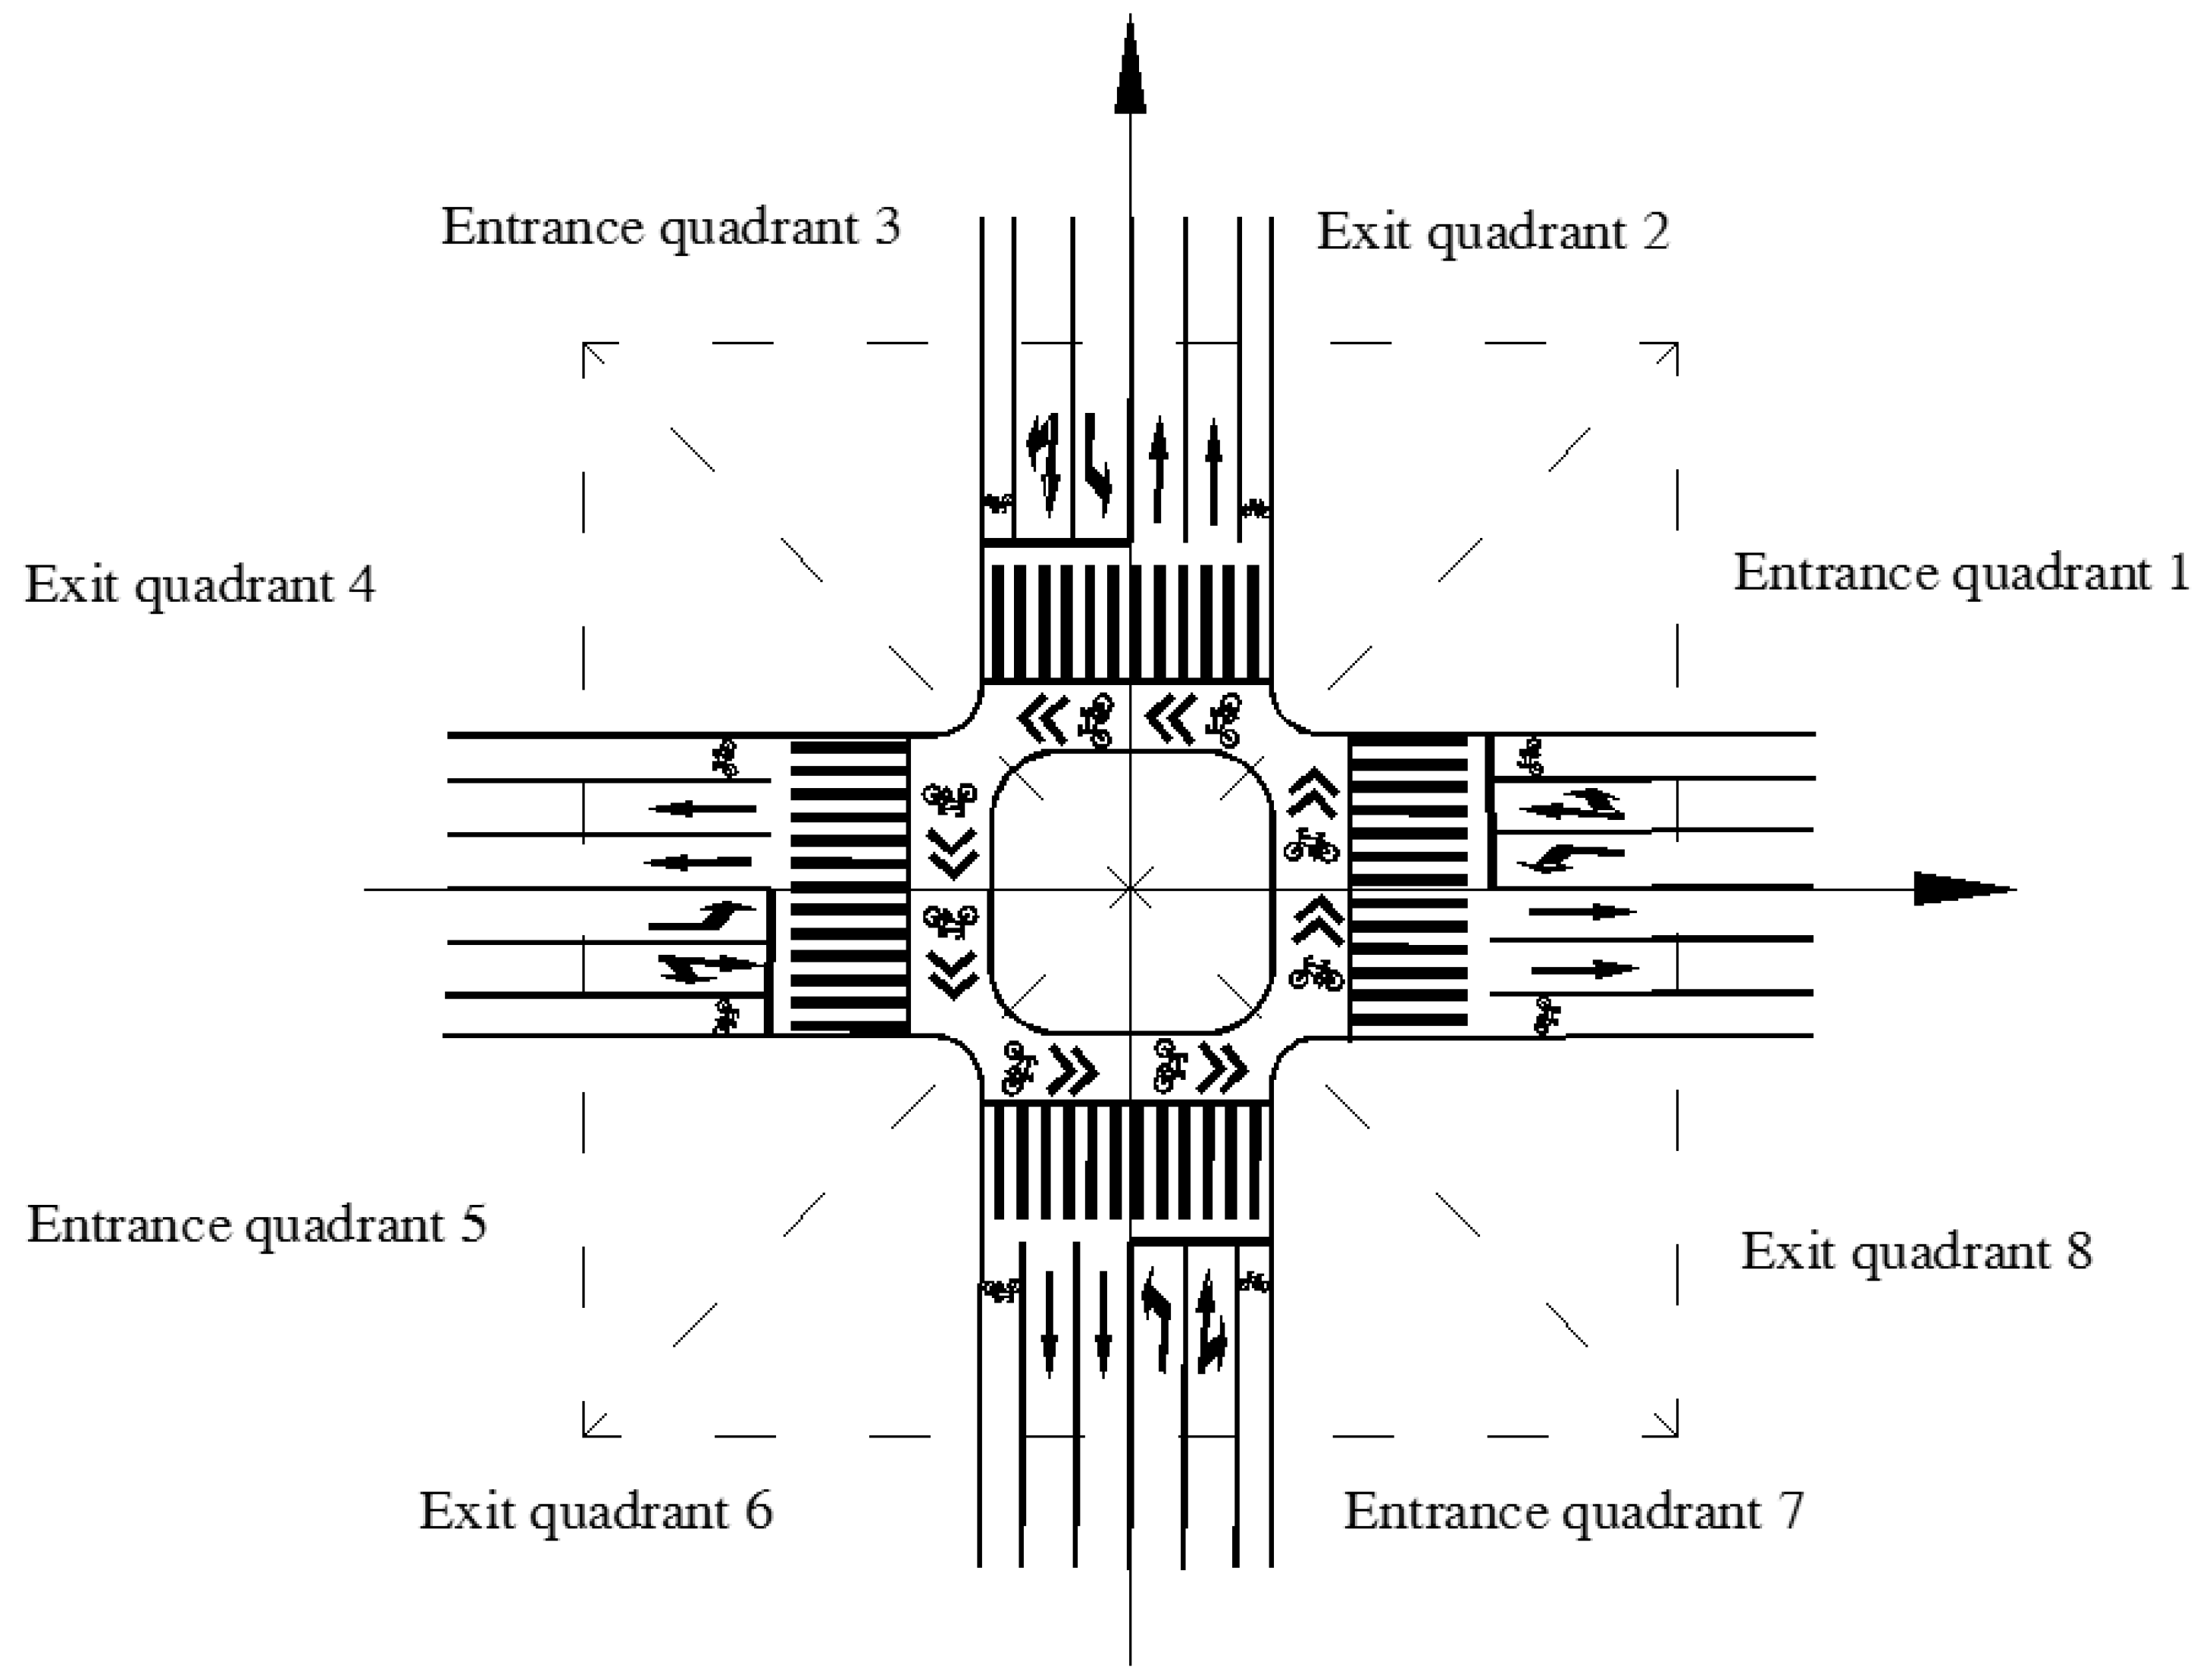
Figure 5.
Weight graph of the indicator system.

Figure 6.
Illustration of three sustainability indicators of the intersections. (a) Safety indicator; (b) functionality indicator; (c) image perception indicator; (d) comprehensive sustainability indicator.
Figure 6.
Illustration of three sustainability indicators of the intersections. (a) Safety indicator; (b) functionality indicator; (c) image perception indicator; (d) comprehensive sustainability indicator.

Figure 7.
Comparison of safety indicator. (a) High safety indicator—intersection of Di’anmen West Street and Xinjiekou South Street; (b) low safety indicator—intersection of Xisi South Street and Fuchengmen Street; (c) safety indicator value.
Figure 7.
Comparison of safety indicator. (a) High safety indicator—intersection of Di’anmen West Street and Xinjiekou South Street; (b) low safety indicator—intersection of Xisi South Street and Fuchengmen Street; (c) safety indicator value.
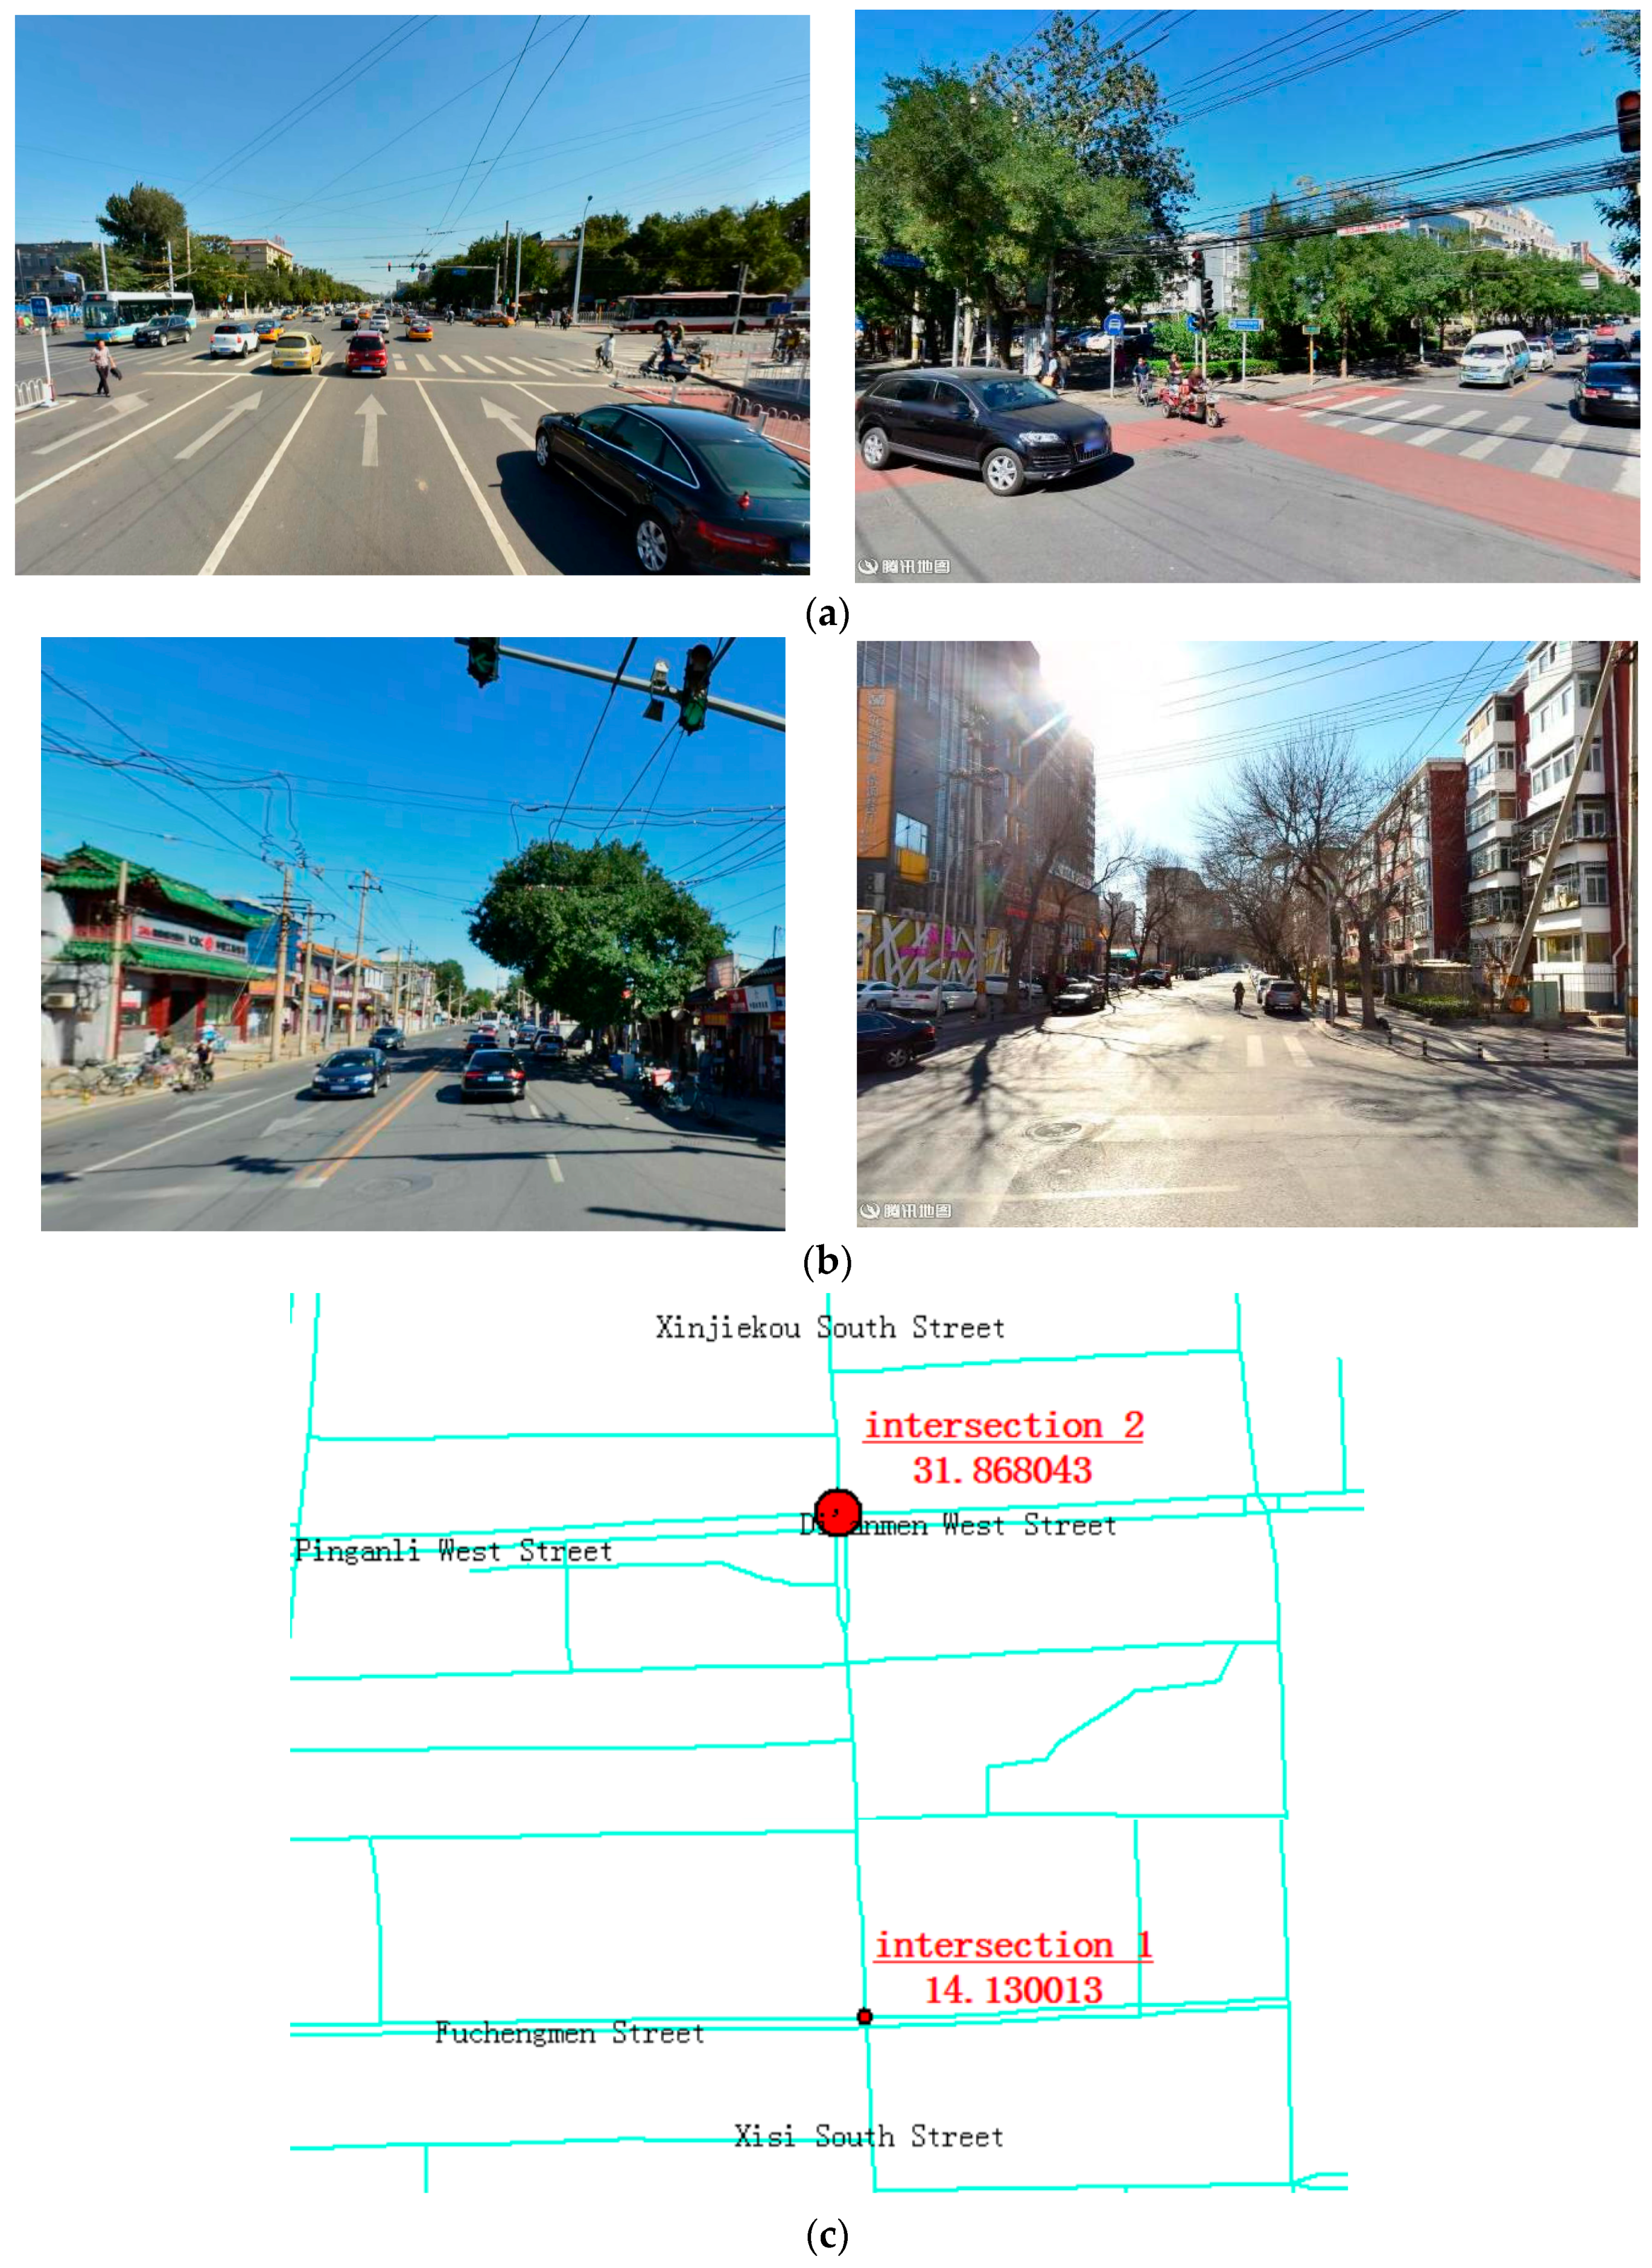
Figure 8.
Comparison of the functionality indicator. (a) High functionality indicator—the intersection of Xisi South Street and Xisi East Street; (b) low functionality indicator—the intersection of Zhao Dengyu Road and Pinganli West Street; (c) functionality indicator (different color triangles represent different tenants).
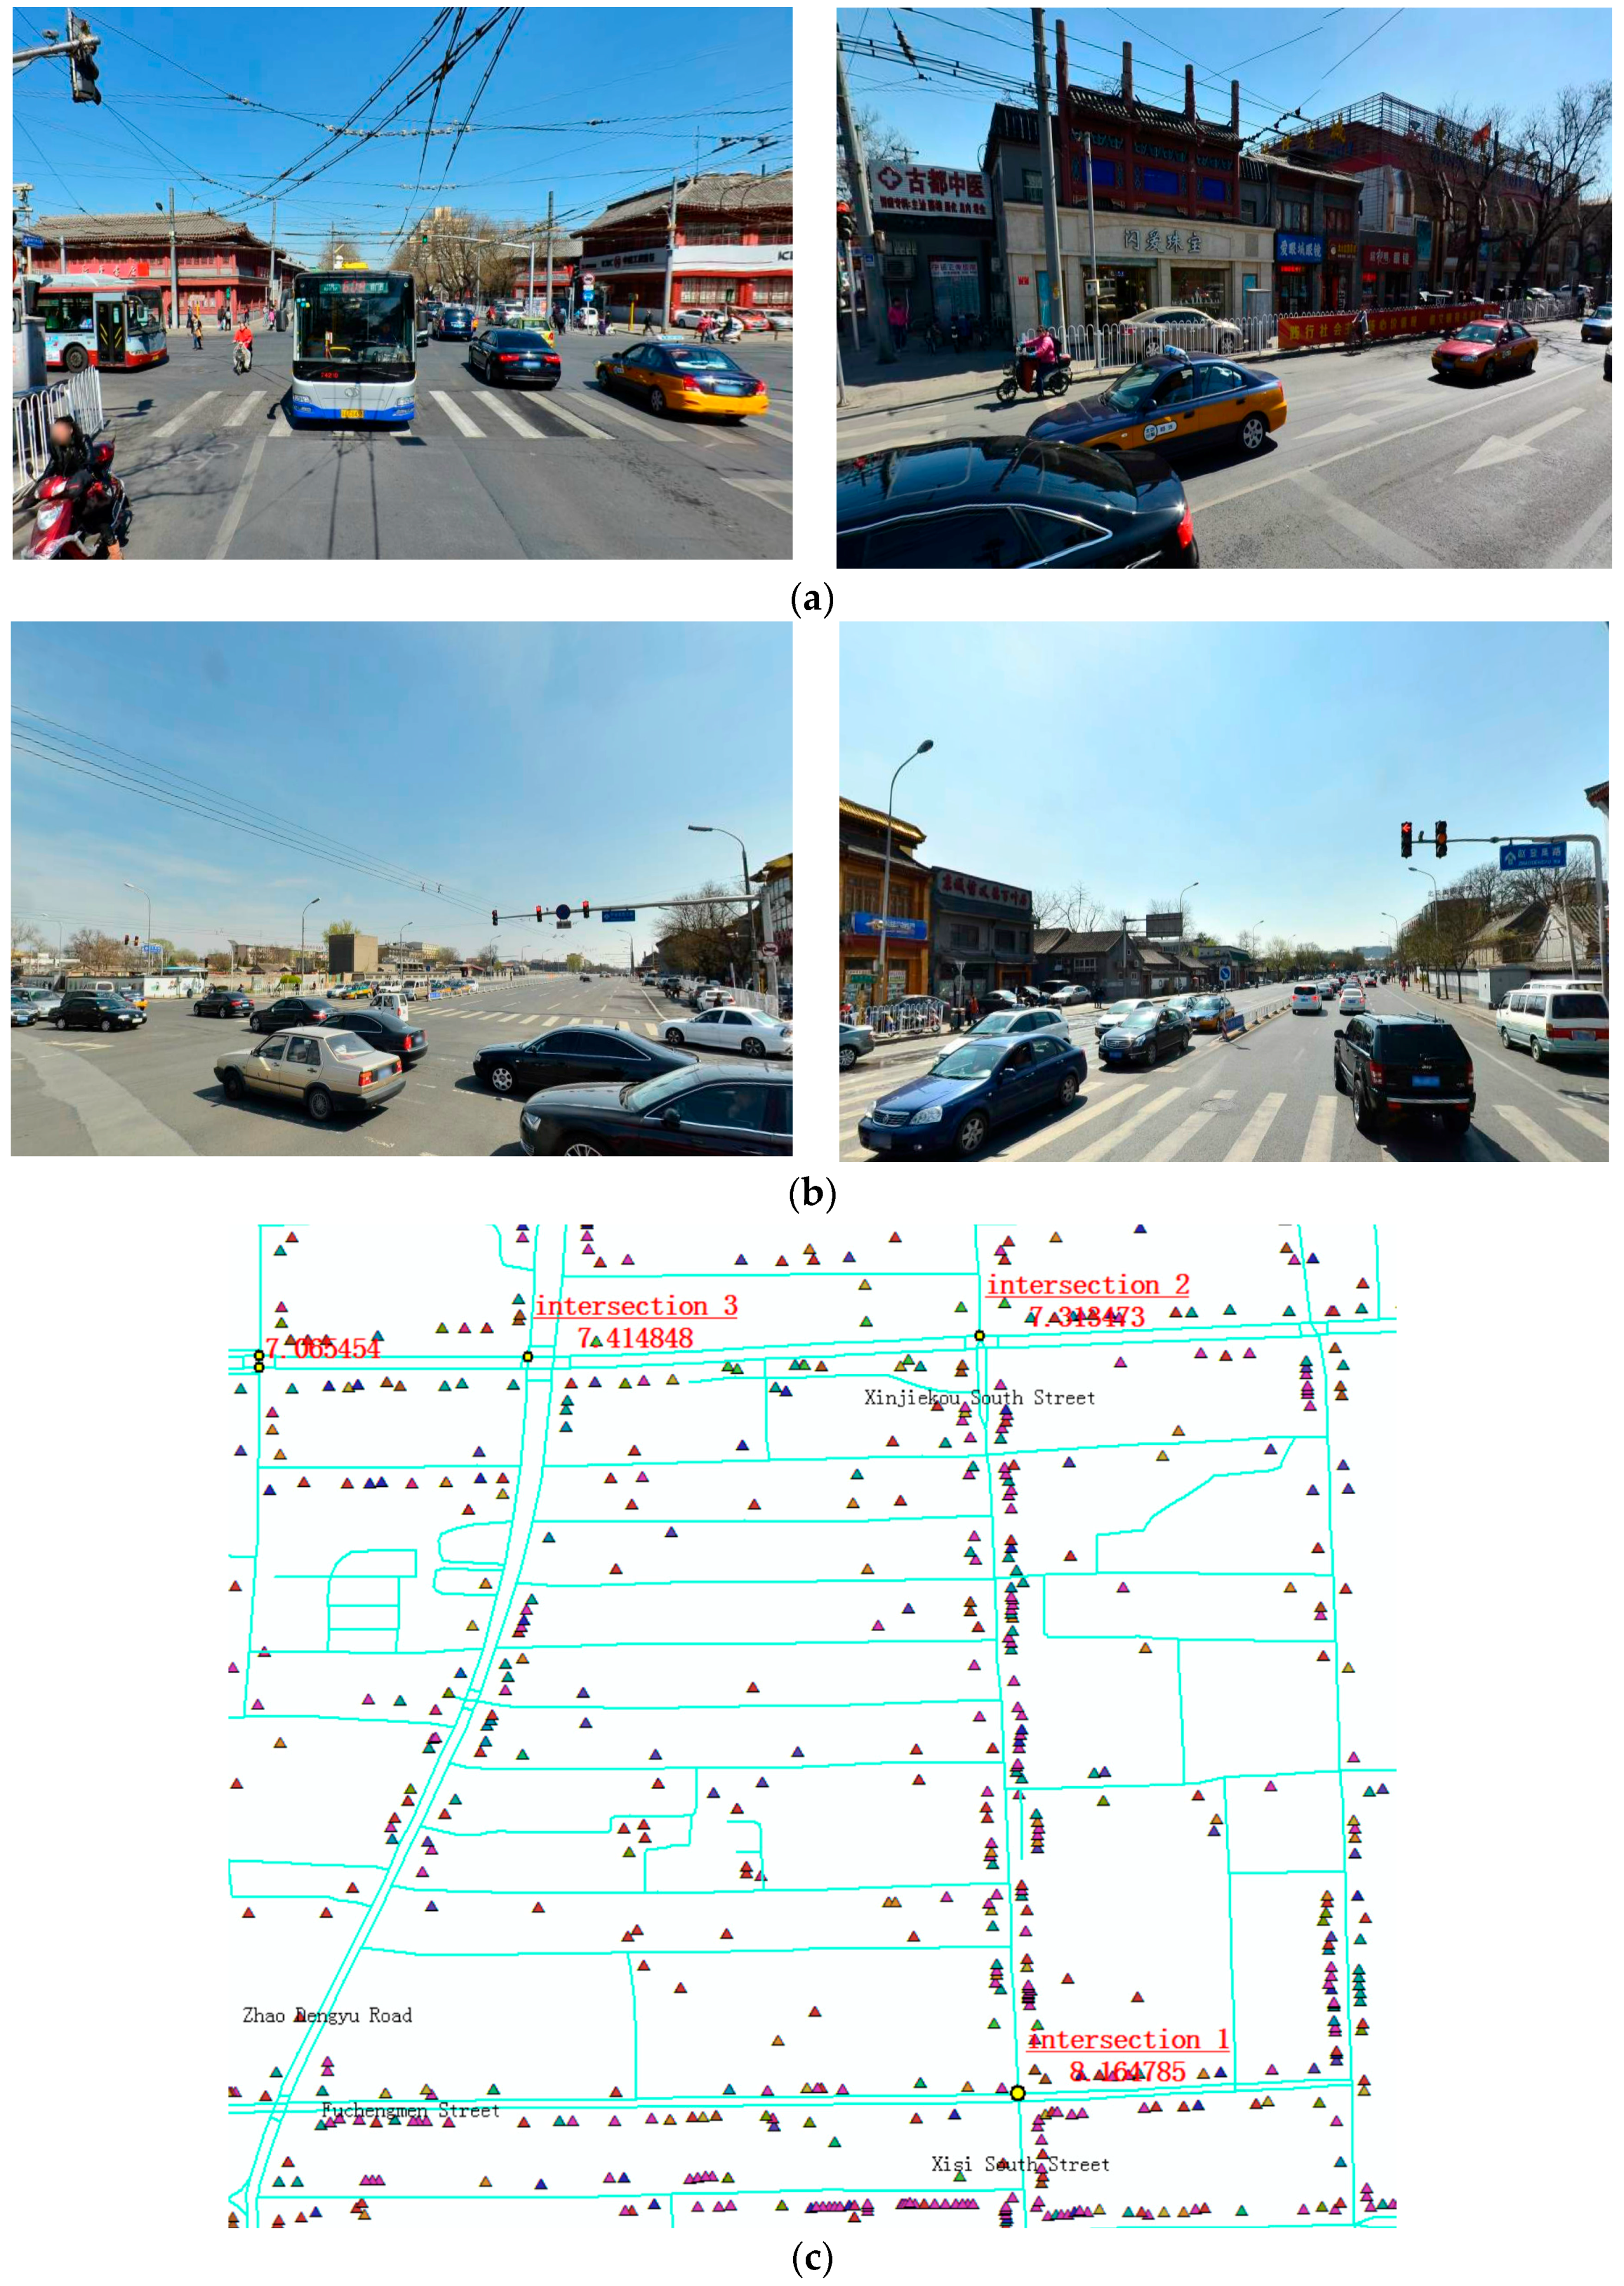
Figure 9.
Comparison of the image perception indicator. (a) High image perception indicator—the intersection of Xisi South Street and Xisi East Street; (b) low image perception indicator—the intersection of Financial Street and Wudinghou Street; (c) image perception indicator.
Figure 9.
Comparison of the image perception indicator. (a) High image perception indicator—the intersection of Xisi South Street and Xisi East Street; (b) low image perception indicator—the intersection of Financial Street and Wudinghou Street; (c) image perception indicator.

Figure 10.
Comparison of comprehensive sustainability indicator. (a) Comprehensive sustainability indicator; (b) illustration of all sustainability indicators.
Figure 10.
Comparison of comprehensive sustainability indicator. (a) Comprehensive sustainability indicator; (b) illustration of all sustainability indicators.


Table 1.
Indicator system of sustainability assessment of urban intersections.
| Primary Indicator | Secondary Indicator (Abbr.) | Explanation of Indicators | Data Source |
|---|---|---|---|
| Safety | Conflict Point (CP) | The crossing point, merging point, and diverging point at an intersection | Conflict point model |
| Smallest Crossing Angle (SCA) | The smallest crossing angle between two crossed roads | Derived from the GIS data | |
| Exclusive Lane (EL) | If there is an exclusive lane or not | Traffic engineering database | |
| Boundary fence (BF) | If there is a barrier section between sidewalk, non-motorized vehicle lane, and motorized vehicle lane or not | Traffic engineering database | |
| Colored Bicycle Lane (CBL) | If the bicycle lane is colored or not | Traffic engineering database | |
| Functionality | Congestion Degree (CD) | The degree of congestion in peak hours | Tencent open platform |
| Node Degree (ND) | The number of roads connected to an intersection | GIS database | |
| Average Spacing (AS) | The average spacing from the neighboring intersection | GIS database | |
| Average Road Width (ARW) | The average width of roads connected to an intersection | GIS database | |
| Accessibility of Metro (AM) | If there is a metro station within 200 m | GIS database | |
| Accessibility of Bus (AB) | The number of bus lines (with stops) within 100 m | GIS database | |
| Diversity of Service (DS) | The number of kinds of POI within 200 m | GIS database | |
| Image perception | Opening Degree of Sky (ODS) | The ratio of sky area to the total area of the picture | Street view image processing |
| Brightness (BS) | Average value of brightness | Street view image processing | |
| Saturation (ST) | Average value of saturation | Street view image processing | |
| Continuity (CN) | The difference between areas of different brightness | Street view image processing | |
| Green Looking Ratio (GLR) | The ratio of green area to the total area of the picture | Street view image processing |
Table 2.
Calculation results of the weight of each indicator.
| Primary Indicator with Code and Weight | Secondary Indicator (Abbr.) | Weight of the Secondary Indicator |
|---|---|---|
| Safety 55.17 | Conflict Point (CP) | 33.45 |
| Smallest Crossing Angle (SCA) | 2.39 | |
| Exclusive Lane (EL) | 9.75 | |
| Boundary fence (BF) | 2.31 | |
| Colored Bicycle Lane (CBL) | 7.27 | |
| Functionality 15.57 | Congestion Degree (CD) | 1.53 |
| Node Degree (ND) | 0.36 | |
| Average Spacing (AS) | 7.00 | |
| Average Road Width (ARW) | 0.93 | |
| Accessibility of Metro (AM) | 2.33 | |
| Accessibility of Bus (AB) | 0.62 | |
| Diversity of Service (DS) | 2.80 | |
| Image Perception 29.45 | Opening Degree of Sky (ODS) | 9.36 |
| Brightness (BS) | 0.63 | |
| Saturation (ST) | 2.76 | |
| Continuity (CN) | 1.96 | |
| Green Looking Ratio (GLR) | 14.74 |
Note: the weight values were rounded to the second decimal point.
© 2017 by the authors. Licensee MDPI, Basel, Switzerland. This article is an open access article distributed under the terms and conditions of the Creative Commons Attribution (CC BY) license (http://creativecommons.org/licenses/by/4.0/).
Share and Cite
MDPI and ACS Style
Zhang, Y.; Lu, H.; Luo, S.; Sun, Z.; Qu, W. Human-Scale Sustainability Assessment of Urban Intersections Based upon Multi-Source Big Data. Sustainability 2017, 9, 1148. https://doi.org/10.3390/su9071148
AMA Style
Zhang Y, Lu H, Luo S, Sun Z, Qu W. Human-Scale Sustainability Assessment of Urban Intersections Based upon Multi-Source Big Data. Sustainability. 2017; 9(7):1148. https://doi.org/10.3390/su9071148
Chicago/Turabian StyleZhang, Yuhuan, Huapu Lu, Shengxi Luo, Zhiyuan Sun, and Wencong Qu. 2017. "Human-Scale Sustainability Assessment of Urban Intersections Based upon Multi-Source Big Data" Sustainability 9, no. 7: 1148. https://doi.org/10.3390/su9071148
Note that from the first issue of 2016, this journal uses article numbers instead of page numbers. See further details here.